current status of soils and responsiveness of wheat to ... · current status of soils and...
TRANSCRIPT

Project Report No. 518 August 2013
Current status of soils and responsiveness of wheat to micronutrient applications

August 2013
Project Report No. 518
Current status of soils and responsiveness of wheat to micronutrient
applications
S P McGrath1, R Stobart2, M M Blake-Kalff3 and F J Zhao1
1Rothamsted Research, Harpenden, Hertfordshire AL5 2JQ
2NIAB TAG, Huntingdon Road, Cambridge CB3 0LE 3Hill Court Farm Research, Corse Lawn, Gloucestershire GL19 4PW
This is the final report of a 42 month project (RD-2008-3508) which started in October 2009. The work was funded by a contract for £169,306 from HGCA, and Hill Court Farm Research. While the Agriculture and Horticulture Development Board, operating through its HGCA division, seeks to ensure that the information
contained within this document is accurate at the time of printing, no warranty is given in respect thereof and, to the maximum extent
permitted by law, the Agriculture and Horticulture Development Board accepts no liability for loss, damage or injury howsoever caused
(including that caused by negligence) or suffered directly or indirectly in relation to information and opinions contained in or omitted from
this document.
Reference herein to trade names and proprietary products without stating that they are protected does not imply that they may be
regarded as unprotected and thus free for general use. No endorsement of named products is intended, nor is any criticism implied of
other alternative, but unnamed, products.
HGCA is the cereals and oilseeds division of the Agriculture and Horticulture Development Board.

3
CONTENTS
1. ABSTRACT ........................................................................................................................... 4
2. INTRODUCTION ................................................................................................................... 5
2.1. Objectives ................................................................................................................. 6
3. MATERIALS AND METHODS ............................................................................................... 7
3.1. Soil micronutrient survey ........................................................................................ 7
3.2. Micronutrient response trials .................................................................................. 7
3.2.1. Field Trials, experimental set up .......................................................................... 7
3.2.2. Analytical methods ............................................................................................... 8
3.3. Statistical analysis ................................................................................................... 9
4. RESULTS .............................................................................................................................. 9
4.1. Soil micronutrient survey ........................................................................................ 9
4.2. Micronutrient response trials ................................................................................ 12
4.2.1. Visual symptoms................................................................................................ 14
4.2.2. Grain yields ........................................................................................................ 14
4.2.3. Soil EDTA analyses ........................................................................................... 19
4.2.4. Leaf analyses .................................................................................................... 21
4.2.5. Grain analyses ................................................................................................... 23
5. DISCUSSION ...................................................................................................................... 28
5.1. Soil micronutrient survey ...................................................................................... 28
5.2. Micronutrient response trials ................................................................................ 29
5.3. Conclusions ............................................................................................................ 33
6. ACKNOWLEDGEMENTS .................................................................................................... 35
7. REFERENCES .................................................................................................................... 35
APPENDICES............................................................................................................................... 38

4
1. Abstract
Most micronutrient trials in the UK were performed when winter wheat yields were less than
half those achieved now. Recent publications suggest that modern high-yielding wheat
varieties have lower micronutrient concentrations in grain. It is not clear if this is due to
changes in the crop or in the micronutrients available in soils.
Over 30 years, the geometric mean total concentration of copper (Cu) in soil decreased by
less than 1 mg/kg and manganese (Mn) by nearly 40 mg/kg, but total zinc (Zn) increased by
almost 5 mg/kg. Soils were also extracted with EDTA (ethylene diamine tetraacetic acid) and
there was only a decrease of just over 1 mg/kg for Cu and Zn, which is not likely to be
biologically significant. Manganese extracted by EDTA decreased by nearly 50 mg/kg, but
for Mn this extract is not thought to be useful for indicating crop availability.
Fifteen field experiments were performed on soils likely to be deficient in micronutrients
(light, calcareous or soil high in organic matter) all sown with winter wheat variety Solstice.
Each experiment was treated at the early stem elongation stage with sprays containing Cu,
Mn or Zn at the rates recommended for severe deficiency. Only two statistically significant
yield responses were observed. These were +0.27 t/ha in the Zn spray treatment at a site on
light loamy sand at Morley (P =0.04), and +1.39 t/ha with Cu sprays on a highly organic soil
at Waterbeach (P =0.058). EDTA soil extraction gave correct prediction on responsiveness
in yield to Cu in one out of two cases where concentrations were classed as low, but only by
adopting a critical value for Cu of 1 mg/kg. Leaf analysis in spring was predictive of the one
Cu responsive site, but this appears to be less useful for Mn and Zn.
The percentages of responsive trials, although low, are in fact similar to UK recent results of
winter wheat trials, selected as those performed since 2005, for Cu (7%) and Mn (0%) but
not for Zn, where the percentage was slightly smaller (7% versus 16%). It seems unlikely
that modern high-yielding wheat is more responsive in yield to micronutrient applications
than older varieties. This may be because most UK soils contain sufficient concentrations of
available micronutrients, although there is specific soil and local variation. Although our
experiments were not specifically set up to examine the possibility of “growth dilution” of
micronutrient concentrations in grain, there was no evidence that the lowest grain
micronutrient concentrations were associated with the highest yields in our experiments.

5
2. Introduction
Micronutrients or trace elements are those nutrients required in small amounts for essential
growth processes in plants and animals. These include iron (Fe), Cu, Mn, Zn, boron (B),
molybdenum (Mo) and chlorine (Cl). Some micronutrients that are essential for animals are
not required by plants, but animals usually acquire them via consumed plant tissues.
Occurrences of deficiency are most frequently related to soil type, soil pH, soil structural
conditions and their effect on root growth, and also to crop susceptibility. Of the
micronutrients, Cu, Mn and Zn are thought to be the most limiting in wheat (Knight et al,
2012).
Low micronutrient concentrations in soil can affect wheat yields (Roques et al, 2013).
However the Fertiliser Manual (RB209, 2010) identified that much of the UK research in this
area was undertaken in the 1970’s and 1980’s (ADAS/MAFF, 1984) and as such may not be
truly relevant to modern high yielding wheat varieties. Average yields, and therefore the
micronutrient requirements of winter wheat, have increased in the last 40 years by at least
two-fold (Figure 1). Many crops are producing above average yields and 10-11 t/ha are
possible, even under slightly adverse soil conditions (see Results below). The future trend
will likely see “sustainable intensification”, which requires increasing yields (Royal Society,
2009). In fact, average yields have stagnated during the last 15-20 years (Figure 1), but we
know that yields are still well below the genetic potential. The plateau of yields could be due
to many factors (Knight et al, 2012). The question arises as to whether micronutrients could
be one of those limiting increasing yields, especially in particular soil and management
situations?
Visual symptoms of a deficiency of a specific micronutrient can be confused with those
produced by other growth problems. Consequently, visual diagnosis of a micronutrient
deficiency should, where possible, be confirmed by plant and/or soil analysis. A problem
exists in that there are many different critical values used in both this country and overseas,
and also different extraction methods for soil analyses. These are also under-researched
and their technical basis is often obscure (Roques et al, 2013). One further issue is that they
were often promulgated many years ago, when wheat yields were smaller. It appears that
increasing yields following the “green revolution may have led to a “growth dilution” of
micronutrients in wheat grain (Fan et al, 2008, Gooding et al, 2012, Garvin et al, 2006).
Although it is also possible that decreasing total or available micronutrients in soil is also
responsible. The question arises whether existing soil nutrient indices and critical plant
tissue analyses remain valid, and whether the boundaries have changed in terms of wheat

6
nutrient requirements? Additionally, do modern high-yielding wheats respond in yields to
micronutrient applications and do their concentrations in grain increase?
Figure 1. Average yield of winter wheat crops in the UK over the last 50 years (FAO, 2013).
There is currently a lack of reliable recent UK-based literature on the above subjects, and
because of this, micronutrient research was prioritised by the HGCA in its mid-term review of
R&D strategies for 2007-2010. Research reported here was conducted between 2009 and
2012, and was recently added to by a review of published literature on the responses of
cereals and oilseed rape to micronutrients (Roques et al, 2013).
2.1. Objectives
This research is designed to provide recommendations as to whether additions of the
micronutrients Cu, Mn and Zn are required, based on the following key lines of research: i)
assessing the changes in the total and available micronutrient supply in arable soils over
time; and ii) using a programme of field experiments to evaluate whether the old soil index
and critical plant tissue values are appropriate to assess the yield-responsiveness of modern
high-yielding wheat varieties, and whether new methods of soil analysis can better predict
micronutrient supply and yield responsiveness. Outputs from the project were intended to
address whether fertiliser additions are needed for yield, and the use of soil and crop testing,
which are the key practical measures for improvement. A secondary objective was to
determine whether Cu, Mn or Zn spays are effective in biofortifying the concentrations of
these micronutrients in wheat grain.
0
1
2
3
4
5
6
7
8
9
1950 1960 1970 1980 1990 2000 2010
t/ha

7
3. Materials and methods
3.1. Soil micronutrient survey
A total of 132 “new” samples of arable soils were taken in England and Wales in 2009/10
and sent to Hill Court Farm Research as part of routine testing. These were not biased
towards soils low in micronutrients, as many of the samples were in fact submitted for major
nutrient analysis, particularly of mineral N in soil. The aim was to compare soils taken
recently with those sampled and analysed around 30 years ago (1978-1982), in the National
Soil Inventory, which was published in the Soil Geochemical Atlas of England and Wales
(McGrath and Loveland, 1992). The new soils were air dried and sieved to 2 mm before
micronutrient analysis at Rothamsted Research.
“Total” major and trace soil elements in soils were measured after fine-grinding in an all-
agate planetary ball mill and aqua regia digestion (McGrath and Cunliffe, 1985) and
analysed using inductively coupled plasma optical emission spectroscopy or inductively
coupled plasma mass spectroscopy (ICP-OES or ICP-MS). Micronutrient concentrations
were also determined in 0.05 M EDTA-extracts of soils that had been sieved to 2mm (MAFF,
1986).
3.2. Micronutrient response trials
3.2.1. Field Trials, experimental set up
Field sites were chosen to be on soils that had a risk of micronutrient deficiency: light sandy
soils, soils high in organic matter and calcareous soils. These all have either low contents of
micronutrients and/or lack of availability of the micronutrients present due to the soil
chemical properties. All of the field sites (particularly the organic soils) were locations where
micronutrients would be used routinely by farmers. Field experiments were set up with the
same design at 5 sites each year over the three harvest years 2010, 2011, 2012 (harvest
years), giving a total of 15 site/years. To ensure comparability, all sites were sown with
Solstice, which is a nabim group 1 breadmaking winter wheat variety. Details of the sites are
given below. N, P, K fertilisers were added on a site basis to avoid limitation and provide
sufficient nutrients to support high yields, all plots received adequate S fertiliser (37.5-50
kg/ha SO3), and standard farm practice for pesticide and herbicide applications and growth
regulators. Each plot was at least 2 m x 10 m or 12 m, depending on the site.
8
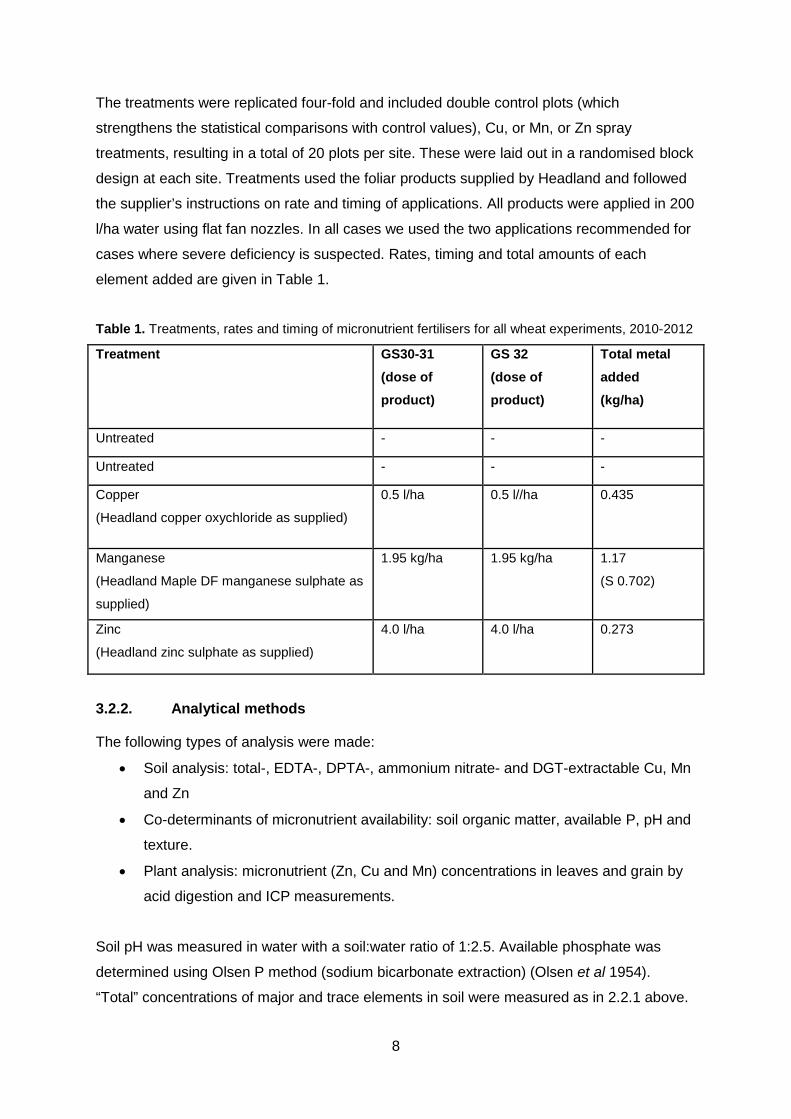
The treatments were replicated four-fold and included double control plots (which
strengthens the statistical comparisons with control values), Cu, or Mn, or Zn spray
treatments, resulting in a total of 20 plots per site. These were laid out in a randomised block
design at each site. Treatments used the foliar products supplied by Headland and followed
the supplier’s instructions on rate and timing of applications. All products were applied in 200
l/ha water using flat fan nozzles. In all cases we used the two applications recommended for
cases where severe deficiency is suspected. Rates, timing and total amounts of each
element added are given in Table 1.
Table 1. Treatments, rates and timing of micronutrient fertilisers for all wheat experiments, 2010-2012
Treatment GS30-31 (dose of product)
GS 32 (dose of product)
Total metal added (kg/ha)
Untreated - - -
Untreated - - -
Copper
(Headland copper oxychloride as supplied)
0.5 l/ha 0.5 l//ha 0.435
Manganese
(Headland Maple DF manganese sulphate as
supplied)
1.95 kg/ha 1.95 kg/ha 1.17
(S 0.702)
Zinc
(Headland zinc sulphate as supplied)
4.0 l/ha 4.0 l/ha 0.273
3.2.2. Analytical methods
The following types of analysis were made:
• Soil analysis: total-, EDTA-, DPTA-, ammonium nitrate- and DGT-extractable Cu, Mn
and Zn
• Co-determinants of micronutrient availability: soil organic matter, available P, pH and
texture.
• Plant analysis: micronutrient (Zn, Cu and Mn) concentrations in leaves and grain by
acid digestion and ICP measurements.
Soil pH was measured in water with a soil:water ratio of 1:2.5. Available phosphate was
determined using Olsen P method (sodium bicarbonate extraction) (Olsen et al 1954).
“Total” concentrations of major and trace elements in soil were measured as in 2.2.1 above.
9
Leaf and grain analyses for major and trace elements were made after digestion with
nitric/perchloric acids (Zhao et al 1994) and determined by ICP-OES.
Total carbon and N in soils was analysed using LECO TruMac macro combustion
instrument; organic carbon was calculated after subtracting any inorganic carbon that was
measured by manonometery. In addition to EDTA-extractable metals in soil, we also used
other methods that may be predictive of deficiencies of micronutrients in soils. These were:
DTPA extracts (Lindsey and Norvell, 1978); 1M ammonium nitrate extracts (Prüess 1998)
and Diffusive Gradients in Thin film devices (DGT) (Zhang et al, 2001). The DTPA and
ammonium nitrate extracts were measured at Rothamsted Research using ICP-OES or MS,
depending on the concentrations and DGT devices were eluted and analysed by ICP-MS at
Lancaster University.
3.3. Statistical analysis
Both soil and plant results are reported on an air-dry basis, except grain yields which are
reported on an 85% dry matter basis. All analyses were performed using Genstat V14.1
(VSN International, Hemel Hempstead). Variates were log10 transformed to normalise the
variance where necessary and back-transformed after analysis in some cases in order to
facilitate comparison and interpretation by those in the industry who are more conversant
with non-transformed arithmetic values. The conventional probability threshold (P) of <0.05
is taken as the threshold of statistical significance, apart from where indicated.
4. Results
4.1. Soil micronutrient survey
Originally, the NSI survey took samples every 5 km across England and Wales on a regular
grid pattern in 1978-1982. This represents all soils, rather than just those under agricultural
use. In order to make the two sets of samples more comparable, we used EU Corinne Land
Use data to identify which samples in the NSI set have the land use “arable”. This reduced
the number of samples in the large NSI to survey from 5,659 to 1,805.
The NSI samples will be referred to here as the “old” samples, and data for these was
extracted from the Rothamsted Research NSI database. This database contains “total”
analyses by aqua regia, and extractable analyses by EDTA. Because of the small losses of
micronutrients, their removal in 30 years of cropping or leaching is likely to be very small and
difficult to detect in the analyses of total metals (Table 2). Note that the mean and standard
10
deviation were calculated on a log10 transformation of the data, but then back-transformed
to give the geometric mean and standard deviation in Table 2. Total concentrations of Cu
decreased by 1 mg/kg and Mn by almost 40 mg/kg, but Zn appears to increase by 5 mg/kg
in the “new” soil samples.
Table 2. Summary statistics of the aqua regia concentrations of Cu, Mn and Zn from soil samples
taken in 2009/10 and 1978-1982 (new and old respectively), all results in mg/kg.
Data Geometric mean Minimum Maximum Std. deviation
New Cu 17.4 3.37 84.1 1.65
Old Cu 18.3 3.80 933.2 1.66
New Mn 522.4 71.29 3419.8 2.02
Old Mn 561.1 23.01 4456.6 1.98
New Zn 85.5 16.41 297.9 1.59
Old Zn 80.2 13.00 1524.1 1.58
However, it is more important in a crop context to consider changes in the availability of
these micronutrients rather than totals. Changes in availability are more likely to be detected
in EDTA extracts, for example, if the bioavailable pool has been extensively utilised and not
replenished, or if for example, farms use more or less lime than previously, the extractable
amounts of Cu, Mn and Zn will increase or decrease respectively. This could occur even
when the total concentrations do not change.
Box plots of the distributions of EDTA-extractable concentrations are non-parametric and
therefore the data did not require normalisation. They show the inter-quartile range in the
box, with the 50 percentile in the centre, and 25 and 75 percentiles at the bottom and top of
the box respectively. The 10th and 90th percentiles are shown by the whiskers below and
above the box and any outliers with smaller or larger concentrations then the whiskers are
shown as points. The results for manganese show that the spread of the data was larger in
the old samples, probably because there were more of them and the chances of finding
outliers would be greater (Figure 2). The same was true for extractable Cu and Zn (Figure
3). In each case, there were many more outliers with high concentrations in the old data,
most likely because more samples were taken, and the samples were taken systematically
from all over England and Wales, perhaps including areas with high background
concentrations of these elements.

11
Mn new Mn old
mg/
kg s
oil
0
100
200
300
400
500
Figure 2. Concentrations of EDTA-extractable manganese in soil samples taken in 2009/10 and
1978-1982 (new and old respectively), all results in mg/kg.
mg/
kg s
oil
0
10
20
30
40
50
Cu new Cu old Zn new Zn old Figure 3. Concentrations of EDTA-extractable copper and zinc in soil samples taken in 2009/10 and
1978-1982 (new and old respectively), all results in mg/kg. Note that for clarity a few upper outliers
have been removed for copper concentrations up to 111 and zinc up to 400 mg/kg.
Statistical distributions of new and old sample sets each of the three micronutrients were
positively skewed, and so they were log-transformed prior to analysis. Table 3 shows the
summary of the distributions of each data set after back-transformation. The maximum
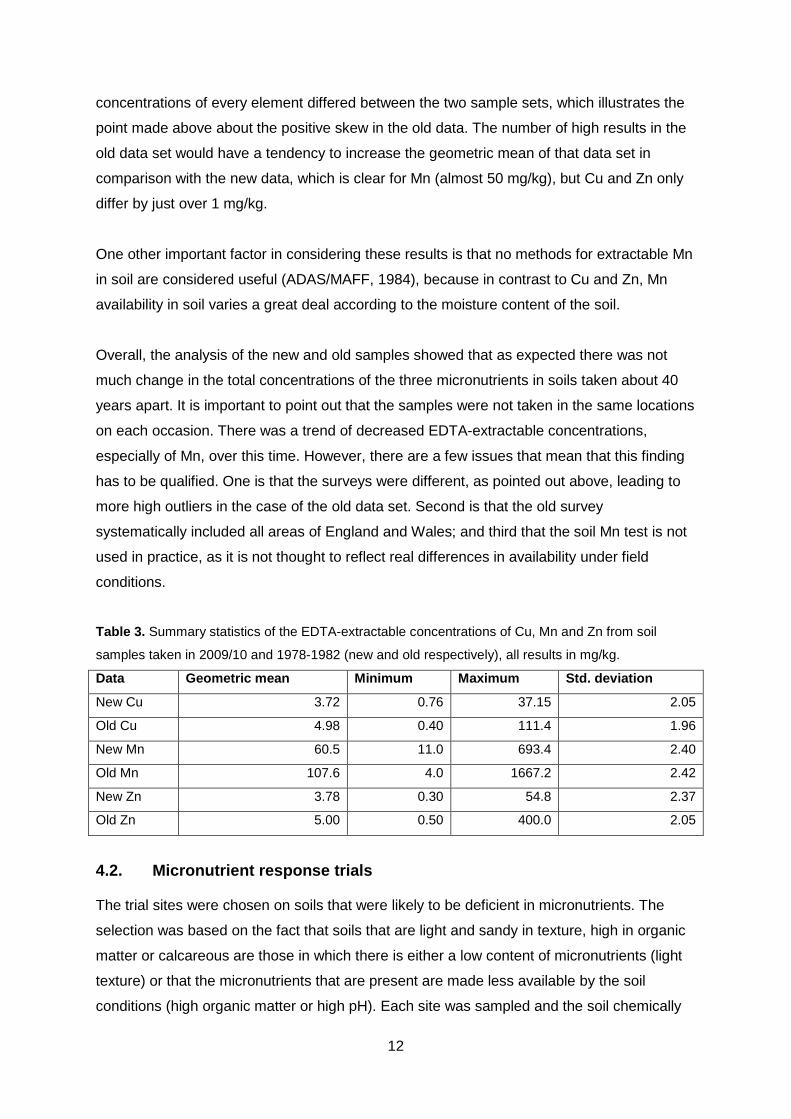
12
concentrations of every element differed between the two sample sets, which illustrates the
point made above about the positive skew in the old data. The number of high results in the
old data set would have a tendency to increase the geometric mean of that data set in
comparison with the new data, which is clear for Mn (almost 50 mg/kg), but Cu and Zn only
differ by just over 1 mg/kg.
One other important factor in considering these results is that no methods for extractable Mn
in soil are considered useful (ADAS/MAFF, 1984), because in contrast to Cu and Zn, Mn
availability in soil varies a great deal according to the moisture content of the soil.
Overall, the analysis of the new and old samples showed that as expected there was not
much change in the total concentrations of the three micronutrients in soils taken about 40
years apart. It is important to point out that the samples were not taken in the same locations
on each occasion. There was a trend of decreased EDTA-extractable concentrations,
especially of Mn, over this time. However, there are a few issues that mean that this finding
has to be qualified. One is that the surveys were different, as pointed out above, leading to
more high outliers in the case of the old data set. Second is that the old survey
systematically included all areas of England and Wales; and third that the soil Mn test is not
used in practice, as it is not thought to reflect real differences in availability under field
conditions.
Table 3. Summary statistics of the EDTA-extractable concentrations of Cu, Mn and Zn from soil
samples taken in 2009/10 and 1978-1982 (new and old respectively), all results in mg/kg.
Data Geometric mean Minimum Maximum Std. deviation
New Cu 3.72 0.76 37.15 2.05
Old Cu 4.98 0.40 111.4 1.96
New Mn 60.5 11.0 693.4 2.40
Old Mn 107.6 4.0 1667.2 2.42
New Zn 3.78 0.30 54.8 2.37
Old Zn 5.00 0.50 400.0 2.05
4.2. Micronutrient response trials
The trial sites were chosen on soils that were likely to be deficient in micronutrients. The
selection was based on the fact that soils that are light and sandy in texture, high in organic
matter or calcareous are those in which there is either a low content of micronutrients (light
texture) or that the micronutrients that are present are made less available by the soil
conditions (high organic matter or high pH). Each site was sampled and the soil chemically

13
analysed first for the pH and EDTA-extractable micronutrients and soil texture was visually
assessed. On this basis, sites were chosen for the experiments. Many of the sites that were
used for the field trials were below the lower quartile for EDTA-extractable Cu, Mn and Zn
concentrations in the “new” soils data reported in Section 3.1. The fifteen sites are shown in
Table 4. Where a location was used more than once, the trials were situated on different
areas in each year. In total, there were 6 light soils, 6 organic soils and 3 calcareous soils.
Winter wheat variety Solstice was sown in the autumn at all sites/years. Details of previous
cropping are provided in Table 4.
Each of the sites was then characterised by measuring soil total Cu, Mn and Zn, total N,
organic C, C/N ratio and Olsen P (Appendix Table 1). In addition, DTPA and ammonium
nitrate extracts, and DGT analyses for Cu, Mn and Zn were performed on all sites (Appendix
Tables 2-4).
Table 4. Dates, location, soil texture classification and previous cropping of the fifteen trial sites.
Year Site County Soil classification Previous crops (latest first)
2009/2010 Morley Norfolk loamy sand Beans, W barley, W wheat
Ely Cambridgeshire organic Lettuce, Sugar beet, lettuce
East Harling Norfolk loamy sand Grass, W barley, W wheat
Rothamsted Hertfordshire calcareous W wheat, W beans, W
wheat
Woburn Bedfordshire sandy loam W wheat, W oat, W wheat
2010/2011 Bardney Lincolnshire organic Linseed, W wheat, Sugar
beet
Prickwillow Cambridgeshire organic W wheat, lettuce, W wheat
Stretham Cambridgeshire organic Potato, W wheat, Sugar
beet
Rothamsted Hertfordshire calcareous W beans, W wheat, W
beans
Woburn Bedfordshire sandy loam W beans, W wheat, W
wheat
2011/2012 Caythorpe Lincolnshire loamy sand Sp barley, Sugar beet, W
wheat
Prickwillow Cambridgeshire organic Lettuce, Wheat, Lettuce
Waterbeach Cambridgeshire organic Leek, Wheat, Sugar beet
Rothamsted Hertfordshire calcareous W beans, W wheat, W
wheat
Woburn Bedfordshire sandy loam W wheat, potato, Sp barley
14
4.2.1. Visual symptoms
Visual symptoms characteristic of micronutrient deficiency were assessed in 2011 and 2012
on leaves at growth stage 33. Because visual symptoms are often transient, we had a note
in the trial protocol to record symptoms at any visit if they were seen. None were observed at
any site.
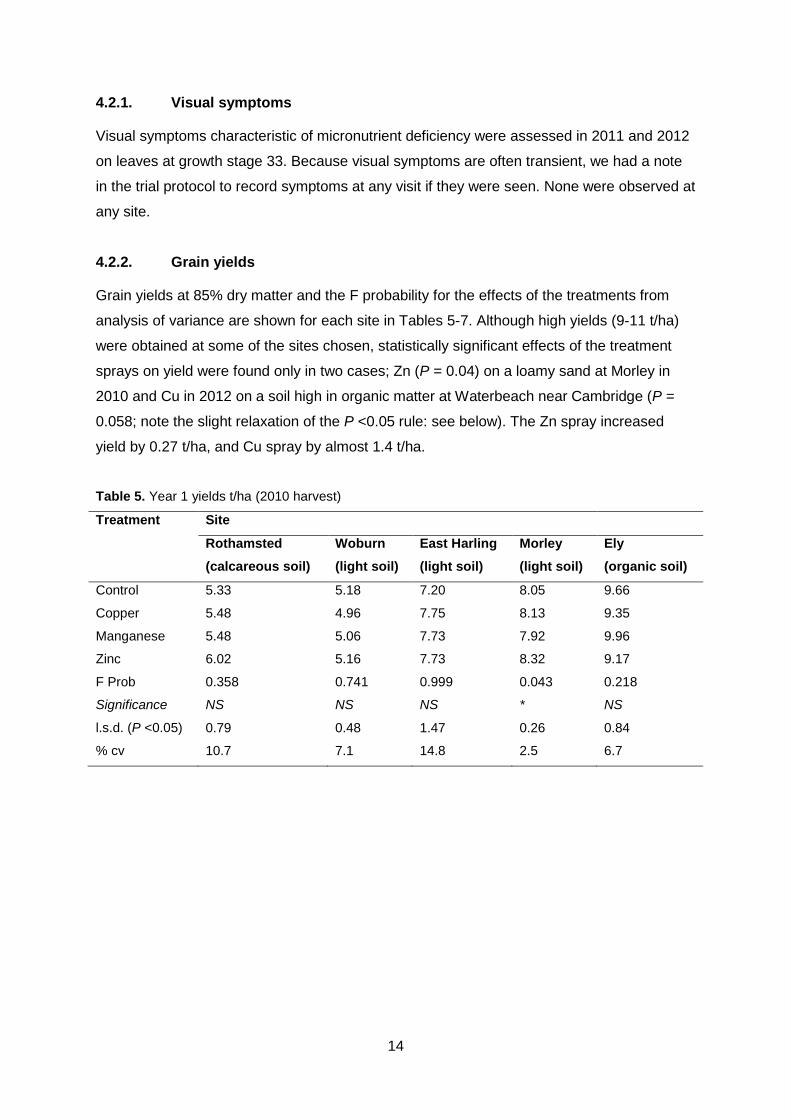
4.2.2. Grain yields
Grain yields at 85% dry matter and the F probability for the effects of the treatments from
analysis of variance are shown for each site in Tables 5-7. Although high yields (9-11 t/ha)
were obtained at some of the sites chosen, statistically significant effects of the treatment
sprays on yield were found only in two cases; Zn (P = 0.04) on a loamy sand at Morley in
2010 and Cu in 2012 on a soil high in organic matter at Waterbeach near Cambridge (P =
0.058; note the slight relaxation of the P <0.05 rule: see below). The Zn spray increased
yield by 0.27 t/ha, and Cu spray by almost 1.4 t/ha.
Table 5. Year 1 yields t/ha (2010 harvest)
Treatment Site
Rothamsted (calcareous soil)
Woburn (light soil)
East Harling (light soil)
Morley (light soil)
Ely (organic soil)
Control 5.33 5.18 7.20 8.05 9.66
Copper 5.48 4.96 7.75 8.13 9.35
Manganese 5.48 5.06 7.73 7.92 9.96
Zinc 6.02 5.16 7.73 8.32 9.17
F Prob 0.358 0.741 0.999 0.043 0.218
Significance NS NS NS * NS
l.s.d. (P <0.05) 0.79 0.48 1.47 0.26 0.84
% cv 10.7 7.1 14.8 2.5 6.7

15
Table 6. Year 2 yields t/ha (2011 harvest)
Treatment Site
Rothamsted (calcareous soil)
Woburn (light soil)
Bardney (organic soil)
Prickwillow (organic soil)
Stretham (organic soil)
Control 11.29 8.09 6.57 10.52 7.21
Copper 11.36 7.75 6.64 10.59 6.74
Manganese 10.77 7.73 6.71 10.05 7.06
Zinc 11.46 7.67 6.86 10.67 7.09
F Prob 0.067 0.969 0.641 0.275 0.691
Significance NS NS NS NS NS
l.s.d. (P <0.05) 0.54 0.60 0.45 0.75 0.83
% cv 3.7 5.8 5.1 5.4 8.8
Table 7. Year 3 yields t/ha (2012 harvest)
Treatment Site
Rothamsted (calcareous soil)
Woburn (light soil)
Caythorpe (light soil)
Prickwillow (organic soil)
Waterbeach (organic soil)
Control 9.04 9.42 7.30 7.48 7.23
Copper 9.09 9.10 7.34 7.48 8.62
Manganese 8.90 9.69 7.36 7.45 7.70
Zinc 9.18 9.32 7.36 7.40 7.19
F Prob 0.425 0.401 0.948 0.357 0.058
Significance NS NS NS NS *
l.s.d. (P <0.05) 0.40 0.80 0.16 0.11 1.01
% cv 3.3 6.4 1.6 1.1 10.0
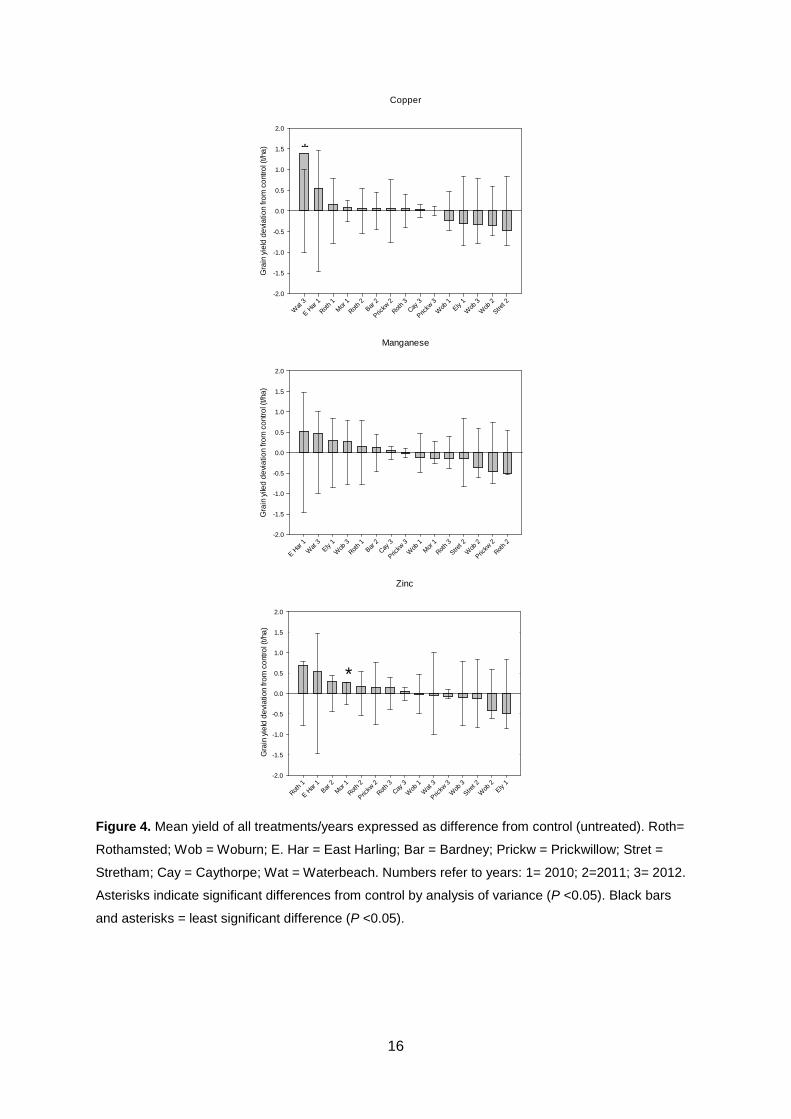
To look for trends in effects on yield, the difference of each treatment mean from the control
was calculated and presented graphically, along with the LSD from ANOVA for each
experiment. For example, if many of the results were positive with respect to the control, but
not statistically significant (at P <0.05), this would show as a trend, with most of the bars
being positive. This was not the case for Cu, Mn or Zn (Figure 4). The lines and whiskers in
the Figure are LSDs which indicate what magnitude of yield increase (t/ha) would be
required in each particular experiment to be detected as “significant” by ANOVA. The LSDs
at each site varied (from 0.11 – 1.47 t/ha), but were on average around 0.6 t/ha, meaning
that this magnitude of change in yield would be necessary for a statistical difference to be
detected.
16
Copper
Wat
3
E Har
1Roth
1Mor
1Roth
2Bar
2
Prickw
2Roth
3Cay
3
Prickw
3W
ob 1
Ely 1
Wob
3W
ob 2
Stret 2
Gra
in y
ield
dev
iatio
n fro
m c
ontro
l (t/h
a)
-2.0
-1.5
-1.0
-0.5
0.0
0.5
1.0
1.5
2.0
Manganese
E Har
1W
at 3
Ely 1
Wob
3Roth
1Bar
2Cay
3
Prickw
3W
ob 1
Mor 1
Roth 3
Stret 2
Wob
2
Prickw
2Roth
2
Gra
in y
iled
devi
atio
n fro
m c
ontro
l (t/h
a)
-2.0
-1.5
-1.0
-0.5
0.0
0.5
1.0
1.5
2.0
Zinc
Roth 1
E Har
1Bar
2Mor
1Roth
2
Prickw
2Roth
3Cay
3W
ob 1
Wat
3
Prickw
3W
ob 3
Stret 2
Wob
2Ely
1
Gra
in y
ield
dev
iatio
n fro
m c
ontro
l (t/h
a)
-1.5
-0.5
0.5
1.5
-2.0
-1.0
0.0
1.0
2.0
Figure 4. Mean yield of all treatments/years expressed as difference from control (untreated). Roth=
Rothamsted; Wob = Woburn; E. Har = East Harling; Bar = Bardney; Prickw = Prickwillow; Stret =
Stretham; Cay = Caythorpe; Wat = Waterbeach. Numbers refer to years: 1= 2010; 2=2011; 3= 2012.
Asterisks indicate significant differences from control by analysis of variance (P <0.05). Black bars
and asterisks = least significant difference (P <0.05).
*
*

17
Looking in detail at the raw data from the two significant positive responses, for Cu at
Waterbeach in 2012, one block had a lower yield in all the treatments than the others
(average yields were 8.05, 8.28, 6.57, 7.22 t/ha). This may be the reason for the large LSD
value at this site, but in this case the yield response was big enough to be significant
(+1.4 t/ha or 19.2%). This response may have been even more significant if there had not
been a “bad block” in the experiment. Whereas, at Morley in 2010, the block averages for all
treatments were 8.06, 7.85, 8.24 and 8.24, giving rise to a small LSD value (0.26) that was
exceeded by the +0.27 t/ha (3.4%) increase in yield. This explains why relatively large or
small increases can be designated as significant, depending on the magnitude of the error
term in specific experiments. Across all the sites, the percentage yield increase needed to
exceed the LSD values ranged from 1.5 – 20.4%, with an average of 8.3%. Micronutrient
effects on yield, if any, may be within this range, and are therefore difficult to show
statistically.
The exact experimental design is also important. We included 8 control plots as a design
feature in these experiments. When one of the results from the two controls in each block is
randomly omitted from the ANOVA, the P value for Morley increased from 0.043 to 0.074,
and from 0.058 to 0.104 at Waterbeach. In both cases this would have made the yield effect
not significant at P =0.05 and these effects would not be detected. This emphasises the
increased power of detection by employing double the number of replicates of control
treatments, as used here.
Another aspect to consider is the probability level that is taken for assessing significance.
Although P <0.05 is conventionally used as the acceptable level of significance (this
represents a 1 in 20 chance of being wrong due to random variation), many practitioners in
the industry have asked, in view of the fact that relatively small yield increases are likely with
micronutrients, what would happen if we relaxed this level of uncertainty, to P <0.10. This is
illustrated in Figure 5 and Table 8. These show that the size of the LSDs did not change very
much, and no more positive responses become significant at P <0.10. However, one
response (for Mn at Rothamsted in 2011) becomes significantly negative. Sprays could
possibly decrease yield if too much is used, or spraying is carried out in conditions that lead
to scorch of the leaves, but we did not observe any visible symptoms of that in our
experiments. At P <0.10, there is more chance of being wrong in interpreting any response
due to chance (one in ten). Relaxing this even further would lower these odds even further,
and most likely draw in more of the “negative” responses as being “significant”. One would
then have to accept more negative responses also, which is undesirable.

18
Copper
Wat
3
E Har
1Roth
1Mor
1Roth
2Bar
2
Prickw
2Roth
3Cay
3
Prickw
3W
ob 1
Ely 1
Wob
3W
ob 2
Stret 2
Gra
in y
ield
dev
iatio
n fro
m c
ontro
l (t/h
a)
-1.5
-0.5
0.5
1.5
-2.0
-1.0
0.0
1.0
2.0
Manganese
E Har
1W
at 3
Ely 1
Wob
3Roth
1Bar
2Cay
3
Prickw
3W
ob 1
Mor 1
Roth 3
Stret 2
Wob
2
Prickw
2Roth
2
Gra
in y
iled
devi
atio
n fro
m c
ontro
l (t/h
a)
-2.0
-1.5
-1.0
-0.5
0.0
0.5
1.0
1.5
2.0
Zinc
Roth 1
E Har
1Bar
2Mor
1Roth
2
Prickw
2Roth
3Cay
3W
ob 1
Wat
3
Prickw
3W
ob 3
Stret 2
Wob
2Ely
1
Gra
in y
ield
dev
iatio
n fro
m c
ontro
l (t/h
a)
-2.0
-1.5
-1.0
-0.5
0.0
0.5
1.0
1.5
2.0
Figure 5. Mean yield of all treatments/years expressed as difference from control (untreated). Roth=
Rothamsted; Wob = Woburn; E. Har = East Harling; Bar = Bardney; Prickw = Prickwillow; Stret =
Stretham; Cay = Caythorpe; Wat = Waterbeach. Numbers refer to years: 1= 2010; 2=2011; 3= 2012.
Asterisks indicate significant differences from control by analysis of variance (P <0.10). Black bars
and asterisks = least significant difference (P <0.10).
*
* *

19
Table 8. Summary of least significant differences in yield from ANOVAs for fifteen site/years in t/ha of
grain.
Probability P = 0.05 P = 0.10
minimum 0.11 0.09
maximum 1.47 1.20
average 0.63 0.52
Next, taking the data for all 15 sites years together, we conducted Restricted Maximum
Likelihood (REML) analysis and found that, using all the data, calcareous soil tended to yield
most and the light soil least, but this was not significant due to variation across sites/years in
yields (“P soil” in Table 9). Also, the effects of spray treatments on yields was not significant
across sites (“P soil*(control/treatment)” in Table 9), which is not surprising in that there were
only two significant responses out of a possible 45 comparisons (15 sites x 3 micronutrients).
Table 9. REML analysis of grain yields, including data for all sites and all years.
Soil Type Treatment
Control Cu Mn Zn s.e.m
Calcareous (3) 8.55 8.65 8.38 8.89 1.03-1.04
Light (6) 7.54 7.5 7.58 7.59 0.73
Organic (6) 8.11 8.2 8.17 8.06 0.73
P soil 0.69 NS P soil*(control/treatment) 0.21 NS
4.2.3. Soil EDTA analyses
EDTA extracts of soils have been used for judging the micronutrient status for at least 50
years, but the link between the results and deficiency in crops is hard establish (Roques et
al, 2013), and the evidence in terms of crop yield responses for any particular critical values
is very scant. Judging the analyses by the ADAS/MAFF (1984) criteria for likely Cu
deficiency in crops (Table 10), two sites would be classed as “deficient” in 2010 (Morley and
Rothamsted), one in 2011 (Rothamsted) and two in 2012 (Waterbeach and Rothamsted;
Appendix Tables 2-4). However, taking Roques et al’s (2013) critical value of 1.0 Cu mg/kg,
only Waterbeach and Rothamsted in 2012 would be classed as deficient. Using the ADAS
value, only 1 in 5 predictions were correct, but employing the lower Roques et al value, 1 in
2 was correct. This appears to justify use of the lower critical value for Cu (1.0 mg/kg), which
is also the value given in the Fertiliser Manual (2010). However, it is worth noting that the
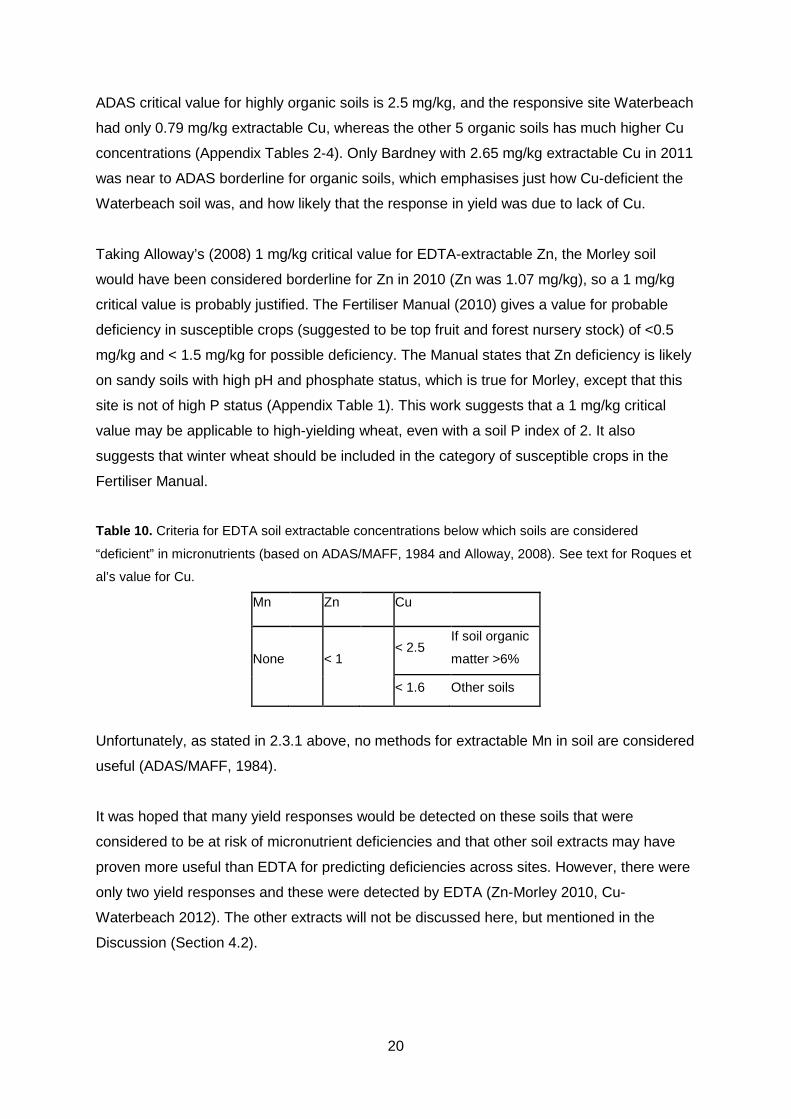
20
ADAS critical value for highly organic soils is 2.5 mg/kg, and the responsive site Waterbeach
had only 0.79 mg/kg extractable Cu, whereas the other 5 organic soils has much higher Cu
concentrations (Appendix Tables 2-4). Only Bardney with 2.65 mg/kg extractable Cu in 2011
was near to ADAS borderline for organic soils, which emphasises just how Cu-deficient the
Waterbeach soil was, and how likely that the response in yield was due to lack of Cu.
Taking Alloway’s (2008) 1 mg/kg critical value for EDTA-extractable Zn, the Morley soil
would have been considered borderline for Zn in 2010 (Zn was 1.07 mg/kg), so a 1 mg/kg
critical value is probably justified. The Fertiliser Manual (2010) gives a value for probable
deficiency in susceptible crops (suggested to be top fruit and forest nursery stock) of <0.5
mg/kg and < 1.5 mg/kg for possible deficiency. The Manual states that Zn deficiency is likely
on sandy soils with high pH and phosphate status, which is true for Morley, except that this
site is not of high P status (Appendix Table 1). This work suggests that a 1 mg/kg critical
value may be applicable to high-yielding wheat, even with a soil P index of 2. It also
suggests that winter wheat should be included in the category of susceptible crops in the
Fertiliser Manual.
Table 10. Criteria for EDTA soil extractable concentrations below which soils are considered
“deficient” in micronutrients (based on ADAS/MAFF, 1984 and Alloway, 2008). See text for Roques et
al’s value for Cu.
Mn Zn Cu
None
< 1
< 2.5 If soil organic
matter >6%
< 1.6 Other soils
Unfortunately, as stated in 2.3.1 above, no methods for extractable Mn in soil are considered
useful (ADAS/MAFF, 1984).
It was hoped that many yield responses would be detected on these soils that were
considered to be at risk of micronutrient deficiencies and that other soil extracts may have
proven more useful than EDTA for predicting deficiencies across sites. However, there were
only two yield responses and these were detected by EDTA (Zn-Morley 2010, Cu-
Waterbeach 2012). The other extracts will not be discussed here, but mentioned in the
Discussion (Section 4.2).

21
4.2.4. Leaf analyses
Young leaves were sampled at all sites at GS30 before the treatments were applied, which
can help indicate whether the sites/crop would be classified as “deficient”. The criteria used
for tissue samples were:
• Cu < 4 mg/kg in leaves, < 2 mg/kg in grain (Alloway B.J., 2008)
• Mn < 20 mg/kg in leaves and also grain (ADAS/MAFF, 1976; Alloway B.J., 2008)
• Zn < 20 mg/kg in leaves and also grain (Mortvedt J.J., et al, 1972; Scaife and Turner,
1983; Alloway B.J., 2008)
The number of sites/years that were either below or very close to these criteria were: three
for Cu, two for Mn and four for Zn (Table 11). It is also of note that no site/elements had any
deficiencies indicated by leaf analysis in 2010, two in 2011, and seven in 2012. Rothamsted
and Woburn farms were used in all of these years, and the seasonal differences in weather
were that 2010 was cold in January and February (soon before sampling took place), which
was otherwise near the 30 year average, 2011 was cold in January but drier overall
compared to average, and 2012 was cold in February but wettest overall (Appendix Tables
5-7). It is not known whether these features affect the concentrations of micronutrients in the
leaves. It is also worth noting that there may be only small differences in Cu in tissues
between healthy and deficient plants, and so tissue testing for Cu may be less useful than
soil testing (Chalmers et al. 1999). The Fertiliser Manual (2010) does not suggest a critical
value for leaf Cu, for Mn it gives 20 mg/kg and for Zn only 15 mg/kg. Using this lower Zn
value, no sites would be flagged up as problematic, including the Morley site that in fact
responded in yield to Zn sprays even though it had nearly 32 mg/kg Zn in leaves at the time
of sampling.

22
Table 11. Mean micronutrient concentrations in leaf material (mg/kg) measured before treatments were applied. The standard error of the mean is given in
parentheses. Results in red indicate those below or very close to the criteria given in Section 3.2.4.
Year Cu Mn Zn Cu Mn Zn Cu Mn Zn Cu Mn Zn Cu Mn Zn
2010 Rothamsted
(calcareous soil)
Woburn
(light soil)
East Harling
(light soil)
Morley
(light soil)
Ely
(organic soil)
12.97
(0.76)
91.27
(9.12)
26.76
(1.40)
12.19
(0.76)
29.16
(0.93)
29.65
(0.27)
10.86
(0.53)
29.14
(0.96)
39.00
(2.51)
10.21
(0.35)
78.89
(5.13)
31.66
(1.54)
12.23
(0.62)
42.41
(3.56)
50.23
(1.44)
2011 Rothamsted
(calcareous soil)
Woburn
(light soil)
Bardney
(organic soil)
Prickwillow
(organic soil)
Stretham
(organic soil)
7.42
(0.07)
75.41
(2.47)
20.94
(0.91)
5.91
(0.10)
32.61
(0.88)
17.43
(0.55)
4.07
(0.17)
39.07
(2.53)
32.81
(0.39)
7.00
(0.09)
26.59
(0.76)
29.30
(1.11)
5.72
(0.07)
66.90
(4.99)
40.55
(1.06)
2012 Rothamsted
(calcareous soil)
Woburn
(light soil)
Caythorpe
(light soil)
Prickwillow
(organic soil)
Waterbeach
(organic soil)
6.41
(0.20)
54.31
(0.18)
18.73
(0.74)
4.64
(0.18)
8.55
(0.71)
17.34
(0.31)
3.68
(0.11)
44.13
(1.14)
18.84
(0.91)
7.52
(0.77)
28.85
(9.05)
30.02
(0.68)
3.91
(0.28)
13.08
(1.66)
24.84
(0.83)
23
4.2.5. Grain analyses
The concentrations of Cu, Mn and Zn were measured in all grain samples after harvest. The
results are important for three reasons: 1) they can be used to indicate if the crop would be
classified as “deficient” using the criteria given above, 2) if concentrations increase, these
can act as an indication of the success of the treatments spayed on the leaves, in other
words whether the plant and grain has responded to the additions and 3) there is interest
internationally (see HarvestZinc, 2012) in boosting the concentrations of micronutrients in
grain for animal and human nutrition, and it is useful to know if early foliar sprays can
contribute to this biofortification.
The values given below indicate that a total of 1 site would be classified as “low” in grain Cu
(Waterbeach, 2012) and this helps to confirm that the plants were severely deficient in Cu at
that site (Tables 12-14). Seven were “deficient” in Mn but did not respond in either yield or
Mn concentration in grain, apart from Prickwillow in 2011, which increased by only 1.5 mg/kg
in grain in the Mn treatment (Tables 12-14). This argues that Mn is not very mobile from
leaves to grain, which is supported by Rengel (1999). Four sites were classed as “deficient”
for Zn, three of which had light textured soils, out of six of the sites with this type of soil
(Tables 12-14). One of these, with the lowest grain Zn concentration of all sites was the Zn
responsive site Morley (2010). This had 15.52 mg/kg Zn in grain from the control treatment,
which would not be classified as “deficient” if the 15 mg/kg criterion is used. Again, this may
justify using 20 mg/kg as a cut-off for grain Zn.
Although these experiments were not set up to create different yields within each site, there
was no indication across sites/years of so-called “growth-dilution” of Zn concentrations in
grain (Gooding et al, 2012). For example, on the calcareous soil at Rothamsted, Zn
concentrations were around 17, 25 and 26 mg/kg in 2010, 2011 and 2012 when yields were
5.3, 11.3 and 9.0 t/ha respectively. In 2010 this was a second wheat (Table 4), but it is
difficult to disentangle the potential effects that this may have on roots from factors related to
weather and soil (site). At Woburn, second wheats were grown in 2010 and 2012, but the
accompanying yields were 5.18 t/ha and 9.42 t/ha and Zn concentrations in grain were 16.94
mg/kg and 21.37 mg/kg. However, 2011 at Woburn was a first wheat and yielded 8.09 t/ha
and had 17.77 mg/kg in grain. It is notable that the soils high in organic matter gave amongst
the highest Zn concentrations in grain, 29-43 mg/kg Zn (Tables 12-14).

24
Table 12. Year 1 micronutrient concentrations in harvested grain (2010 harvest). Results in red indicate those below or very close to the criteria given in
Section 3.2.4.
Treatment
Site
Rothamsted
(calcareous soil)
Woburn
(light soil)
East Harling
(light soil)
Morley
(light soil)
Ely
(organic soil) Cu
(mg/kg)
Mn
(mg/kg)
Zn
(mg/kg)
Cu
(mg/kg)
Mn
(mg/kg)
Zn
(mg/kg)
Cu
(mg/kg)
Mn
(mg/kg)
Zn
(mg/kg)
Cu
(mg/kg)
Mn
(mg/kg)
Zn
(mg/kg)
Cu
(mg/kg)
Mn
(mg/kg)
Zn
(mg/kg)
Control 3.24 30.92 17.83 3.61 16.18 16.94 3.78 17.82 22.32 3.32 28.53 15.52 3.92 22.52 33.47
Cu 3.15 30.40 17.30 3.48 15.63 16.64 3.62 18.44 21.59 3.45 27.42 15.18 3.88 22.91 34.34
Manganese 2.88 30.68 17.88 3.31 14.76 16.86 3.62 17.11 20.62 3.13 27.04 14.30 4.02 25.10 33.07
Zinc 3.05 30.86 17.84 3.48 15.83 17.63 3.63 18.38 24.52 3.32 28.06 16.70 3.95 21.55 35.48
F Prob 0.294 0.874 0.515 0.464 0.629 0.161 0.994 0.181 0.004 0.054 0.662 0.054 0.719 0.119 0.250
Significance NS NS NS NS NS NS NS NS * NS NS NS NS NS NS
l.s.d. (P
<0.05)
0.31 1.66 1.02 0.29 2.17 0.95 0.22 1.43 1.83 0.22 2.10 1.68 0.33 2.99 2.57
% cv 7.5 4.1 4.4 6.2 10.5 4.2 4.4 6.0 6.2 5.1 5.7 8.2 6.3 9.8 5.7

25
Table 13. Year 2 micronutrient concentrations in harvested grain (2011 harvest). Results in red indicate those below or very close to the criteria given in
Section 3.2.4.
Treatment
Site
Rothamsted
(calcareous soil)
Woburn
(light soil)
Bardney
(organic soil)
Prickwillow
(organic soil)
Stretham
(organic soil) Cu
(mg/kg)
Mn
(mg/kg)
Zn
(mg/kg)
Cu
(mg/kg)
Mn
(mg/kg)
Zn
(mg/kg)
Cu
(mg/kg)
Mn
(mg/kg)
Zn
(mg/kg)
Cu
(mg/kg)
Mn
(mg/kg)
Zn
(mg/kg)
Cu
(mg/kg)
Mn
(mg/kg)
Zn
(mg/kg)
Control 3.91 32.17 25.53 3.11 16.65 17.77 2.56 30.24 43.13 3.33 13.64 29.18 4.15 25.22 34.35
Cu 3.83 31.60 24.79 3.19 16.78 17.75 2.57 29.53 42.02 3.42 14.40 28.42 4.23 23.17 35.67
Manganese 3.93 31.60 25.49 3.17 17.21 17.82 2.66 30.42 44.51 3.36 15.15 28.33 4.31 25.32 35.79
Zinc 3.76 32.28 25.56 3.16 16.56 19.60 2.50 31.40 43.83 3.10 13.11 30.38 4.21 25.07 36.10
F Prob 0.291 0.839 0.705 0.962 0.647 0.056 0.348 0.713 0.471 0.076 0.011 0.144 0.828 0.163 0.951
Significance NS NS NS NS NS * NS NS NS NS ** NS NS NS NS
l.s.d. (P
<0.05)
0.19 2.45 1.89 0.20 1.30 1.45 0.19 4.18 3.80 0.25 1.06 2.04 0.32 2.15 2.67
% cv 3.8 5.8 5.6 4.9 5.9 6.0 5.5 10.4 6.6 5.7 5.7 5.3 5.8 6.6 5.7

26
Table 14. Year 3 micronutrient concentrations in harvested grain (2012 harvest). Results in red indicate those below or very close to the criteria given in
Section 3.2.4.
Treatment
Site
Rothamsted
(calcareous soil)
Woburn
(light soil)
Caythorpe
(light soil)
Prickwillow
(organic soil)
Waterbeach
(organic soil) Cu
(mg/kg)
Mn
(mg/kg)
Zn (mg/kg) Cu
(mg/kg)
Mn
(mg/kg)
Zn
(mg/kg)
Cu
(mg/kg)
Mn
(mg/kg)
Zn
(mg/kg)
Cu
(mg/kg)
Mn
(mg/kg)
Zn
(mg/kg)
Cu
(mg/kg)
Mn
(mg/kg)
Zn
(mg/kg)
Control 3.39 36.49 26.26 2.03 11.15 21.37 2.50 27.70 20.10 2.94 18.32 37.65 1.75 10.94 40.96
Cu 3.28 35.50 23.96 2.24 11.26 30.30 2.48 28.18 20.41 3.05 19.12 35.96 1.86 11.28 38.72
Manganese 3.32 36.23 25.39 2.08 12.75 20.18 2.45 28.73 20.75 2.94 17.77 39.71 1.80 11.32 38.74
Zinc 3.45 36.98 30.68 2.05 10.31 26.84 2.36 27.84 21.49 2.83 18.14 35.55 1.84 13.74 40.77
F Prob 0.292 0.516 <0.001 0.201 0.176 0.002 0.535 0.463 0.311 0.238 0.493 0.040 0.921 0.140 0.669
Significance NS NS *** NS NS ** NS NS NS NS NS * NS NS NS
l.s.d. (P
<0.05)
0.20 2.34 1.87 0.21 2.30 3.01 0.20 1.31 1.29 0.23 2.14 2.98 0.27 2.46 4.85
% cv 4.5 4.9 5.4 7.5 15.4 10.4 6.0 3.5 4.7 6.0 8.8 6.0 11.4 15.9 9.2

27
ANOVA of the effects of the treatments on grain concentrations (Tables 12-14) showed that
only the Zn treatment boosted the concentration of Zn in grain on the light soil at Morley in
2010 (P =0.004), and on another light site at Woburn in 2011 (P =0.056) and 2012 (P
=0.002), and on one calcareous site at Rothamsted in 2012 (P <0.001). Mn spray increased
Mn in grain at Prickwillow in 2011 (P <0.01). Zn spray significantly increased grain Cu at
Woburn in 2012 and Mn spray increased Zn in grain at Prickwillow in 2012; these effects on
other elements were either indirect ones or by occurred by chance. Correspondence
between “low” micronutrient classification of grain and the significant and element-specific
responses in terms of concentration in grain to spray treatments was low. For example, 5
site/element combinations were classified as “low” in 2010 but none of these responded to
the fertiliser by boosting the “low” grain concentrations (Table 7). In 2011 there were two
sites where grain concentrations responded to Zn and Mn respectively and were classed as
“low”. Finally, 4 site/element combinations classified as “low” in 2012 did not respond
significantly, whilst two that were not classified as “low” (Rothamsted and Woburn)
responded specifically in grain concentrations to the Zn spray applied.
Table 15. REML analysis of micronutrients present in grain at harvest, across all years.
Soil Type Predicted
element
Treatment
Control Cu Mn Zn s.e.m
Calcareous (3) Cu 3.51 3.42 3.37 3.42 0.43-0.44 Organic (6) Cu 3.13 3.19 3.20 3.09 0.37 Light (6) Cu 3.04 3.06 2.94 2.98 0.37 P soil 0.38 NS P soil*(control/treatment) 0.21 NS 0.2
Calcareous (3) Mn 33.19 32.50 32.83 33.37 3.73-3.75 Organic (6) Mn 20.15 20.07 20.85 20.50 2.64-2.65 Light (6) Mn 19.67 19.62 19.60 19.50 2.64-2.65 P soil 0.03** P soil*(control/treatment) 0.64 NS
Calcareous (3) Zn 23.00 22.02 22.92 24.69 2.44-2.48 Organic (6) Zn 36.30 35.69 36.53 36.86 1.86-1.88 Light (6) Zn 19.16 18.80 18.58 21.29 1.86-1.88 P soil <0.001*** P soil*(control/treatment) 0.05*
REML analysis of all 15 site/years by soil texture type confirmed no overall significant effect
of soil type on Cu in grain. However, Mn was lowest in organic and light soils (P = 0.03), with
calcareous soils highest (Table 15). There was no overall effect of treatment on grain Cu and

28
Mn when all data were pooled. However, for Zn the calcareous and light sites gave the
lowest grain Zn concentrations, and both types of soil showed increases in grain Zn over
control in the Zn concentrations in the Zn treatments (P <0.05). But the overall increase
comparing +Zn with Control across all site/years was small (c. 1.7 – 2.1 mg Zn/kg in grain).
5. Discussion
5.1. Soil micronutrient survey
Although the aqua regia “total” concentrations of Cu, Mn and Zn differed slightly between our
samples taken in 2009/10 and the NSI samples in 1978-1982, the differences were not
large. The geometric mean of the sample results for Cu were lower in 2009/10 by less than 1
mg/kg and Mn by nearly 40 mg/kg, but for Zn the new samples were higher by almost 5
mg/kg (Table 2). Due to pollution control and changes in industries, there have been
decreases in atmospheric emissions of these elements between 1980 and 2010 of about a
factor of two for Zn and Cu. Manganese emission data have only been collected for the last
10 years, but these also show a decline (Figure 6). UK emissions follow the order Zn > Cu >
Mn. However, due to the long residence times of metals in soils, decreases are as yet
difficult to measure (Emmet et al, 2010). Indeed, in the case of Cu only, the Review of
Transboundary Air Pollution (RoTAP, 2012) report gives a map of the total deposition in
2008 that shows that most of lowland UK receives from 5 – 50 g/ha/yr Cu from atmospheric
sources. Although all of the Cu deposited may not be in a bioavailable form, this input alone
is a similar order of magnitude as the offtake of Cu in grain of cereal crops cereal crops,
which is estimated at 30 – 90 g/ha/yr for a 10 t crop (Roques et al, 2013). In addition to this,
some farms/fields may gain much greater amounts Cu from additions such as farm manures,
sewage sludge, composts or other recycled materials (Nicholson et al, 2003). In the
Countryside Survey, Emmett et al (2010) reported a general increase in Cu concentrations in
soils sampled nationally in 1998 and 2007, although detailed breakdown of the results by
land use actually shows no change in arable and horticultural soils. For Zn, arable and
horticultural soils showed a slight decrease (average of 90.1 to 84.4 mg/kg). Manganese
was only measured in 2007 in the Countryside Survey.

29
Figure 6. UK emissions of Zn, Cu and Mn (http://naei.defra.gov.uk/)
It is more relevant to the availability of micronutrients to crops to measure an extract, such
as EDTA, that was also measured in 1979-1982 in the NSI. These have the same issues
related to detecting changes as aqua regia values (see Section 2.3.1), but the results show
only a decrease of just over 1 mg/kg for Cu and Zn (Table 3). For Mn the difference is almost
50 mg/kg, but EDTA extracts for Mn are affected by factors such as the moisture content of
the soil and are not related to crop uptake. It is unlikely that the differences for Cu and Zn
are biologically significant. In addition, the changes may be due to random sampling error,
and could only be made more comparable by sampling exactly the same sites in 2009/10 as
in 1978-1982. There is uncertainty in these results, but what is known is that there has not
been a large change in either total or extractable Cu, Mn or Zn in arable soils.
5.2. Micronutrient response trials
The spray treatments with Cu, Mn or Zn in the 15 site/years mean that there were a total of
45 possible responses in the trials. Out of these we detected two yield responses, one each
for Cu and Zn. Careful examination of the responses and changing the usual probability level
from P <0.05 to P <0.10 did not change these results, except that one apparent negative
yield effect with Mn is suspected if P <0.10 is applied.
0
0.2
0.4
0.6
0.8
1
1.2
1.4
1.6
1970 1980 1990 2000 2010
1000
s to
nnes
/yea
r
Zinc
Copper
Manganese

30
For Cu, comparing this with the data reviewed by Roques et al, (2013), they reported 9 out
of 60 UK trials with winter wheat responded in yield (15%), against our 1 out of 15 (7%).
However, scrutiny of their reported data show that 4 of the responses they report were
obtained between 1953 and 1972, i.e. they may be old enough to pre-date good advisory
practice. In fact, only 1 of the 20 (5%) winter wheat trials they summarised as performed
since 2005 responded to Cu (the Waterbeach result from this study). The latter was during a
period when wheat yields were likely to be higher, and soil Cu may have since been
enhanced in many previously Cu-deficient areas by many years of agricultural applications
of sprays and perhaps soil Cu dressings which remain effective for many seasons (Roques
et al, 2013). The 1 in 20 figure is far below the total of 61 out of 113 (53%) responses to Cu
that Roques et al (2013) reported for all cereals in UK trials. Only one third of the cereal trials
they reported were with winter wheat. Most of the other crops were spring wheat, spring
barley and oats; the responses of these crops may be different to winter wheat.
The Cu response was observed in 2012, which was a relatively cool and wet season
(Appendix Tables 5-7). Under these conditions, fungal diseases could be expected, but
these were not assessed in the project. The product used contained Cu oxychloride, which is
used on crops other than wheat as a fungicide. A robust regime of fungicides was applied at
all sites. It is possible though that the increase in yield that was seen specifically in the Cu
treatment at Waterbeach (+1.4 t/ha) was due to a fungicidal effect of Cu oxychloride.
However, the rate of use as a fungicide is in fact about 20 times greater than used here.
Also, extra evidence that this was a severe shortage of Cu in the crop at this site is given by
the fact that the soil EDTA-extractable Cu was extremely low (0.79 mg/kg) compared to all
other 14 site/years (average 3.31 mg/kg) and the grain Cu concentration was only 1.81
mg/kg averaged across all treatments at Waterbeach (and 1.75 mg/kg in the untreated
control), compared to the average at other sites of 3.31 mg/kg.
We recorded no yield responses due to Mn, against 28 out of 79 trials (35%) reported by
Roques et al, (2013) in all UK cereals trials. However, only 2 out of 20 trials they
summarised for all cereals since 2005 responded to Mn, and 0 out of 16 winter wheat trials.
The latter result is very similar to our trials.
For Zn we recorded one responsive trial out of 15 (7%), compared with 6 out of 36 in all UK
cereals trials (17%) reported by Roques et al (2013). In trials since 2005, the latter authors
report that 3 out of 19 or 16% (two winter wheat and one winter barley) of trials responded to
Zn. It appears that the responsiveness in other trials to Zn in the UK since 2005 is slightly
greater than in our trials.

31
Critical values of micronutrients in soils or plants can be useful where applicable to help
predict where micronutrient applications are needed. Not enough responses occurred in this
study to help calibrate these values, but it is possible to compare the existing or suggested
values with our results. On this basis, the older ADAS values for EDTA-extractable Cu of
<2.5 mg/kg for organic soils and < 1.6 for other soils do not appear justified, as 5 sites would
be classed as “deficient” out of the 15 by soil analysis, but of these only one responded in
yield. That site, Waterbeach, had a soil value of 0.79 mg/kg, but the next lowest site was
Rothamsted with a soil of 1.0 mg/kg, and it did not respond. This appears to justify the lower
EDTA-extractable value for Cu of 1.0 mg/kg that appears in the Fertiliser Manual (2010). For
Zn, the Fertiliser Manual suggests 0.5 - 1.5 mg/kg EDTA-extractable for “susceptible crops”
and our data support 1.0 mg/kg as a critical value for high-yielding wheat.
Other methods for micronutrient analyses were performed on all the soil samples taken
before the spray treatments (Appendix Tables 2-4). Because there were not many yields
responses, detailed analysis of whether yields fitted one method better than another was not
possible. However, simple comparison of the results for the responsive and non-responsive
sites with those for different extracts was done, with the aim of finding out which extracts if
any were specific to those responses. For Cu, EDTA was correct in that Waterbeach gave
the lowest soil value (0.79 mg/kg) than any other site and responded in yield to Cu. For
DTPA, Cu was lowest at Bardney, and the same at Caythorpe as the responsive site. The
DGT technique stood out by showing by far the lowest Cu value at Waterbeach. For Zn,
EDTA correctly gave the lowest value for Morley which responded in yield to Zn. DTPA
correctly showed the lowest value (0.9 mg/kg) at Morley, but Caythorpe was close to this
(1.0 mg/kg) and did not respond. For DGT, as many as five sites showed lower Zn values
than the responsive site. From this rather limited response information, it seems that EDTA
and DGT are useful for Cu, and for Zn EDTA was more predictive than DTPA and
particularly DGT. Ammonium nitrate was also used as an extractant, but even with sensitive
ICP-MS analysis, the concentrations were too low to be reliable.
It is often thought that because of problems with a lack of availability of nutrients in the soil to
the crop due to physical, chemical and even crops factors (e.g. poor rooting), that analysis of
tissue samples may be more indicative of the bioavailability of micronutrients at particular
sites. Done early enough, on young green tissue, it enables enough lead time for fertilisers
to be included in sprays. Leaf analysis appears to be problematic, however, as it predicted
as many as 9 site/element combinations as below or very close to critical values (Section
3.2.4), and yet only one of these responded in yield to micronutrient applications (to Cu). A

32
total of 8 “false positives” therefore existed. The Cu-responsive site was Waterbeach with
3.91 mg/kg average leaf Cu, just under the 4 mg/kg suggested critical value. However, this
site responded to Cu with a large increase in yield and had a particularly low grain Cu
concentration. Caythorpe and Bardney did not respond, despite leaf concentrations of 3.68
and 4.07 respectively. The Morley site responded to Zn even though it had 32 mg/kg Zn in
leaves sampled in spring, against a critical concentration of 20 mg/kg (a “false negative”
result). It may not, therefore be useful to drop the critical value to 15 mg/kg as given in the
Fertiliser Manual. Put against this are three sites that had 17.3, 17.3 and 18.7 mg/kg EDTA
extractable Zn (Woburn 2011, 2012, Rothamsted 2012) and a Zn response was not
detected. But if the 15 mg/kg critical value is used, none of the sites would have been
flagged as “deficient”. This illustrates the difficulties of calibrating soil analyses values
against variable responses from field trials.
Another important aspect of field trials is their ability to detect yield increases. For
micronutrient responses, the magnitude appears to be relatively small (Roques et al, 2013).
We have shown that with this trial design including double the number of replicates in the
control treatments, on average a yield increase of 0.6 t/ha (8.3%) is needed before an effect
is likely to be statistically significant at P <0.05. This varies between sites, from 0.11 to 1.47
t/ha across our trials, due to many factors including soil variation, crop establishment and so
on. So, the ability to identify, say 0.2 – 0.3 t/ha increase is challenging, if that is a realistic
crop response to micronutrients. It may however, be very economic if that response is
obtained, as the cost of micronutrient spays may be recouped with less than 0.1 t/ha gain in
yield (Roques et al, 2013). There is therefore a disparity between the ability to detect yield
responses with standard experimental designs and the cost/benefit of even small yield
increases. An example of a response that was almost missed was Morley in 2012 that
responded to Zn spray with 0.27 t/ha increase in yield (P =0.04; Table 5). This significant
effect was only detected when the results were re-analysed with the 8 control plots
contrasted with the fourfold replicated micronutrient treatments. A yield effect of this size and
economic value would have been missed if the background variation at this site had not
been low. We have also shown that increasing the probability threshold from 0.05 to 0.10
creates more problems with potential “false positive” significant decreases, where yields
appear smaller than controls, but it is important to remember that this may be due to random
variation. For this reason it may not be acceptable to increase the number of these by
relaxing the probability threshold (Figure 5, Table 8).
Zinc deficiency affects around one-third of the world's population, (Hotz and Brown, 2004,)
particularly children. Lack of Zn affects brain function and mental development, depresses
33
the immune system increasing susceptibility to infectious diseases and causes delays in
physical development. There is therefore international interest in increasing the Zn
concentrations of staple foodstuffs, especially wheat and rice. A programme called
HarvestZinc (2012) has a target for biofortifiying Zn in wheat grain from the average 25
mg/kg to 33 mg/kg (HarvestZinc, 2012) and it is therefore of interest to compare the effect of
the spays used here on grain Zn. Control grain Zn on grouped calcareous or light sites
averaged 23 and 19.16 mg/kg respectively, and where Zn spray was applied these
increased to 24.69 and 21.29 mg/kg by REML analysis across years and sites (Table 15).
So, our “low” Zn sites started off with lower than the world average Zn concentration that
HarvestZinc organisation assume, and only increased by 1.7-2.1 mg/kg, rather than 8 mg/kg.
However, where our crops at individual sites responded significantly and specifically to Zn
sprays, the average increases were 2.20, 1.83, 4.42 and 5.47 mg/kg at Morley in 20120,
Woburn in 2011 and 2012, and Rothamsted in 2012 (Tables 12 - 14). To increase grain Zn
even more may require later sprays or a combination of sprays and soil applications
(Cakmak et al, 2010; McGrath et al, 2012). No specific responses in grain micronutrients
were found in 2010 and none for Cu and Mn, apart from Mn in the highly organic Prickwillow
site (Table 13).
Although there was no evidence of “growth dilution” of Zn concentrations in grain (Section
3.2.5), this is in fact a complex interaction between the amount of N applied and yield
(Gooding at al, 2012). In each of these experiments, a single amount of N was applied, but
what seems clear is that modern high-yielding varieties already have decreased
concentrations of Zn (Fan et al, 2008; Gooding et al, 2012). This dilution, due to increased
yield, has been observed for Cu and Mn (Fan et al, 2008; Gooding et al, 2012). However, in
our results there is no sign that just because micronutrient concentrations are low in grain
due to high yield that the crop responds in yield to these micronutrient sprays.
5.3. Conclusions
The objectives of this study pose the following questions and related conclusions:
Are soils changing in their Cu, Mn and Zn status? Small decreases in EDTA-extractable concentrations of Cu, and Zn in soils over 30 years
can be seen in the data. (c. 1 mg/kg), but this is not thought to be biologically significant. But
EDTA-extractable Mn decreased by 50 mg/kg in this period. However, EDTA-extractable Mn
is not used for diagnostic purposes. Total concentrations of Cu and Mn decreased, but total
34
Zn increased during this period. There is uncertainty in these apparent changes, as the
same geographical locations were not measured at each occasion.
Do high yielding wheat varieties respond more to Cu, Mn and Zn? Responses of winter wheat to micronutrients in terms of yield are rare and there were two
(Cu and Zn) in this set of 15 site/years of experiments, even though they were chosen to be
on soils where farmers are likely to apply micronutrients. However, the detailed data show
no indication that the higher yielding years/sites responded more to micronutrients. The size
of the yield responses observed were 0.27 (Zn) and 1.39 (Cu) t/ha.
Does the small size of yield responses for micronutrients make them difficult to detect? Yes, as the least significant differences in yield (P <0.05) in these 15 experiments ranged
from 0.11 – 1.47 t/ha (average 0.6 t/ha) depending on the site. In these trials, an average
yield response of 8.3% was needed to make the effect statistically significant at P =0.05. The
0.27 t/ha increase in grain yield due to Zn was only detectable due to a particular
experimental design and analysis used throughout which incorporates double control
(untreated) plots, and because that particular site had a low variability. It is possible that
economically useful responses (cost of micronutrient fertiliser/value of grain) are not
detected using standard experimental plot designs. We observed both positive and negative
economic impacts from using these materials, although most were not significant. Increasing
the significance threshold to P <0.10 increases the chances of categorising negative yield
responses as significant, and did not reveal any more significant yield increases in our
experiments. One other way to look at whether there were more true responses (even if not
statistically significant) is to simply look at yields in each treatment relative to control, and to
determine if there were more positive than negative responses in our data. However, there
was no evidence that this was the case in the 15 trials (Figure 4).
Does soil and leaf tissue analysis help predict when yield will be affected? Soil analysis appears to result in more correct recommendations for Cu and Zn than leaf
analysis in these particular experiments, but only if a 1 mg/kg EDTA-extractable critical
concentration is adopted for both micronutrients. Leaf analysis at GS30 appears to result in
more false positives, where low leaf analysis results do not always mean that there will be a
detectable yield benefit from micronutrient applications. The critical leaf Mn concentration
suggested in the Fertiliser Manual is 20 mg/kg and there were two sites below this, but they
did not respond to Mn applications. Similarly, it recommends a critical value of 15 mg/kg for
leaf Zn but no sites were below this in our results; indeed the responsive site had leaf

35
analysis values that were more than double the critical value. Our limited response data do
not suggest that leaf analysis in spring is useful.
Modern high-yielding wheats may have decreased micronutrient concentrations: is biofortification of grain Cu, Mn and Zn concentrations possible using standard sprays, for the benefit of animal and human health and nutrition? Only in the case of Zn, but not reliably, and in the magnitude of increase that is necessary to
boost nutrition. For Zn, a combination of soil and late foliar sprays may be needed to boost
grain Zn concentrations.
6. Acknowledgements
Sarah Dunham, Steve Freeman, Maureen Birdsey, Helen Yates and Jen Lines for their
technical support, the farmers who hosted some of our trials, and Dr Ben Marchant for
helping to classify which soils were agricultural according to EU Corrine Land Use data.
7. References
ADAS/MAFF 1984. Trace element deficiencies in field crops. Booklet 2197, HMSO.
ADAS/MAFF 1976. Advisory Paper No. 17: Trace Element Deficiencies in Crops. HMSO.
Alloway B.J. 2008. Micronutrient Deficiencies in Global Crop Production. Springer,
Heidelberg. 353 pp.
Cakmak I., Pfeiffer W.H., and McClafferty B. 2010 Biofortification of durum wheat with zinc
and iron. Cereal Chemistry 87: 10-20.
Chalmers A.G., Sinclair A.H., and Carver M. 1999. Nutrients other than NPK for cereals: A
review. HGCA Research Review 16. Home Grown Cereals Authority, London.
Emmett B.A., Reynolds B., Chamberlain P.M., Rowe E., Spurgeon D., Brittain S.A., Frogbrook Z., Hughes S., Lawlor A.J., Poskit, J., Potter E., Robinson D.A., Scott A., Wood C. and Woods C. 2010. Countryside Survey: Soils Report from 2007.
Technical Report No. 9/07 NERC/Centre for Ecology & Hydrology, 192pp.
Fan M.S., Zhao F.J., Fairweather-Tait S.J., Poulton P.R., Dunham S.J. and McGrath S.P. 2008. Evidence of decreasing mineral density in wheat grain over the last 160
years. Journal of Trace Elements in Medicine and Biology, 22:315–324.
FAO 2103. Wheat production statistics. http://faostat.fao.org/site/567/default.aspx#ancor
Fertiliser Manual 2010. RB209, 8th Edition. The Stationary Office, Norwich.

36
Garvin D.F., Welch R.M., and Finley J.W. 2006. Historical shifts in the seed mineral
micronutrient concentration of US hard red winter wheat germplasm. Journal of the
Science of Food and Agriculture, 86:2213–2220.
Gooding M.J., Fan M.S., McGrath S.P., Shewry P.R., and Zhao, F.J. 2012. Contrasting
effects of dwarfing alleles and N availability on mineral concentrations in wheat grain.
Plant and Soil, 360: 93-107.
HarvestZinc 2012. Exploring fertilizer use to increase zinc in cereals. http://harvestzinc.org/
Hotz C. and Brown K.H. 2004. Assessment of the risk of zinc deficiency in populations and
options for its control. Food Nutrition Bulletin, 25: 94-204.
Knight S., Kightley S., Bingham I., Hoad S., Lang B., Philpott H., Stobart R., Thomas J., Barnes A. and Ball B. 2012. Desk study to evaluate contributory causes of the current
‘yield plateau’ in wheat and oilseed rape. HGCA Project Report No. 502, HGCA,
Kenilworth.
MAFF 1986. The analysis of agricultural materials, third edition. Reference Book 427.
McGrath S.P. and Cunliffe C.H. 1985. A simplified method for the extraction of metals Fe,
Zn, Cu, Ni, Cd, Pb, Cr, Co and Mn from soils and sewage sludge. Journal of the
Science of Food and Agriculture, 36: 794-798.
McGrath S.P. and Loveland P.J. 1992. The Soil Geochemical Atlas of England and Wales.
Glasgow, Blackie.
McGrath S. P., Chambers B. J., Taylor M. J. and Carlton-Smith C. H. 2012. Biofortification of zinc in wheat grain by the application of sewage sludge. Plant and
Soil, 361: 97-108.
Mortvedt J.J., Giordano P.M. and Lindsay, W.L. 1972. Micronutrients in Agriculture.
Wisconsin, Soil Science Society of America.
Lindsay W. L. and Norvell W. A. 1978. Development of a DTPA soil test for zinc, iron,
manganese, and copper. Soil Science Society of America Journal, 42: 421-428.
Olsen S.R., Cole C.V., Watanabe F.S. and Dean L.A. 1954. Estimation of available
phosphorus in soils by extraction with sodium bicarbonate. US Department of
Agriculture, Circular No. 939.
Pruess A. 1998. Action values for mobile (NH4NO3-extractable) trace elements in soils
based on the German national standard DIN 19730. Advances in Geoecology, 31: 727-734.
Rengel Z. 1999. Mineral Nutrition of Crops: Fundamental Mechanisms and Implications.
Food Products Press, New York, 399 pp.
Roques S., Kendall S., Smith K., Newell Price P. and Berry P. 2013. A review of the non-
NPKS nutrient requirements of UK cereals and oilseed rape Research Review No. 78,
HGCA, Kenilworth.

37
RoTAP 2012. Review of Transboundary Air Pollution: Acidification, Eutrophication, Ground
Level Ozone and Heavy Metals in the UK. Contract Report to the Department for
Environment, Food and Rural Affairs. Centre for Ecology & Hydrology, Edinburgh.
Royal Society 2009. Reaping the benefits: science and the sustainable intensification of
global agriculture. Royal Society, London.
Scaife A. and Turner M. 1983. Turner Diagnosis of Mineral Disorders in Plants - V.2 –
Vegetables. Agricultural Research Council (Great Britain). H.M. Stationery Office, 95
pp.
Zhang H., Zhao F. J., Sun B., Davison W. and McGrath S. P. 2001. A new method to
measure effective soil solution concentration predicts copper availability to plants.
Environmental Science & Technology, 35: 2602-2607.
Zhao F., McGrath S.P. and Crosland A.R. 1994. Comparison of three wet digestion
methods for the determination of plant sulphur by inductively coupled plasma atomic
emission spectroscopy (ICP-AES). Communications in Soil Science and Plant
Analysis, 25: 407-418.
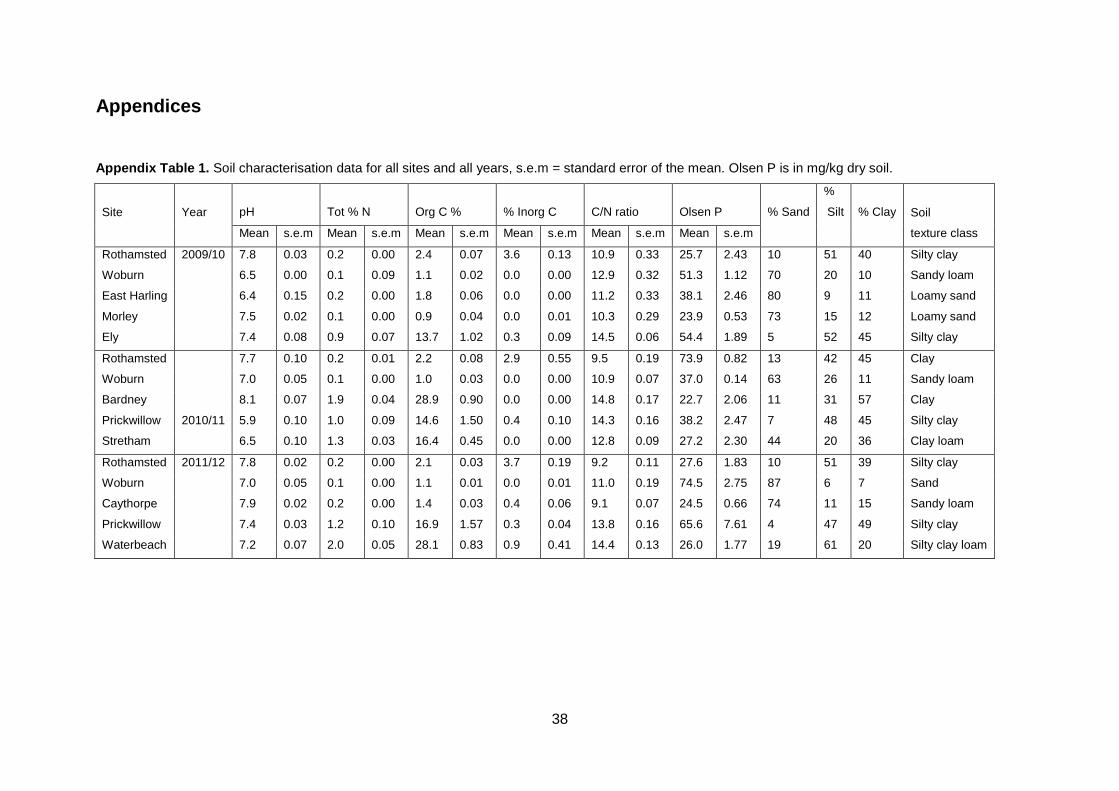
38
Appendices
Appendix Table 1. Soil characterisation data for all sites and all years, s.e.m = standard error of the mean. Olsen P is in mg/kg dry soil.
Site Year pH Tot % N Org C % % Inorg C C/N ratio Olsen P % Sand
%
Silt % Clay Soil
texture class Mean s.e.m Mean s.e.m Mean s.e.m Mean s.e.m Mean s.e.m Mean s.e.m
Rothamsted 2009/10 7.8 0.03 0.2 0.00 2.4 0.07 3.6 0.13 10.9 0.33 25.7 2.43 10 51 40 Silty clay
Woburn 6.5 0.00 0.1 0.09 1.1 0.02 0.0 0.00 12.9 0.32 51.3 1.12 70 20 10 Sandy loam
East Harling 6.4 0.15 0.2 0.00 1.8 0.06 0.0 0.00 11.2 0.33 38.1 2.46 80 9 11 Loamy sand
Morley 7.5 0.02 0.1 0.00 0.9 0.04 0.0 0.01 10.3 0.29 23.9 0.53 73 15 12 Loamy sand
Ely 7.4 0.08 0.9 0.07 13.7 1.02 0.3 0.09 14.5 0.06 54.4 1.89 5 52 45 Silty clay
Rothamsted
7.7 0.10 0.2 0.01 2.2 0.08 2.9 0.55 9.5 0.19 73.9 0.82 13 42 45 Clay
Woburn 7.0 0.05 0.1 0.00 1.0 0.03 0.0 0.00 10.9 0.07 37.0 0.14 63 26 11 Sandy loam
Bardney 8.1 0.07 1.9 0.04 28.9 0.90 0.0 0.00 14.8 0.17 22.7 2.06 11 31 57 Clay
Prickwillow 2010/11 5.9 0.10 1.0 0.09 14.6 1.50 0.4 0.10 14.3 0.16 38.2 2.47 7 48 45 Silty clay
Stretham 6.5 0.10 1.3 0.03 16.4 0.45 0.0 0.00 12.8 0.09 27.2 2.30 44 20 36 Clay loam
Rothamsted 2011/12 7.8 0.02 0.2 0.00 2.1 0.03 3.7 0.19 9.2 0.11 27.6 1.83 10 51 39 Silty clay
Woburn 7.0 0.05 0.1 0.00 1.1 0.01 0.0 0.01 11.0 0.19 74.5 2.75 87 6 7 Sand
Caythorpe 7.9 0.02 0.2 0.00 1.4 0.03 0.4 0.06 9.1 0.07 24.5 0.66 74 11 15 Sandy loam
Prickwillow 7.4 0.03 1.2 0.10 16.9 1.57 0.3 0.04 13.8 0.16 65.6 7.61 4 47 49 Silty clay
Waterbeach 7.2 0.07 2.0 0.05 28.1 0.83 0.9 0.41 14.4 0.13 26.0 1.77 19 61 20 Silty clay loam

39
Appendix Table 2. Year 1 (2009/10) Mean micronutrient concentrations in soil and leaf material measured pre-experimental treatment applications by total
acid digestion (Total) or using different soil extraction methods. The standard error of the mean is given in parentheses. Values in red are below or very close
to the criteria used in section 3.2.3 for deciding whether soils are likely to respond to micronutrient additions.
Method
Site
Rothamsted
(calcareous soil)
Woburn
(light soil)
East Harling
(light soil)
Morley
(light soil)
Ely
(organic soil)
Cu Mn Zn Cu Mn Zn Cu Mn Zn Cu Mn Zn Cu Mn Zn
Total (soil)
mg/kg
19.80
(0.79)
1176.00
(20.50)
106.90
(2.44)
10.32
(0.82)
369.50
(12.89)
62.73
(1.99)
10.91
(0.26)
98.85
(2.23)
71.08
(1.15)
10.43
(0.35)
313.90
(19.76)
57.30
(1.07)
39.87
(2.03)
606.10
(13.30)
83.77
(2.67)
EDTA (soil)
mg/kg
1.56
(0.17)
9.68
(0.50)
2.30
(0.17)
2.78
(0.29)
49.43
(3.45)
1.82
(0.04)
3.63
(0.13)
22.00
(1.05)
12.43
(5.00)
1.23
(0.07)
27.66
(2.22)
1.07
(0.05)
9.28
(0.63)
49.71
(5.64)
5.98
(0.37)
DTPA (soil)
mg/kg
1.79
(0.05)
14.20
(0.82)
1.73
(0.02)
1.21
(0.05)
7.84
(0.19)
1.40
(0.06)
1.61
(0.21)
7.60
(1.31)
1.04
(0.08)
1.05
(0.05)
12.29
(0.46)
0.90
(0.01)
3.63
(0.30)
15.26
(0.33)
2.88
(0.36)
NH4NO3
(soil) mg/kg
0.06
(0.01)
0.82
(0.05)
-0.03
(0.00)
0.02
(0.00)
4.69
(0.24)
0.01
(0.00)
0.02
(0.00)
7.38
(0.84)
0.63
(0.26)
0.04
(0.00)
1.91
(0.09)
-0.04
(0.00)
0.08
(0.00)
1.80
(0.07)
-0.02
(0.00)
DGT
µg/kg
0.84
(0.05)
123.70
(0.85)
0.15
(0.04)
1.61
(0.15)
296.00
(22.58)
0.67
(0.03)
1.63
(0.12)
136.30
(4.75)
4.60
(0.03)
0.95
(0.03)
326.40
(23.09)
0.39
(0.23)
1.18
(0.04)
24.90
(13.78)
0.46
(0.22)
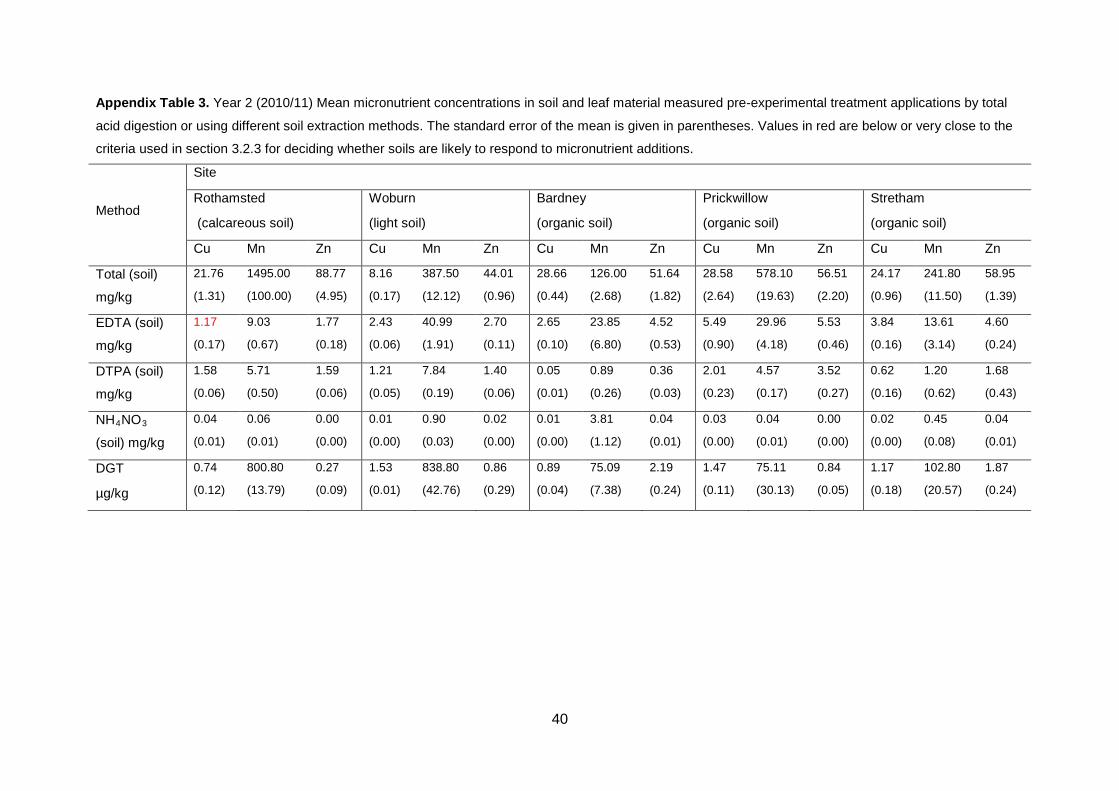
40
Appendix Table 3. Year 2 (2010/11) Mean micronutrient concentrations in soil and leaf material measured pre-experimental treatment applications by total
acid digestion or using different soil extraction methods. The standard error of the mean is given in parentheses. Values in red are below or very close to the
criteria used in section 3.2.3 for deciding whether soils are likely to respond to micronutrient additions.
Method
Site
Rothamsted
(calcareous soil)
Woburn
(light soil)
Bardney
(organic soil)
Prickwillow
(organic soil)
Stretham
(organic soil)
Cu Mn Zn Cu Mn Zn Cu Mn Zn Cu Mn Zn Cu Mn Zn
Total (soil)
mg/kg
21.76
(1.31)
1495.00
(100.00)
88.77
(4.95)
8.16
(0.17)
387.50
(12.12)
44.01
(0.96)
28.66
(0.44)
126.00
(2.68)
51.64
(1.82)
28.58
(2.64)
578.10
(19.63)
56.51
(2.20)
24.17
(0.96)
241.80
(11.50)
58.95
(1.39)
EDTA (soil)
mg/kg
1.17
(0.17)
9.03
(0.67)
1.77
(0.18)
2.43
(0.06)
40.99
(1.91)
2.70
(0.11)
2.65
(0.10)
23.85
(6.80)
4.52
(0.53)
5.49
(0.90)
29.96
(4.18)
5.53
(0.46)
3.84
(0.16)
13.61
(3.14)
4.60
(0.24)
DTPA (soil)
mg/kg
1.58
(0.06)
5.71
(0.50)
1.59
(0.06)
1.21
(0.05)
7.84
(0.19)
1.40
(0.06)
0.05
(0.01)
0.89
(0.26)
0.36
(0.03)
2.01
(0.23)
4.57
(0.17)
3.52
(0.27)
0.62
(0.16)
1.20
(0.62)
1.68
(0.43)
NH4NO3
(soil) mg/kg
0.04
(0.01)
0.06
(0.01)
0.00
(0.00)
0.01
(0.00)
0.90
(0.03)
0.02
(0.00)
0.01
(0.00)
3.81
(1.12)
0.04
(0.01)
0.03
(0.00)
0.04
(0.01)
0.00
(0.00)
0.02
(0.00)
0.45
(0.08)
0.04
(0.01)
DGT
µg/kg
0.74
(0.12)
800.80
(13.79)
0.27
(0.09)
1.53
(0.01)
838.80
(42.76)
0.86
(0.29)
0.89
(0.04)
75.09
(7.38)
2.19
(0.24)
1.47
(0.11)
75.11
(30.13)
0.84
(0.05)
1.17
(0.18)
102.80
(20.57)
1.87
(0.24)

41
Appendix Table 4. Year 3 (2011/12) Mean micronutrient concentrations in soil and leaf material measured pre-experimental treatment applications by total
acid digestion or using different soil extraction methods. The standard error of the mean is given in parentheses. Values in red are below or very close to the
criteria used in section 3.2.3 for deciding whether soils are likely to respond to micronutrient additions.
Method
Site
Rothamsted
(calcareous soil)
Woburn
(light soil)
Caythorpe
(light soil)
Prickwillow
(organic soil)
Waterbeach
(organic soil)
Cu Mn Zn Cu Mn Zn Cu Mn Zn Cu Mn Zn Cu Mn Zn
Total (soil)
mg/kg
19.91
(0.35)
1319.0
(32.1)
103.60
(0.76)
11.29
(0.34)
199.40
(5.85)
75.33
(0.55)
11.53
(0.38)
511.0
(7.1)
81.13
(2.25)
32.54
(1.11)
619.0
(19.6)
85.04
(0.89)
24.24
(1.31)
313.80
(34.68)
55.77
(3.84)
EDTA (soil)
mg/kg
1.00
(0.03)
15.45
(0.40)
1.72
(0.03)
3.54
(0.16)
9.35
(1.58)
5.94
(0.19)
1.75
(0.04)
64.86
(4.45)
2.36
(0.07)
5.47
(0.17)
24.89
(2.54)
8.28
(0.46)
0.79
(0.26)
3.85
(0.60)
2.92
(0.75)
DTPA (soil)
mg/kg
1.14
(0.03)
7.72
(0.40)
1.33
(0.02)
1.55
(0.11)
1.31
(0.05)
3.34
(0.22)
0.52
(0.01)
6.92
(0.59)
1.00
(0.02)
1.79
(0.06)
4.12
(0.09)
4.77
(0.39)
0.51
(0.03)
1.90
(0.23)
1.52
(0.05)
NH4NO3 (soil)
mg/kg
0.00
(0.00)
0.02
(0.00)
0.01
(0.00)
0.02
(0.00)
0.06
(0.00)
0.01
(0.00)
0.01
(0.00)
0.10
(0.06)
0.01
(0.00)
0.00
(0.00)
0.04
(0.01)
0.02
(0.00)
0.01
(0.00)
0.03
(0.00)
0.01
(0.00)
DGT
µg/kg
0.82
(0.02)
22.95
(4.91)
0.26
(0.10)
3.25
(0.34)
32.10
(17.57)
2.70
(0.40)
0.68
(0.05)
201.20
(31.78
0.24
(0.09)
1.51
(0.13)
23.67
(2.12)
1.29
(0.09)
0.28
(0.02)
80.61
(23.50)
0.14
(0.06)

42
Appendix Table 5. Average monthly temperatures and rainfall for Rothamsted and Woburn 2010 (Departure
from 30-year means (1971 - 2000) in brackets).
Rothamsted 2010 Woburn 2010
Average Rainfall Average Rainfall
temp °C mm temp °C mm
January 1.18 (-2.42) 47.3 (-22.32) 1.2 (-2.66) 44.8 (-10.68)
February 2.85 (-0.87) 77.2 (+28.44) 2.9 (-1.02) 79.6 (+38.80)
March 6.18 (+0.26) 45.2 (-8.72) 6.4 (+0.29) 35.2 (-14.37)
April 8.94 (+1.16) 18.7 (-34.83) 9.1 (+1.29) 19.8 (-32.80)
May 10.54 (-0.50) 38.4 (-11.33) 10.9 (-0.19) 55.8 (+3.07)
June 15.56 (+1.65) 23.5 (-36.71) 15.4 (+1.41) 38.0 (-20.79)
July 17.99 (+1.60) 31.6 (-10.41) 18.2 (+1.78) 16.8 (-28.84)
August 15.77 (-0.62) 127.6 (+73.87) 16.1 (-0.27) 151.8 (+97.30)
September 13.82 (+0.10) 59.7 (-1.31) 14.0 (+0.18) 51.0 (-7.44)
October 10.47 (+0.28) 84.9 (+10.25) 10.8 (+0.52) 46.4 (-18.27)
November 5.13 (-1.22) 54.8 (-11.40) 5.0 (-1.56) 34.0 (-23.37)
December -0.33 (-4.88) 35.3 (-34.80) -0.7 (-5.45) 18.0 (-41.67)
Year 9.01 (-0.45) 644.2 (-59.4) 10.0 (-0.02) 573.2 (-17.37)
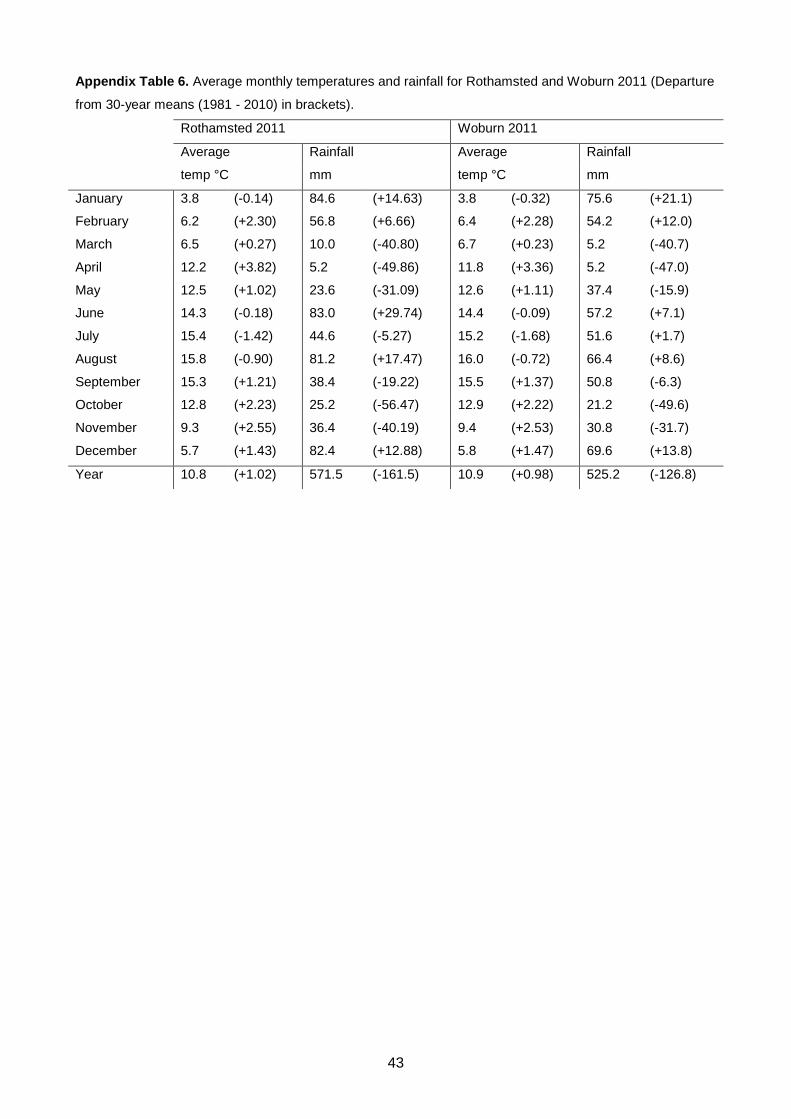
43
Appendix Table 6. Average monthly temperatures and rainfall for Rothamsted and Woburn 2011 (Departure
from 30-year means (1981 - 2010) in brackets).
Rothamsted 2011 Woburn 2011
Average Rainfall Average Rainfall
temp °C mm temp °C mm
January 3.8 (-0.14) 84.6 (+14.63) 3.8 (-0.32) 75.6 (+21.1)
February 6.2 (+2.30) 56.8 (+6.66) 6.4 (+2.28) 54.2 (+12.0)
March 6.5 (+0.27) 10.0 (-40.80) 6.7 (+0.23) 5.2 (-40.7)
April 12.2 (+3.82) 5.2 (-49.86) 11.8 (+3.36) 5.2 (-47.0)
May 12.5 (+1.02) 23.6 (-31.09) 12.6 (+1.11) 37.4 (-15.9)
June 14.3 (-0.18) 83.0 (+29.74) 14.4 (-0.09) 57.2 (+7.1)
July 15.4 (-1.42) 44.6 (-5.27) 15.2 (-1.68) 51.6 (+1.7)
August 15.8 (-0.90) 81.2 (+17.47) 16.0 (-0.72) 66.4 (+8.6)
September 15.3 (+1.21) 38.4 (-19.22) 15.5 (+1.37) 50.8 (-6.3)
October 12.8 (+2.23) 25.2 (-56.47) 12.9 (+2.22) 21.2 (-49.6)
November 9.3 (+2.55) 36.4 (-40.19) 9.4 (+2.53) 30.8 (-31.7)
December 5.7 (+1.43) 82.4 (+12.88) 5.8 (+1.47) 69.6 (+13.8)
Year 10.8 (+1.02) 571.5 (-161.5) 10.9 (+0.98) 525.2 (-126.8)

44
Appendix Table 7. Average monthly temperatures and rainfall for Rothamsted and Woburn 2012 (Departure
from 30-year means (1981 - 2010) in brackets).
Rothamsted 2012 Woburn 2012
Average Rainfall Average Rainfall
temp °C mm temp °C mm
January 5.5 (+1.51) 58.0 (-11.97) 5.5 (+1.39) 35.0 (-19.53)
February 3.3 (-0.67) 24.7 (-25.44) 3.2 (-0.90) 18.6 (-23.56)
March 7.9 (+1.67) 34.7 (-16.13) 7.7 (+1.20) 27.0 (-18.91)
April 7.4 (-0.90) 168.6 (+113.57) 7.7 (-0.74) 132.0 (+79.79)
May 12.0 (+0.53) 52.6 (-2.08) 12.0 (+0.46) 68.8 (+15.54)
June 13.8 (-0.62) 166.5 (+113.21) 14.0 (-0.49) 149.0 (+98.93)
July 15.7 (-1.10) 128.4 (+78.57) 16.1 (-0.76) 76.0 (+26.11)
August 17.2 (+0.54) 54.9 (-8.82) 17.5 (+0.74) 56.6 (-1.20)
September 13.3 (-0.76) 40.4 (-17.27) 13.6 (-0.55) 41.2 (-15.91)
October 9.7 (-0.92) 115.8 (+34.13) 9.8 (-0.89) 112.0 (+41.17)
November 6.5 (-0.28) 100.4 (+23.79) 6.6 (-0.25) 90.2 (+27.73)
December 4.5 (+0.20) 114.2 (+44.67) 4.8 (+0.44) 98.8 (+43.05)
Year 9.7 (-0.07) 1059.2 (+326.23) 12.2 (+0.22) 905.2 (+253.20)