current population reports household … · data collection activities were carried out by bureau...
TRANSCRIPT
• CURRENT POPULATION REPORTS
Household Economic Studies P70-33
by John M. McNeil
U.S. Department of Commerce Economics and Statistics Administration
BUREAU OF THE CENSUS

Acknowledgments
This report was prepared under the general direction of Charles Nelson, Assistant Division Chief for Economic Characteristics. Word processing assistance was provided by Elalne Anderson and Brenda Wiiiiams-Hoimes.
Peter Slegel and Stephen Mack of the Demographic Statistical Methods Division conducted the sampling review. Data collection activities were carried out by Bureau of the Census field representatives under the overall direction of Paula J. Schnelder, Chief, Field Division.
The staff of the Administrative and Publications Services Division, Walter C. Odom, Chief, performed publication planning, design, composition, editorial review, and printing planning and procurement. Frances B. Scott provided publication coordination and editing.

CURRENT POPULATION REPORTS
Household Economic Studies P70-33
Issued December 1993
by John M. McNeil
U.S. Department of Commerce Ronald H. Brown, Secretary
Economics and Statistics Administration Paul A. London, Acting Under Secretary
for Economic Affairs
BUREAU OF THE CENSUS Harry A. Scarr, Acting Director

Economics and Statistics Administration
Paul A. London, Acting Under Secretary for Economic Affairs
SUGGESTED CITATION
BUREAU OF THE CENSUS Harry A. Scarr, Acting Director
Wllllam P. Butz, Associate Director for Demographic Programs
HOUSING AND HOUSEHOLD ECONOMIC STATISTICS DIVISION Dllnlel H. Weinberg, Chief
McNeil, John M., Americans With Disabilities: 1991-92 U.S. Bureau of the Census. Current P~lation Reports, P70-33, U.S. Government Printing Office, Washington, DC, 1993.
For sale by Superintendent of Documents, U.S. Government Printing Office, Washington, DC 20402.

Contents
Page
Introduction......................................................................................... 1 The Role of the Environment in Determining Disability Status . . . . . . . . . . . . . . . . . . . . . . . . . . . . . . . . . 3 Highlights. . . . . . . . . . . . . . . . . . . . . . . . . . . . . . . . . . . . . . . . . . . . . . . . . . . . . . . . . . . . . . . . . . . . . . . . . . . . . . . . . . . . . . . . . . . 3 Prevalence of Disability by Type. . . . . . . . . . . . . . . . . . . . . . . . . . . . . . . . . . . . . . . . . . . . . . . . . . . . . . . . . . . . . . . . . . 5 Age, Sex, and Disability ...... ·..................................................................... 8 Race, Hispanic Origin, and Disability . . . . . . . . . . . . . . . . . . . . . . . . . . . . . . . . . . . . . . . . . . . . . . . . . . . . . . . . . . . . . 1 O Education and Disability. . . . . . . . . . . . . . . . . . . . . . . . . . . . . . . . . . . . . . . . . . . . . . . . . . . . . . . . . . . . . . . . . . . . . . . . . . . 11 Low-Income Status and Disability . . . . . . . . . . . . . . . . . . . . . . . . . . . . . . . . . . . . . . . . . . . . . . . . . . . . . . . . . . . . . . . . 11 Employment and Disability . . . . . . . . . . . . . . . . . . . . . . . . . . . . . . . . . . . . . . . . . . . . . . . . . . . . . . . . . . . . . . . . . . . . . . . . 11 Health Insurance Coverage Status and Disability . . . . . . . . . . . . . . . . . . . . . . . . . . . . . . . . . . . . . . . . . . . . . . . 13 Conditions Causing Disabilities . . . . . . . . . . . . . . . . . . . . . . . . . . . . . . . . . . . . . . . . . . . . . . . . . . . . . . . . . . . . . . . . . . . 13 Disability Status of Children . . . . . . . . . . . . . . . . . . . . . . . . . . . . . . . . . . . . . . . . . . . . . . . . . . . . . . . . . . . . . . . . . . . . . . . 13 Other Sources of Data on Disability Status . . . . . . . . . . . . . . . . . . . . . . . . . . . . . . . . . . . . . . . . . . . . . . . . . . . . . . 14 User Comments.................................................................................... 14 References . . . . . . . . . . . . . . . . . . . . . . . . . . . . . . . . . . . . . . . . . . . . . . . . . . . . . . . . . . . . . . . . . . . . . . . . . . . . . . . . . . . . . . . . . 14
TEXT TABLES
A. Disability Status, by Sex and Age: 1991-92 . . . . . . . . . . . . . . . . . . . . . . . . . . . . . . . . . . . . . . . . . . . . . . 5 B. Persons 15 Years Old and Over Having Difficulty With or Unable to Perform
Specified Functional Activities: 1991-92................................................. 6 C. Persons 15 Years Old and Over Having Difficulty With or Needing Personal
Assistance With Activities of Daily Living (AOL's): 1991-92............................ 7 D. Persons 15 Years Old and Over Having Difficulty With or Needing Personal
Assistance With Instrumental Activities of Daily Living (IADL's): 1991-92 . . . . . . . . . . . . 8 E. Persons by Age and Selected Measures of Disability Status: 1991-92.. .. . . .. . . .. . .. . . 9
FIGURES -
1. Percent of Persons With a Disability and With a Severe Disability, by Age: 1991-92 . 1 O 2. Sex and Age Composition of Persons With a Disability: 1991-92....................... 1 O 3. Sex and Age Composition of Persons With a Severe Disability: 1991-92 . . . . . . . . . . . . . . 1 O 4. Percent of Persons 15 to 64 Years Old With a Disability and With a Severe
Disability, by Race and Hispanic Origin: 1991-92. . . . . . . . . . . . . . . . . . . . . . . . . . . . . . . . . . . . . . . 11 5. Percent of Persons 15 Years Old and Over With Low Incomes, by Age and
Disability Status: 1991-92 . . . . . . . . . . . . . . . . . . . . . . . . . . . . . . . . . . . . . . . . . . . . . . . . . . . . . . . . . . . . . . . 12 6. Percent of Persons 21 to 64 Years Old With a Job or Business, by Sex and
Disability Status: 1991-92 . . . . . . . . . . . . . . . . . . . . . . . . . . . . . . . . . . . . . . . . . . . . . . . . . . . . . . . . . . . . . . . . 12
iii
iv
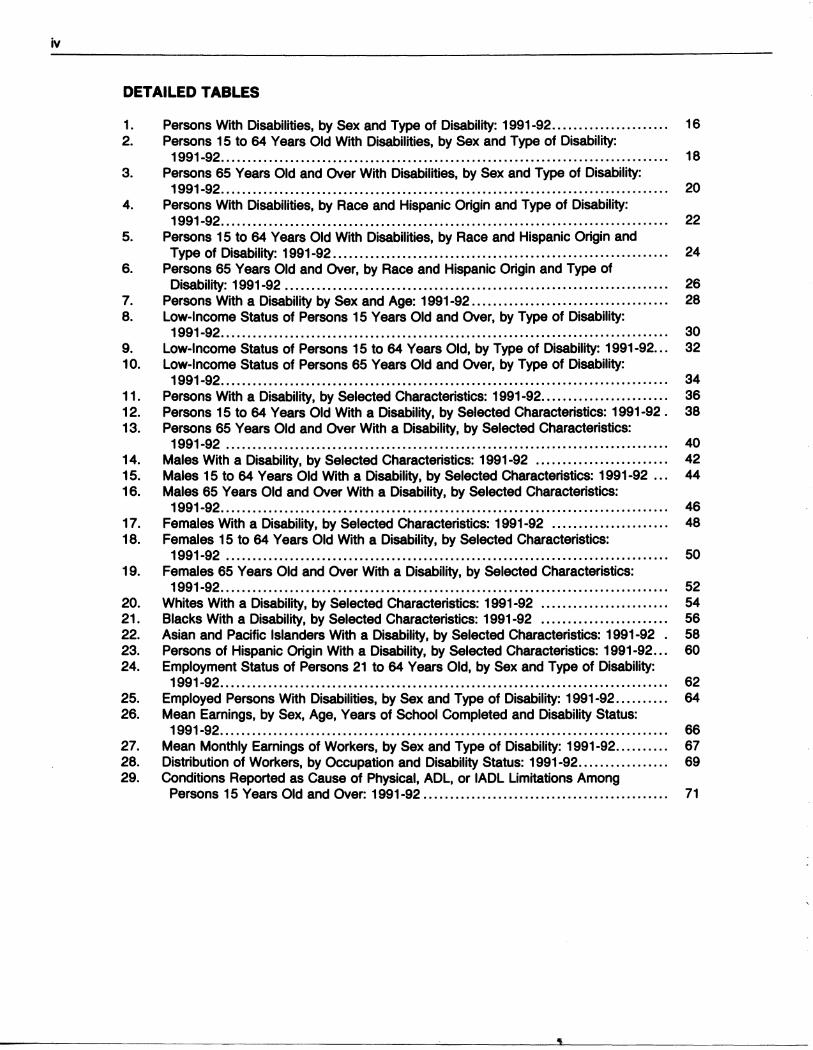
DETAILED TABLES
1. Persons With Disabilities, by Sex and Type of Disability: 1991-92...................... 16 2. Persons 15 to 64 Years Old With Disabilities, by Sex and Type of Disability:
1991-92.............................. .. . . . . . . . . . . . . . . . . . . . . . . . . . . . . . . . . . . . . . . . . . . . . . . . . . . . . 18 3. Persons 65 Years Old and Over With Disabilities, by Sex and Type of Disability:
1991-92.. .... ....... ....... .... ... . ... .... .... ........ .... .... .... .... ......... ... . . . ... . .. 20 4. Persons With Disabilities, by Race and Hispanic Origin and Type of Disability:
1991-92.................................................................................... 22 5. Persons 15 to 64 Years Old With Disabilities, by Race and Hispanic Origin and
Type of Disability: 1991-92. . . . . . . . . . . . . . . . . . . . . . . . . . . . . . . . . . . . . . . . . . . . . . . . . . . . . . . . . . . . . . . 24 6. Persons 65 Years Old and Over, by Race and Hispanic Origin and Type of
Disability: 1991-92 . . . . . . . . . . . . . . . . . . . . . . . . . . . . . . . . . . . . . . . . . . . . . . . . . . . . . . . . . . . . . . . . . . . . . . . . 26 7. Persons With a Disability by Sex and Age: 1991-92..................................... 28 8. Low-Income Status of Persons 15 Years Old and Over, by Type of Disability:
1991-92. .... ... ... .... .... ... . .... ... .... .... ... ........ .... ......... .... ..... .... ...... ... 30 9. Low-Income Status of Persons 15 to 64 Years Old, by Type of Disability: 1991-92... 32 10. Low-Income Status of Persons 65 Years Old and Over, by Type of Disability:
1991-92........... .... ............ ... ....................... ........ ........ ..... .......... 34 11. Persons With a Disability, by Selected Characteristics: 1991-92........................ 36 12. Persons 15 to 64 Years Old With a Disability, by Selected Characteristics: 1991-92. 38 13. Persons 65 Years Old and Over With a Disability, by Selected Characteristics:
1991-92 . . . . . . . . . . . . . . . . . . . . . . . . . . . . . . . . . . . . . . . . . . . . . . . . . . . . . . . . . . . . . . . . . . . . . . . . . . . . . . . . . . . 40 14. Males With a Disability, by Selected Characteristics: 1991-92 . . . . . . . . . . . . . . . . . . . . . . . . . 42 15. Males 15 to 64 Years Old With a Disability, by Selected Characteristics: 1991-92 ... 44 16. Males 65 Years Old and Over With a Disability, by Selected Characteristics:
1991-92.................................................................................... 46 17. Females With a Disability, by Selected Characteristics: 1991-92 . . . . . . . . . . . . . . . . . . . . . . 48 18. Females 15 to 64 Years Old With a Disability, by Selected Characteristics:
1991-92 . . . . . . . . . . . . . . . . . . . . . . . . . . . . . . . . . . . . . . . . . . . . . . . . . . . . . . . . . . . . . . . . . . . . . . . . . . . . . . . . . . . 50 19. Females 65 Years Old and Over With a Disability, by Selected Characteristics:
1991-92. .... .... ... . ... . ... . ........ .... ........ .... ... . ......... ..... ..... ....... ... . . ... . 52 20. Whites With a Disability, by Selected Characteristics: 1991-92 . . . . . . . . . . . . . . . . . . . . . . . . 54 21. Blacks With a Disability, by Selected Characteristics: 1991-92 . . . . . . . . . . . . . . . . . . . . . . . . 56 22. Asian and Pacific Islanders With a Disability, by Selected Characteristics: 1991-92 . 58 23. Persons of Hispanic Origin With a Disability, by Selected Characteristics: 1991-92... 60 24. Employment Status of Persons 21 to 64 Years Old, by Sex and Type of Disability:
1991-92. ... . ..... ..... ... .... ..... ............ ..... ... .... ... ........ .... .... ..... ...... ... 62 25. Employed Persons With Disabilities, by Sex and Type of Disability: 1991-92...... .... 64 26. Mean Earnings, by Sex, Age, Years of School Completed and Disability Status:
1991-92.................................................................................... 66 27. Mean Monthly Earnings of Workers, by Sex and Type of Disability: 1991-92. ... . . . ... 67 28. Distribution of Workers, by Occupation and Disability Status: 1991-92..... ..... ....... 69 29. Conditions Reported as Cause of Physical, AOL, or IADL Limitations Among
Persons 15 Years Old and Over: 1991-92 ... ......... ....... ..... .... ..... ..... ........ 71

v
30. Conditions Reported as Cause of Physical, AOL, or IADL Limitations Among Persons 15 to 64 Years Old: 1991-92.... .................................. ......... .... 72
31. Conditions Reported as Cause of Physical, AOL, or IADL Limitations Among Persons 65 Years Old and Over: 1991-92 ........................... ................... 73
32. Conditions Reported as Cause of Physical, AOL, or IADL Limitations Among Males 15 Years Old and Over: 1991-92 ........................................................ 74
33. Conditions Reported as Cause of Physical, AOL, or IADL Limitations Among Females 15 Years Old and Over: 1991-92............... .... ........................... 75
34. Disability Status of Children Oto 17 Years Old, by Sex: 1991-92.................... ... 76 35. Disability Status of Children O to 17 Years Old, by Race and Hispanic Origin:
1991-92-.................................................................................... 77 36. Conditions Reported as Cause of Disability Among Children O to 17 Years Old:
1991-92.................................................................................... 78
APPENDIXES
A. Definitions and Explanations . . . . . . . . . . . . . . . . . . . . . . . . . . . . . . . . . . . . . . . . . . . . . . . . . . . . . . . . . . . . . . A-1 B. Source and Accuracy of Estimates . . . . . . . . . . . . . . . . . . . . . . . . . . . . . . . . . . . . . . . . . . . . . . . . . . . . . . . B-1 C. Facsimiles of SIPP Topical Module Questions on Disability Status ..................... C-1

1
Americans With Disabilities: 1991-92
INTRODUCTION
This report presents data on the disability status of the noninstitutional population of the United States. The source of the data is a combined sample from the 1990 and 1991 panels of the Survey of Income and Program Participation (SIPP). A topical module (or supplement) containing an extensive set of questions about disability status was asked as part of the sixth wave of the 1990 panel and the third wave of the 1991 panel. Both of these waves were in the field during the last 3 months of 1991 and the first month of 1992. The total sample size for this study was approximately 30,000 interviewed households. Estimation procedures were used to inflate weighted sample results to independent estimates of the civilian noninstitutional population of the United States.
All demographic surveys, including SIPP, suffer from undercoverage of the population. This undercoverage results from missed housing units and missed persons within sample households. Compared to the level of the 1980 decennial census, overall undercoverage is about 7 percent. Undercoverage varies with age, sex, and race. For some groups, such as 20 to 24 year old Black males, the undercoverage is as high as 35 percent. The weighting procedures used by the Census Bureau partially correct for the bias due to undercoverage. However, its final impact on estimates is unknown. For details, see appendix B.
The term "disability" can be defined narrowly or broadly depending on the interest of the analyst. An example of a narrow definition is found in the Social Security Disability Insurance Program (SSDI). Under this program, persons are considered disabled if they are "unable to engage in substantial gainful activity." The disability determina~on process under the SSDI recognizes that medical conditions are not the only factors that affect work disability and takes into consideration other factors including age, education, and work history. A broader definition of disability is found in the Americans With Disabilities Act of 1990 (ADA). Under the ADA, an individual is considered to have a disability if the person: (a) has a physical or mental impairment that substantially limits one or more of the major life activities; (b) has a record of such an impairment; or (c) is regarded as having such as impairment.
The definitions above and the disability statistics that are presented in this report can be better understood by
placing them in a conceptual framework. Perhaps the most important work in the area of a conceptual framework for disability is that of Saad Nagi. Nagi's framework consists of four interrelated concepts: active pathology, impairment, functional limitation, and disability. Nagi's framework was restated in the 1991 report Disability in America, edited by Andrew Pope and Alvin Tarlov.
1. Active pathology involves an interference with normal processes and the simultaneous efforts of the organism to regain a normal state.
2. Impairment involves a loss or abnormality of an anatomical, physiological, mental or emotional nature. Impairments include: (a) all conditions of pathology; (b) residual losses or abnormalities following an active state of pathology; and (c) abnormalities not associated with pathology (congenital formations).
3. Functional limitations refer to limitations which are manifested at the level of the organism as a whole (e.g., seeing, hearing, reaching, walking, performing basic mental tasks).
4. Disability refers to limitations in performing socially defined roles and tasks in such spheres as interpersonal relationships, family life, education, recreation, self-care, and work.
A second conceptual framework has been developed by Philip Wood for the World Health Organization as part of the International Classification of Impairments, Disabilities, and Handicaps (ICIDH). The ICIDH was developed as an extension of the International Classification of Diseases (ICD) and provides a detailed classification system for three concepts: impairments, disabilities, and handicaps. The ICIDH is not a finished system and a considerable amount of work is currently being devoted to improving certain aspects of the system especially the handicap concept and the classificatiqn of handicaps. Under the ICIDH, impairments are concerned with abnormalities of body structure, organ or system function, and appearance; disabilities reflect the consequences of the impairment in terms of functional performance; and handicaps are concerned with the disadvantages experienced by an individual as a result of impairments and disabilities and the interaction of the individual with his or her surroundings.

2
A recent report examined the applications of the ICIDH to household disability surveys and proposed a recommended minimum set of questions for such surveys. The recommended set is actually very close to the questions that are described as functional limitation questions in this study [McNeil, 1991 a].
The SIPP questions that were used to determine disability status for this study can be grouped into 12 categories (questions in categories 1-11 are reproduced in appendix C):
1. Questions for persons 15 years old and over about the use of special aids: canes, crutches, walkers, and wheelchairs.
2. Questions for persons 15 years old and over about difficulty with sensory and physical functional activities: seeing, hearing, having one's speech understood, lifting and carrying, walking up a flight of stairs, and walking a qoarter of a mile. When a person was identified as having difficulty with a particular functional activity, a follow-up question asked if the person could perform the activity at all.
3. Questions for persons 15 years old'and over about difficulty with Activities of Daily Living (AOL's): getting around inside the home, getting in or out of a bed or chair, taking a bath or shower, dressing, eating, and using the toilet. When a person was identified as having difficulty with a particular AOL, a follow-up question asked if the person needed the help of another person with that activity.
4. Questions for persons 15 years old and over about difficulty with Instrumental Activities of Daily Living (IADL's): going outside the home, keeping track of money or bills, preparing meals, doing light housework, and using the telephone. For the first four IADL's, a follow-up question about the need for personal assistance was asked when a person was identified as having difficulty with that activity. When a person was identified as having difficulty using the telephone, a follow-up question asked if the person was able to use the telephone at all.
· 5. Questions for persons 15 years old and over about the existence of -specific conditions including: (a) dyslexia; (b) mental retardation; (c) developmental disabilities such as autism or cerebral palsy; (d) Alzheimer's disease, seniljty, or dementia; and (e) any other mental or emotional condition.
6. A question for persons 16 to 67 years old about the presence of a physical, mental, or other health condition that limits the kind or amount of work the person can do. When a person was identified as having a work disability, a follow-up question asked if the person was prevented from working at a job or business.
7. A question for persons 16 years old and over about the presence of a physical, mental, or other health condition that limits the kind or amount of housework the person can do. When a person was identified as having a houseworl~ disability, a follow-up question asked if the person was prevented from doing work around the house.
8. A question asked of parents of children under 6 years about whether the children had any limita
. tions at all in the usual kind of activities done by most children their age.
9. A question asked bf parents of children under 6 years about whether the children had received therapy or diagnostic services designed to meet their developmental needs.
1 O. A question asked of parents of children 6 to 21 years old about whether the children had limitations in their ability to do regular school work.
11. A question asked of parents of children 3 to 14 years old about whether the children had a long lasting condition that limited their ability to walk, run, or use stairs.
12. Questions which identified persons who were receiving Supplemental Security Income or Medicare benefits on the basis of their disability status.
In terms of Nagi's conceptual framework, categories 1, 2, and 11 are measures of functional limitations; categories 3, 4, and 7 are measures of self-care or family life disabilities; categories 6 and 12 are measures of work disability; category 1 O is a measure of education disability; categories 8 and 9 are measures of disability for young children; and category 5 is a measure of the presence of specific impairments.
When a person was identified as having a physical functional limitation or an AOL or IADL limitation, a follow-up question asked the respondent to examine a printed list of conditions and select the condition or set of conditions that caused the limitation. The condition question was also asked for persons identified as having a work or housework disability. A similar follow-up question, with a different conditions list, was asked of parents of children identified as having a limitation or disability.
For the purpose of this study, a person was considered to have a disability if the person was identified by any of the questions described in the 12 categories above (except that persons who used a cane, crutches, or a walker, but who had used such an aid for less than 6 months and who were not identified by any other item were not considered to have a disability). The category of persons with a severe disability includes the following:
1. Persons 15 years old and over who used a wheelchair or who had used a cane, crutches, or a walker for 6 months or longer.

2. Persons 15 years old and over who were unable to perform one or more functional activities or who needed the help of another person with an AOL or an IADL.
3. Persons 16 to 67 years old who were prevented from working at a job or business.
4. Persons 16 years old and over who were prevented from doing work around the house.
5. Persons 15 years old and over with mental retardation, a developmental disability such as autism or cerebral palsy, or Alzheimer's disease, senility, or dementia (either measured directly or cited as a condition causing a limitation or disability).
6. Persons O to 21 years old with autism, cerebral palsy, or mental retardation (cited as a condition causing a limitation or disability).
THE ROLE OF THE ENVIRONMENT IN DETERMINING DISABILITY STATUS
When the Chairman of Disabled People International was asked to comment on the conceptual framework underlying the ICIDH, he provided the following statement [Enns, 1989):
"Whereas disability has too long been viewed as a problem of the individual and not the relationship between an individual and his/her environment, it is necessary to distinguish between:
a. disability as the functional limitation within the individual caused by physical, mental, or sensory impairments; and
b. handicap as the loss or limitation of opportunities to take part in the normal life of the community on an equal level with others due to physical and social barriers."
An understanding of the role of the environment (the extent to which physical and social barriers exist) is critical to any attempt to define disability or handicap [McNeil, 1991 b]. ·
Using Nagi's framework, impairments that lead to functional limitations or disabilities under one set of environmental conditions need not lead to functional limitations or disabilities under another set. An almost universal example of an enabling environmental factor that reduces the effect of impairments is corrective lenses. Other examples of enabling environmental factors include wheelchairs, electric scooters, elevators, lifts, ramps, and telecommunication relay services.
The SIPP disability questions do not explicitly address the issues of physical and social barriers. There are no specific questions about barriers within the home, community, school, or workplace; there are no specific
3
questions about the accessibility of transportation systems or other services within the community; and there are no specific questions about experiences with discrimination.
There is a need to develop household survey questions that explicitly address the issues of physical and social barriers. There is a hope that this process will be moved forward by the work currently being done by the Quebec Committee on the ICIDH on improving the "handicap" portion of the ICIDH [Fougeyrollas].
The fact that survey questions do not explicitly address the issues of physical and social barriers does not mean that survey results cannot be used to measure changes in those barriers. If, over a period of years, we learn that the relative employment rate and earnings of persons who use wheelchairs has risen, then we can infer that there has been some reduction in barriers. An important element that will be missing is a measure of where in the process the barrier reduction(s) occurred.
HIGHLIGHTS
(The figures in parentheses denote 90-percent confidence intervals.)
• Based on interviews conducted during the October 1991-January 1992 period, the number of persons with a disability (primarily defined as a limitation in a functional activity or in a socially defined role or task) was 48.9 ( +O. 7) million, or 19.4 ( +0.3) percent of the total population of 251.8 million. This figure excludes persons living in nursing homes or other institutions. The definition of disability used in this study is broader than that used in other Bureau of the Census reports that show data on disability status. The 1990 census, for example, contained only questions on work disability, mobility limitations, and self-care limitations, and disability estimates from the March Current Population Survey refer only to persons. with a work disability.1
1 According to the 1990 census, there were 12.8 million civilian noninstitutional persons 18 to 64 years of age with a work disability; 6.6 million of these persons were prevented from working by their disability. The 1990 census also showed that 13.2 million civilian noninstitutional persons 16 years old and over had a mobility or self-care limitation. Data from the March 1992 Current Population Survey, published in Poverty in the United States: 1991, Series P-60, No. 181, show 14.9 million persons 16 to 64 years with a work disability, 8.4 million of whom were classified as having a severe work disability. Disability data from the 1964 panel of the Survey of Income and Program Participation were published in Disability, Functional Limitation, and Health Insurance Coverage: 1964/85, Series P-70, No. 8. A set of questions in that survey asked about any difficulty performing nine activities (seeing, hearing, speaking, lifting and carrying, walking, using stairs, getting around outside, getting around inside, and getting into and out of bed). The number of persons 15 years old and over who had difficulty with one or more of these activities was 37 .3 million.

4
• The number of persons with a severe disability (primarily defined as an inability to perform one or more functional activities or one or more socially defined roles or tasks) was 24.1 (±0.5) million, or 9.6 (±0.2) percent of the population.
• The survey collected information on six categories of functional activities including seeing, hearing, speaking, lifting and carrying, climbing stairs, and walking. Among persons 15 years old and over, 34.2 (±0.6) million had difficulty performing one or more functional activities. Of this number, 15.2 (±0.4) million were unable to perform one or more of these activities.
• Among persons 15 years old and over, 9. 7 ( +0.4) million had difficulty seeing the words and letters in ordinary newsprint even when wearing corrective lenses. Of this total, 1.6 (+0.1) million could not see such words and letters at all.
• The number of persons 15 years old and over who had difficulty hearing what was said in a normal conversation with another person was 10.9 (±0.4) million, and 0.9 (±0.1) million of these persons were completely unable to hear what was said in such a conversation.
• The survey collected information on six categories of Activities of Daily Living (AOL's): getting around inside the home, getting in or out of a bed or chair, taking a bath or shower, dressing, eating, and toileting. The number of persons 15 years old and over reporting some difficulty with one or more AOL's was 7.9 (+0.3) million. Of this total, the number who needed personal assistance with one or more AOL's was 3.9 (±0.2) million.
• Of the 3.9 (±0.2) million needing assistance with an AOL, 1.5 ( +0.1) million needed assistance with one AOL, 0.8 (+0.1) million needed assistance with two AOL's, and 1.6 ( +0.1) million needed assistance with three or more AOL's. (The number needing assistance with one AOL was not statistically different from
· the number needing assistance with three or more AOL's).
• The survey collected information on five categories of Instrumental Activities of Daily Living (IADL's) includ~ ing going outside the home, keeping track of money and bills, preparing meals, doing light housework, and using the telephone. The number of persons reporting some difficulty with one or more IADL's was 11. 7 (+0.4) million. Of this total, the number needing personal assistance was 8. 7 ( +0.3) million.
• Of the 8.7 (+0.3) million needing assistance with an IADL, 3.7 (+0.2) million needed assistance with one IADL, 2.0 (+0.2) million needed assistance with two IADL's, and 3.1 (±0.2) million needed assistance with three or more IADL's.
• The number of persons 15 years old and over who needed personal assistance with one or more AOL's or IADL's was 9.2 ( +0.3) million.
• The number of persons 15 years old and over who used a wheelchair was 1.5 (±0.1) million. Another 4.0 (±0.2) million persons did not use a wheelchair but used a cane, crutches, or a walker and had used such an aid for 6 months or longer.
• Of the 48.9 (±0.7) million persons with a disability, 6.0 (±0.4) percent were less than 15 years old, 60.2 (±0.8) percent were 15 to 64 years old, and 33.8 (±0.8) percent were 65 years old and over. Among the 24.1 (±0.5) million with a severe disability, 2.2 ( +0.3) percent were under 15, 54.6 ( + 1.2) percent were 15 to ·54, and 43.2 ( + 1.2) percent were 65 and over.
• Among the 13.2 (±0.4) million persons 15 to 64 years old with a severe disability, 48.1 (±1.6) percent were covered by private health insurance, 36.2 (±2.0) percent were covered by a government plan only (Medicaid or Medicare), and 15.7 (±1.1) percent lacked coverage. Among the 16.3 (±0.5) million persons 15 to 64 years old with a disability that was not severe, 7 4.1 ( + 1.2) percent were covered by private health insurance, 7.2 (± 1.0) percent were covered by a government plan only, and 18. 7 ( + 1.1) percent were not covered. For the 135.6 (±0.9) million persons in the same age group with no disability, the comparable coverage figures were 80.0 (+0.6) percent, 5.2 (+0.3) percent and 14.8 (±0.5) percent. There was no statistically significant difference in the percentage of persons lacking coverage between those with a severe disability and those with no disability.
• Among persons 21 to 64 years old, the employment rate was 80.5 (+0.3) percent for persons with no disability, 76.0 ( + 1.3) percent for persons with a disability that was not severe, and 23.2 (± 1.4) for persons with a severe disability.
• Among selected groups within the 21 to 64 years age group, the employment rate was 48.6 ( + 1.4) percent among persons with a functional limitation, 27.6 (±2.1) percent among persons with a severe functional limitation, and 20.6 (+2.4) percent among persons who needed personal assistance with one or more AOL's or IADL's.
• Among persons 15 years old and over with a physical, AOL, or IADL limitation, the conditions most frequently cited as a cause of a limitation were arthritis or rheumatism (17.1 (+0.7) percent of all conditions cited), back or spine problems (13.5 ( +0.6) percent), heart trouble (11.1 (+0.6) percent), and lung or respiratory trouble (6.8 ( +0.5) percent).

• Among children o to 5 years, the proportion with any disability was 3.6 (+0.4) percent and the proportion with a severe disability was 0.5 (±0.2) percent. The comparable figures for children 6 to 14 years of age were 6.3 (±0.5) percent and 1.3 (±0.2) percent.
PREVALENCE OF DISABILITY BY TYPE
The disability questions that were included in the SIPP topical module on disability covered many important dimensions of disability. Questions about six functional activities, six activities of daily living (AOL's), five instrumental activities of daily living (IADL's), the use of wheelchairs and other aids, and the presence of five classes of impairments (learning disabilities, mental retardation, other developmental disabilities, Alzheimer's/ senility I dementia, and other mental or emotional conditions) were asked for all persons 15 years of age or older. Questions about work disability were asked for all persons 16 to 67 years old, and questions about housework disability were asked for persons 16 years old or older. In addition, questions about the disability status of children were asked of parents of children O to 21 years of age.
The 48.9 million persons counted as having a disability (see table A) were identified by one or more of the items described above or by the fact that they were a nonaged beneficiary of either Medicare or the SSI program.
The 24.1 million persons counted as having a severe disability were identified as unable to perform one or
Table A. Dlaablllty Status, by Sex and Age: 1991-92 [Numbers in thousands]
Sex and age Total
Total Number
BOTH SEXES
Total ............................... 251,796 48,936
Less than 15 years ..................... 56,067 2,913 15 to 64 years ......................... 165,040 29,482 65 years and over ...................... 30,688 16,541
MALES
Total ............................... 122,692 22,916
Less than 15 years ..................... 28,707 1,876 15 to 64 years ......................... 81,154 14,504 65 years and over ...................... 12,831 6,536
FEMALES
Total ............................... 129,104 26,020
Less than 15 years ..................... 27,360 1,038 15 to 64 years ......................... 83,886 14,978 65 years and over ...................... 17,857 10,005
5
more activities, or as having one or more specific impairments, or as a person who used a wheelchair or who was a long term user of crutches, a cane, or a walker.
Of the 195.7 million persons 15 years old and over, 34.2 million (17.5 percent) had difficulty with one or more functional activities (see table B) and 15.2 million (7.8 percent) were unable to perform one or more activities (The group of persons with some difficulty includes the group who were unable to perform the activity).
Relatively large numbers of persons were identified as having difficulty with physical activities. In all, 16.2 million persons (8.3 percent) had difficulty lifting and carrying a weight as heavy as 1 O pounds, and 7. 7 million (4.0 percent) could not perform this task at all; 17.3 million (8.9 percent) persons had difficulty walking a quarter of a mile or 3 city blocks, and 9.0 million (4.6 percent) could not walk this distance at all.
The number having difficulty seeing the words and letters in ordinary newsprint was 9. 7 million (5.0 percent) and the number who were completely unable to see words and letters was 1.6 million (0.8 percent). The number who had difficulty hearing what was said in an ordinary conversation with another person was 10.9 million (5.6 percent) and 0.9 million (0.5 percent) persons could not hear such a conversation at all. The least prevalent of the six functional limitations was difficulty having one's speech understood. The number identified as having difficulty with this functional activity was 2.3 million (1.2 percent); the number unable to have their speech understood at all was 0.2 million (0.1 percent).
With a dilabiHty
Not severe Severe
Percent Number Percent Number Percent
19.4 24,819 9.9 24,117 9.6
5.2 2,384 4.3 529 0.9 17.9 16,311 9.9 13,171 8.0 53.9 6,124 20.0 10,417 34.0
18.7 12,987 10.6 9,929 8.1
6.5 1,540 5.4 336 1.2 17.9 8,642 10.6 5,862 7.2 50.9 2,805 21.9 3,731 29.1
20.2 11,833 9.2 14,187 11.0
3.8 848 3.1 192 0.7 17.9 7,689 9.1 7,309 8.7 56.0 3,319 18.6 6,886 37.4

6
Table B. Persons 15 Years Old and Over Having Dlfflculty With or Unable to Perform Specified Functional Activities: 1991-92
[Numbers in thousands]
Persons 15 years Persons 15 to Persons 65 years old and over 64 years old old and over
Functional activities Percent Percent Percent
Number
TOTAL .................................... 195,729
Has difficulty with or is unable to perform specified number of functional activities: Oneormore ..•...••.....•..•......•..... 34,163
One·································· 14,463 Two ......•..............•............ 7,093 Three or more ...........•............. 12,608
Has difficulty with or is unable to perform specified functional activity: Seeing words and letters ...........•...... 9,685 Hearing normal conversations •............ 10,928 Having speech understood ................ 2,284 Lifting and canying 10 lbs. . ............... 16,205 Climbing stairs without resting ............. 17,469 Walking 3 city blocks ••.•.•............... 17,319
Unable to perform specified number of functional activities: One or more ...•......••................. 15,1731
One .........................•........ 6,979 Two .......•.................•........ 3,956 Three or more .......•....•..•......... 4,286
Unable to perform specified functional activity: Seeing words and letters .••............... 1,590 Hearing normal conversation ........•..... 924 Having speech understood ................ 237 Lifting and canying 10 lbs. • .•............. 7,734 Climbing stairs without resting .......•..... 9,116 Walking 3 city blocks •...... : •..•....••... 8,972
-Of the 34.2 million persons having difficulty with one
or more functional activities, more than half had difficulty with more than one activity; 14.5 million had difficulty with one; 7.1 million had difficulty with two; and 12.6 million had difficulty with three or more.
Among the 15.2 million persons who were unable to perform one or more functional activities, 7.0 million were unable to perform one activity, 4.0 million were unable to perform two activities, and 4.3 million were unable to perform three or more activities (the latter two figures are not statistically different).
Persons were much less likely to have difficulty with an AOL than to have difficulty performing a functional activity (see table C). The number of persons 15 years old and over who had difficulty with one or more AOL's was 7.9 million (4.1 percent). Of this number, 3.9 million (2.0 percent of the population 15 years old and over) required the assistance of another person with one or more of the basic six activities.
Data for individual AOL's show that 5.3 million persons had difficulty getting in or out of bed or a chair, 4.5 million had difficulty with the activity of bathing, 3. 7 million persons had difficulty getting around inside the
distribution Number distribution Number distribution
100.0 165,040 100.0 30,688 100.0
17.5 18,948 11.5 15,215 49.6 7.4 9,826 6.0 4,637 15.1 3.6 3,980 2.4 3,113 10.1 6.4 5,143 3.1 7,464 24.3
5.0 4,801 2.9 4,884 15.9 5.6 5,522 3.4 5,406 14.5 1.2 1,517 0.9 767 2.5 8.3 7,827 4.7 8,378 27.3 8.9 8,068 4.9 9,400 30.6 8.9 7,937 4.8 9,381 30.6
7.8 6,552 4.0 8,620 28.1 3.6 3,642 2.2 3,337 10.9 2.0 1,593 1.0 2,363 7.7 2.2 1,361 0.8 2,925 9.5
0.8 579 0.4 1,011 3.3 0.5 364 0.2 561 1.8 0.1 161 0.1 76 0.3 4.0 3,121 1.9 4,613 15.0 4.7 3,595 2.2 5,522 18.0 4.6 3,243 2.0 5,729 18.7
home, 3.2 million had difficulty with the activity of dressing, 2.1 million had difficulty using the toilet (including getting to the toilet), and 1.1 million had difficulty with the activity of eating.
The number needing assistance with the specific AOL's was 2. 7 million for bathing, 2.1 million for dressing, 2.0 million for getting in or out of bed or a chair (a figure not statistically different from the preceding figure), 1. 7 million for getting around inside the home, 1.2 million for using the toilet, and 0.5 million for eating.
It is likely that a person having difficulty with an AOL will have difficulties in two or more activities. Of the 7.9 million persons with an AOL limitation, 3.3 million had difficulty with one activity, and 4.6 million had difficulty with two or more. Of those needing assistance, 1.5 million needed assistance with one activity, and 2.4 million needed assistance with two or more.
Persons are more likely to experience difficulties with IADL's than with AOL's (see table D). The number having difficulty with one or more of the five IADL's was 11. 7 million or 6.0 percent of the 15 and over population. The number needing assistance with one or more of the activities was 8. 7 million (4.5 percent).

7
Table C. Persons 15 Years Old and Over Having Dlfflculty With or Needing Personal Assistance With Activities of Dally Uvlng (AOL's): 1991·92
[Numbers in thousands]
Persons 15 years Persons 15 to Persons 65 years old and over
Activities of daily living 64 years old old and over
Percent Percent Percent Number distribution Number distribution Number distribution
TOTAL .........................•.......... 195,729
Has difficulty with or .needs personal assistance with specified number of AOL's: One or more .............•............... 7,919
One·································· 3,337 Two .................................. 1,394 Three or more ......................... 3,189
Has difficulty with or needs personal assistance with specified AOL: Getting around inside the home ............ 3,664
Getting in or out of bed or a chair ........ 5,280 Taking a bath or shower ..•............. 4,501 Dressing ....•......................... 3,234 Eating ................................. 1,077 Toileting ............................... 2,084
Needs personal assistance with specified number of AOL's: One or more .•........................... 3,886
One·································· 1,490 Two .............•.................... 778 Three or more ......................... 1,618
Needs personal assistance with specified AOL: Getting around inside the home ............ 1,706 Getting in or out of bed or a chair ......•... 2,022 Taking a bath or shower .................. 2,718 Dressing •........•.........•............ 2,080 Eating .......................•••......... 487 Toileting .....................•........... 1,157
The number of persons having difficulty with individual IAOL's was 7.8 million for going outside the home to shop or visit a doctor's office, 6.3 million for doing light housework such as washing dishes or sweeping a floor, 4.5 million for preparing meals, 3.9 million for keeping track of money and bills, and 3.1 million for using the telephone.
Among those needing assistance with an IAOL were 6.0 million for going outside the home to shop or visit a doctor's office, 4. 7 million for doing light housework, 3. 7 million for preparing meals, and 3.4 million for keeping track of money and bills (not statistically different from the preceding figure). The number of persons who were unable to use a telephone was 0.9 million.
Multiple IAOL difficulties were more prevalent than single IAOL difficulties. Of the 11. 7 million persons with some difficulty, 5.0 million had difficulty with one IAOL, 2.5 million had difficulty with two, and 4.2 million had difficulty with three or more. Of those needing assistance with one or more IAOL's, 3. 7 million needed help with one, 2.0 million needed help with two, and 3.1 million needed help with three or more.
100.0 165,040 100.0 30,688 100.0
4.1 3,442 2.1 4,478 14.6 1.7 1,587 1.0 1,750 5.7 0.7 688 0.4 706 2.3 1.6 1,166 0.7 2,022 6.6
1.9 1,307 0.8 2,357 7.7 2.7 2,374 1.4 2,905 9.5 2.3 1,592 1.0 2,909 9.5 1.7 1,327 0.8 1,907 6.2 0.6 431 0.3 646 2.1 1.1 726 0.4 1,358 4.4
2.0 1,514 0.9 2,372 7.7 0.8 586 0.4 905 3.0 0.4 370 0.2 408 1.3 0.8 559 0.3 1,059 3.5
0.9 575 0.4 1,130 3.7 1.0 871 0.5 1,151 3.8 1.4 900 0.6 1,818 5.9 1.1 782 0.5 1,278 4.2 0.3 150 0.1 337 1.1 0.6 389 0.2 768 2.5
Based on responses to the AOL and IAOL questions, the number of persons needing assistance with one or more activities was 9.2 million, or 4. 7 percent of the population 15 years old and over. (The latter figure is not statistically different from the 4.5 percent needing assistance with an IAOL.)
The number of persons 15 years old and over who used a wheelchair was 1.5 million; another 4.0 million did not use a wheelchair but had used a cane, crutches, or a walker for 6 months or longer.
There were several items on the questionnaire that attempted to ident;fy persons with a mental or emotional disability. In this study, a person 15 years old and over was considered to have a mental or emotional disability if the person: (a) was identified by one of the questions that asked if the person had a learning disability, had mental retardation, had Alzheimer's disease, senility, or dementia, or had any other mental or emotional condition; (b) had a functional, AOL, or IAOL limitation or a work or housework disability that was caused by any of four conditions including learning disability, mental or emotional problems or disorders, mental retardation, or senility, dementia, or Alzheimer's disease; or (c) had difficulty keeping track of money and bills.
8
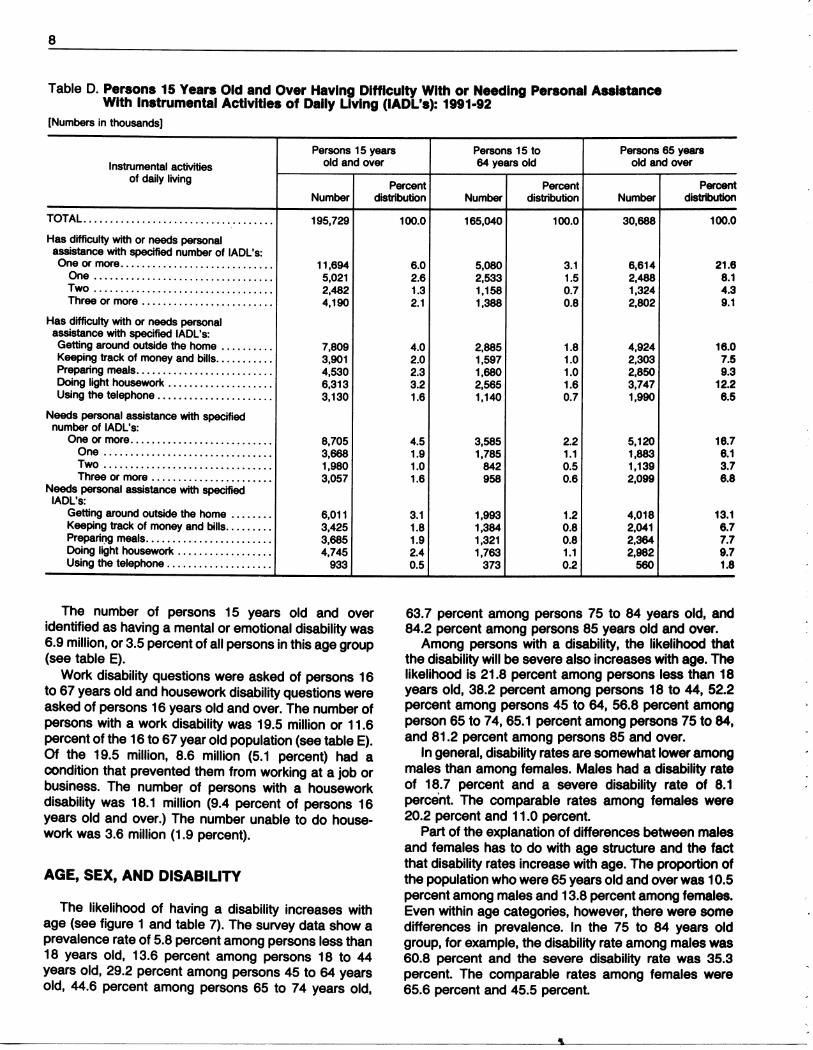
Table D. Persons 15 Years Old and Over Having Difficulty With or Needing Personal Assistance With Instrumental Activities of Dally Living (IADL's): 1991·92
[Numbers in thousands]
Persons 15 years Persons 15 to Persons 65 years
Instrumental activities old and over 64 years old old and over
of daily living Percent Percent Percent
Number distribution Number distribution Number distribution
TOTAL .................................... 195,729
Has difficulty with or needs personal assistance with specified number of IADL's: One or more ............................. 11,694
One .................................. 5,021 Two .................................. 2,482 Three or more ......................... 4,190
Has difficulty with or needs personal assistance with specified IADL's: Getting around outside the home .......... 7,809 Keeping track of money and bills ........... 3,901 Preparing meals .......................... 4,530 Doing light housework .................... 6,313 Using the telephone ...................... 3,130
Needs personal assistance with specified number of IADL's:
One or more ........................... 8,705 One ................................ 3,688 Two ................................ 1,980 Three or more ....................... 3,057
Needs personal assistance with specified IADL's:
Getting around outside the home ........ 6,011 Keeping track of money and bills ......... 3,425 Preparii:ig meals ........................ 3,885 Doing light housework .................. 4,745 Using the telephone .................... 933
The number of persons 15 years old and over identified as having a mental or emotional disability was 6.9 million, or 3.5 percent of all persons in this age group (see table E).
Work disability questions were asked of persons 16 to 67 years old and housework disability questions were asked of persons 16 years old and over. The number of persons with a work disability was 19.5 million or 11.6 percent of the 16 to 67 year old population (see table E). Of the 19.5 million, 8.6 million (5.1 percent) had a condition that prevented them from working at a job or business. The number of persons with a housework disability was 18.1 million (9.4 percent of persons 16 years old and over.) The number unable to do housework was 3.6 million (1.9 percent).
AGE, SEX, AND DISABILITY
The likelihood of having a disability increases with age (see figure 1 and table 7). The survey data show a prevalence rate of 5.8 percent among persons less than 18 years old, 13.6 percent among persons 18 to 44 years old, 29.2 percent among persons 45 to 64 years old, 44.6 percent among persons 65 to 74 years old,
100.0 165,040 100.0 30,688 100.0
6.0 5,080 3.1 6,614 21.8 2.6 2,533 1.5 2,488 8.1 1.3 1,158 0.7 1,324 4.3 2.1 1,388 0.8 2,802 9.1
4.0 2,885 1.8 4,924 18.0 2.0 1,597 1.0 2,303 7.5 2.3 1,880 1.0 2,850 9.3 3.2 2,565 1.8 3,747 12.2 1.8 1,140 0.7 1,990 8.5
4.5 3,585 2.2 5,120 16.7 1.9 1,785 1.1 1,883 8.1 1.0 642 0.5 1,139 3.7 1.8 958 0.6 2,099 8.8
3.1 1,993 1.2 4,018 13.1 1.8 1,364 0.8 2,041 8.7 1.9 1,321 0.8 2,364 7.7 2.4 1,763 1.1 2,982 9.7 0.5 373 0.2 580 1.8
63.7 percent among persons 75 to 84 years old, and 84.2 percent among persons 85 years old and over.
Among persons with a disability, the likelihood that the disability will be severe also increases with age. The likelihood is 21.8 percent among persons less than 18 years old, 38.2 percent among persons 18 to 44, 52.2 percent among persons 45 to 64, 56.8 percent among person 65 to 7 4, 65.1 percent among persons 75 to 84, and 81.2 percent among persons 85 and over.
In general, disability rates are somewhat lower among males than among females. Males had a disability rate of 18. 7 percent and a severe disability rate of 8.1 percent. The comparable rates among females were 20.2 percent and 11.0 percent.
Part of the explanation of differences between males and females has to do with age structure and the fact that disability rates increase with age. The proportion of the population who were 65 years old and over was 10.5 percent among males and 13.8 percent among females. Even within age categories, however, there were some differences in prevalence. In the 75 to 84 years old group, for example, the disability rate among males was 60.8 percent and the severe disability rate was 35.3 percent. The comparable rates among females were 65.6 percent and 45.5 percent.

9
Table E. Persons, by Age and Selected Measures of Dlsablllty Status: 1991-92
[Numbers in thousands]
Both Sexes Males Females
Age and disability measure Percent Percent Number dlatrl:lution Number distribution Nunber Percent
PERSONS 15 YEARS OLD AND OVER
Total •....••..•.•..•....•.•...•••...• ··· 195,729
Needs personal assistance with an AOL orlADL .................................. 9,211
Uaes a wheelchair .••.......•...•....••..•.• 1,494 Does not use a wheelchair but has used a cane, crutches, or a walker for six months or longer ................................. 3,962
With a mental or emotional disability ........•. 8,879
PERSONS 15 TO 64 YEARS OLD
Total ...•.......•.........•.......... ··· 165,040
Needs personal assistance with an AOL orlADL .................................. 3,876
Uaes a wheelchair •...•••.••..•...•...••..•• 529 Does not use a wheelchair but has used a cane, crutches, or a walker for six months or longer ................................. 1,115
With a mental or emotional disability ...•...... 5,748
PERSONS 65 YEARS OLD AND OVER
Total ....•.....•....••.......•.•.•.•.... 30,688
Needs personal assistance with an AOL or IADL .................................. 5,336
Uaes a wheelchair .•......••............•••. 965 Does not use a wheelchair but has used a cane, crutches, or a walker for six months or longer ................................. 2,647
With a mental or emotional disability •••....... 1,133
PERSONS 16 TO 67 YEARS OLD
Total ..•..................•....•..... ··· 167,899
With a work disability ....................... 19,544 Prevented from working ....•.•..•......••• 8,832
PERSONS 16 YEARS OLD AND OVER
Total ••.....•...•.................•..... 192,348
With a housework disability ...............•.. 18,088 Unable to do hou~ .................. 3,591
Among children less than 18 years old, males were more likely than females to have a disability (7.2 percent compared to 4.4 percent).
Of the 48.9 million persons with a disability, 16.4 million (33.5 percent) were males under 65 years old, 16.0 million (32. 7 percent) were females under 65 years old (the latter two figures are not statistically different from the comparable figures for males under 65), 6.5 million (13.4 percent) were males 65 years old and over, and 10.0 million (20.4 percent) were females 65 years old and over (see figure 2).
100.0 93,985 100.0 101,744 100.0
4.7 3,383 3.6 5,828 5.7
0.8 575 0.6 919 0.9
2.0 1,547 1.7 2,415 2.4
3.5 3,534 3.8 3,345 3.3
100.0 81,154 100.0 83,886 100.0
2.4 1,665 2.1 2,211 2.6
0.3 283 0.3 266 0.3
0.7 567 0.7 548 0.7
3.5 3,162 3.9 2,564 3.1
100.0 12,831 100.0 17,857 100.0
17.4 1,718 13.4 3,617 20.3
3.1 311 2.4 653 3.7
9.3 980 7.6 1,867 10.5
3.7 372 2.9 760 4.3
100.0 62,261 100.0 85,638 100.0
11.6 9,620 11.7 9,924 11.6 5.1 3,922 4.8 4,710 5.5
100.0 92,220 100.0 100,128 100.0
9.4 7,477 8.1 10,611 10.6 1.9 1,691 1.8 1,900 1.9
Of the 24.1 million persons with a severe disability, 6.2 million (25. 7 percent) were males under 65, 7.5 million (31.1 percent) were females under 65, 3. 7 million (15.5 percent) were males 65 and over, and 6. 7 million (27.7 percent) were females 65 and over (see figure 3).
The data cited above show a strong relationship between age and the likelihood of a disability: persons 65 years and over made up 12.2 percent of the total population but they accounted for 33.8 percent of all persons with a disability, and 43.2 percent of all persons with a severe disability.

10
Figure 1. Percent of Persons With a Disablllty and With a Severe Disability, by Age: 1991-92
c=J Percent with a disability - Percent with a severe disability
84.2
Less than 18 1844 45-64 65-74 75-84 85 and over
Age in years
Certain definitional issues arise when trying to determine the link between age and disability. Of primary importance is the decision concerning the age at which working at a Job or business is no longer counted as an expected life activity. The SIPP work disability questions were not asked of persons 68 years old and over. Yet some persons are interested in working at age 68 and
Figure 2. Sex and Age Composition of Persons With a Disablllty: 1991 ·92
·--- Males less than 65 years 33.5%
Females less than 65 years 32.7%
Males 65 years and over 13.4%
'-------··--- Females 65 years and over 20.4%
beyond. The decision to restrict the universe for the work disabirrty question to persons 16 to 67 affects the interpretation of the link between age and disability.
The relationship between age and disability strengthens (in terms of the proportion of persons with specific disabilities who are 65 years old and over) when the areas of functional limitations, the need for assistance, and the use of special aids are examined. Questions on these topics were asked for persons 15 ye8rs old and over.
Persons 65 years old and over made up 56.8 percent of those with a severe functional limitation, 57.9 percent of those needing assistance with an AOL or IADL (the latter two figures are not statistically different), 64.6 percent of persons who use~ wheelchairs, and 71.9 percent of those who used a cane, crutches, or a walker and who had used such an aid for 6 months or longer.
RACE, HISPANIC ORIGIN, AND DISABILITY
Data for persons of all ages show that the overall disability rates among Whites (19.7 percent), Blacks (20.0 percent), and American Indians, Eskimos, and Aleuts (21.9 percent) were not statistically different. but the rate of 15.3 percent among persons of Hispanic origin (who may be of any race) was lower than the rates for the first three groups mentioned, and the rate among Asians and Pacific Islanders (9.9 percent) was lower than the rate for persons of Hispanic origin (sea table 11).
There were differences among races and ethnicity groups in the severe disabjlity prevalence rate. The rate was 9.4 percent among Whites; 12.2 percent among Blacks; and 8.4 percent among persons of Hispanic origin. Asians and Pacific Islanders had the loweSt
Figure 3. Sex and Age Composition of Persona With a Severe Dlsablllty: 1991-92
---- Males less than 65 years 25.7"k
- Females less than 65 yeara 31.1%
Males 65 years and over -- 15.5%
··--·-·-·-··---·- Females 65 years and over 27.7%

prevalence rate, 4.9 percent. The rate was 9.8 percent among American Indians, Eskimos, and Aleuts, higher than the rate for Asians and Pacific Islanders, but not statistically different from the rates for other groups.
Comparisons among race and ethnic groups need to consider the effect of other variables, particularly differing age structures. The proportion of the population aged 65 years and over was 13.0 percent among Whites and 8. 7 percent among Blacks. The rates of 4. 7 percent among American Indians, Eskimos, and Aleuts, 5.6 percent among persons of Hispanic origin, and 6.1 percent among Asians and Pacific Islanders were lower than for Whites or Blacks but were not statistically different from each other. These differences in age structure reflect differences in life expectancies, birth rates, and immigration patterns.
When disability rates are examined for the population 15 to 64 years of age (see figure 4 and table 12), the rate among Whites (17.7 percent) is found to be lower than the rate among Blacks (20.8 percent) and not statistically different from the rate among persons of Hispanic origin (16.9 percent). American Indians, Eskimos, and Aleuts had the highest rate (26.9 percent), and Asians and Pacific Islanders had the lowest (9.6 percent). When severe disability is used as the measure, Blacks (12. 7 percent), American Indians, Eskimos and
Figure 4. Percent of Persons 15 to 64 Years Old With a Disability and With a Severe Disability, by Race and Hispanic Origin: 1991-92
20.8
17.7
White Black
~ Percent with a disability - Percent with a severe disability
26.9
16.9
American Asian or Hispanic Indian. Eskimo or Aleut
Pacific origin Islander
11
Aleuts (11. 7 percent), and persons of Hispanic origin (9.1 percent) had higher rates than Whites (7.4 percent), and Asians and Pacific Islanders again had the lowest rate (4.5 percent). The rate for American Indians, Eskimos, and Aleuts was not statistically different from the rate for Blacks or persons of Hispanic origin.
EDUCATION AND DISABILITY
There is a very strong association between years of school completed and the likelihood of having a disability. For example, among persons 25 to 64 years old, the proportion with a severe disability was 22.8 percent among persons who had not completed high school, 8.7 percent among high school graduates, 6.3 percent among persons who had completed some college but were not graduates, and 3.2 percent among college graduates (see table 12). The link between education and disability was also observable among the 65 years old and over population. Among members of this age group, the proportion with a severe disability was 44. 7 percent among those who had not finished high school and 20.0 percent among those who had finished college (see table 13).
LOW-INCOME STATUS AND DISABILITY
Persons with low incomes are more likely to have disabilities than persons with high incomes. The income measure used in this study is the ratio of family income (personal income is used if the person is not a family member) in the month preceding the interview to a low-income threshold that is equal to one-twelfth of the official annual poverty threshold for a family of the specified size and composition. Among persons 15 to 64 years of age, the proportion with a severe disability was 16. 7 percent among persons with an income to threshold ratio below 1.00, 14. 7 percent among those
-with-a ratio from 1.00 te+.-49-; 10.1 pereent~OAg-those- -- ---with a ratio from 1.50 to 1.99, 7.4 percent among those with a ratio from 2.00 to 2.99, 5.4 percent among those with a ratio from 3.00 to 3.99, and 3.3 percent among those with a ratio of 4.00 or higher (see figure 5 and table 12). A similar relationship held for persons 65 years old and over. Within this group, the proportion with a severe disability was 53.0 percent among those with a ratio less than 1.00, and 22.8 percent among those with a ratio of 4.00 or higher (see table 13).
EMPLOYMENT AND DISABILITY
The employment status of persons with disabilities is a matter of critical importance, both in terms of public expenditures and in the right of persons with disabilities
12
to participate fully in the labor market. Table 24 presents data on the employment status of persons 21 to 64 years of age by disability status.
Previous studies have primarily focused on the relationship between work disability and employment status. Work disability status, as measured in SIPP, March Current Population Surveys, and the past three decennial censuses, is determined by asking if a person has a condition that "limits the kind or amount of work" that can be done or "prevents the person from working at a job or business." Studies show that work disability status, as measured in this way, is strongly associated with labor force status, earnings levels, and other characteristics. In spite of these findings, however, it ought to be noted that work disability status is an ambiguous concept. The work disability question implies that the only factor affecting the ability to work is the condition of the person. This is clearly not the case. Under one set of environmental factors, a given condition may hinder or prevent work, but if physical and/ or social barriers are removed, the same condition may have no effect on the ability to work. The data in table 24 show the relationship between work disability status and employment status, but they also show the relationship between a full array of disability measures and employment status.
The data show that having a disability that is not severe reduces the likelihood of being employed by a rather small amount, and having a severe disability
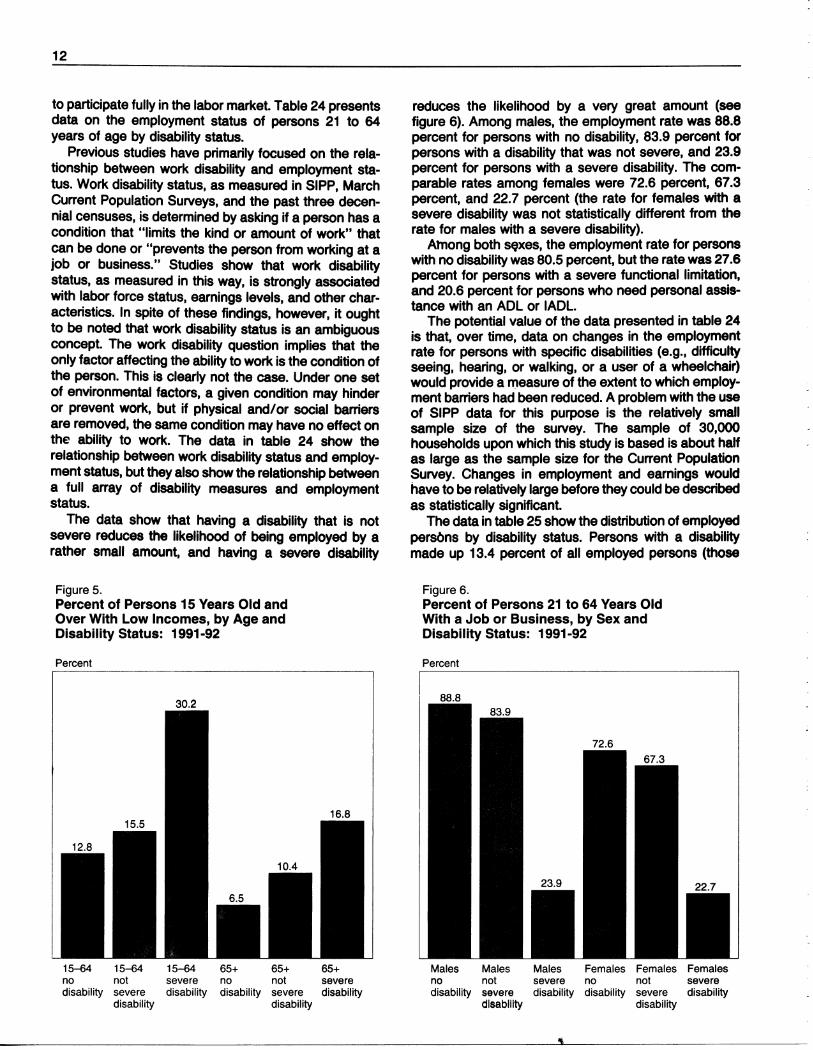
Figure 5. Percent of Persons 15 Years Old and Over With Low Incomes, by Age and Disability Status: 1991-92
Percent
30.2
15--64 15-64 15-64 65+ 65+ 65+ no not severe no not severe disability severe disability disability severe disability
disability disability
reduces the likelihood by a very great amount (see figure 6). Among males, the employment rate was 88.8 percent for persons with no disability, 83.9 percent for persons with a disability that was not severe, and 23.9 percent for persons with a severe disability. The comparable rates among females were 72.6 percent, 67.3 percent, and 22. 7 percent (the rate for females with a severe disability was not statistically different from the rate for males with a severe disability).
Atnong both SQxes, the employment rate for persons with no disability was 80.5 percent, but the rate was 27.6 percent for persons with a severe functional limitation, and 20.6 percent for persons who need personal assistance with an AOL or IADL.
The potential value of the data presented in table 24 is that, over time, data on changes in the employment rate for persons with specific disabilities (e.g., difficulty seeing, hearing, or walking, or a user of a wheelchair) would provide a measure of the extent to which employment barriers had been reduced. A problem with the use of SIPP data for this purpose is the relatively small sample size of the survey. The sample of 30,000 households upon which this study is based is about half as large as the sample size for the Current Population Survey. Changes in employment and earnings would have to be relatively large before they could be described as statistically significant.
The data in table 25 show the distribution of employed persOns by disability status. Persons with a disability made up 13.4 percent of all employed persons (those
Figure 6. Percent of Persons 21 to 64 Years Old With a Job or Business, by Sex and Disability Status: 1991-92
Percent
88.8
Males Males Males Females Females Females no not severe no not severe disability severe disability disability severe disability
dlsablllty disability

with a severe disability made up 2.8 percent of the total and those with a disability that was not severe made up 10.6 percent). The proportion of employed persons who had difficulty seeing was 2.0 percent, 3.2 percent had difficulty hearing, and 2.4 percent had difficulty walking. The proportion who needed personal assistance with an AOL or IADL was 0. 7 percent, the proportion using a wheelchair was 0.1 percent, and the proportion who had used a cane, crutches, or a walker for 6 months or longer was 0.2 percent.
Employment issues concern more than the fact of whether a person is employed or not employed. The level of earnings and other job characteristics are also of prime concern. Tables 26 and 27 provide information on earnings by disability status and table 28 provides some occupational data.
It ought to be noted again that the SIPP sample size makes it difficult to analyze issues such as earnings differences in great detail. When the number of workers with a specific disability is small, earnings estimates will be characterized by relatively large standard errors.
The data in table 26 do show evidence of a negative association between earnings and disability status. For example, among persons 35 to 54 years of age, persons with no disability had mean monthly earnings of $2,446, persons with a disability that was not severe had earnings of $2,006, and persons with a severe disability had earnings of $1,562. Table 26 follows the usual convention of presenting earnings data for persons classified by age by years of school completed. The implication is that earnings comparisons should be made only after controlling for education. Users might recall, however, that there is a strong negative association between education and disability status. That is, one of the ways disability may affect earnings is through its effect on levels of education and training. ·
Table 27 shows data on earnings by type of disability. Because of sample size constraints, there is no attempt to cross classify the data by age and schooling. Many of the earnings figures shown in the table are characterized by relatively large standard errors.
The data in table 28 show some relationships between occupation and disability status. For example, if we consider the first six occupations listed (from "executive and administrative 'occupations" to "physicians, dentists, and other health diagnosing occupations") the proportion of employed persons in that group was 15.0 percent among persons with no disability, 11.9 percent among persons with a disability that was not severe, and 10.1 percent among persons with a severe disability (the latter two figures are not statistically different from each other).
HEALTH INSURANCE COVERAGE STATUS AND DISABILITY
Disability status is associated with certain patterns of health insurance coverage status. Persons 15 to 64
13
years of age with disabilities are less likely to be covered by private health insurance than are persons in the same age group with no disability. Among persons 15 to 64 years old with no disability, 80.0 percent were covered by private health insurance, 5.2 percent were not covered by private health insurance but were covered by a government plan, and 14.8 percent were not covered by any health plan. Among those in the same age group with a disability that was not severe, 7 4.1 percent were covered by private health insurance, 7 .2 percent were not covered by a private plan but were covered by a government plan, and 18. 7 percent were not covered at all. The effect of disability on private health insurance coverage was strongest for persons with a severe disability. Of those persons 15 to 64 with a severe disability, 48.1 percent were covered by a private plan, 36.2 percent were not covered by a private plan but were covered by a government plan, and 15. 7 percent had no health insurance coverage (the noncoverage rates for persons with a severe disability and persons with no disability were not statistically different from each other).
CONDITIONS CAUSING DISABILITIES
The data in table 29 show the number of times that selected conditions were named as the cause of a physical, AOL, or IADL limitation. Respondents were asked to select the condition(s) causing the difficulty from a card containing a list of 30 conditions. Respondents could report up to three conditions. The question about conditions was not asked for persons whose only reported difficulty was with the functional activities of seeing, hearing, or having speech understood.
The number of persons 15 years old and over reporting one or more conditions was 27.3 million; 10.1 million persons reported at least two conditions and 4.6 million reported three conditions. Among the specific conditions most frequently mentioned as a cause of disability were arthritis or rheumatism (mentioned by 7 .2 million persons), back or spine problems (5. 7 million), heart trouble (4.6 million), lung or respiratory trouble (2.8 million), high blood pressure (2.2 million), stiffness or deformity of the foot, leg, arm or hand (2.0 million),
·. diabetes (1.6 million) and blindness or vision problems (1.5 million) (the latter two numbers are not statistically different and the frequency with which high blood pressure was reported as a cause was not statistically different from the frequency with which stiffness or deformity of the foot, leg, arm, or hand was reported as a cause).
DISABILITY STATUS OF CHILDREN
Questions about the disability status of children were asked of parents or guardians of children less than 22 years of age. Questions about "any limitations at all in

14
the usual kind of activities done by most children their age" and "received therapy or diagnostic services designed to meet their developmental needs" were asked about children O to 6 years of age. A question about "limitations in their ability to do regular school work" was asked about children 6 to 21 years of age, and a question about "a long lasting condition that limits their ability to walk, run, or use stairs" was asked about children 3 to 14 years of age.
The disability rate among children O to 2 years old was 2.2 percent (see table 34). The proportion with a limitation in usual kind of activity was 1.3 percent, and 1.6 percent had received therapy or services for developmental needs (the latter figure is not statistically different from either of the two preceding figures). The proportion identified as having a severe disability (a limitation caused by autism, cerebral palsy, or mental retardation) was 0.4 percent.
The disability rate among children 3 to 5 years was 5.2 percent. The proportion witli a limitation in usual kind of activity was 2.6 percent and 4.3 percent had received therapy or services for developmental needs (the latter figure is not statistically different from the overall figure of 5.2 percent). The proportion identified. as "limited in their ability to walk, run, or use stairs" was 1.3 percent. The proportion with a severe disability was O. 7 percent, not statistically different from the rate for children o to 2 years old.
Children 6 to 14 years of age had a disability rate of 6.3 percent. The proportion who were limited in their ability to do regular school work was 5.4 percent, and 1.6 percent were limited in their ability to walk, run, or use stairs. (This latter figure is not statistically different from the comparable figure for children 3 to 5 years old.) The proportion with a severe disability was 1.3 percent (the latter figure is not statistically different from the preceding figure).
The disability status of persons 15 to 21 years of age was measured by direct questions about functional limitation, AOL limitations, IADL limitations, and the use of special aids. If the person lived with a parent or guardian, disability status was also measured by a question asked of the parent or guardian concerning the child's ability to do regular school work. The overall disability rate among persons 15 to 17 years of age (as determined both by the direct questions and the questions asked of parents) was 9.3 percent. The proportion identified as having a limitation in their ability to do regular school work was 4.4 percent.
OTHER SOURCES OF DATA ON DISABILITY STATUS
Since 1981, the March Supplement to the Current Population Survey (CPS) has contained a question that identifies persons with a health problem or disability that prevents work or limits the kind or amount of work that
can be done. Based on this question and certain other data items found in the March CPS questionnaire, the Bureau of the Census has periodically published CPS data on the characteristics of persons with a work disability. The first report presented data from the March 1982 survey [McNeil, 1983). Since then, an updated report has been issued [Bennefield and McNeil, 1989) and data on persons with a work disability have been incorporated into the annual report on persons in poverty.
Questions about work disability, mobility limitations, and self-care limitations were asked in the 1990 census long form and data are published in various U.S. and state volumes. A recent "8per presents a discussion of some of the issues concerning the quality of these data [McNeil, 1993).
The National Health Interview Survey (NHIS) collects data on activity limitations and the prevalence of certain impairments. The most extensive report on disability data from the NHIS was prepared by Mitch LaPlante. His report was published in 1988 and is based on a combination of the NHIS samples for 1983, 1984, and 1985.
In addition to core questions about activity limitations and impairments, the NHIS contains supplements designed to provide detailed information concerning special topics. Two recent reports contained data on serious mental illness [Barker, et al] and assistive devices and home accessibility features [LaPlante, Hendershot, and Moss].
USER COMMENTS
The Census Bureau welcomes the comments and advice of data users. If. you have any suggestions or comments, please write to:
Daniel H. Weinberg Chief, Housing and Household Economic Statistics Division
U.S. Bureau of the Census Washington, D.C. 20233-3300
REFERENCES
Bennefield, Robert L. and John M. McNeil, Labor Force Status and Other Characteristics of Persons with a Worlr Disability: 1981 to 1988, Series P-23, No. 160, U.S. Bureau of the Census, 1989.
Barker, Peggy R. and Others, Serious Mental Illness and Disability in the Adult Housshold Population: United States, 1989, Advance Data Number 218, National Center for Health Statistics, 1992.
Fougeyrollas, Patrick, Documenting Environmental Factors as DBtBfTTlining Variables in the Performancs of Day to Day ActivitiBs and the Fulfillment of Social Roles by Persons with Impairments and Functional limitations, ICIDH International Network, Vol. 5, No. 1, 1993.
·'

LaPlante, Mitchell P., Data on Disability from the National HBB!th Interview Survey, 1983-85, National Institute on Disability and Rehabilitation Research, 1988.
LaPlante, Michell P., Gerry E. Hendershot, and Abigail J. Moss, Assistive Technology Devices and Home Accessibility FBBtures: Prevalence, Payment, Need, and Trends, Advance Data Number 217, National Center for Health Statistics, 1992.
McNeil, John M., Labor Force Status and Other Characteristics. of Persons With a Work Disability: 1982, Series P-23, No. 127, U.S. Bureau of the Census, 1983.
McNeil, John M., "A Review of U.S. Disability Surveys Based on the Recommendations of The Council of Europe's 'Committee of Experts,"' presented at the Annual Meeting of the Society for Disability Studies, 1991.
15
McNeil, John M., "Measuring Disability and Environmental Barriers," presented at the Annual Meeting of the American Statistical Association, 1991.
McNeil, John M., "Census Bureau Data on Persons with Disabilities: New Results and Old Questions About Validity and Reliability," presented at the annual meeting of the Society for Disability Studies, 1993.
Nagi, Saad, "Disability Concepts Revisited: Implications for Prevention," in Disability in America: Toward a National Agenda for Prevention, National Academy Press, 1991.
Social Security Administration, Social Security Programs in the United States, 1993.
U.S. Bureau of the Census, Poverty in the United States: 1991, Series P-60, No. 181.
World Health Organization, International Classification of Impairments, Disabilities, and Handicaps, 1980.