current flight test experience related to structural ... · current flight test experience related...
TRANSCRIPT

J
NASA Technical Memorandum 100445
Current Flight Test ExperienceRelated to Structural Divergenceof Forward.Swept _Wings
Lawrence S. Schuster and William A. Lokos
G3/05
_88-2_633
Unclas0149301
August 1988
NASANational Aeronautics andSpace Administration
https://ntrs.nasa.gov/search.jsp?R=19880015249 2020-02-03T15:42:51+00:00Z

NASA Technical Memorandum 100445
Current Flight Test ExperienceRelated to Structural Divergenceof Forward-Swept WingsLawrence S. Schuster and William A. Lokos
Ames Research Center, Dryden Flight Research Facility, Edwards, California
1988
N/ ANational Aeronautics andSpace AdministrationAmes Research Center
Dryden Flight Research FacilityEdwards, California 93523-5000


Current Flight Test Experience Related to
Structural Divergence of Forward-Swept Wings
Lawrence S. Schuster and William A. Lokos
NASA Ames Research Center
Dryden Flight Research Facility
Edwards, California
_STRA_
Flight testing the X-29A forward-swept-
wing aircraft has required development of new
flight test techniques to accomplish subcritical
extrapolations to the actual structural diver-
gence dynamic pressure of the aircraft. This
paper provides current experience related to
applying these techniques to analysis of flightdata from the forward-swept wing in order to
assess the applicability of these techniques to
flight test data. The measurements required,
maneuvers flown, and flight test conditions are
described. Supporting analytical predictionsfor the techniques are described and the
results using flight data are compared to
these predictions. Use of the results during
envelope expansion and the resulting mod-
ifications to the techniques are discussed.
Some of the analysis challenges that occurred
are addressed and some preliminary conclu-sions and recommendations are made relative
to the usefulness of these techniques in theflight test environment.
NOMENCLATURE
CL centerline
c chord, percent
FDMS flight deflection measurement
system
FLEXSTAB system of computer programs for
aerodynamic analysis of flexibleaircraft
normal loading factor, acceleration
due to gravity
LED light-emitting diode
MCC manual camber control
NASTRAN NASA finite element computer
program for structural analysis
dynamic pressure
qdiv divergence dynamic pressure
w s wing station
ct angle of attack
load or twist/unit angle of attack
INTRODUCTION
The X-29A technology demonstrator aircraft
(fig. 1) is the first modem aircraft design to
effectively exploit the aerodynamic perform-ance advantages of the forward-swept wing.
The major disadvantage of previous uses of
forward-swept wings was the large weight
penalty paid to provide sufficient stiffness to
prevent structural divergence within the flight
envelope. Through the use of aeroelastically
tailored composite wing skins, this substantial
disadvantage has been overcome. By moving
the effective elastic axis of the wing forward
and by exploiting the high stiffness-to-weight
ratio of composite materials, the streamwise
twist increase due to load along the wing span
has been minimized, and the resulting struc-
tural divergence critical speed is well outside
the flight envelope.
Because the X-29A flight test program
is the first flight test of a high-performance
forward-swept-wing configuration, new tech-
niques are being developed to measure thestructural divergence characteristics of the
wing. The forward sweep of the wing results in
an increasing twist increment to the local angle
of attack along the span as the wing loads up.
The resulting load distribution demonstrates a
wingtip load amplification as dynamic pressure

rises, rather than the customary load relief of
aft-swept wings. The forward-swept wing,therefore, has an increasing lift curve slope asdynamic pressure increases. This is certainlyan aerodynamic advantage, but it also causesthe divergence phenomenon. The question ishow to quantify this phenomenon to assurethat the critical structural divergence speed is,in fact, outside the flight envelope.
The chosen flight test technique must
provide data for flight safety during envelopeexpansion as well as obtain adequate data toallow validation of the design with respect tostructural divergence. A method for monitor-ing and extrapolating data to determine theactual flight structural divergence boundaryis required. Wind tunnel tests of a genericforward-swept-wing model were performedat the NASA Langley Research Center. Appli-cation of the Southwell subcritical extrapo-lation method to the wind tunnel data was
successfully demonstrated (Ricketts andDoggett, 1980).
One of the concerns about structural
divergence of the X-29A is that static diver-gence is not likely to be the limiting factor inenvelope expansion. Another phenomenon,the coupling of the wing first bending modewith the rigid body pitch mode, is predicted tooccur at lower speeds than static divergence(Chipman and others, 1984). However, fre-quency trends for this dynamic divergence arehighly nonlinear, allowing only point-to-pointclearances as speed is increased. The wing firstbending frequency drops toward the pitch rigidbody frequency, but the nonlinearity of thefrequency trend prevents extrapolation to theactual divergence speed at speeds well belowthe divergence speed. Thus, comparisonsbetween actual and theoretical predictions ofthe divergence speed cannot be made.
Likewise, the phase and gain marginsfor the control system become unacceptablysmall as the divergence speed is approached,and controllability becomes a problem. Theseeffects are also nonlinear, requiring a point-
to-point clearance approach. If the South-well method can be used successfully with
flight data, the resulting comparison betweenthe design divergence speed and the flightdata extrapolation of the divergence speedcan be used to provide an independent indi-
cation of whether the aircraft limits are
actually closer than expected to the flight
envelope boundaries.
The flight test challenge is to apply theSouthwell method to flight data to providea reliable extrapolation to the actual struc-tural divergence speed boundary during theenvelope expansion program. Furthermore,the method ought to provide reliable resultsthat can be used in comparisons with the pre-
dicted divergence speed in order to validatethe methods used during the design process toassure that the divergence speed is outside the
flight envelope.
The problem with using the Southwellmethod is that the flight data are obtainedat dynamic pressures well below the diverg-ence dynamic pressure. The wind tunnel datawere available at conditions relatively near the
actual divergence speed. None of the flightdata is at conditions that can be considered
near the actual divergence speed. In fact,the extent of the extrapolation is quite large
(fig. 2). The accuracy of flight test measure-ments is not much better than in the wind
tunnel, and control of the test conditions iscertainly more difficult. Considerable effort isrequired to improve the chances of successfulapplication of the Southwell technique. The
highest quality flight data are needed, ananalytical assessment of the characteristicsof the data is required, and very careful andthorough flight data analysis techniques mustbe used.
The purpose of the current activity onthe X-29A is to evaluate the use of subcritical
divergence prediction techniques using flightdata. The scope of the work includes subsonic,transonic, and supersonic evaluations based oncomparison of flight data results and analytical
predictions. This report will describe the tech-niques used and the lessons learned by apply-
ing the subcritical extrapolation method totransonic data.
INSTRUMENTATION
Strain gages calibrated to provide shear,bending moment, and torque measurementsat several locations on the X-29A (fig. 3) are
used to provide data for the structural diverg-ence flight tests. Although all load measure-
2

ments on the wing are available for analysis,
the principal load measurement used for
divergence is the wing root bending moment.This measurement is the most accurate one
available on the wing and is also thought tobe the best measure of the loads that produce
the structural divergence phenomenon. Inother words, the streamwise twisting of the
wing is likely to be proportional to the wing
root bending moment.
Perhaps the most direct measurement of
structural divergence is the aeroelastic stream-
wise twist per unit angle-of-attack increment
along the span due to increasing dynamic
pressure. Measurement of the wingtip twist
provides the best measurement of the local
angle-of-attack changes along the wing spandue to aeroelasticity. To measure the wing
twist during flight maneuvers, an electro-
optical flight deflection measurement system
(FDMS) was installed early in the flight testprogram. The wing box twist can be calculated
from wing deflection measurements made at
streamwise measurement stations on the wing.Figure 4 is a functional diagram of the FDMS.The FDMS as installed on the X-29A consists of
a control unit, a target driver, twelve infrared
light-emitting diode (LED) targets and tworeceivers. The control unit interfaces with the
aircraft pulse code modulation (PCM) data
system and also commands the operation of the
target driver and receivers. The surface-
mounted LED targets serve as active locationmarkers and are momentarily energized one at
a time by the target driver beginning withtarget number 1 and ending with target num-
ber 12. This cycle is repeated 12 1/2 times/
sec. The light image from the energized LED is
focused by the receiver's cylindrical lens as aline cutting perpendicularly across its linear
photodiode array. This output from the photo-
diode array in the receiver is the signal that is
converted by the control unit into a displace-ment data sample. Because of vertical field-
of-view restrictions, one receiver monitors
the inboard six targets while the other receiver
monitors the outboard six targets. Figure 5
shows the layout of the FDMS on the X-29A.
Wingtip twist is calculated from the displace-
ments of the forward and aft tip targets.
Sample displacement data are shown in
figure 6.
STATIC AEROELASTIC ANALYSIS
A static aeroelastic analysis of the X-29A
is being performed to support the flight tests.A NASTRAN structural model (fig. 7) consisting
of seven separate substructures is assembledusing the NASTRAN substructuring technique,
and a FLEXSTAB aerodynamic model (fig. 8)
is used for the analysis, with modifications
to represent the wind-tunnel-derived aero-
dynamics. The NASTRAN model is used to pro=
vide structural flexibility data to FLEXSTAB for
the aerodynamic stability and control analysis.The FLEXSTAB program computes the pressuredistribution and structural deflections for trim-
med flight conditions corresponding to the
actual flight conditions. The pressure data areintegrated at the various load measurement
stations to provide analytical shear, bending
moment, and torque values for comparison
with the flight data. Streamwise twist values
are computed from the deflection data at theFDMS measurement stations on the wing. The
FLEXSTAB analysis is also run at theoretical
conditions correspondingto dynamic pressures
above the flight envelope values, correspondingto "altitudes" below sea level (fig. 9). The anal-
ysis is performed for conditions very near the
divergence dynamic pressure. This allows
comparisons to be made between extrapola-tions from FLEXSTAB analyses at dynamic
pressures corresponding to actual flight condi-tions and extrapolations from FLEXSTAB anal-
yses at dynamic pressures near the predicted
divergence dynamic pressure.
AIRCRAb-T CONFIGURATION AND
FLIGHT TEST CONDITIONS
The standard mode of operation of the X-
29A control system is known as normal digitalmode, with automatic camber control (ND/ACC).
This mode controls the flap position as a func-
tion of normal load factor such that the flaps
deflect more trailing edge down during increas-
ing load factor maneuvers. In order to obtainthe necessary load coefficient data for the
divergence extrapolations, wing loads and
deflections must be a function, of angle-of-
attack changes only. Therefore, a special flight
test mode has been designed, called manual
camber control (MCC), to allow operation of
the X-29A at constant camber settings during

maneuveringflight. The differencein wingloadsis shownin figure 10. In theMCC mode,the cambersettingcanalso be set at the samevaluefor flight testpointsfrom very low tovery high dynamicpressurevalues. To achievethis while preventingthe trim loadson thecanardsurfacesfrom becominglarge, canardprotectionlogic is incorporatedinto the con-trol system. This essentiallylimits operationin MCC modeto only two or threecambersettingsat eachflight condition.The cambersettingsavailableat transonicflight condi-tions (either zero flap angleor trailing edgeup flap anglesof 5° or 10°) arenot idealfor collectingaerodynamicdata. However,without the MCC mode,it wouldbe extremelydifficult to obtain the necessarydata for thedivergenceinvestigation.
Load coefficientand twist dataareobtained during angle-of-attacksweepmaneu-vers, both pushover-pullupsand windup turns,in order to obtaindataover the widestpossibleangle-of-attackrange. The maneuversareperformedat severalaltitudesat eachMachnumberof interest(fig. 11). From eachmaneuver,the slopeof the datawith respectto angleof attackis obtainedfor usein theextrapolation. All flight datapresentedarefrom Mach 0.90 maneuvers.
SUBCRITICALEXTRAPOLATION METHOD
The purpose of subcritical divergence
prediction techniques is to extrapolate the staticaeroelastic characteristics of the configuration
to the critical dynamic pressure at which theaeroelastic effects become infinite. When the
dynamic pressure is at the critical value, the
slightest disturbance results in essentiallyinstantaneous and catastrophic overload of the
aircraft structure. The aerodynamic load coef-
ficients with respect to angle of attack areinfinite at the critical condition.
Therefore, the first step in the process of
using the subcritical extrapolation technique isto determine the values of the twist or load per
unit angle-of-attack change at each flight condi-tion. These values are called _. This is done at
several constant dynamic pressure conditions
and the resulting data are extrapolated to the
critical dynamic pressure. The values of k are
the linear least squares slopes obtained by
plotting the twist or load data as a function of
angle of attack.
This is a simple matter if the data are
linear with respect to angle of attack within the
angle of attack range of interest. The data are
actually almost linear, varying slightly with
angle of attack (fig. 12). Since the extrapolation
is dependent on the subtle changes in _, due to
static aeroelasticity, the choice of an appropriate
angle-of-attack range for each maneuver and
flight condition becomes important.
There is a lack of agreement between theFLEXSTAB root bending moment and tip twist
divergence indicators when the analysis is
performed using dynamic pressures within the
flight envelope (fig. 13). These data provide
some indication of what to expect from the
actual flight measurement results. The flightdata for root bending moment coefficient and tip
twist do not extrapolate to the same value of
divergence dynamic pressure, but disagree
considerably (fig. 14). Such disagreement leads
to the use of a combination of techniques to
accomplish the envelope expansion process.
An example of how small errors in the
determination of _ values lead to larger errors
in the extrapolation to the divergence speed is
shown in figure 15. If the errors are in the samedirection and have the same percent magnitude,
the divergence speed is not changed. However,if the magnitude or direction of the errors dis-
agree, larger errors occur in the divergencespeed than are present in the L values. This is a
characteristic of all extrapolation methods. The
typical quality of flight data measurements
leads to the possibility of rather large errors in
_. values and even larger errors in the extrapo-
lated divergence speed. The choice of whichmeasurement to use as an indicator of the
divergence instability is important becausedifferent measurements result in different
divergence speed predictions, as shown in theFLEXSTAB analysis where measurement errorsdo not exist.
USE OF SOUTHWELL RESULTS FOR
ENVELOPE EXPANSION
Because of the disagreement in Southwell
extrapolation results, the envelope expansion
program consists of a combination of the South-
4

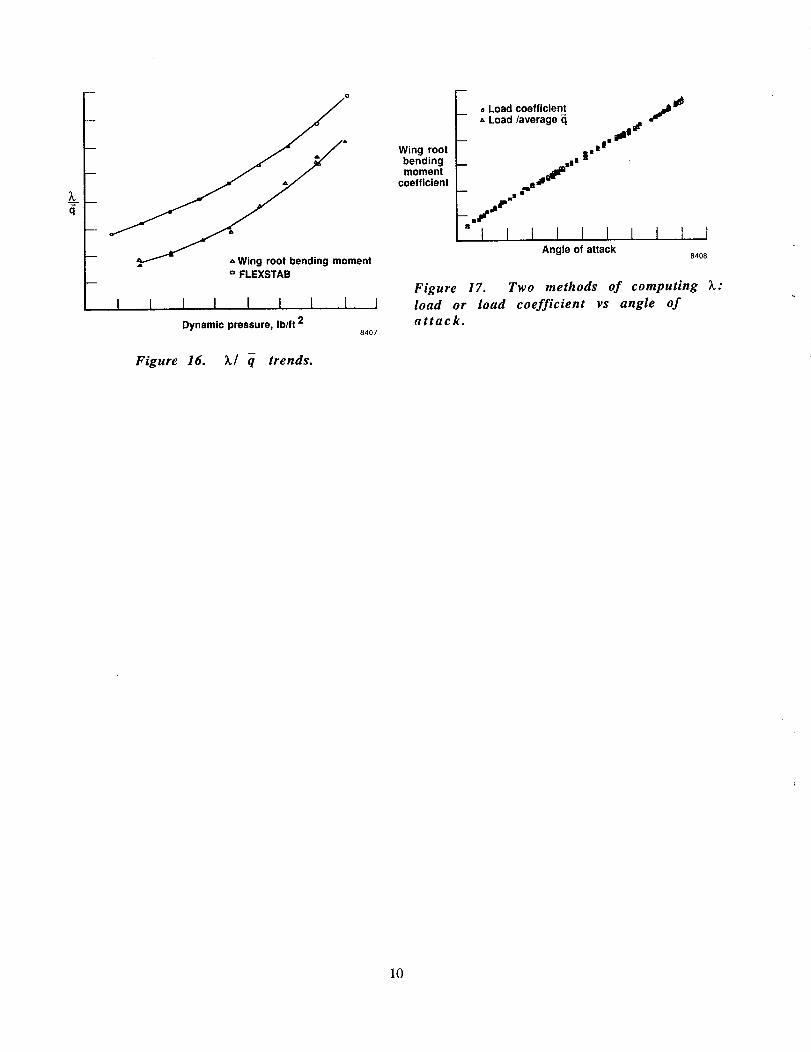
well results with point-to-pointclearances.Plotsof k valuesas a functionof dynamicpressureare preparedto allow trackingof trendswithrespectto the trendsfrom the FLEXSTABanal-ysis (fig. 16). This presentationof the dataallows judgmentsto be madeaboutthe likelyvalueof _, at the next dynamicpressurepoint,even thoughthe data cannotbe reliably extrapo-latedto the critical divergencespeed. As longasthe valuesof k do not increaseconsiderablymore than expectedfrom one dynamicpressurepoint to the next higherpoint, the envelopeexpansioncan proceedas planned. As moredata are obtainedat higher dynamicpressures,the reliability of the extrapolationof a particularmeasurementgenerally improves. However,becausethe critical dynamicpressurevaluesobtainedfrom a variety of measurementsdonot agree,thesevaluescannotestablishan actualflight-derived divergencespeedlimit.
ANALYSISCHALLENGES
Someof the factorswhichmakethesubcriticalextrapolationanalysisof flightdatachallengingarediscussedin this section.Becausethe dataare usedin an extrapola-tion process,small variationsthat are ordinarilyignoredcanbecomesignificant. Efforts to mini-mize the effect of thesevariationsare described.
Determinationof the k valuesat aparticularflight conditionis difficult becauseboth Mach numberand dynamicpressurevaryduring the maneuver. Usually the averageMachnumberis closeto the targetMachnumber.Variationsin Mach numberduring the maneu-ver areusually small (about3 percentor less).However,in the transonicrange,even thosesmall variationscan havesomeeffect on thevalueof _. Matchingthe targetdynamicpres-sureduringa given maneuveris not too criticalbecausethe valueof k will be usedwith respectto the averagedynamicpressureduring thatparticularmaneuver. However,variationsindynamicpressureduring the maneuvercan havea varietyof effectson theresultingvalueof _,,dependingon howthe dynamicpressurevarieswith respectto variatiQnsin angleof attackduring the maneuver. Someof theseeffectsdependon how the valueof _, is computedfromthe load measurement.
Thereare two ways to obtain7_values(fig. 17). The first is to plot the measurementasa functionof angleof attackandobtainthe slope.This slopeis the _, value. The Southwellanalysisrequiresthat the _, valuebe dividedby theaveragedynamic pressureof the maneuverto obtaina k/ q value. The second way to obtain
_, values is to normalize the measurement by
dynamic pressure at each time point throughout
the maneuver by dividing by the dynamic .......pressure at the instant when the measurement
was obtained. The slope of the normalizedmeasurement as a function of angle of attack is
then the _,/ q-value. To obtain the value of _,,
multiply the slope by the average dynamic
pressure of the maneuver. The second method is
preferred because it minimizes the errors caused
by variations of dynamic pressure during themaneuver.
The instantaneous values of _ and _,/ q are
higher when the dynamic pressure is higher,
even during the same maneuver. This leads to
nonlinear plots of load and load/ q-as a function
of angle of attack. The effect is greater on the
load as a function of angle of attack plots.
Therefore, a better result is obtained by taking
the slope of the load/ q as a function of angle of
attack plot. This js the method usedto reduce the load measurements. In fact, the
measurements used are actually the aerody-
namic load coefficients, which are normalized
for both dynamic pressure and the geometry
at a particular load measurement station.
Another factor in determination of the
value of _, for a particular dynamic pressure is
that the value of _, varies with angle of attack.
Even at moderate angles of attack representing
the typical linear range of aerodynamics, these
variations are present. This leads to obtaining
different values of _ for pushover-pullups and
windup turns, because the angle-of-attack
ranges for the two maneuver types are different.
When the data from these two maneuver types
are compared using a common angle-of-attack
range, the values show better agreement.
As the flight test progresses from lower
dynamic pressure test points to higher dynamic

pressuretest points, the trim angleof attackandthe rangeof angleof attackavailablewithin theload limits decreases.This is a factorin thequestionof what angle-of-attackrangeis best touseat eachtestpoint. The wind tunneldatacanaid in pointing out the "linear" portionof theangle-of-attackrangefor a rigid model. Theextrapolationto the divergencespeedmay beaffectedby the choiceof angle-of-attackrange.If the samenormalload factor range(forexample,1.5 to 3.0g) is used at all dynamic
pressures, the results may be different than ifthe same angle-of-attack range (for example,3.0 ° to 6.0 ° ) is used. Perhaps the most appro-
priate range to use is one that brackets the 1-gtrim condition likely at the divergence dynamic
pressure. Unfortunately, this is a very low
angle-of-attack condition, below 0g at most
flight conditions, and is also outside the "linear"wind tunnel angle-of-attack range. The current
data reflect use of the widest possible "linear"
angle-of-attack range for each maneuver. This
probably leads to lower quality extrapolation
results but provides more data for a givenmeasurement as a function of angle-of-attack
plot from which to determine _ values.
CONCLUDING REMARKS
The X-29A program provides data to allow
preliminary evaluation of the Southwell sub-
critical extrapolation technique using flight
measurements. The basic application of the
subcritical extrapolation technique is beingrefined to make the technique more reliable for
envelope expansion use. Many of the challeng-
ing problems are being identified by attempting
to apply subcritical extrapolation techniques toflight data which are for flight conditions far
removed from the critical flight condition.
More refined analysis of the data should be
performed to allow a definitive comparison tothe divergence dynamic pressure predicted by
the design data. Examination of data at 1.2 and0.8 Mach should be completed to evaluate the
technique at supersonic and subsonic conditions.
Recommendations for future flight test
applications of subcritical methods can be madeas a result of this program on the X-29A. High-
quality measurements of all parameters that
participate in the extrapolation, particularly
angle of attack, dynamic pressure, loads, and
deflections, are required to provide the neces-
sary sensitivity to obtain reliable results. A
predictive database should be available to use
for point-by-point tracking of the critical
parameters to assist in identification of anyadverse trends in the flight data. Finally, some
planningeffort is required to correctly identify
the parameters most likely to represent the
phenomenon of interest for use in any subcriticalextrapolation method.
REFERENCES
Ricketts, Rodney H. and Robert V. Doggett, Jr.,
Wind-Tunnel Experiments on Divergence ofForward-Swept Wings, NASA TP-1685, 1980.
Chipman, Richard, Frank Rauch, Melvyn Rimer,
and Benigno Muffiz, Body-Freedom Flutter ofa 1�2-Scale Forward-Swept-Wing Model, an
Experimental and Analytical Study, NASACR-172324, 1984.
Figure 1. X-29A forward-swept wingtechnology demonstrator aircraft.
OF POOR QUAI41'L_

.4 --
.3 --
;_ .2 m
q
.1 m
,_nge of flight data
I I II0
I I20 40 60 80 100
Percent of divergence dynamic pressure 8394
Figure 2. Contrast between wind tunnel
and flight data.
40
percentchord
WS 110 st
chord
O Spar cap bending
O Spar web shear
r-I Composite skin
bending
A Composite skinshear
Rear A n Front
spar 6 5 4 3 2 1 spar
Typical cross section
WS 80 at
4O
IFront
spar
Rear
spar
8395
Figure 3. X-29A wing load measurements.
Deflection Flightmeasurement instrumentation
system systemLEDs
1 r Photodlode i Other• data Telemetry
[ __ I array , _ .---,2 I I
I IIZ , , kt YI __J.J_tlTII I I I PCMsystsmI--K3 4_-'fl k,J I I I I I
IL_, I Lens I-_1 I t
- I 'l I ',,..°o,..II I /
_;i ..... _'_h onllal el
r i
t P°wer--_ I -'-signal 83.93
Figure 4. X-29A FDMS functional diagram.
'_ /--Deflection
•"_,_ / measurement
FDMS targets (12) _ . _/ system
///'--_ _receivers (2)
_ 8396
Figure 5. X-29A FDMS installation of
targets and receivers.
Deflection
___ Front spa Z
I I I IAngle of attack
8397
Figure 6. Wingtip deflection.

8398
Figure 7. X-29A NASTRAN model.
351 total singularitiesTop ._ ,-_ ........
Front
Side
Figure 8. X-29A FLEXSTABaerodynamic model.
3000 m
8399
Iblft 2
2000
1000
/-- Sea level _///_
.2 .4 .6 .8 1.0
Mach number
Figure 9. FLEXSTAB analysisconditions.
I1,2
8400
Wing rootbendingmomentairload
coefficient
m &
-- ACC .,j eo"
-- ,b.o_ o_" L MCC
Angle of attack
I
8401
Figure I0. Contrast between ACC andMCC windup turns.
50,000
40,000 -
30,000
Altitude,
20,000
10,000
0.7
Figure 11.
-c_ 200 Ib/ft2 _ 700 Ib/ft 2
300 Ib/ft2 _ 800 Ib/ft 2
400 Ib/ft2 _ 900 Ib/ft 2
-o- 500 Ib/ft 2 x 1000 Ib/ft 2
.4- 600 Ib/ft 2
f
.8 .9 1.0 1.1 1.2 .3
Mach number8402
Test matrix for divergence.

Rootbendingmomentalrload
coefficient
Slope = 0.0418-- [ I
Slope = 0.0417 y
-- Slop;= 0.0440 '//
Slope = 0.0449. ,7/
pe = 0.0443"_l°pe = 0.0478
I I I I I I I I I IAngle of attack
8403
Figure 12. Determination of Z� q.
-- Tip twist //
__ slope =97 percent 7/ 9/
Y oen/_" ,,J slope = 113 percent
7/ o,oovI/ /t I I
/q 8404
Figure 13. Southwell plot for FLEXSTAB
at flight altitudes.
/-- Tip Twist
slope = 81 percent ///of E
o_ _.,/ _- Root bending moment/_ ,_' slope = 88 percent
/</ o,L X T, aueII/I I I I I I
_"/q 8405
Figure 14. Southwell plot for flight data.
/ _"/ ", -+10 percent-- / //// error
// 2o,ooo,,///_/"/j3o,ooo it
-- ///_.Z_O-_ 35,000 ft///_/-_40,000 ft
--_-=_=_===_-_ I -I I I I I I
JL/q 8406
Figure 15. Effect of measurement errors.
mo
a.
-- . ,,, Wing root bending momento FLEXSTAB
I I I I I I I ] I
Dynamic pressure, Ib/ft 28407
Figure 16. _/ q trends.
Wing rootbendingmoment
coefficient
° Load coefficient-- - Load/average
-- IP illtl #'
_ .r.. *r'' •"a'*_lPi_l' I'l
II
I i I i I i i I t iAngle of attack
8408
Figure 17. Two methods of computing _:
load or load coefficient vs angle of
attack.
lO

F4_e _rm_n
I. Report No.
NASA TM-100445
4. Title end Subtitle
Report Documentation Page
2. Government Accession No.
Current Flight Test Experience Related toStructural Divergence of Forward-Swept Wings
3. Recipient's Catalog No.
5. Report Date
August 1988
7. Author(s)
Lawrence S. Schuster and William A. Lokos
9. Performing Organization Name end Address
NASA Ames Research Center
Dryden Flight Research FacilityP.O. Box 273, Edwards, CA 93523-5000
12. Sponsoring Agency Name and Address
National Aeronautics and Space AdministrationWashington, D.C. 20546
6. Performing Organization Coda
8. Performing Organization Report No.
H-1500
10. Work Unit No.
RTOP 505-63-02
ii. Contract or Grant No.
13. Type of Report and Period Covered
Technical Memorandum
14. Sponsoring Agency Code
15. Supplementary Notes
Prepared for presentation at the 1988 International Symposium of Flight Test Engineers,Arlington, Texas, August 14--18, 1988.
16. Abstract
Flight testing the X-29A forward-swept-wing aircraft has required developmentof new flight test techniques to accomplish subcritical extrapolations to the actualstructural divergence dynamic pressure of the aircraft. This paper provides currentexperience related to applying these techniques to analysis of flight data from theforward-swept wing in order to assess the applicability of these techniques to flighttest data. The measurements required, maneuvers flown, and flight test conditions aredescribed. Supporting analytical predictions for the techniques are described and theresults using flight data are compared to these predictions. Use of the results during
envelope expansion and the resulting modifications to the techniques are discussed.Some of the analysis challenges that occurred are addressed and some preliminaryconclusions and recommendations are made relative to the usefulness of these
techniques in the flight test environment.
"17. Key Words (Suggested by Author(s))
Envelope expansion, Extrapolationtechniques, FLEXSTAB, Forward-sweptwing, In-flight deflection measurement,NASTRAN, Static aeroelasticity, Structuraldivergence
19. Security Classif. (of this report) 20. Security Classif. (of this page)
Unclassified Unclassified
NASA FORM 1626 OCT 88r
*For sale by the National Technical Information
18. Distribution Statement
Unclassified--Unlimited
Subject category 05
21. No. of pages 22. Price
11 A02
Service, Springfield, Virginia 22161.
