current and future activities concerning biogas plant methane
TRANSCRIPT
iBBA Methane Emissions Workshop
Kiel, Germany
September 4, 2014
Current and future activities concerning biogas plant methane emissions in the EC
and IEA Bioenergy Task 37
David BAXTER
European Commission, JRC Institute for Energy and Transport
Leader of IEA Bioenergy Task 37

Overview
• Summary of GHG savings requirements in the EU (Renewables Directive (2009/28/EC) - RED)
• New EU publication – biogas pathways
• Emissions data
• Sample Life Cycle Assessments of biogas plants
IEA Bioenergy Task 37

EU Renewables Directive 2009/28/EC
• Calculation of GHG Impact
Article 19 (1) Defines the method for calculation, using the methodology given in Annex V.C. Typical and default values for GHG emissions for “cultivation”, “transport” and “processing” steps given in Annex V.D & E Here, the difference between GHG emissions for biofuels produced from energy crops and those produced from wastes/residues becomes apparent

• Default GHG savings compared with fossil petrol/diesel (Annex V.A)
Some GHG Savings in the RED
Biogas* from municipal organic waste 73% Biogas* from wet manure 81% Biogas* from dry manure 82% Rapeseed biodiesel 38% Palm oil biodiesel (CH4 capture at mill) 56% Sugar beet ethanol 52% Sugar cane ethanol 71% ( * in the form of compressed biomethane compatible with natural gas)

GHG savings calculation according to the RED
BIOGRACE European project calculation tool, http://www.biograce.net/content/ghgcalculationtools/recognisedtool
BioGrace Excel tool
Version 4c for Compliance
New EU publications
August 2014 State of play on the sustainability of solid and gaseous biomass used for electricity, heating and cooling in the EU (Staff Working Document, SWD (2014)259) http://ec.europa.eu/energy/renewables/bioenergy/doc/2014_biomass_state_of_play_.pdf
JRC scientific report on the default and input values for GHG emissions of biomass (Report EUR 26696 EN, 2014) http://iet.jrc.ec.europa.eu/bf-ca/publications

New EU Biogas Pathways
1. An energy crop: maize silage; 2. An agricultural waste: feedlot manure; 3. Municipal organic and agro-industrial waste: biowastes. (and co-digestion) These combine with two means of digestate management: open tank storage; closed tank storage (gas tight). Also combined with two end-uses for the biogas: biogas for power and heat production; biogas upgrading to biomethane (without combustion of the off-gas) (with combustion of the off-gas)

Based on: • LHV (maize): 16.9 MJ/kg (Moisture = 65%) • LHV (slurry): 12 MJ/kg (Moisture = 90%) • LHV (Biowaste): 20.7 MJ/kg (Moisture = 76,3%) • Temperature of digestate: ca. 20°C • Residual methane potential: maize = 30 l CH4 / kg VS manure = 35 l CH4 / kg VS biowaste = 44 l CH4 / kg VS • Methane losses
maize = 0.44 g CH4 / MJ biogas manure = 2.0 g CH4 / MJ biogas biowaste = 0.49 g CH4 / MJ biogas
Digestate methane emissions
• Upgrading with venting of the off-gas includes pressure swing absorption, pressure water scrubbing, membranes and organic physical scrubbing. The methane lost in the off-gas is considered to be emitted to the atmosphere.
• Upgrading with oxidation of the off-gas includes pressure swing absorption if the water is recycled, organic physical scrubbing, chemical scrubbing and cryogenic. In this case, the off-gases are considered to be flared with a high efficiency.
Biomethane production emissions
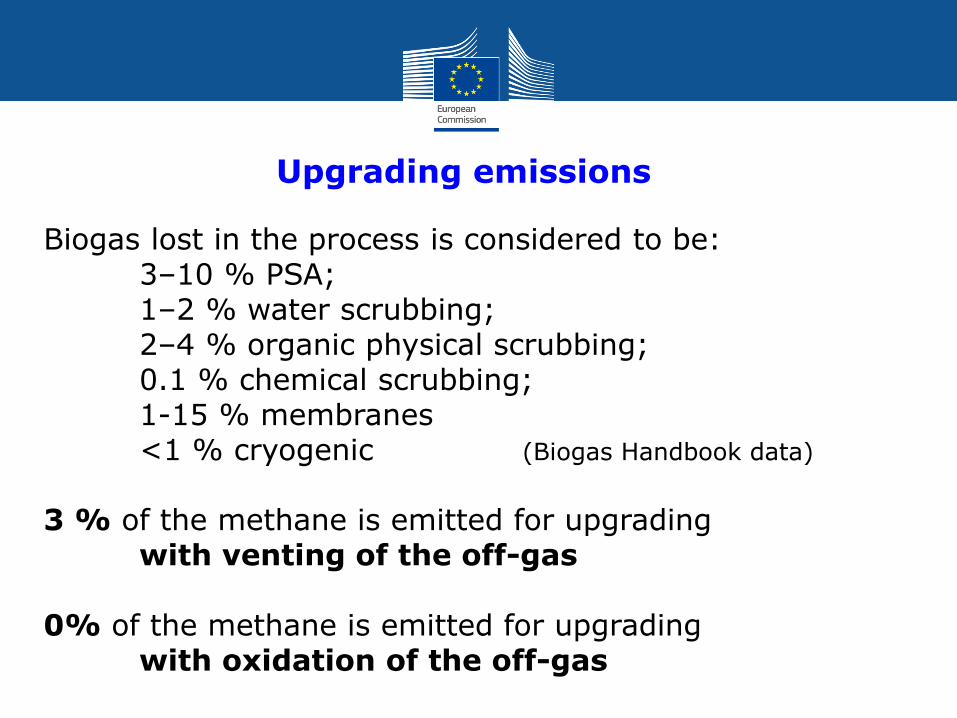
Biogas lost in the process is considered to be: 3–10 % PSA; 1–2 % water scrubbing; 2–4 % organic physical scrubbing; 0.1 % chemical scrubbing; 1-15 % membranes <1 % cryogenic (Biogas Handbook data)
Upgrading emissions
3 % of the methane is emitted for upgrading with venting of the off-gas 0% of the methane is emitted for upgrading with oxidation of the off-gas

Electricity generation (CHP engine)
Emissions reported to be from 0.44% to 2.43% JRC average value taken to be 1,7% Gross electrical efficiency of the CHP engine considered to be 36 % in sample calculations.
Recent JRC study and Commission "Staff Working Document" can be found at: http://ec.europa.eu/energy/renewables/bioenergy/sustainability_criteria_en.htm

Emissions data
IEA Bioenergy Task 38 (2010) GHG benefits of a biogas plant in Austria, Woess- Gallasch et al. IEA Bioenergy Task 38 case study, 2010/ Joanneum Research report ENG-B-05/10
IEA Bioenergy Task 37 (2013) Methane emissions in biogas production, Dumont et al. Biogas Handbook, Chapter 11 (2013)
Liebetrau et al. (2011) Methane emissions from biogas-producing facilities within the agricultural sector, Eng. Life Sci., 10 (2010) 595–599

"Processing" System Boundary
Source: Dumont et al. Biogas Handbook Chapter 11 (2013) Woodhead Publishing
Substrate
storage
(§ 3.2)
Digestion
(§ 3.3)
Digestate
storage
(§ 3.5)
CHP
(§ 3.4.1)
Biogas
upgrading
(§ 3.4.2)
Energy crops
Processing
residues
Manure
Transport
Substrate
productionTransport
Biogas generation Biogas
utilization
Substrate
storage
(§ 3.2)
Digestion
(§ 3.3)
Digestate
storage
(§ 3.5)
CHP
(§ 3.4.1)
Biogas
upgrading
(§ 3.4.2)
Energy crops
Processing
residues
Manure
Transport
Substrate
productionTransport
Biogas generation Biogas
utilization
Substrate
storage
(§ 3.2)
Digestion
(§ 3.3)
Digestate
storage
(§ 3.5)
CHP
(§ 3.4.1)
Biogas
upgrading
(§ 3.4.2)
Energy crops
Processing
residues
Manure
Transport
Substrate
productionTransport
Biogas generation Biogas
utilization
IEA Bioenergy Task 37

Biogas Handbook – Chapter 11
x
Substrate
storage
Short term
at site
limited
0.2-0.5%
Digestion
Low
emissions
0.02-
0.07%
Digestate
storage
Range of
0.5-11%
when
uncovered
..Low
when
covered
see
digester
CHP
(0.5 – 6%)
Biogas
upgrading
0,0 – 1,5%
based on
limited
sources
Energy crops
Processing
residues
Manure
Transport
Substrate
productionTransport
Biogas generation Biogas
utilization
Emission long term
Manure storage
20 – 45% of
Methane potential
Substrate
storage
Short term
at site
limited
0.2-0.5%
Digestion
Low
emissions
0.02-
0.07%
Digestate
storage
Range of
0.5-11%
when
uncovered
..Low
when
covered
see
digester
CHP
(0.5 – 6%)
Biogas
upgrading
0,0 – 1,5%
based on
limited
sources
Energy crops
Processing
residues
Manure
Transport
Substrate
productionTransport
Biogas generation Biogas
utilization
Substrate
storage
Short term
at site
limited
0.2-0.5%
Digestion
Low
emissions
0.02-
0.07%
Digestate
storage
Range of
0.5-11%
when
uncovered
..Low
when
covered
see
digester
CHP
(0.5 – 6%)
Biogas
upgrading
0,0 – 1,5%
based on
limited
sources
Energy crops
Processing
residues
Manure
Transport
Substrate
productionTransport
Biogas generation Biogas
utilization
Emission long term
Manure storage
20 – 45% of
Methane potential
Source: Dumont et al. Biogas Handbook Chapter 11 (2013) Woodhead Publishing
IEA Bioenergy Task 37

AD components Configuration Min. average loss
of methane (%)
Max. average loss of
methane (%)
Silage storage – 0.00065 0.00065
Feeding systems Screw conveyor 0.0079 0.0079
Dosing feeder 0.00029 0.16
Substrate storage tank
0.005 0.311
Mixing tank 0.013 0.288
Digester Foil cover 0.006 0.0244
Gas-tight cover 0 0
Concrete roof 0 0
Digestate storage tank Open 0.224 11.22
Covered 0.638 10.299
Gas utilization CHP 0.44 2.43
Upgrading 1.5 1.5
Part of Process Component Min. average methane loss (%)
Max. average methane loss (%)
Silage storage – 0.00065 0.00065
Feeding systems Screw conveyor 0.0079 0.0079
Dosing feeder 0.00029 0.16
Substrate storage tank
0.005 0.311
Mixing tank 0.013 0.288
Digester Foil cover 0.006 0.0244
Gas-tight cover 0 0
Concrete roof 0 0
Digestate storage tank
Open 0.224 11.22
Covered 0.638 10.299
Gas utilisation CHP 0.44 2.43
Upgrading 1.5 1.5
Biogas Handbook – Chapter 11 – emissions
Dumont et al. Biogas Handbook Chapter 11 (2013) from original work by Liebetrau et al. (2011)
IEA Bioenergy Task 37

LCA of biogas plants
Effect of open and closed digestate storage
Source: (JRC) Boulamanti et al. Biomass & Bioenergy, 53 (2013) 149-161

Contributions of different process components for GWP
Source: (JRC) Boulamanti et al. Biomass & Bioenergy, 53 (2013) 149-161
LCA of biogas plants

Contributions of different GHGs for GWP
Source: (JRC) Boulamanti et al. Biomass & Bioenergy, 53 (2013) 149-161
LCA of biogas plants

Best practice guide
Anneli Petersson “The Swedish voluntary system for control of methane emissions”, IEA Bioenergy Task 37, May 2012, http://www.iea-biogas.net/case-studies.html
IEA Bioenergy Task 37

Current IEA Bioenergy Task 37 Study
IEA Bioenergy Task 37
Linked to Swedish methane emissions measurement project (2014-2015) "Methane emissions in biogas plants: measurement, calculation and evaluation" Bernd Linke at al. (2015)

Country Reports
Annual summary report published each January
http://www.iea-biogas.net/country-reports.html
IEA Bioenergy Task 37

The Biogas Handbook Science, production And applications 2013 http://www.woodheadpublishing.com/ en/book.aspx?bookID=2576 http://store.elsevier.com/product. jsp?locale=en_US&isbn=9780857094988
IEA Bioenergy Task 37

Recommendations
• Guidelines for the selection and use of "literature" emissions data in LCA studies and environmental assessments of biogas and biomethane installations
• Preparation of best available emissions data from biogas and biomethane installations for use by environmental impact assessors (students, researchers, plant operators, public authorities, etc. etc.)
IEA Bioenergy Task 37

Thank you for your attention
http://www.iea-biogas.net/
IEA Bioenergy Task 37