currency crashes in industrial countries: much ado … probability of currency crisis ... (sp),...
TRANSCRIPT

Board of Governors of the Federal Reserve System
International Finance Discussion Papers
Number 966
February 2009
Currency Crashes in Industrial Countries: Much Ado About Nothing?
Joseph E. Gagnon
NOTE: International Finance Discussion Papers are preliminary materials circulated to stimulate discussion and critical comment. References in publications to International Finance Discussion Papers (other than an acknowledgment that the writer has had access to unpublished material) should be cleared with the author or authors. Recent IFDPs are available on the Web at www.federalreserve.gov/pubs/ifdp/. This paper can be downloaded without charge from Social Sciences Research Network electronic library at www.ssrn.com.

Currency Crashes in Industrial Countries: Much Ado About Nothing?
Joseph E. Gagnon*
Abstract
Sharp exchange rate depreciations, or currency crashes, are associated with poor economic outcomes in industrial countries only when they are caused by inflationary macroeconomic policies. Moreover, the poor outcomes are attributable to inflationary policies in general and not the currency crashes in particular. On the other hand, crashes caused by rising unemployment or external deficits have always had good economic consequences with stable or falling inflation rates.
Keywords: Exchange rate, depreciation, inflation, unemployment, current account JEL Classification: F31, F32, F41
* Visiting Associate Director, Division of Monetary Affairs, Board of Governors of the Federal Reserve System, Washington, DC 20551 U.S.A. I owe a tremendous debt of gratitude to Hilary Croke and Steve Kamin, who worked with me on a previous attempt to get at the issues covered by this paper and who provided helpful comments and advice. I also thank Hilary for putting together the initial dataset and chart package and for collecting the IMF documents. The views expressed here are my own and should not be interpreted as reflecting the views of the Board of Governors of the Federal Reserve System or of any other person associated with the Federal Reserve System.

- 1 -
Introduction and Summary
Many economic commentators appear to believe that currency crashes invariably
have harmful effects.1 This paper shows that, for industrial countries, the evidence does not
support this commonly held view.
Using quarterly data for 20 industrial countries since 1970, this paper identifies 19
episodes of sharp exchange rate depreciations or currency crashes. The episodes are
categorized according to the causal factors that appear to have been important in each case.
Three broad groupings of causal factors are identified: inflationary macroeconomic policies,
large current account deficits or capital outflows, and rising unemployment rates. Often
more than one of these factor groupings appeared to be present.
Crashes were followed by poor macroeconomic outcomes (slow GDP growth, rising
bond yields, and falling equity prices) only when they resulted from inflationary
macroeconomic policies. Moreover, currency crashes did not, by themselves, appear to
contribute to these poor outcomes. Indeed, the evidence suggests that currency crashes
tended to counteract the slowing of GDP growth that often occurs during and after
inflationary periods. Ceteris paribus, currency crashes do contribute to inflationary pressure,
but there are numerous episodes of crashes in which inflation remained constant or even
declined in the quarters immediately after the crash, reflecting the effects of other economic
forces.
Before 1986, crashes were almost always caused by inflationary macroeconomic
policies (and inflationary policies typically led to declining external balances). A common
theme among most of the inflationary episodes is the apparent underestimation of the natural
rate of unemployment by policy makers. In the wake of these inflationary crashes, the 1 See, for example, Volcker (2005), The Financial Times (2008), and The Wall Street Journal (2008).
- 2 -
behavior of GDP growth depended critically on monetary and fiscal policies. When
authorities decided to fight inflation, recession typically ensued. When authorities did not
fight inflation, the economy generally continued to grow.2 In most of the episodes driven by
inflation, bond yields rose and real equity prices fell, regardless of the stance of
macroeconomic policy.
Since 1985, crashes appear to have been caused by negative shocks to economic
activity and/or financial market concerns about current account sustainability. Crashes in
this period have been less frequent than in the years prior to 1986 and they have always been
followed by periods of strong growth with little or no acceleration of inflation, stable or
falling bond yields, and rising real equity prices.
Previous Studies
An extensive literature seeks to explain financial crises or to identify early warning
indicators of such crises, particularly in emerging markets. This literature encompasses
banking crises, sovereign debt crises, and currency crises, where “currency crisis” may be
defined to include periods of sharp depreciation as well as periods in which a central bank
successfully defends a currency peg from a speculative attack. Good reviews of the early
warning literature on currency crises are Edison (2003) and Berg, Borensztein, and Pattillo
(2004). Three studies that focus on sharp depreciations, or “currency crashes,” in emerging
markets are Frankel and Rose (1996), Milesi-Ferretti and Razin (1998), and Kumar,
Moorthy, and Perraudin (2003). These studies find that depletion of foreign exchange
reserves is a robust predictor of currency crashes; other, less robust, predictors include rapid
2 This paper does not shed light on whether inflation, by itself, is harmful to growth. Indeed, there appear to be episodes in which growth was lackluster after high inflation even in the absence of tight macroeconomic policies. However, the differences in growth outcomes are clearly accentuated by differences in policy stance.
- 3 -
domestic credit growth, an overvalued exchange rate, weak GDP growth, and high industrial-
country interest rates. Somewhat surprisingly, these studies do not find a consistent
correlation between the level of foreign debt or the current account balance and subsequent
currency crashes. Dooley and Frankel (2003) examine the consequences of currency crises
in emerging markets. The papers in their volume highlight the importance of large foreign-
currency debts and weak macroeconomic policy institutions in explaining the poor economic
outcomes in these emerging-market episodes.
In an interesting study that bridges the gap between emerging markets and industrial
countries, Osband and van Rijckeghem (2000) search for ranges of relevant macro and
financial variables which historically have been associated with extremely low probabilities
of a currency crisis in the following year. They find that high foreign exchange reserves, low
foreign debt, and a higher (more positive) current account balance imply a very low
probability of a currency crisis. After estimating these relationships on developing-country
data, they apply them to industrial countries and show that they hold up well. Tudela (2004)
applies indicator analysis to industrial countries and finds that import growth, fiscal deficits,
non-FDI capital inflows, and an appreciated real exchange rate are all positively related to
the probability of currency crisis in the following year. Wright and Gagnon (2006) find that
current account deficits, high inflation rates, and weak GDP growth rates have predictive
power for currency crashes in industrial countries.
Gagnon (2009) is the only extant study of the effects of currency crashes in industrial
countries. Using a different dataset and crash definition than this paper, Gagnon found that
currency crashes were followed by rising bond yields only when inflation was high and/or
rising before the crash, and that no currency crash since 1985 was followed (or preceded) by
- 4 -
rising bond yields. Crashes since 1985 also tended to be associated with rising real equity
values. Croke, Kamin, and Leduc (2006), Debelle and Galati (2005), Algieri and Bracke
(2007), and Freund and Warnock (2007) examine reversals of major current account deficits
in industrial countries. There is some overlap between episodes of currency crashes and
episodes of current account adjustment, with crashes tending to occur before adjustments.
But many currency crashes are not followed by current account adjustments and many
current account adjustments are not preceded by currency crashes. Three of these studies
(Debelle and Galati is the exception) find that episodes with the largest currency
depreciations are generally those with the most benign outcomes for GDP growth.
Data Sources
This paper uses quarterly-average effective, or trade-weighted, nominal and real
exchange rates available from the Bank for International Settlements (BIS) based on a group
of 26 relatively advanced economies. The effective exchange rates are available from 1964,
but we start our analysis in 1970 because most of the other economic series we use are
available only from 1970. The 20 countries we study are Australia (AL), Belgium (BE),
Canada (CA), Denmark (DK), Finland (FI), France (FR), Germany (GE), Greece (GC),
Ireland (IR), Italy (IT), Japan (JA), Netherlands (NL), New Zealand (NZ), Norway (NO),
Portugal (PT), Spain (SP), Sweden (SD), Switzerland (SZ), the United Kingdom (UK), and
the United States (US).3
3 Five of the 26 countries with BIS exchange rate data (Hong Kong, Mexico, Singapore, South Korea, and Taiwan) are not classified as industrial countries by the International Monetary Fund. These countries are now considered to be “advanced,” but they were still viewed as developing countries in the 1970s and 1980s. Austria is also among the countries in the BIS dataset, but quarterly national accounts data for Austria are not available over most of our sample period. Austria did not experience a currency crash under the definition used here.

- 5 -
Most of the other data used in this paper are from the Organization for Economic
Cooperation and Development (OECD) Economic Outlook database. The primary
exceptions are equity prices (from the OECD Main Economic Indicators database) and
foreign exchange reserves and dollar exchange rates (from the International Monetary Fund
(IMF) International Financial Statistics database). Where possible, gaps in the data were
filled in using the IMF International Financial Statistics database.4 Government balances for
all countries are at an annual frequency.5 Inflation rates are based on GDP deflators.
Identification of Crashes
A necessary condition for a crash in this paper is an exchange rate depreciation that
exceeds 15 percent over four quarters.6 In some cases, the exchange rate continued to
decline at a rate in excess of 15 percent for several quarters, but I group such closely
connected periods of depreciation as single episodes.
To qualify as a separate episode, the four-quarter exchange rate depreciation must
exceed 15 percent and it must not have exceeded 15 percent in any of the previous
four quarters. Applying this criterion yields 27 episodes.
In some of these 27 episodes, the sharp depreciation reflected a quick reversal of a
previous sharp appreciation. In some other cases, the sharp depreciation was itself reversed
4 Greek equity prices from 1979 through 1984 were obtained from the Bank of Greece Reports for the years 1982-85. Greek unemployment rates are available only at an annual frequency. The Greek current account for 1998 was obtained from Eurostat. Greek current account data were not available on a seasonally adjusted basis, and were adjusted by regressing on quarterly dummies. Spanish current account data for 1982 contained extremely large quarterly fluctuations that appear to be spurious. They were replaced by a flat value equal to the average for the year. 5 The balances for New Zealand from 1971 through 1985 refer to fiscal years (ending March 31) and were obtained from the IMF Recent Economic Developments papers cited in the case studies for New Zealand. The balances for Portugal from 1974 through 1977 were obtained from the IMF Recent Economic Developments paper cited in the 1977 case study for Portugal. 6 The depreciation is measured as the difference in the logarithm of the exchange rate.

- 6 -
soon afterwards. In order to focus on episodes that represent a sustained change in the
economic environment, I apply two additional criteria to filter out transitory exchange rate
fluctuations.
First, I require that the 15-percent depreciation criterion also holds when measured
over the previous eight quarters, to rule out cases in which the exchange rate was
simply reversing a temporary appreciation.
o This criterion filters out the following episodes: JA1979, JA1996, NZ1986,
NZ1998, SD1977, and UK1986.
Second, I require that the exchange rate not unwind more than one-fourth of its four-
quarter depreciation during the subsequent four quarters.
o This criterion filters out the following episodes: IT1995, JA1990, NZ1986,
and UK1986.
I believe that excluding most of these episodes is reasonable. In particular, contemporaneous
economic reporting generally did not view these episodes as periods of currency crisis. Two
potential exceptions are NZ1998 and SD1977, which were viewed as periods of currency
crisis by some contemporaneous observers. Including these in our analysis would not have
affected the results of this paper; the Swedish experience of 1977 fits in well with the
inflationary crashes and the New Zealand experience in 1998 accords well with the crashes
driven by rising unemployment.
A third criterion that some previous studies of developing countries have imposed
(Frankel and Rose) is that the depreciation is not simply a gradual acceleration of a pre-
existing downtrend. That criterion does not appear to be relevant for industrial countries.
Requiring that the four-quarter exchange rate depreciation be at least 7.5 percentage points

- 7 -
greater than that over the previous four quarters does not filter out any of these episodes.7
All of them represented substantial accelerations of the rate of depreciation.
Altogether then, this paper examines 19 episodes of sharp depreciations, or currency
crashes: AL1985, FI1992, GC1980, GC1983, GC1985, IT1973, IT1976, IT1993, NZ1975,
NZ1984, PT1977, PT1982, SD1983, SD1993, SP1977, SP1983, SP1993, UK1976, and
US1986.8 Most of these episodes were viewed by some contemporaneous observers as
periods of currency crisis. Figure 1 plots the four-quarter change in the nominal effective
exchange rate for each country in our dataset, with the beginning of each crash episode
marked by a vertical red line.9
As an aside, I note that applying the analogous criteria to sharp exchange rate
appreciations would identify only 9 episodes of sharp and sustained appreciations: AL2003,
GE1973, JA1977, JA1986, JA1993, JA1999, SZ1975, SZ1978, and UK1997. The relative
rarity of sharp appreciations implies at least a modest degree of asymmetry between
appreciations and depreciations.
Causes of Crash Episodes
Variables identified by the empirical literature as related to currency crashes can be
grouped into three broad categories relating to underlying factors.
High current or expected inflation. Excessively expansionary macroeconomic
policies.
7 UK1976 meets this criterion when data are rounded to three decimal places. 8 Twelve of these episodes would also meet a stricter standard of at least a 20 percent depreciation. The episodes that would not satisfy the stricter standard are FI1992, GC1980, IT1973, SD1983, SP1993, UK1976, and US1986. 9 The dashed vertical line for the United States represents the dollar crisis of 1978, which did not meet these criteria, but was widely viewed as a period of intense weakness of the U.S. dollar.

- 8 -
Large current account deficit. Decreasing stock of foreign exchange reserves.
Large or growing foreign debt.
Rising unemployment. Weak aggregate demand. Slow GDP growth.
Moreover, there are interconnections between these factors. In particular, expansionary
macroeconomic policies can boost demand for imports and thus lower the current account
balance. Also, a drop in foreign demand for a country’s exports can create a current account
deficit and rising unemployment.
High Inflation
Inflationary policies ultimately put upward pressure on all prices, including the price
of foreign currency. A rise in the price of foreign currency is a depreciation of the exchange
rate. Whether the exchange rate depreciation happens early or late in the inflationary process
depends critically on a myriad of factors, such as wage and price controls, trade barriers,
controls on international capital flows, and the exchange rate regime. Perhaps the most
important factor is the exchange rate regime.
When the central bank pegs or stabilizes the exchange rate in the face of
inflationary macroeconomic policies, prices of goods and services tend to rise before
the exchange rate depreciates. These price increases push up the real exchange rate,
leading to a decline in the current account balance. Investors may anticipate that a
depreciation ultimately will be necessary, leading to outflows of private capital. The
downturns in the balances for both current transactions and private capital flows
deplete the central bank’s foreign exchange reserves, ultimately forcing it to devalue
the currency.

- 9 -
When the central bank adjusts the exchange rate frequently or allows it to
float in the face of inflationary macroeconomic policies, the exchange rate often
depreciates before broad price indexes begin to accelerate. As an asset price set in
financial markets, the exchange rate tends to respond quickly to new information,
including information on the future stance of macroeconomic policy.
Pressures on External Accounts
As noted above, when the exchange rate is not freely floating, a widening current
account deficit and diminishing foreign exchange reserves can be part of the process by
which inflationary policies lead to currency crashes. However, other sources of change in the
demand and supply of a country’s imports and exports can also contribute to a widening
current account deficit and diminishing reserves. These include, for example, trade policies,
global commodity prices, business cycles in key trading partners, and investor perceptions of
the investment climate. A currency crash occurs when investors suddenly decide to pull their
capital out or to stop financing the current account imbalance.
Rising Unemployment
A third factor contributing to currency crashes is a negative shock to aggregate
demand that slows economic activity and increases the rate of unemployment. In the face of
a contractionary shock, central banks tend to ease monetary policy. In the case of fixed
exchange rate regimes, the ease takes the form of a devaluation. In the case of floating
exchange rate regimes, the ease takes the form of lower interest rates, which in turn push

- 10 -
down the exchange value of the currency. If the source of the shock is reduced demand for a
country’s exports, the current account deficit may also contribute to the currency crash.
Historical Experience
Table 1 displays measures of these three factors around the onsets of currency
crashes. The first column shows the difference between inflation in the country experiencing
a currency crash and the average over all 20 countries, which is termed “excess inflation.”
Excess inflation is based on the average annual percent changes from four quarters before the
start of the crash to four quarters after the start of the crash.10 The value of 5.4 in the first
row implies that the price level in Italy rose by nearly 11 percentage points more than the
average across all industrial countries over the eight quarters surrounding the onset of the
1973 crash. The bottom rows show that the mean of excess inflation in crash episodes was
4.4 percent and the mean across all countries and time periods was 0 with a standard
deviation of 3.3 percentage points. Numbers in bold are more than one standard deviation
above or below the sample mean. In about half of the crash episodes, excess inflation was
more than one standard deviation above the sample mean and it was never more than one
standard deviation below the mean. This finding corroborates the view that currency crashes
are often caused by inflationary policies. Despite the small negative value of excess inflation
in Australia 1985, this episode is categorized as an inflationary one because the IMF
attributed the crash in part to market unease about monetary conditions and because excess
inflation increased markedly over the following two years.
10 Inflation before the crash is included to capture inflationary pressure in fixed exchange rate regimes. Inflation after the crash is included to capture inflationary pressure in floating exchange rate regimes or cases in which a devaluation of the fixed exchange rate was one of the primary inflationary policy actions.

- 11 -
The second column of Table 1 lists the current account balance in the quarter before
the start of a crash as a percent of GDP. All but one entry are negative, and five are more
than one standard deviation below the mean of -0.3 percent. The table does not plot foreign
exchange reserves because the relationship between reserves and currency crashes holds only
in the cases of fixed exchange rates.11
The third column of Table 1 shows the change in the unemployment rate over the
eight quarters ending in the quarter before the onset of the crash. Six of the crash episodes
were associated with a rise in unemployment that exceeded the mean by more than one
standard deviation—indeed four episodes exceeded the mean by more than two standard
deviations. Although Italian unemployment had changed little on balance over the eight
quarters before the 1993 crash, the episode is associated with rising unemployment because
unemployment turned up two quarters before the crash and continued to rise for some time
afterwards; also GDP growth turned negative shortly before the crash.
The final three columns of Table 1 summarize the causal factors behind each
currency crash. The letter “I” stands for excess inflation; “C” stands for the current account
deficit; and “U” stands for the change in the unemployment rate. Capital letters are used
when the associated factor exceeded its sample mean by more than one standard deviation.
Lower-case letters are used when the factor was close to the one standard deviation threshold
or when other evidence supports a role for the causal factor as discussed in the case studies
below.
11 Under a fixed exchange rate, reserve depletion often precedes a currency crash for both high inflation and high unemployment episodes. Under a floating exchange rate, reserves generally have little relationship with currency crashes.

- 12 -
At least one factor is identified for every crash episode, and all but four episodes are
associated with factors that exceeded the one standard deviation threshold.12 Prior to the
mid-1980s, inflation was always an important causal factor. Rising unemployment seems to
have become more important later in the sample.
Consequences of Crash Episodes
Table 2 presents evidence on the consequences of currency crashes. The first three
columns repeat the causal factors identified in Table 1 for convenience. The next column
shows the change in the inflation rate from the eight-quarter period ending in the quarter
before the crash to the eight-quarter period beginning with the start of the crash. Roughly
half of the changes were positive and half were negative. As in Table 1, entries in bold differ
from the sample mean by more than one standard deviation. The largest changes in inflation,
both up and down, occurred in the episodes that were driven by inflationary pressures. When
inflationary crashes were followed by tighter macroeconomic policies—as discussed in the
case studies below—inflation often fell after the crash. Conversely, when crashes were not
accompanied by tighter policies—and sometimes crashes were themselves a deliberate step
to loosen policy—inflation typically rose after the crash.
The column labeled “Change in Net Exports” displays the change in net exports as a
percent of GDP from the quarter before the crash to seven quarters after the crash started
(eight quarters in total). This change was almost always positive; only for Greece in 1980
12 For UK1976, both excess inflation and the change in unemployment were very close to the one standard deviation threshold. For AL1985, the current account deficit was close to the threshold and, as mentioned above, IMF reports indicate that the crash was spurred by financial market concerns over future inflation. For US1986, the current account deficit was unprecedented both in terms of U.S. experience and relative to the volume of global trade. For IT1993, as mentioned above, unemployment started to rise rapidly less than a year before the crash and continued to rise for several quarters afterwards.

- 13 -
was it notably negative. Inflation in Greece around the 1980 crash was so high that the real
exchange rate was reduced only briefly and quickly resumed its upward trend; thus the crash
provided no impetus to net exports.
The next column shows the average growth rate of GDP over the eight quarters
following the onset of the crash. The average growth rate after the onset of crashes was 1.7
percent, compared to an average of 2.6 percent across all countries and time periods. Growth
was more than one standard deviation below the sample average in many episodes and only
for New Zealand in 1984 did growth come close to exceeding the sample average by more
than one standard deviation. All of the low growth episodes were associated with high
values of excess inflation in Table 1.
The column labeled “Change in GDP Growth” shows the change between the growth
rate over the eight quarters ending in the quarter before the crash and the growth rate over the
eight quarters after the crash. In this column there are episodes that differed from the sample
average by more than one standard deviation on both the upside and the downside.
Decreases in the growth rate occurred only in episodes that had excess inflation as a causal
factor. The largest increases in the growth rate occurred in the 1990s episodes that had
unemployment, and not inflation, as causal factors.
The next column shows the change in the long-term government bond yield from the
quarter before the crash to three quarters after the onset of the crash.13 Bond yields rose
sharply in a number of episodes that were associated with high inflation. Bond yields
dropped sharply in a number of episodes that were associated with rising unemployment and
no excess inflation.
13 A shorter window is used for the financial variables because they adjust to the crash faster than the other variables adjust.

- 14 -
The final column shows the change in a broad equity index deflated by the GDP
deflator from the quarter before the crash to three quarters after the onset of the crash.
Falling equity prices tend to be associated with inflationary currency crashes and rising
equity prices tend to be associated with non-inflationary currency crashes.
Relating Causes to Consequences
Table 3 presents results of regressions that relate the consequences of currency
crashes to the causal factors behind crashes. In each column, one of the variables of Table 2
is regressed on the variables of Table 1.14 For GDP growth and the change in GDP growth,
the value of GDP growth over the eight quarters ending in the quarter before the onset of the
crash is added to the regression to control for cyclical dynamics that may not be related to
crashes. The columns labeled “full” include all independent variables. The columns labeled
“restricted” show the results of a sequential test-down procedure that successively eliminates
the non-significant independent variables (except the constant).
For GDP growth after the onset of a currency crash, excess inflation during the crash
is a significant explanatory factor. Each percentage point of excess inflation lowers GDP
growth roughly one quarter of a percentage point. For the change in GDP growth after the
onset of a currency crash, both excess inflation and the lagged change in unemployment are
significant predictors. Excess inflation has a similar effect to that observed in the previous
regressions, but now the change in unemployment is an even more important factor. Each
percentage point rise in the unemployment rate before a crash implies a percentage point
increase in the GDP growth rate after a crash begins. This finding likely results from policy
14 The change in inflation is not included because it is strongly affected by the exchange rate regime and the policy environment surrounding the crash. The change in net exports is not included because it is almost always positive and because GDP is a broader gauge of the effects on economic activity.

- 15 -
easing in response to rising unemployment, which appears to be successful in stimulating
growth.
For bond yields, the only causal factor that matters is excess inflation. Higher excess
inflation is associated with rising bond yields. For real equity prices, all factors appear to
matter. The effect of excess inflation is highly significant and robust to the other variables;
higher excess inflation is associated with falling real equity prices. Current account deficits
and rising unemployment are associated with rising real equity prices, but these effects are
less significant and less robust to inclusion of the other variables than the inflation effect.
An important omitted factor in these regressions is the stance of macroeconomic
policy. Quarterly data on fiscal deficits are not available for most of these countries in the
1970s and 1980s. Moreover, calculating cyclically adjusted deficits and the effective
monetary stance are fraught with pitfalls given the uncertainty about potential output, the
effects of price, wage, and capital controls, expectations about future inflation and future
fiscal policies, and differences across countries in the relative importance of interest-rate
versus exchange-rate channels for monetary policy. The real short-term interest rate (based
on trailing four-quarter inflation) is not significant when added to any of the regressions in
Table 3. However, the case studies below support the view that the subsequent stance of
macroeconomic policy is critical in explaining the consequences of inflationary currency
crashes for GDP growth. When governments shifted to fighting inflation, GDP growth
typically suffered in the short run. When governments did not fight inflation, GDP growth
was generally maintained over the near term. For non-inflationary currency crashes that
were associated with rising unemployment, governments always eased macroeconomic
policies and GDP growth always rebounded.

- 16 -
Inflation, GDP Growth, and Crashes
The preceding sections show that currency crashes are followed by weak or declining
GDP growth only when they appeared to be caused by inflationary policies. A related
question is whether crashes themselves retard GDP growth, or whether other aspects of
inflationary periods tend to damp growth. To answer this question, consider the growth
outcomes of the most inflationary episodes across all countries and years. There are 25
episodes in which four-quarter inflation in one of the 20 countries exceeded the average
across all countries by more than two standard deviations (7.2 percentage points).15 The
average GDP growth rate over the eight quarters after this inflationary threshold was
breached was 2.2 percent, slightly lower than the sample average growth rate of 2.6 percent.
Seven of these 25 episodes were associated with a currency crash.16 In the crash episodes,
GDP growth averaged 2.9 percent. In the non-crash inflationary episodes, GDP growth
averaged 2.0 percent. The difference between the crash and non-crash growth means is not
statistically significant, but it does suggest that currency crashes may help to ameliorate some
of the harmful after-effects of inflationary episodes.
Case Studies
This section explores the historical record following each currency crash to bolster
the conclusions reported above and to better understand the individual circumstances
associated with currency crashes. The primary sources are IMF documents written shortly
15 Episodes are deemed to last until inflation falls below the two standard deviation threshold for four consecutive quarters. 16 An inflationary episode is associated with a currency crash if a crash started in any of the four quarters before or the eight quarters after the inflation criterion was met. These episodes were NZ1975, IT1976, PT1977, SP1977, GC1980, PT1982, and NZ1984.
- 17 -
after each crash episode. “ART” stands for Staff Report for Article IV Consultation. “RED”
stands for Recent Economic Developments.
A common theme among the inflationary episodes is that governments
underestimated the natural rate of unemployment (sometimes called the non-accelerating
inflation rate of unemployment, or NAIRU). The rise of the NAIRU in the 1970s and early
1980s is discussed in Blanchard (2005, p.2) who describes it as a “tough learning experience,
both for economists and for policy makers.” Attempts by policy makers to stimulate
economic activity and reduce unemployment spilled over into high and rising rates of
inflation, which appears to have been the major causal factor behind a number of currency
crashes.
Italy 1973Q3
Italian authorities appear to have underestimated the NAIRU in the early 1970s and
their attempts to stimulate growth spilled over into high inflation. The OECD Economic
Survey of Italy in January 1975 (p. 21) states that the primary goal of monetary policy in
1973 was to “maintain the growth of the economy.” The real short-term interest rate was
slightly negative in 1971 and 1972. (See Figure 5.) Soaring inflation in 1973 pushed the real
short-term rate to -7 percent by the start of the crash, and it stayed around -5 percent for most
of the next two years even as the authorities attempted to tighten monetary conditions by
increasing the nominal rate. In 1974 the authorities also tightened monetary conditions
through credit controls (OECD Survey, p. 23, and IMF RED August 1974, p. 48), but it is not
clear how much effect these had. Fiscal policy appears to have been stimulative throughout
the early 1970s as the deficit grew during the sluggish period of 1971-72 and remained

- 18 -
constant in 1973-74 despite rapid economic growth. The lira was allowed to float in
February 1973 and it depreciated in several steps over the next few months. The depreciation
was driven by the easy stance of monetary policy and a general lack of confidence in Italian
macroeconomic policies, especially as inflation ramped up in the first half of 1973.
According to the IMF (RED August 1974, p. 47) “speculative activity helped ingrain
expectations of further price inflation and exchange rate depreciation.”
The net result of these policies was very strong growth of real GDP in 1973 and early
1974. Inflation, however, soared from 6 percent in 1972 to more than 20 percent in 1974.
Bond yields rose about 4 percentage points in 1974. The real equity price index jumped
shortly after the lire was floated, but then generally performed poorly.
Bottom line: Loose macroeconomic policy caused the crash and continued loose
policy after the crash stimulated both growth and inflation.
New Zealand 1975Q4
The New Zealand economy was subject to extremely large terms-of-trade shocks in
the early 1970s: first rising prices of farm exports in 1972-73 and then rising prices of oil
imports in 1974. (See Figure 6.) Booming farm income led to unsustainably high GDP
growth of over 8 percent in both 1973 and 1974. According to the IMF (RED April 1976,
pp. 13, 21) monetary and fiscal policies were slightly restrictive in 1974. Nevertheless, the
strong growth in economic activity sparked soaring inflation that hit with a lag in 1975, just
as the economy fell into recession in response to the oil shock and the global slowdown.17 In
response to the sagging economy, the government returned to expansionary macroeconomic
17 The lag in the response to the oil shock may reflect pervasive price controls that existed in New Zealand at that time. (IMF RED April 1976, p. 10)

- 19 -
policies in 1975, with rapidly growing public expenditures (IMF RED January 1978, p. 2)
and a marked fall in short-term interest rates. The continuation of a large current account
deficit led the government to devalue the New Zealand dollar 15 percent in August 1975.
The stimulus to net exports from the depreciation helped to spark a mild recovery in
1976, but the economy was probably operating above long-run capacity throughout the
period; the unemployment rate remained below 1 percent through 1977. A tightening of
wage and price controls in mid-1976 had only a temporary restraining effect on inflation.
(IMF RED January 1978, p. 9) The government adopted tighter monetary and fiscal policies
in 1976. (IMF RED January 1978, p. 27) Bond yields rose moderately after the crash. Real
equity prices were roughly stable during and immediately after the crash.
Bottom line: The currency crash was caused by a combination of inflation and a
negative terms-of-trade shock that widened the current account deficit. Real depreciation
provided a temporary boost to the economy, but the beneficial effects were limited as the
economy was probably already operating above its sustainable rate.
Italy 1976Q2
As one of the industrial countries that was most dependent on imported oil, Italy’s
terms of trade suffered acutely from the oil price shock of 1974 and the Italian economy
entered a recession, along with much of the rest of the world, in late 1974. According to the
OECD Economic Survey of Italy in January 1976 (p. 5), “the Italian authorities shifted their
monetary and fiscal policy to a much more expansionary stance as from the beginning of
1975.” These policies appear to have had the intended effect on output, albeit at the expense
of renewed inflation. GDP resumed rapid growth in the third quarter of 1975. (See Figure
- 20 -
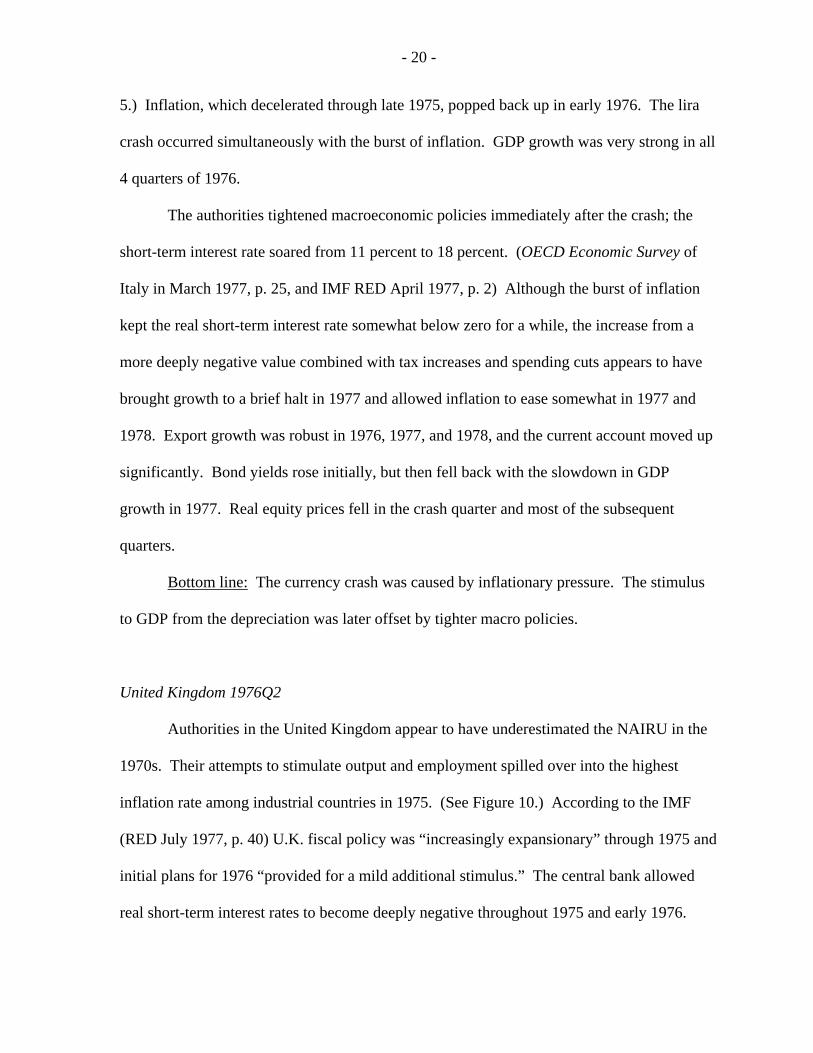
5.) Inflation, which decelerated through late 1975, popped back up in early 1976. The lira
crash occurred simultaneously with the burst of inflation. GDP growth was very strong in all
4 quarters of 1976.
The authorities tightened macroeconomic policies immediately after the crash; the
short-term interest rate soared from 11 percent to 18 percent. (OECD Economic Survey of
Italy in March 1977, p. 25, and IMF RED April 1977, p. 2) Although the burst of inflation
kept the real short-term interest rate somewhat below zero for a while, the increase from a
more deeply negative value combined with tax increases and spending cuts appears to have
brought growth to a brief halt in 1977 and allowed inflation to ease somewhat in 1977 and
1978. Export growth was robust in 1976, 1977, and 1978, and the current account moved up
significantly. Bond yields rose initially, but then fell back with the slowdown in GDP
growth in 1977. Real equity prices fell in the crash quarter and most of the subsequent
quarters.
Bottom line: The currency crash was caused by inflationary pressure. The stimulus
to GDP from the depreciation was later offset by tighter macro policies.
United Kingdom 1976Q2
Authorities in the United Kingdom appear to have underestimated the NAIRU in the
1970s. Their attempts to stimulate output and employment spilled over into the highest
inflation rate among industrial countries in 1975. (See Figure 10.) According to the IMF
(RED July 1977, p. 40) U.K. fiscal policy was “increasingly expansionary” through 1975 and
initial plans for 1976 “provided for a mild additional stimulus.” The central bank allowed
real short-term interest rates to become deeply negative throughout 1975 and early 1976.

- 21 -
The pound depreciated sharply in the first half of 1976. In response, the central bank raised
interest rates modestly and a small fiscal tightening was announced in mid-1976. Financial
markets generally were not impressed by these initial measures and the exchange rate
depreciated sharply further in late 1976. The central bank responded by hiking real interest
rates into positive territory and the government announced further fiscal tightening in
conjunction with an IMF loan package in December 1976. (IMF RED July 1977, p. 44) The
fiscal plans may have been based on optimistic assumptions about economic growth and tax
revenues, however, because the final data show only a small improvement in the fiscal
balance in 1977.
In early 1977, the exchange rate began to strengthen as markets regained confidence
in U.K. macroeconomic policies. (IMF RED June 1978, p. 1) The central bank lowered
interest rates significantly in 1977, and bond yields also declined. Exports grew relatively
strongly in 1976 and 1977. Inflation backed off its peak levels, but remained in double
digits. Real equity prices declined briefly around and after the crash, but then recovered
within a year.
Bottom line: The crash was caused by inflationary macro policies. After the crash,
policies were tightened enough to keep GDP from accelerating, but not enough to fully
reverse the spike in inflation.
Portugal 1977Q1
Portuguese authorities appear to have underestimated the NAIRU in the 1970s. From
1971 through 1977 inflation was on a steep upward path that was only moderately interrupted
by the recession of 1974-75. (See Figure 7.) The rapid recovery and rising inflation in 1976

- 22 -
caused a significant widening of the current account deficit. The authorities devalued the
exchange rate 15 percent in February 1977, but this initial devaluation reversed only about
half of the real appreciation caused by high inflation since 1973. As monetary policy
remained expansionary (and fiscal policy was roughly neutral) inflation remained high and
the external balance did not begin to improve. Portugal experienced a currency crisis in
August 1977 that led to a new managed floating regime and further exchange rate
depreciation through 1978. (IMF RED December 1978, p. 1)
Monetary policy was tightened significantly in late 1977 and early 1978. Real
interest rates rose substantially (although they remained slightly negative) and quantitative
credit restrictions were also tightened. Fiscal policy was roughly neutral in 1978. Exports
grew strongly in 1978 and 1979. GDP growth was moderate and inflation remained high.
Wage and price controls may have prevented inflation from increasing further. (IMF RED
July 1984, pp. 8-9) Bond yields rose markedly in the quarters after the crash. Equity price
data are not available.
Bottom line: The crash was caused by inflationary macro policies. After the crash,
policies were tightened enough to offset the stimulus from net exports, but not enough to end
high inflation.
Spain 1977Q3
Spanish authorities appear to have underestimated the NAIRU in the 1970s. From
1971 through 1977 inflation was on a steep upward path that was only moderately interrupted
by the recession of 1974-75. (See Figure 8.) The rapid recovery and appreciating real
exchange rate caused a widening of the current account deficit in 1976. The authorities

- 23 -
devalued the exchange rate 20 percent in July 1977, reversing much of the real appreciation
caused by high inflation since 1973.
Monetary policy was tightened somewhat in late 1977 and 1978, but interest rates
were volatile as the central bank’s policy focus was on the growth of the monetary
aggregates rather than on interest rates. Fiscal policy was loosened in 1978 and then
tightened in 1979. (IMF RED February 1980, pp. 1-2, 20, 34) Exports grew moderately in
1978 and 1979. GDP growth was weak and inflation moved down.
Bottom line: The crash was caused by inflationary macro policies. After the crash,
policies were tightened to more than offset the stimulus from net exports and damp inflation.
United States 1978Q3
The dollar crisis of 1978 is not a crash by these criteria. The peak four-quarter
change in the nominal effective exchange value of the dollar was -12 percent in the third
quarter of 1978. Nevertheless, it may be interesting to examine the circumstances
surrounding this episode.
After the recession of 1974-75, GDP grew strongly in 1976 and 1977. (See Figure
11.) The authorities appear to have underestimated the NAIRU and allowed inflation to drift
upward in 1977 and 1978 from its 1976 trough. Financial markets were not impressed by the
half-hearted steps to tighten policy in late 1977 and 1978, leading to downward pressure on
the dollar.
Modest further macro tightening at the end of 1978 (as part of a multi-country support
agreement for the dollar) succeeded in stabilizing the currency and caused growth to stagnate
in the first half of 1979 despite a significant positive contribution from net exports. The

- 24 -
tightening was not sufficient to prevent a continued upward trend in inflation. Indeed, the
IMF argued in May 1979 (IMF ART May 1979, p. 16) that “inflation is the most pressing
economic problem faced by the United States.” Bond yields rose about 1 percentage point
over the course of 1978. The dollar crisis had little apparent effect on real equity prices.
Bottom line: The dollar crisis was caused by inflationary macro policies. After the
crisis, policies were tightened more than enough to offset the stimulus from net exports, but
not enough to damp inflation.
Greece 1980Q2
Greek authorities appear to have underestimated the NAIRU in the late 1970s; the
unemployment rate in 1978 and 1979 was probably far below its sustainable rate. (See
Figure 4.) According to the IMF (IMF ART August 1980, pp. 1, 5, 7) monetary and fiscal
policies were expansionary from 1975 through 1979. Inflationary pressures were already
building when the 1979 oil price shock hit. In early 1980 the authorities stepped up the rate
of managed depreciation of the exchange rate to stabilize the real exchange rate. The criteria
for a currency crash were reached in the second quarter of 1980.
With the real exchange rate little changed, the crash had no significant effect on
export growth. According to the IMF (IMF RED March 1983, p.2) Greek monetary and
fiscal policies were “increasingly expansionary” through 1981. Nevertheless, it would
probably have required a massive further acceleration of inflation to keep unemployment
from rising and GDP from stagnating given how long the economy had operated above its
sustainable rate. Real equity prices began a precipitous decline in 1980. According to the

- 25 -
IMF (ART April 1985, p. 10b) there were no long-term domestic-currency government
bonds in Greece in the early 1980s.
Bottom line: The crash was a deliberate government policy to offset high inflation
and maintain a stable real exchange rate. With no real exchange rate depreciation there was
no net stimulus to aggregate demand. GDP stagnated despite loose macroeconomic policies
and inflation continued to rise.
Portugal 1982Q3
The Portuguese authorities appear to have continued to underestimate the NAIRU in
the early 1980s. As economic growth slowed in 1980, the authorities instituted expansionary
monetary and fiscal policies that continued until the middle of 1983 according to the IMF.
(IMF RED July 1984, p. 1) These provided only a modest temporary boost to GDP growth
and inflation stepped up substantially. (See Figure 7.) The managed crawl of the exchange
rate was not fast enough to offset the higher inflation in Portugal and the real exchange rate
appreciated in 1981 and early 1982, contributing to a sustained large current account
deficit.18 In June 1982 the authorities enacted a discrete devaluation, but other macro
policies were largely unaffected.
The depreciation helped to boost exports, but output stagnated amidst ongoing high
inflation. The current account deficit narrowed but remained large and capital flight
accelerated, reflecting a lack of anti-inflationary credibility. In June 1983, in conjunction
with an IMF adjustment package, the authorities devalued the exchange rate a further 12
percent and continued the downward crawl. This time, however, monetary and fiscal policies
18 Bad weather conditions “that necessitated a sharp increase in energy and agricultural imports” and a global recession temporarily boosted the current account deficit in 1981 and 1982. (IMF RED July 1984, p. 1)

- 26 -
were tightened. (IMF RED July 1984, p. 1) Exports continued to grow strongly, but GDP
contracted in late 1983 and early 1984 as tight macroeconomic policies reduced domestic
demand. Inflation declined only slightly in 1984 and 1985, as the downward pressure from
economic slack was offset by a series of administered increases of government-controlled
prices that were part of the fiscal tightening and possibly some pent-up price increases left
over from the period of wage and price controls. (IMF RED 1984 p. 9) In 1986, inflation
dropped sharply.
Bottom line: The currency crash was deliberate government policy. Exports were
strongly stimulated. Macroeconomic policy was initially loose, but then tightened to fight
inflation. It took a deep recession and a long lag to get inflation down.
Spain 1983Q1
The Spanish authorities tolerated slow growth in 1979 and 1980 to fight inflation, but
when growth collapsed again in 1981, they switched to a focus on boosting growth and
employment. (IMF RED July 27, 1984, p. 1) Inflation stepped up temporarily in 1981 in
part as food prices rose after a bad harvest. (See Figure 8.) GDP growth recovered
moderately in 1982. The managed crawl of the exchange rate barely managed to offset the
higher inflation in Spain, leaving the real exchange rate higher than it had been for most of
the previous decade and allowing the current account to remain in a moderate deficit. In
December 1982 the authorities enacted a discrete devaluation of 8 percent; the peseta was
allowed to depreciate further under market pressure in early 1983.

- 27 -
The depreciation boosted exports noticeably, but output was kept on a moderate
growth path by a sharp tightening of monetary policy. Fiscal policy was roughly neutral in
1983 and 1984. (IMF RED July 1984, pp. 36-42) Inflation resumed its downward trajectory.
Bottom line: The crash reflected a deliberate government policy to unwind the
cumulative real appreciation associated with higher inflation in Spain than in its trading
partners. Exports were strongly stimulated. Macroeconomic policy tightened to fight
inflation.
Greece 1983Q1
Ongoing high Greek inflation, at more than 20 percent per year, pushed up the real
exchange rate in 1982 and exacerbated the economic slump that began in 1981. (See Figure
4.) To fight inflation, the authorities tightened fiscal policy, and the public sector deficit
declined slightly between 1981 and 1983, despite stagnant GDP. At the time, fiscal policy
was viewed as very tight. (IMF ART April 1985, p. 2) Monetary policy remained loose,
however, with negative real interest rates. To offset the loss of competitiveness from high
inflation, the authorities devalued the currency 16 percent in January 1983.
As the decline in the real exchange rate was rather modest, exports benefited only a
little. Inflation remained high and the economy grew slowly. Real equity prices continued
their steep decline.
Bottom line: The crash was a policy move designed to offset a real appreciation
caused by high domestic inflation. Economic effects were minor.

- 28 -
Sweden 1983Q1
In the early 1980s, Sweden experienced several years of slow GDP growth, rising
unemployment, and a large current account deficit. (See Figure 9.) Inflation was moderately
high. Sweden had pegged its exchange rate to a basket of currencies. On the advice of the
IMF, Sweden devalued its currency by 10 percent in late 1981.19 In October 1982, a newly
elected social democratic government devalued the krona by a further 16 percent. The
devaluation first met the crash criteria in 1983Q1.
In the two years following the devaluation, exports grew strongly, GDP growth
picked up, inflation remained roughly unchanged, and the current account deficit narrowed.
According to the IMF, the government took advantage of the stimulus from the devaluation
to slash its budget deficit (IMF ART July 1984, p. 15) and the fiscal balance rose from -6.5
percent in 1982 to -3 percent in 1984. The central bank maintained real interest rates in
positive territory and increased them further in late 1984 when inflation did not decline as
much as targeted.20 Bond yields fell modestly during and after the crash. Real equity prices
jumped up with and immediately after the crash.
Bottom line: The crash was a policy move to stimulate the weak economy and
narrow the current account deficit. It had the intended effect of boosting net exports and
GDP with little effect on inflation.
New Zealand 1984Q3
In the 1980s New Zealand experienced stop-go macro policies that alternated
between fighting inflation and spurring growth. Interest rates were raised in 1981-82 to fight
19 See Boughton (2001, p. 110). 20 According to IMF ART July 1984 (p. 2), the inflation target was 3 percent for 1985. In the event, consumer price inflation was 6 percent over the four quarters of 1985.

- 29 -
inflation. (See Figure 6.) Inflation gradually fell in 1982-83, but GDP growth was lackluster
and unemployment rose to a post-war high. The central bank cut interest rates in 1983, in
response to rising unemployment. However, policymakers appear to have underestimated
the NAIRU and inflation began to rise steeply in 1984. The current account deficit widened
on average in 1983 and 1984.
In July 1984, a new government took office with a radical strategy to deregulate the
economy and to fight inflation through tight monetary policy and fiscal consolidation. One
of the first policy steps, however, was to devalue the currency 20 percent in July 1984 in
order to narrow the current account deficit. The currency was floated in March 1985.
According to the IMF, the budget deficit was reduced from 9 percent of GDP in fiscal year
1983/84 to 4 percent in fiscal year 1985/86. (IMF RED June 1986, p. 3) The central bank
raised interest rates sharply in late 1984 and 1985.
The jump in inflation coincided with the currency crash in mid-1984, and the crash
undoubtedly contributed to inflation, but the previous loose macroeconomic policies had
almost surely guaranteed a substantial rise in inflation in any event. GDP stagnated in 1985
and 1986 as the new government’s tight macro policies reduced domestic demand.
Nonagricultural exports grew strongly, but agricultural exports were damped by falling world
prices, reflecting farm subsidies in major trading partners. (IMF RED June 1986, pp. 69-70)
Inflation remained stubbornly high owing to “adjustments following the end of the wage-
price freeze … which had been imposed in June 1982 and terminated in February 1984”
according to the IMF. (IMF RED June 1986, p. 13) Further price pressures in 1985 owed to
increases in public-sector prices and indirect taxes that were part of the fiscal contraction.
Bond yields soared with the crash and the rise in inflation. Real equity prices fell slightly

- 30 -
with the crash but then stabilized and even began to increase sharply in 1986, most likely on
optimism about the government’s ongoing economic reforms.
Bottom line: The crash reflected a deliberate policy to reduce the large current
account deficit that resulted from deteriorating terms of trade and inflationary
macroeconomic policies. Despite a moderate stimulus to exports, tight macroeconomic
policies after the crash held down GDP growth and eventually succeeded in taming inflation.
Australia 1985Q2
According to the IMF, the primary causes of the currency crash of 1985 were market
concerns about the large and growing current account deficit and “uncertainties about
monetary conditions,” which likely reflects a lack of anti-inflationary credibility. (RED
February 1986, p. 2)
After a deep recession in 1982-83, four-quarter inflation declined to a low of 4
percent by the end of 1984 even as the Australian economy began to experience a strong
recovery. (See Figure 2.) The recovery was spurred in part by a rapid widening of the fiscal
deficit, which may have raised concerns about future inflation, despite a fairly tight monetary
policy. The rapid recovery in 1984 also contributed to a widening current account deficit.
The combination of inflation fears and a growing current account deficit sparked a sharp
depreciation in early 1985. Over the remainder of 1985 and 1986, Australia experienced a
substantial drop in the world prices of its main export commodities, which damped the
stimulative effect of the crash on net exports. (IMF ART February 1987, p. 6) GDP growth
was moderate in 1985 and 1986, but the rapid growth of 1984 probably put Australian output
above potential, and inflation steadily increased. Monetary and fiscal policies were fairly

- 31 -
tight in 1985 and 1986, but some of this restraint was offset by significant further currency
depreciation in 1986, and policies in the end were not tight enough to stabilize inflation.
Nevertheless, bond yields rose only modestly and real equity prices moved up strongly.
Bottom line: A combination of inflationary policies and a large current account
deficit appear to have caused the crash. The crash had a subdued effect on net exports
because of commodity price decline. Macroeconomic policies were not sufficiently tight
after the crash, given that output was probably above potential, and inflation gradually
intensified.
Greece 1985Q4
According to the IMF, Greek macroeconomic policies eased in early 1985 ahead of
parliamentary elections. Inflation was already high and the current account deeply in deficit.
By late 1985 the results were not surprising: “Faced with a marked widening of the current
account deficit … an acceleration of inflation … and a widening fiscal deficit … the
authorities announced a comprehensive economic stabilization program in October 1985”
which included a 15 percent currency devaluation. (IMF RED August 1987, p. 1) The
package included significantly tighter fiscal policy, some liberalization and de-indexation of
the labor market (p. 9), and a temporary tax on imports (p. 104).
The depreciation boosted net exports and the current account deficit narrowed
dramatically from about 7 percent of GDP in 1985 to less than 4 percent of GDP in 1986.21
(See Figure 4.) GDP stagnated in 1986 and 1987 under the influence of the stabilization
program. Inflation declined somewhat but remained high, partly reflecting indirect tax
21 In addition to the increase in real net exports, the current account benefited from a fall in the price of oil imports and an increase in transfers from the European Community. (IMF RED August 1987, p. 114)

- 32 -
increases.22 Real equity prices rose strongly in the quarters after the crash as confidence in
the government’s adjustment program increased.
Bottom line: The crash was a deliberate policy to reduce the current account deficit.
The authorities tightened other policies to help reduce inflation and growth was lackluster.
United States 1986Q3
The U.S. economy grew at a moderate pace in 1985 and 1986 and inflation was well
under control. (See Figure 11.) However, tight monetary policy and loose fiscal policy had
engendered a sustained appreciation of the dollar from late 1980 through early 1985. The
last year or so of this appreciation probably reflected a dollar bubble.23 As the U.S. current
account headed for a post-war record deficit, the sustainability of the strong dollar came into
doubt. The dollar peaked in February 1985 and began to depreciate almost continuously
thereafter. The Plaza Agreement of September 1985 may have helped to hasten the decline
through joint foreign exchange intervention against the dollar by G-7 countries. The
depreciation lasted about three years with few pauses from early 1985 through early 1988.
The crash criteria were reached in 1986Q3.
The depreciation provided a strong and lasting boost to exports. By 1988, the current
account deficit began to shrink. Inflation rose modestly after the crash but remained below 4
percent. Output continued to grow robustly. Bond yields fell more than 4 percentage points
22 Bank of Greece Report for 1987, April 1988, p. 11. 23 IMF RED July 1986, p. 27 points to real interest differentials in favor of U.S. assets as the primary factor behind dollar appreciation from mid-1980 through mid-1982. After that period, interest differentials moved in the opposite direction and causality becomes more speculative. Potential factors include a relatively favorable investment climate and “expectations of a continuing appreciation of the dollar which for a time became self-sustaining,” i.e., a bubble.

- 33 -
from the dollar’s peak in early 1985 through early 1987, before backing up modestly in late
1987. Real equity prices rose with and immediately after the crash.24
Bottom line: Market fears about current account sustainability and coordinated
official exchange rate intervention helped to cause the crash. The crash boosted net exports.
Both growth and inflation were steady.
Finland 1992Q4
Finland began a serious recession in 1990, owing to monetary tightening to fight
inflation, the collapse of exports to the Soviet Union, the bursting of the late 1980s asset
bubble, and a banking crisis. (IMF RED July 1993, pp. 1-2) Markets doubted the credibility
of the central bank’s exchange rate peg in the face of the weak economy and the central bank
was forced to raise interest rates and deplete its foreign exchange reserves to defend the peg.
(See Figure 3.) The currency was devalued in November 1991 and floated (with a large
depreciation) in September 1992. Monetary policy, which had been tight while defending
the currency peg, loosened markedly in late 1992.
The economy began to recover in the second half of 1993. Inflation declined during
the recession years and stayed generally low, but volatile, during the recovery. Exports made
a very large contribution to recovery in 1993 and 1994. Bond yields fell sharply after the
crash and real equity prices rose strongly.
Bottom line: The crash was caused by market concerns about an overvalued
exchange rate in the face of a major recession. The combination of the crash and an easing
of monetary policy spurred strong growth after a modest lag. Inflation remained low.
24 In 1987Q4 equity prices fell sharply. The cause of the 1987 equity crash remains a puzzle, but equity prices fully recovered by 1989 and there were no apparent harmful macroeconomic effects.

- 34 -
Italy 1993Q1
The Maastricht treaty of 1992 focused market attention on the convergence criteria
for joining the European Economic and Monetary Union by the end of the decade. Inflation
and fiscal deficits in Italy were well in excess of the limits specified by Maastricht, but the
Italian government had held the exchange rate steady against the Deutschemark for several
years. With inflation above that of its trading partners, Italy’s real effective exchange rate
had marched upward throughout the previous decade, restraining real net exports. (See
Figure 5.)
Meanwhile, the unification of Germany in 1990 created a boom in German domestic
demand that led the Bundesbank to tighten monetary policy gradually but significantly. In
part because of the strong real exchange value of the lira, Italian exporters benefited
relatively little from the German boom, while the rest of the Italian economy suffered from
the high interest rates that were required to defend the exchange rate peg.25 As the Italian
economy slumped, financial markets increasingly doubted the government’s resolve to
maintain the exchange rate parity. Speculative attacks forced the exit of the lira from the
European Exchange Rate Mechanism (ERM) in September 1992. The criteria for a currency
crash were reached in the first quarter of 1993.
Policy interest rates were eased substantially in 1993, but the economy continued to
contract for most of the year, particularly as the government felt unable to use
25 It is notable that IMF Article IV documents from 1991 through 1993 avoid any discussion of the link between German monetary tightening and the Italian macroeconomic situation. Presumably this omission reflects the IMF’s desire not to distract the focus of Italian policy makers from the need to cut Italy’s large fiscal deficit. For a more comprehensive discussion of the effect of German unification on other European countries, see Adams, Alexander, and Gagnon (1993) and Gagnon, Masson, and McKibbin (1997).

- 35 -
countercyclical fiscal stimulus in light of the already excessive budget deficit.26 Exports did
expand strongly in 1993 and 1994, providing a significant backstop to the weak economy.
Inflation declined during 1992 and held steady in 1993 and 1994. Bond yields fell, and real
equity prices moved up, with and immediately after the crash.
Bottom line: The crash was caused by market concerns about an overvalued
exchange rate in the face of a major recession. The combination of the crash and an easing
of monetary policy spurred strong growth after a modest lag. Inflation remained low.
Sweden 1993Q1
Sweden’s economy overheated in the late 1980s, the aftermath of financial
liberalization that sparked a real estate boom. (IMF RED August 1993, p.1) The bust hit in
1990 and it intensified in 1991 and 1992 as a banking crisis emerged and the global economy
slowed down. Markets doubted the credibility of the central bank’s exchange rate target in
the face of prolonged economic weakness. After raising interest rates sharply in mid-1992 to
defend the krona, the central bank decided to let the krona float in November. (See Figure
9.) The criteria for a currency crash were reached in 1993Q1.
Both monetary and fiscal policies loosened markedly in 1993.27 GDP growth turned
positive in 1993Q2 with a large boost from net exports. Inflation, which had dropped sharply
in 1992, rebounded only partially in 1993 and remained moderate in 1994. Bond yields fell
and real equity prices rose strongly in 1993.
26 Indeed, the fiscal deficit shrank modestly (as a share of GDP) in 1993 despite the recession. 27 According to IMF ART December 1994, pp. 5-15, transfers to recapitalize the banking system in 1992 and 1993 totaled about 6 percent of 1993 GDP.
- 36 -
Bottom line: The crash was caused by market concerns about an overvalued
exchange rate in the face of a recession. The combination of the crash and an easing of
monetary and fiscal policies spurred strong growth after a brief lag. Inflation remained low.
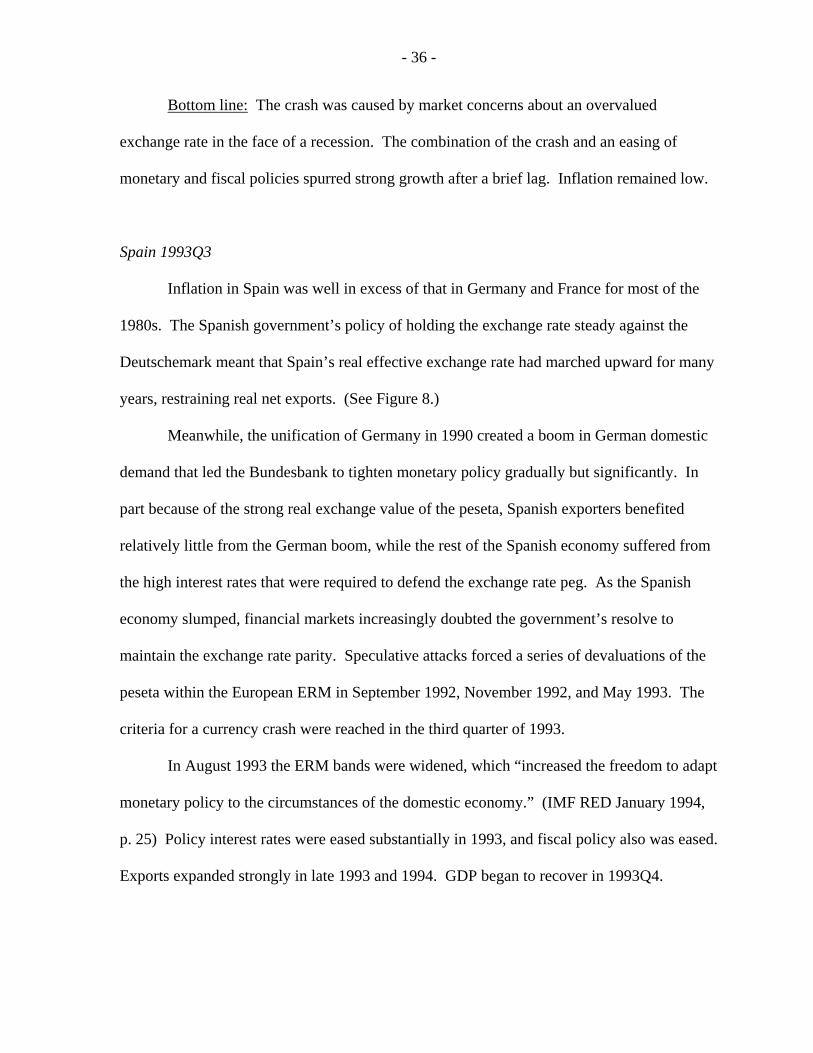
Spain 1993Q3
Inflation in Spain was well in excess of that in Germany and France for most of the
1980s. The Spanish government’s policy of holding the exchange rate steady against the
Deutschemark meant that Spain’s real effective exchange rate had marched upward for many
years, restraining real net exports. (See Figure 8.)
Meanwhile, the unification of Germany in 1990 created a boom in German domestic
demand that led the Bundesbank to tighten monetary policy gradually but significantly. In
part because of the strong real exchange value of the peseta, Spanish exporters benefited
relatively little from the German boom, while the rest of the Spanish economy suffered from
the high interest rates that were required to defend the exchange rate peg. As the Spanish
economy slumped, financial markets increasingly doubted the government’s resolve to
maintain the exchange rate parity. Speculative attacks forced a series of devaluations of the
peseta within the European ERM in September 1992, November 1992, and May 1993. The
criteria for a currency crash were reached in the third quarter of 1993.
In August 1993 the ERM bands were widened, which “increased the freedom to adapt
monetary policy to the circumstances of the domestic economy.” (IMF RED January 1994,
p. 25) Policy interest rates were eased substantially in 1993, and fiscal policy also was eased.
Exports expanded strongly in late 1993 and 1994. GDP began to recover in 1993Q4.

- 37 -
Inflation declined during 1992 and held steady in 1993 and 1994. Bond yields fell, and real
equity prices moved up, with and immediately after the crash.
Bottom line: The crash was caused by market concerns about an overvalued
exchange rate in the face of a recession. The combination of the crash and an easing of
monetary and fiscal policies spurred strong growth after a brief lag. Inflation remained low.
Conclusions
Currency crashes in industrial countries have always been associated with at least one
of the following causal factors:
Inflationary macroeconomic policies that put upward pressure on all prices,
including the price of foreign currency.
Weak aggregate demand and rising unemployment that encourage
policymakers to stimulate growth through expansionary monetary policy,
including devaluation in the case of a fixed exchange rate.
Large capital outflows or current account deficits that run into financing
difficulties. In some cases, these deficits may reflect either of the above
forces, but they may also reflect exogenous shifts in the terms of trade or in
financial market sentiment.
The consequences of currency crashes depend critically on the causes. Poor
outcomes have occurred only after inflationary currency crashes. The responses of
macroeconomic policymakers after inflationary currency crashes had important implications
for GDP growth. Tighter policies to fight inflation generally reduced GDP in the short run.
When authorities did not fight inflation, GDP growth generally held up in the near term.

- 38 -
Bond yields usually rose and real equity prices usually fell during and immediately after
inflationary currency crashes.
Non-inflationary currency crashes uniformly had good outcomes: GDP growth was
average to above average, bond yields fell, and real equity prices rose.

- 39 -
References
Adams, G., Alexander, L., Gagnon, J., 1993. German Unification and the European Monetary System: A Quantitative Analysis. Journal of Policy Modeling 15, 353-92.
Berg, A., Borensztein, E., Pattillo, C., 2004. Assessing Early Warning Systems: How Have
They Worked in Practice? IMF Working Paper no. 04/52, International Monetary Fund, Washington, DC.
Blanchard, O., 2005. European Unemployment: The Evolution of Facts and Ideas. National
Bureau of Economic Research Working Paper no. 11750, Cambridge, MA. Boughton, J., 2001. Silent Revolution: The International Monetary Fund 1979-1989.
International Monetary Fund, Washington, DC. Croke, H., Kamin, S., Leduc, S., 2006. An Assessment of the Disorderly Adjustment
Hypothesis for Industrial Economies. International Finance 9, 37-61. Debelle, G., Galati, G., 2005. Current Account Adjustment and Capital Flows. BIS Working
Papers no. 169, Bank for International Settlements, Basel. Dooley, M., Frankel, J., (eds.) 2003. Managing Currency Crises in Emerging Markets.
University of Chicago Press, Chicago. Edison, H., 2003. Do Indicators of Financial Crises Work? An Evaluation of an Early
Warning System. International Journal of Finance and Economics 8, 11-53. The Financial Times, 2008. The Dollar Danger Is Not Over Yet. Editorial on May 8. Frankel, J., Rose, A., 1996. Currency Crashes in Emerging Markets: An Empirical
Treatment. Journal of International Economics 41, 351-66. Freund, C., Warnock, F., 2007. Current Account Deficits in Industrial Countries: The Bigger
They Are, the Harder They Fall? in Clarida (ed.) G7 Current Account Imbalances, The University of Chicago Press, Chicago.
Gagnon, J., 2009. Currency Crashes and Bond Yields in Industrial Countries. Journal of
International Money and Finance 28, 161-81. Gagnon, J., Masson, P., McKibbin, W., 1996. German Unification: What Have We Learned
from Multi-Country Models? Economic Modelling 13, 467-98. Kumar, M., Moorthy, U., Perraudin, W., 2003. Predicting Emerging Market Currency
Crashes. Journal of Empirical Finance 10, 427-54.

- 40 -
Milesi-Ferretti, G. M., Razin, A., 1998. Current Account Reversals and Currency Crises: Empirical Regularities. National Bureau of Economic Research Working Paper no. 6620, Cambridge, MA.
Osband, K., van Rijckeghem, C., 2000. Safety from Currency Crashes. IMF Staff Papers
47, 238-58. Tudela, M., 2004., Explaining Currency Crises: A Duration Model Approach. Journal of
International Money and Finance 23, 799-816. Volcker, P. 2005., An Economy on Thin Ice. The Washington Post April 10, B7. The Wall Street Journal, 2008. The Buck Stops Where? March 17, A16. Wright, J., Gagnon, J., 2006. Predicting Sharp Depreciations in Industrial Country Exchange
Rates. International Finance Discussion Papers no. 881, Board of Governors of the Federal Reserve System, Washington, DC.

- 41 -
Table 1. Evidence on Causes of Currency Crashes Episode
Excess Inflation
Current Account
Change in Unemp.
Factors Present1
Italy 1973Q3 5.4 -2.0 1.5 I c u New Zealand 1975Q4 3.3 -7.3 0.2 I C Italy 1976Q2 6.2 -1.1 0.6 I United Kingdom 1976Q2 3.2 0.5 1.7 i u Portugal 1977Q1 11.8 -7.9 4.6 I C U Spain 1977Q3 10.3 -3.6 1.5 I c u Greece 1980Q2 7.6 -3.5 0.9 I c Portugal 1982Q3 11.8 -12.6 -0.5 I C Spain 1983Q12 3.3 -2.5 3.5 I U Greece 1983Q1 11.8 -3.1 3.0 I c U Sweden 1983Q1 0.0 -4.9 1.4 c u New Zealand 1984Q3 3.8 -7.6 1.2 I C u Australia 1985Q2 -1.0 -4.2 -1.0 i c Greece 1985Q4 11.5 -7.7 0.0 I C United States 1986Q3 -2.8 -3.2 -0.3 c Finland 1992Q4 -2.8 -4.1 8.9 c U Italy 1993Q1 0.5 -2.1 0.1 u Sweden 1993Q1 -0.6 -1.9 5.1 U Spain 1993Q3 1.1 -1.2 4.9 U Crash Mean 4.4 -4.2 2.0 Sample Mean 0.0 -0.3 0.2 Sample Standard Deviation 3.3 4.7 1.7 Note: Excess inflation equals the annual inflation rate over the eight quarters centered on the start of the crash minus the average inflation rate in all 20 countries over the same period. Current account is in percent of GDP for the quarter before the start of the crash. Change in unemployment rate is measured over eight quarters ending in the quarter before the start of the crash. Bold entries differ from sample means by more than one standard deviation. Sample means and standard deviations are based on the entire sample period and all 20 countries. 1. I – inflation; C – current account; U – unemployment. Column lists factors that exceeded mean by more than one standard deviation in hypothesized direction. Factors in lower case were either close to the one standard deviation criterion or were supported by considerations discussed in the text. 2. For Spain in 1983, the current account is the average over the four quarters of 1982 because there were swings of more than 20 percentage points from quarter to quarter that year.
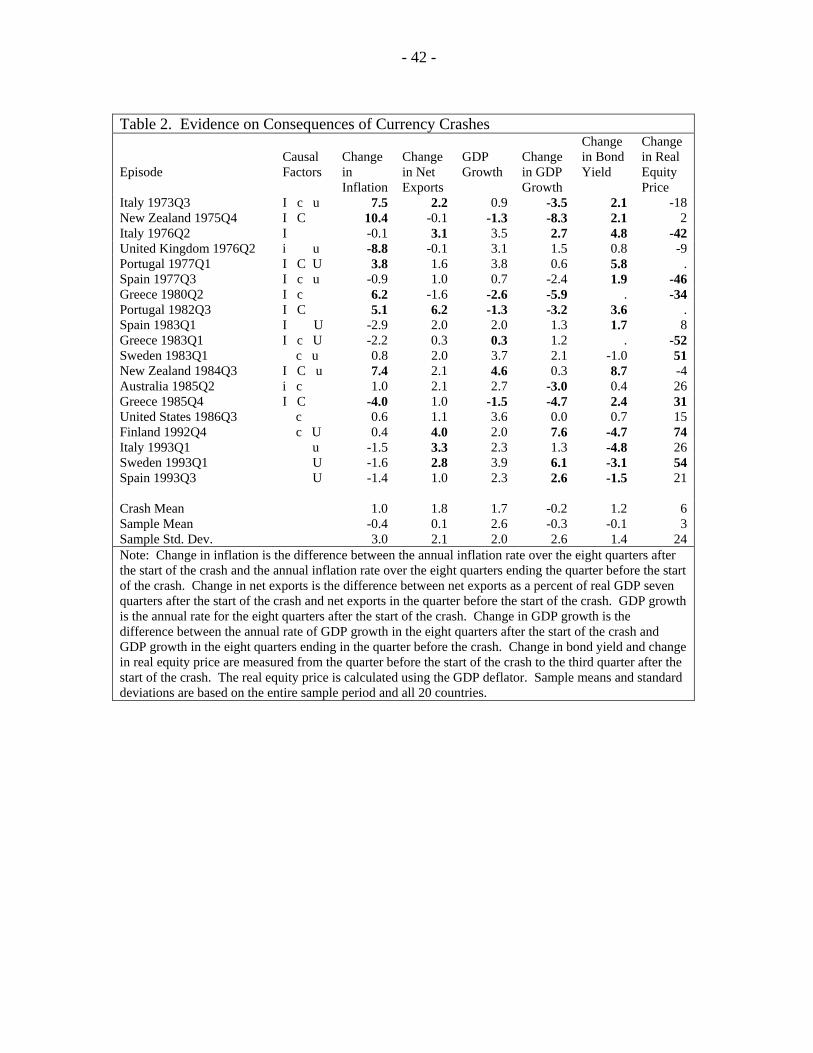
- 42 -
Table 2. Evidence on Consequences of Currency Crashes Episode
Causal Factors
Change in Inflation
Change in Net Exports
GDP Growth
Change in GDP Growth
Change in Bond Yield
Change in Real Equity Price
Italy 1973Q3 I c u 7.5 2.2 0.9 -3.5 2.1 -18 New Zealand 1975Q4 I C 10.4 -0.1 -1.3 -8.3 2.1 2 Italy 1976Q2 I -0.1 3.1 3.5 2.7 4.8 -42 United Kingdom 1976Q2 i u -8.8 -0.1 3.1 1.5 0.8 -9 Portugal 1977Q1 I C U 3.8 1.6 3.8 0.6 5.8 . Spain 1977Q3 I c u -0.9 1.0 0.7 -2.4 1.9 -46 Greece 1980Q2 I c 6.2 -1.6 -2.6 -5.9 . -34 Portugal 1982Q3 I C 5.1 6.2 -1.3 -3.2 3.6 . Spain 1983Q1 I U -2.9 2.0 2.0 1.3 1.7 8 Greece 1983Q1 I c U -2.2 0.3 0.3 1.2 . -52 Sweden 1983Q1 c u 0.8 2.0 3.7 2.1 -1.0 51 New Zealand 1984Q3 I C u 7.4 2.1 4.6 0.3 8.7 -4 Australia 1985Q2 i c 1.0 2.1 2.7 -3.0 0.4 26 Greece 1985Q4 I C -4.0 1.0 -1.5 -4.7 2.4 31 United States 1986Q3 c 0.6 1.1 3.6 0.0 0.7 15 Finland 1992Q4 c U 0.4 4.0 2.0 7.6 -4.7 74 Italy 1993Q1 u -1.5 3.3 2.3 1.3 -4.8 26 Sweden 1993Q1 U -1.6 2.8 3.9 6.1 -3.1 54 Spain 1993Q3 U -1.4 1.0 2.3 2.6 -1.5 21 Crash Mean 1.0 1.8 1.7 -0.2 1.2 6 Sample Mean -0.4 0.1 2.6 -0.3 -0.1 3 Sample Std. Dev. 3.0 2.1 2.0 2.6 1.4 24 Note: Change in inflation is the difference between the annual inflation rate over the eight quarters after the start of the crash and the annual inflation rate over the eight quarters ending the quarter before the start of the crash. Change in net exports is the difference between net exports as a percent of real GDP seven quarters after the start of the crash and net exports in the quarter before the start of the crash. GDP growth is the annual rate for the eight quarters after the start of the crash. Change in GDP growth is the difference between the annual rate of GDP growth in the eight quarters after the start of the crash and GDP growth in the eight quarters ending in the quarter before the crash. Change in bond yield and change in real equity price are measured from the quarter before the start of the crash to the third quarter after the start of the crash. The real equity price is calculated using the GDP deflator. Sample means and standard deviations are based on the entire sample period and all 20 countries.

- 43 -
Table 3. Relating Causes to Consequences
GDP Growth Change in GDP Growth
Change in Bond Yield
Change in Real Equity Price
full restricted full restricted full restricted full restricted Constant
1.91* (1.04)
2.69*** (.58)
0.18 (1.50)
-1.12 (1.03)
-0.30 (1.42)
-0.54 (.88)
-3.4 (12.7)
26.4*** (8.1)
Lagged GDP Growth
0.30 (.21)
-0.23 (.30)
Excess Inflation
-0.22** (.10)
-0.22** (.09)
-0.16 (.15)
-0.24* (.13)
0.36* (.17)
0.45*** (.14)
-5.6*** (1.2)
-5.7*** (1.4)
Current Account
0.08 (.16)
0.22 (.23)
-0.16 (.26)
-5.9** (2.5)
Change in Unemp.
0.32 (.23)
0.83** (.33)
1.03*** (.26)
-0.29 (.29)
4.5*
(2.3)
R2 .40 .27 .64 .60 .46 .40 .70 .53 No. Obs. 19 19 19 19 17 17 17 17 Note: This table presents OLS regressions of consequences, as defined in Table 2, on causes, as defined in Table 1. To control for potential dynamics, GDP growth over the eight quarters ending with the start of the crash are initially included in the regressions of GDP growth and the change in GDP growth after the onset of the crash. Restricted regressions reflect the outcome of sequentially testing down and eliminating variables that are not significant at the 10 percent level; for the change in real equity price, all variables are significant at the 10 percent level, so the restricted regression applies a 5 percent criterion. In the equity price regression, the current account is not significant at the 5 percent level when the unemployment rate is dropped. *, **, and *** denote significance at the 10, 5, and 1 percent levels, respectively. Values in parentheses represent standard errors.

- 44 -
-20
-10
01
02
0
1975q1 1985q1 1995q1 2005q1
AL
-20
-10
01
02
0
1975q1 1985q1 1995q1 2005q1
BE
-20
-10
01
02
0
1975q1 1985q1 1995q1 2005q1
CA
-20
-10
01
02
0
1975q1 1985q1 1995q1 2005q1
DK
-20
-10
01
02
0
1975q1 1985q1 1995q1 2005q1
FI
-20
-10
01
02
0
1975q1 1985q1 1995q1 2005q1
FR
-20
-10
01
02
0
1975q1 1985q1 1995q1 2005q1
GC
-20
-10
01
02
01975q1 1985q1 1995q1 2005q1
GE
-20
-10
01
02
0
1975q1 1985q1 1995q1 2005q1
IR
-20
-10
01
02
0
1975q1 1985q1 1995q1 2005q1
IT
-20
-10
01
02
0
1975q1 1985q1 1995q1 2005q1
JP
-20
-10
01
020
1975q1 1985q1 1995q1 2005q1
NL
-20
-10
01
020
1975q1 1985q1 1995q1 2005q1
NO
-20
-10
01
020
1975q1 1985q1 1995q1 2005q1
NZ
-20
-10
01
020
1975q1 1985q1 1995q1 2005q1
PT
-20
-10
01
02
0
1975q1 1985q1 1995q1 2005q1
SD
-20
-10
010
20
1975q1 1985q1 1995q1 2005q1
SP
-20
-10
01
020
1975q1 1985q1 1995q1 2005q1
SZ-2
0-1
00
10
20
1975q1 1985q1 1995q1 2005q1
UK
-20
-10
01
02
0
1975q1 1985q1 1995q1 2005q1
US
(4-Quarter Percent Change)Figure 1. Nominal Effective Exchange Rates

- 45 -
010
204-
Q P
erce
nt C
hang
e
1975q11985q11995q12005q1
Inflation Rate
-50
5P
erce
nt
of G
DP
1975q11985q11995q12005q1
Current Account
05
10P
erce
nt
1975q11985q11995q12005q1
Unemployment Rate
-50
510
Per
cen
t
1975q11985q11995q12005q1
Real Interest Rate
-50
5P
erce
nt
of G
DP
1975 1985 1995 2005
Fiscal Balance
-10
010
204-
Q P
erce
nt C
hang
e
1975q11985q11995q12005q1
Terms of Trade
-50
54-
Q P
erce
nt C
hang
e
1975q11985q11995q12005q1
GDP Growth Rate
05
10P
erce
nt
1975q11985q11995q12005q1
Gov't Bond Yield
5010
0Lo
g S
cale
1975q11985q11995q12005q1
Real Equity Index
Figure 2. Australia

- 46 -
010
204-
Q P
erce
nt C
hang
e
1975q11985q11995q12005q1
Inflation Rate
-10
010
Per
cen
t of
GD
P
1975q11985q11995q12005q1
Current Account
010
20P
erce
nt
1975q11985q11995q12005q1
Unemployment Rate
-10
010
Per
cen
t
1975q11985q11995q12005q1
Real Interest Rate
-50
5P
erce
nt
of G
DP
1975 1985 1995 2005
Fiscal Balance
100
150
Log
Sca
le
1975q11985q11995q12005q1
Real Exchange Rate
-50
510
4-Q
Per
cent
Cha
nge
1975q11985q11995q12005q1
GDP Growth Rate
05
10P
erce
nt
1975q11985q11995q12005q1
Gov't Bond Yield
2510
0Lo
g S
cale
1975q11985q11995q12005q1
Real Equity Index
Figure 3. Finland
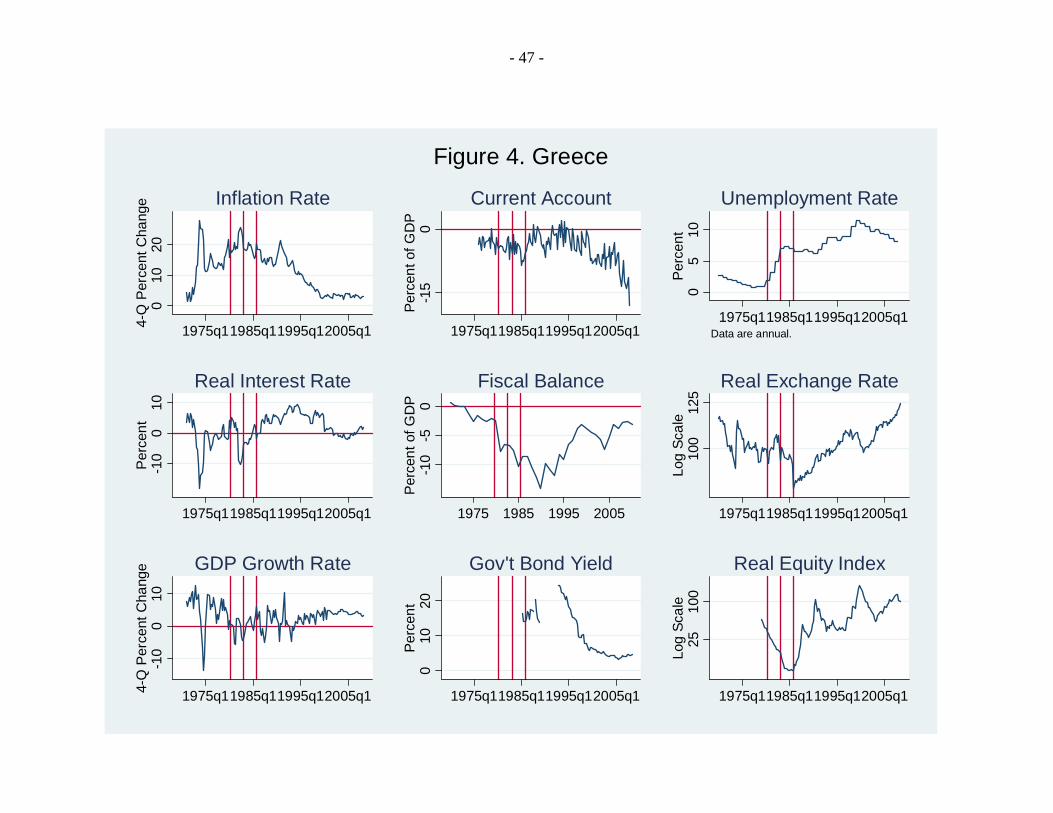
- 47 -
010
204-
Q P
erce
nt C
hang
e
1975q11985q11995q12005q1
Inflation Rate
-15
0P
erce
nt
of G
DP
1975q11985q11995q12005q1
Current Account
05
10P
erce
nt
1975q11985q11995q12005q1Data are annual.
Unemployment Rate
-10
010
Per
cen
t
1975q11985q11995q12005q1
Real Interest Rate
-10
-50
Per
cen
t of
GD
P
1975 1985 1995 2005
Fiscal Balance
100
125
Log
Sca
le
1975q11985q11995q12005q1
Real Exchange Rate
-10
010
4-Q
Per
cent
Cha
nge
1975q11985q11995q12005q1
GDP Growth Rate
010
20P
erce
nt
1975q11985q11995q12005q1
Gov't Bond Yield
2510
0Lo
g S
cale
1975q11985q11995q12005q1
Real Equity Index
Figure 4. Greece

- 48 -
010
204-
Q P
erce
nt C
hang
e
1975q11985q11995q12005q1
Inflation Rate
-50
5P
erce
nt
of G
DP
1975q11985q11995q12005q1
Current Account
05
10P
erce
nt
1975q11985q11995q12005q1
Unemployment Rate
-50
510
Per
cen
t
1975q11985q11995q12005q1
Real Interest Rate
-10
-50
Per
cen
t of
GD
P
1975 1985 1995 2005
Fiscal Balance
100
125
Log
Sca
le
1975q11985q11995q12005q1
Real Exchange Rate
-50
510
4-Q
Per
cent
Cha
nge
1975q11985q11995q12005q1
GDP Growth Rate
010
20P
erce
nt
1975q11985q11995q12005q1
Gov't Bond Yield
2510
0Lo
g S
cale
1975q11985q11995q12005q1
Real Equity Index
Figure 5. Italy

- 49 -
010
204-
Q P
erce
nt C
hang
e
1975q11985q11995q12005q1
Inflation Rate
-15
0P
erce
nt
of G
DP
1975q11985q11995q12005q1
Current Account
05
10P
erce
nt
1975q11985q11995q12005q1
Unemployment Rate
-10
010
Per
cen
t
1975q11985q11995q12005q1
Real Interest Rate
-50
5P
erce
nt
of G
DP
1975 1985 1995 2005Dashed line represents fiscal year data.
Fiscal Balance
-40
-20
020
4-Q
Per
cent
Cha
nge
1975q11985q11995q12005q1
Terms of Trade
-10
010
4-Q
Per
cent
Cha
nge
1975q11985q11995q12005q1
GDP Growth Rate
010
20P
erce
nt
1975q11985q11995q12005q1
Gov't Bond Yield
100
200
Log
Sca
le1975q11985q11995q12005q1
Real Equity Index
Figure 6. New Zealand

- 50 -
010
204-
Q P
erce
nt C
hang
e
1975q11985q11995q12005q1
Inflation Rate
-15
0P
erce
nt
of G
DP
1975q11985q11995q12005q1
Current Account
05
10P
erce
nt
1975q11985q11995q12005q1
Unemployment Rate
-10
010
Per
cen
t
1975q11985q11995q12005q1
Real Interest Rate
-10
-50
Per
cen
t of
GD
P
1975 1985 1995 2005
Fiscal Balance
7510
0Lo
g S
cale
1975q11985q11995q12005q1
Real Exchange Rate
-50
510
4-Q
Per
cent
Cha
nge
1975q11985q11995q12005q1
GDP Growth Rate
010
20P
erce
nt
1975q11985q11995q12005q1
Gov't Bond Yield
5010
0Lo
g S
cale
1975q11985q11995q12005q1
Real Equity Index
Figure 7. Portugal

- 51 -
010
204-
Q P
erce
nt C
hang
e
1975q11985q11995q12005q1
Inflation Rate
-10
-50
5P
erce
nt
of G
DP
1975q11985q11995q12005q1
Current Account
010
20P
erce
nt
1975q11985q11995q12005q1
Unemployment Rate
-10
010
Per
cen
t
1975q11985q11995q12005q1
Real Interest Rate
-10
-50
Per
cen
t of
GD
P
1975 1985 1995 2005
Fiscal Balance
100
125
Log
Sca
le
1975q11985q11995q12005q1
Real Exchange Rate
-50
510
4-Q
Per
cent
Cha
nge
1975q11985q11995q12005q1
GDP Growth Rate
010
20P
erce
nt
1975q11985q11995q12005q1
Gov't Bond Yield
2510
0Lo
g S
cale
1975q11985q11995q12005q1
Real Equity Index
Figure 8. Spain

- 52 -
05
104-
Q P
erce
nt C
hang
e
1975q11985q11995q12005q1
Inflation Rate
-50
5P
erce
nt
of G
DP
1975q11985q11995q12005q1
Current Account
05
10P
erce
nt
1975q11985q11995q12005q1
Unemployment Rate
-10
010
Per
cen
t
1975q11985q11995q12005q1
Real Interest Rate
-10
-50
5P
erce
nt
of G
DP
1975 1985 1995 2005
Fiscal Balance
100
150
Log
Sca
le
1975q11985q11995q12005q1
Real Exchange Rate
-50
510
4-Q
Per
cent
Cha
nge
1975q11985q11995q12005q1
GDP Growth Rate
05
10P
erce
nt
1975q11985q11995q12005q1
Gov't Bond Yield
2510
0Lo
g S
cale
1975q11985q11995q12005q1
Real Equity Index
Figure 9. Sweden

- 53 -
010
204-
Q P
erce
nt C
hang
e
1975q11985q11995q12005q1
Inflation Rate
-50
5P
erce
nt
of G
DP
1975q11985q11995q12005q1
Current Account
05
10P
erce
nt
1975q11985q11995q12005q1
Unemployment Rate
-10
010
Per
cen
t
1975q11985q11995q12005q1
Real Interest Rate
-10
-50
Per
cen
t of
GD
P
1975 1985 1995 2005
Fiscal Balance
7510
0Lo
g S
cale
1975q11985q11995q12005q1
Real Exchange Rate
-50
510
4-Q
Per
cent
Cha
nge
1975q11985q11995q12005q1
GDP Growth Rate
010
20P
erce
nt
1975q11985q11995q12005q1
Gov't Bond Yield
2510
0Lo
g S
cale
1975q11985q11995q12005q1
Real Equity Index
Figure 10. United Kingdom
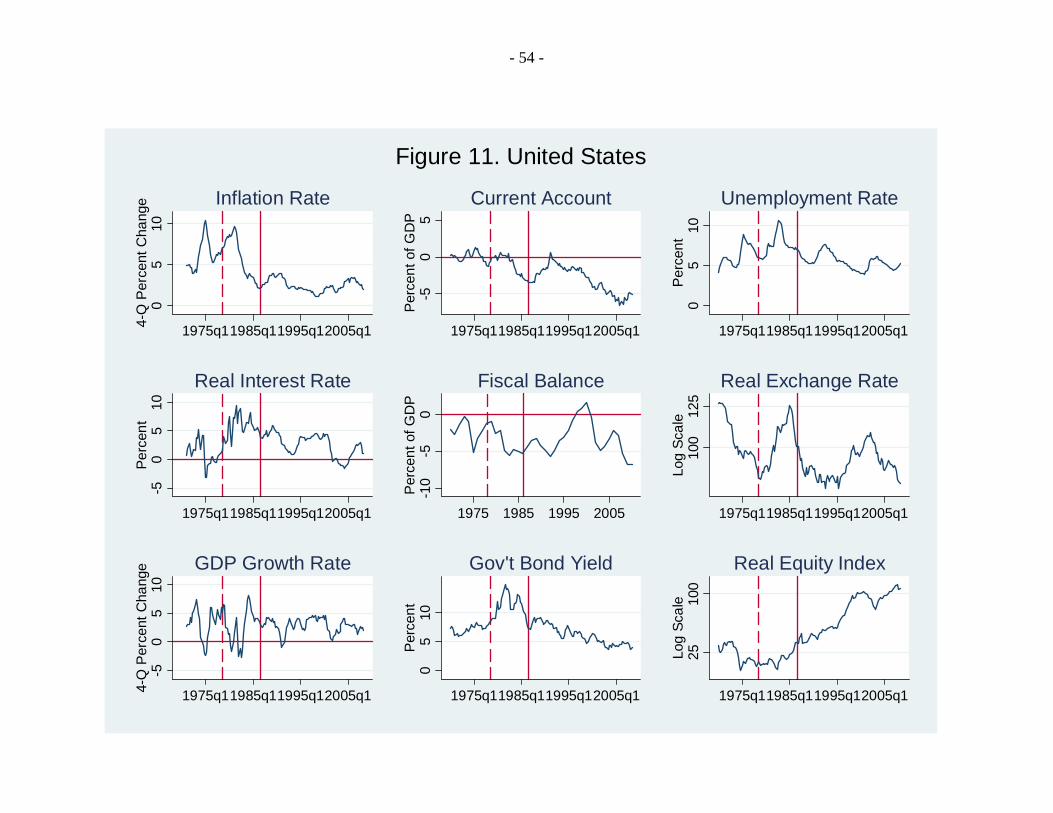
- 54 -
05
104-
Q P
erce
nt C
hang
e
1975q11985q11995q12005q1
Inflation Rate
-50
5P
erce
nt
of G
DP
1975q11985q11995q12005q1
Current Account
05
10P
erce
nt
1975q11985q11995q12005q1
Unemployment Rate
-50
510
Per
cen
t
1975q11985q11995q12005q1
Real Interest Rate
-10
-50
Per
cen
t of
GD
P
1975 1985 1995 2005
Fiscal Balance
100
125
Log
Sca
le
1975q11985q11995q12005q1
Real Exchange Rate
-50
510
4-Q
Per
cent
Cha
nge
1975q11985q11995q12005q1
GDP Growth Rate
05
10P
erce
nt
1975q11985q11995q12005q1
Gov't Bond Yield
2510
0Lo
g S
cale
1975q11985q11995q12005q1
Real Equity Index
Figure 11. United States