curb allocation change projectdepts.washington.edu/sctlctr/sites/default/files/... · this study...
TRANSCRIPT

Anne GoodchildDon MacKenzieAndisheh RanjbariJose MachadoGiacomo Dalla Chiara
UNIVERSITY OF WASHINGTON • JUNE 14, 2019
Curb Allocation Change Project Final Report
This study was sponsored by Amazon, Challenge Seattle, the Seattle Department of Transportation, King County Metro and Sound Transit with support from the Mobility Innovation Center at UW CoMotion.

2CURB ALLOCATION CHANGE PROJECT
CONTENTS
Executive Summary ..........................................................................................................................................4
1 Introduction ....................................................................................................................................................7
2 Study Area .....................................................................................................................................................10
3 Data ................................................................................................................................................................15
3.1 Curb Activity Data .................................................................................................................................................. 16
3.2 Traffic Speed and Flow Data ............................................................................................................................... 17
3.3 Additional Street Observations ........................................................................................................................... 18
3.4 Passenger Survey .................................................................................................................................................. 18
3.5 Supplementary Data Elements ........................................................................................................................... 19
4 Data Analysis ................................................................................................................................................20
4.1 Impacts on Traffic Speed ......................................................................................................................................................21
4.1.1 Variable description .....................................................................................................................................................21
4.1.2 Results ..........................................................................................................................................................................22
4.2 TNC Demand and Operation ...............................................................................................................................................22
4.2.1 Passenger Pick-ups/Drop-offs versus Total Traffic Volume .........................................................................................22
4.2.2 Vehicle Dwell Time .......................................................................................................................................................24
4.2.2.1 Dwell time analysis in terms of pick-ups and drop-offs .................................................................................24
4.2.2.2 Dwell time analysis for event locations ..........................................................................................................24
4.2.2.3 Dwell time analysis for different phases of study ..........................................................................................25
4.2.2.4 Dwell time analysis for number of passengers ..............................................................................................27
4.2.3 Passenger-Driver Contact Rate and Dispatch-to-Arrival Time ...................................................................................27
4.3 Curb Use Changes ................................................................................................................................................................28
4.3.1 Compliance ...................................................................................................................................................................28
4.3.2 PLZ occupancy ..............................................................................................................................................................30
4.3.3 Vehicle Productivity at PLZs .........................................................................................................................................31
4.3.4 Curb Space Productivity ...............................................................................................................................................32
4.3.5 In-lane Parking Behavior ..............................................................................................................................................33
4.4 Safety Impacts ......................................................................................................................................................................34
4.4.1 Conflicts ........................................................................................................................................................................34
4.5 Passenger Experience ..........................................................................................................................................................35
3CURB ALLOCATION CHANGE PROJECT
5 Discussion of Site-Specific Characteristics ..............................................................................................39
5.1 Street Design .......................................................................................................................................................... 40
5.2 Amazon Parking Garages .................................................................................................................................... 41
5.3 High Levels of Unorganized Pedestrian Activity .............................................................................................. 43
5.4 Regional Traffic Congestion on Arterials ........................................................................................................... 44
6 Conclusion and Recommendations ..........................................................................................................46
Appendices .......................................................................................................................................................49
Appendix A: Changes Made by SDOT in the South Lake Union Area ................................................................ 49
Appendix B: Amazon’s Poster Sent out to Employees regarding the Designated
Pick-up/Drop-off Locations ........................................................................................................................................ 52
Appendix C: Passenger Survey (Pick-up Example) ................................................................................................. 53
Appendix D: Details on the Formulation and Estimation of the Speed Regression Model ........................... 57
Appendix E: Dwell Time Analysis for Passenger Pick-ups for Different Event Locations ............................... 60
Appendix F: Chi-Square Test Results for Compliance in Pick-up/Drop-off Behaviors .................................... 61
Appendix G: Vehicle Representative Length ........................................................................................................... 62
Appendix H: Estimation Results of the Binomial Regression Model
of the Probability of a Pick-up/Drop-off Event Being a Conflict .......................................................................... 63
Appendix I: Results of Ordinal Logit model for Passenger Satisfaction ............................................................. 64
Appendix J: Construction Activities in the Proximity of the Study Area ............................................................. 66

4CURB ALLOCATION CHANGE PROJECT
EXECUTIVE SUMMARYLike many congested cities, Seattle is grappling with how best to manage increasing use of ride-hailing service
by Transportation Network Companies (TNCs) like Uber and Lyft. According to a 2018 Seattle Times analysis,
TNC ridership in the Seattle region has grown to more than five times the level it was in the beginning of 2015,
providing, on average, more than 91,000 rides a day in 2018. And the newspaper reports Uber and Lyft trips
are heavily concentrated in the city’s densest neighborhoods, where nearly 40,000 rides a day start in ZIP
codes covering downtown, Belltown, Capitol Hill and South Lake Union.
This University of Washington (UW) study focuses on a strategy to manage TNC driver stops when picking up
and dropping off passengers with the aim of improving traffic flow in the South Lake Union (SLU) area. SLU
is the site of the main campus for Amazon, the online retail company. The site is known to generate a large
number of TNC trips, and Amazon reports high rates of ride-hailing use for employee commutes. This study
also found that vehicle picking-up/dropping-off passengers make up a significant share of total vehicle activity
in SLU. The center city neighborhood is characterized by multiple construction sites, slow speed limits (25 mph)
and heavy vehicle and pedestrian traffic.
Broad concerns about congestion, safety and effective curb use led to this study, conducted by researchers
at the UW’s Urban Freight Lab and Sustainable Transportation Lab. Amazon specifically was concerned
about scarcity of curb space where TNC drivers could legally and readily stop to pick up and drop off
passengers. Without dedicated load/unload curb space, TNC vehicles stop and wait at paid parking spots,
other unauthorized curb spots, or in the travel lane itself, potentially blocking or slowing traffic. To try to
mitigate the impacts of passenger pick-up/drop-off activity on traffic, the city proposed a strategy of increasing
passenger loading zone (PLZ) spaces while Uber and Lyft implemented a geofence, which directs their drivers
and passengers to designated pick-up and drop-off locations on a block. (Normally, drivers pick up or drop off
passengers at any address a rider requests via the ride-hailing app.)
By providing ample designated pick-up and drop-off spots along the curb, the thinking goes, TNC drivers
would reduce the frequency with which they stop in the travel lane to pick up or drop off passengers and the
time they stay stopped there. By these measures, this study’s findings show the approach was successful. But
it is important to note that the strategy is not a silver bullet for solving traffic congestion—nor is it designed
as such. It is also important to note that any initiative to manage use of curbs and roads (by TNCs or others) is
part of a city’s broader transportation policy framework and goals.
For this study, researchers analyzed an array of data on street and curb activity along three block-faces on
Boren Ave N in December 2018 and January 2019. At a minimum, data were collected during the morning
and afternoon peak travel times (with some collected 24 hours a day). The research team collected data using
video and sensor technology as well as in-person observation. Researchers also surveyed TNC passengers for
demographic, trip-related and satisfaction data. The five Amazon buildings in the area studied house roughly
8,650 employees.
Researchers collected data in three stages. Phase 1, the study baseline, was before PLZs were added and
geofencing started. Phase 2 was after the new PLZs were added, expanding total PLZ curb length from 20
feet (easily filled by one to two vehicles) to 274 feet. Phase 3 was after geofencing was added to the expanded
PLZs. The added PLZ spaces were open to any passenger vehicle—not just TNC vehicles—weekdays from 7am
to 10am and 2pm to 7pm. (Permitted food trucks were authorized from 10am to 2pm.)

5CURB ALLOCATION CHANGE PROJECT
Note that while other cities can learn from this analysis, the findings apply to streets with comparable traffic
speed, mix of roadway users, and street design.
The study’s main findings include:
• A significant percentage of vehicles performing a pick-up/drop-off stop in the travel lane. Those in-lane
stops appear connected to the lack of available designated curb space: Adding PLZs and geofencing
increased driver compliance in stopping at the curb versus stopping in the travel lane to load and
unload passengers. But it was not lack of curb space alone that influenced driver activity: Between 7
percent and 10 percent of drivers still stopped in the travel lane even when PLZs were empty. After
adding PLZs and geofencing, in-lane stops fell from 20 percent to 14 percent for pick-ups and from 16
percent to 15 percent for drop-offs.
• Adding PLZs and geofencing reduced the average amount of time drivers stopped to load and unload
passengers. For example, 90 percent of drop-offs took less than 1 minute 12 seconds, 42 seconds faster
than the average with the added PLZs alone.
• While curb occupancy increased after adding PLZs and geofencing, occupancy results show the
current allocation of PLZ spaces is more than what is needed to meet observed demand: Average PLZ
occupancy remained under 20 percent after PLZ expansion, even during peak commute hours.
• Vehicles picking-up/dropping-off passengers account for a significant share of total traffic volume in the
study area: during peak hours the observed average percentage of vehicles performing a pick-up/drop-
off with respect to the total traffic volume was 29 percent (in Phase 1), 32 percent (in Phase 2) and 39
percent (in Phase 3).
• High volumes of pedestrians (400-500 per hour on average) cross the street at points where there was
no crosswalk. Passengers picked-up/dropped-off constituted a fraction (five to seven percent) of those
pedestrians, but high rates of passengers (30 to 40 percent) cross the street at non-crosswalk locations.
• Adding PLZs and geofencing did not have a significant impact on traffic safety. Researchers found
no significant change in the number of observed conflicts from baseline to the addition of PLZs and
geofencing. Conflicts are situations where a vehicle, bike, or pedestrian is interrupted, forced to alter
their path, or engaged in a near-miss situation. Conflicts include vehicles passing in the oncoming traffic
lane.
• Adding PLZs and geofencing also did not produce a significant impact on roadway travel speed.
• Of the 116 TNC passengers surveyed in the study area:
• Roughly 40 percent to 50 percent said their trip was work related. More than half said they
used ride-hailing service at least once a week and 70 percent or more used TNC alone (versus in
combination with other transportation options) to get from their origin to their destination.
• Most responded positively to the added PLZs and geofence: 79 percent rated their pick-up
satisfactory and 100 percent rated their drop-off satisfactory as compared to 72 percent and 89
percent in the baseline.
• Nearly half said they would have taken transit and one-third would have walked if ride-hailing was
not available.
• 40 percent requested a shared TNC vehicle in Phase 1 and 47 percent in Phase 3.

6CURB ALLOCATION CHANGE PROJECT
The study suggests that while vehicles picking-up/dropping-off passengers account for a significant share
of traffic volume in SLU, they are not the primary cause of congestion. Myriad factors impact neighborhood
congestion, including high vehicle volume overall and bottlenecks moving out of the neighborhood onto
regional arterials. As researchers observed in the afternoon peak, these bottlenecks cause spillbacks onto local
streets. Amazon garages exit vehicles onto streets that then feed into these clogged arterials.
Regarding traffic safety in SLU, this study was not designed to assess whether TNC driver behavior on average
is safer or less safe than that of other vehicles. It is important to understand the safety and speed findings in
the context of the SLU traffic environment. Drivers tend to drive at relatively slow speeds, navigating around
high pedestrian and jaywalking volumes, and seem relatively comfortable stopping in the middle of the street
for short periods of time. Due to the nature of area traffic, this seems to have relatively little impact on other
drivers. Drivers appear to anticipate both this behavior and the high volumes of vehicles moving onto/off the
curb and into/out of driveways and alleys.
Whether the strategy this study analyzed is recommended depends on a city’s transportation goals and
approach. The researchers found the increased PLZ allocation and geofencing strategy worked in that
it improved driver compliance, reduced dwell times, and boosted TNC user satisfaction. However, this
may encourage commuters to use TNC. The passenger survey clearly shows that TNC service is attracting
passengers who would have otherwise walked or used transit. While in the short term the increased PLZs
and geofencing had a positive effect on traffic, if this induces TNC demand, there could be larger, more
negative long-term consequences. If the end goal is to reduce traffic congestion, measures to reduce—rather
than encourage—TNC and passenger car use as the predominant mode of commuting will yield the most
substantial benefits.

7CURB ALLOCATION CHANGE PROJECT
1
Introduction

8CURB ALLOCATION CHANGE PROJECT
1 INTRODUCTIONIn recent years, many U.S. cities have seen a rapid increase in ride-hailing trips by Transportation Network
Companies (TNCs), such as Uber and Lyft. By providing application dispatch services, TNCs allow travelers
to connect with drivers via smartphone apps. Nationally, the share of Americans who have used ride-hailing
services has more than doubled since 2015, from 15 percent to 36 percent.
According to an analysis by The Seattle TImes, TNC ridership in the Seattle region has grown to more than
five times the level it was in the beginning of 2015, providing, on average, more than 91,000 rides a day in
2018. Those rides were equivalent to roughly one-quarter of the city’s public transit ridership at the time.
Additionally, Uber and Lyft trips are heavily concentrated in the city’s densest neighborhoods, where nearly
40,000 rides a day start in ZIP codes covering downtown, Belltown, Capitol Hill and South Lake Union.
This study focuses on a strategy to manage TNC driver stops when picking up and dropping off passengers
with the aim of improving traffic flow in the South Lake Union (SLU) neighborhood, the site of the main
campus for Amazon, the online retail company. Amazon reports high rates of ride-hailing use for employee
commutes, and this analysis found vehicles picking-up/dropping-off passengers constitute on average
between 29% to 39% of total traffic volume in SLU, during peak hours. The center city neighborhood is
characterized by multiple construction sites, slow speed limits (25 mph) and heavy vehicle and pedestrian
traffic.
Unless dedicated spaces are reserved for pick-up and drop-off activities (referred to as Passenger Load Zone,
or PLZ, spaces), TNC vehicles stop and wait at spaces allocated for other purposes (such as paid parking spots
or other unauthorized curb spaces) or in the travel lane itself, potentially blocking or slowing traffic and adding
to congestion. Rising TNC use poses challenges for how cities can best manage curb space in the context of
their broader transportation initiatives and goals. In Seattle, some have called for the city to consider allocating
more city curb space for passenger pick-up and drop-off.
Broad concerns about congestion, safety and effective curb use led to this study, conducted by researchers
at the University of Washington’s Urban Freight Lab and Sustainable Transportation Lab. Amazon specifically
was concerned about a scarcity of curb space for TNCs to stop to pick up and drop off riders. To try to mitigate
the impacts of TNC vehicles on traffic, the city proposed a strategy of increasing passenger loading zone (PLZ)
spaces while Uber and Lyft implemented a geofence, which directs their drivers and passengers to designated
pick-up and drop-off spots on a block (Normally, drivers pick up or drop off passengers at any address a rider
requests via the ride-hailing app).
The rationale behind the two-pronged strategy posits that by providing ample designated pick-up and drop-off
spots along the curb, TNC drivers would reduce the frequency with which they stop in the travel lane to pick
up or drop off passengers and the time they stay stopped there. By these measures, the findings show the
approach was successful.
Adding PLZs and geofencing did increase TNC driver compliance in stopping at the curb versus stopping in
the travel lane to load and unload passengers: In-lane stops for pick-ups fell from 20 percent at baseline to 14
percent and for drop-offs fell from 16 percent at baseline to 15 percent. That said, it was not lack of curb space
alone that influenced TNC driver activities: Between 7 percent and 10 percent of drivers still stopped in the
travel lane even when PLZ spaces were empty.

9CURB ALLOCATION CHANGE PROJECT
Adding PLZs and geofencing did reduce the average amount of time TNC drivers stopped to load and unload
passengers: 90 percent of drop-offs took less than 1 minute 12 seconds, 42 seconds faster than the average
with the added PLZs alone.
These findings aside, it is critical to note that the strategy is not a silver bullet for solving traffic congestion—
nor is it designed as such.
For this study, researchers analyzed an array of data on street and curb activity along three block-faces on
Boren Ave N in December 2018 and January 2019. At a minimum, data were collected during the morning
and afternoon peak travel times (with some collected 24 hours a day). The research team collected data using
video and sensor technology as well as in-person observation. The five Amazon buildings in the area studied
house roughly 8,650 employees. Researchers also surveyed TNC passengers for an array of demographic and
TNC use data.
Data was collected in three stages. Phase 1, the study baseline, was before PLZs were added and geofencing
started. Phase 2 was after the new PLZs were added, expanding total PLZ curb length from 20 feet (easily filled
by one to two vehicles) to 274 feet. Phase 3 was after geofencing was added to the expanded PLZs. The PLZ
spaces were open to any passenger vehicle—not just TNC vehicles. (The exception was the hours from 10am
to 2pm, when spots were reserved for permitted food trucks.)
This research examines the impact of the increased PLZs and geofencing on local traffic and TNC operation by
asking the extent to which:
• TNC dwell time changed
• It was easier or harder for TNC passengers and drivers to find each other
• TNC drivers’ compliance changed in using curb space for passenger pick-up and drop-off versus
stopping in the travel lane
• TNC drivers’ decision to stop in the travel lane is a consequence of curb availability
• Study area traffic speed changed
• Study area traffic safety changed
• The added PLZs were utilized
The study also investigates:
• How TNC passenger satisfaction changed in response to the strategy
• TNC share of total traffic volume in the study area
It is worth noting that while other cities can learn from this analysis, the findings apply to streets with
comparable traffic speed, mix of roadway users, and street design.

10CURB ALLOCATION CHANGE PROJECT
2
Study Area

11CURB ALLOCATION CHANGE PROJECT
2 STUDY AREAThis study has been conducted in the South Lake Union (SLU) area of Seattle, WA (Figure 1). There are a
number of Amazon buildings located in this area, and Amazon reports high rates of ride-hailing use for
employee commutes. The area is also known as a busy area in terms of vehicular traffic, pedestrian activity,
and passenger pick-up/drop-offs.
Over the course of this study, the Seattle Department of Transportation (SDOT) made changes to PLZs and
paid parking zones in the area with the intent of influencing traffic flow. The curb change area is shown in
Figure 2 and covers south of Mercer St, west of Fairview Ave, north of John St and east of 9th Ave N. The
changes include a) installing signs to reduce the paid parking time limit and to change curb allocation from
paid parking/food truck (PS-VEN) to passenger load zone/food truck (PLZ-VEN), and b) geofencing for pick-up/
drop-off activities.
Figure 1: South Lake Union (SLU) area in Seattle, WA

12CURB ALLOCATION CHANGE PROJECT
Curb reallocation and sign installation happened on December 10, 2018, and the new PLZs were effective
7-10am and 2-7pm Monday through Friday (Figure 3). Permitted food trucks were authorized to use the curb
between 10am-2pm on weekdays. This resulted in an increase in PLZ spaces, which are the curb allocation
intended for use by TNC vehicles or other vehicles picking up or dropping off passengers. A complete
inventory of changes along with detailed maps are provided in Appendix A.
Figure 2: Curb change area and study block-faces
Mercer St
Mercer St
Republican St
Harrison St
Thomas St
John St John St
9th Ave
Fairview Ave
Westlake Ave N
Terry Ave N
Boren Ave N
Study block-face

13CURB ALLOCATION CHANGE PROJECT
In addition to curb reallocations, two ride-hailing companies, Uber and Lyft, implemented a geofence in the
area for passenger pick-ups and drop-offs. Implemented in the Uber and Lyft applications, geofencing directed
ride-hailing drivers and passengers to designated locations along a block with the purpose of regulating TNC
vehicle operations. Geofencing was implemented on December 24, 2018, and the pick-up/drop-off points
implemented in the ride-hailing apps are shown in Figure 4. It should be noted that Uber applied geofencing
all day, while Lyft limited it to 7-10 am and 2-7 pm to match the signs.
For this project, we selected three block-faces on Boren Ave N to study more closely. The study block-faces are
shown in Figure 2 and listed below:
• East side of Boren between Harrison and Thomas Streets
• West side of Boren between Harrison and Thomas Streets
• West side of Boren between Thomas and John Streets
Total PLZ curb length on these block-faces was expanded from 20 feet (easily filled by one to two vehicles)
to 274 feet. These block-faces experience intense pick-up and drop-off activity, as well as high pedestrian
volumes, during peak hours, and there are one or two Amazon buildings on each block-face. The number of
employees seated at the five Amazon buildings next to our study block-faces was about 8,650 at the time of
Figure 3: Signs installed by SDOT for the added PLZs

14CURB ALLOCATION CHANGE PROJECT
study. It is worth noting that Amazon informed its employees of the geofencing and the designated pick-up/
drop-off locations via sending out an email announcement and posting flyers on December 24th, 2018 (the go-
live date for geofencing). A copy of the flyer shared with employees is provided in Appendix B.
Figure 4: Geofence area and designated pick-up/drop-off locations implemented in SLU
Mercer St
Mercer St
Republican St
Harrison St
Thomas St
John St John St
9th Ave
Fairview Ave
Westlake Ave N
Terry Ave N
Boren Ave N
Designated pick-up/drop-off location Geofence area boundary

15CURB ALLOCATION CHANGE PROJECT
3
Data
16CURB ALLOCATION CHANGE PROJECT
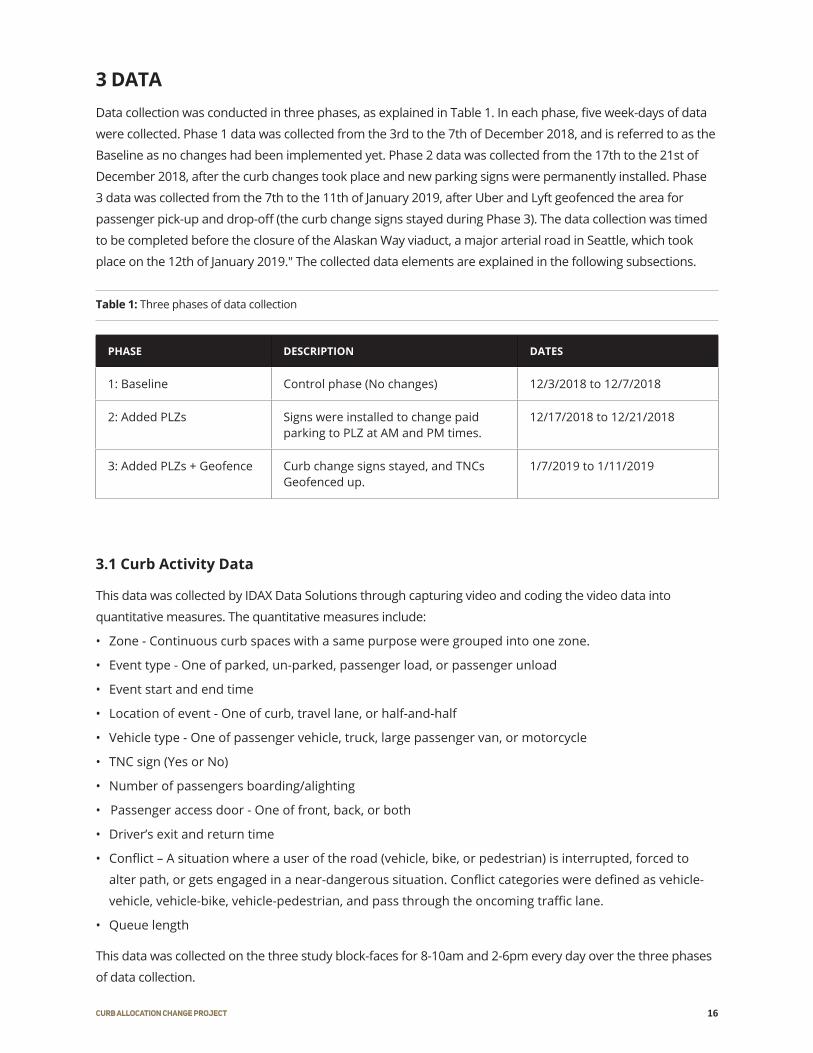
3 DATAData collection was conducted in three phases, as explained in Table 1. In each phase, five week-days of data
were collected. Phase 1 data was collected from the 3rd to the 7th of December 2018, and is referred to as the
Baseline as no changes had been implemented yet. Phase 2 data was collected from the 17th to the 21st of
December 2018, after the curb changes took place and new parking signs were permanently installed. Phase
3 data was collected from the 7th to the 11th of January 2019, after Uber and Lyft geofenced the area for
passenger pick-up and drop-off (the curb change signs stayed during Phase 3). The data collection was timed
to be completed before the closure of the Alaskan Way viaduct, a major arterial road in Seattle, which took
place on the 12th of January 2019." The collected data elements are explained in the following subsections.
3.1 Curb Activity Data
This data was collected by IDAX Data Solutions through capturing video and coding the video data into
quantitative measures. The quantitative measures include:
• Zone - Continuous curb spaces with a same purpose were grouped into one zone.
• Event type - One of parked, un-parked, passenger load, or passenger unload
• Event start and end time
• Location of event - One of curb, travel lane, or half-and-half
• Vehicle type - One of passenger vehicle, truck, large passenger van, or motorcycle
• TNC sign (Yes or No)
• Number of passengers boarding/alighting
• Passenger access door - One of front, back, or both
• Driver’s exit and return time
• Conflict – A situation where a user of the road (vehicle, bike, or pedestrian) is interrupted, forced to
alter path, or gets engaged in a near-dangerous situation. Conflict categories were defined as vehicle-
vehicle, vehicle-bike, vehicle-pedestrian, and pass through the oncoming traffic lane.
• Queue length
This data was collected on the three study block-faces for 8-10am and 2-6pm every day over the three phases
of data collection.
PHASE DESCRIPTION DATES
1: Baseline Control phase (No changes) 12/3/2018 to 12/7/2018
2: Added PLZs Signs were installed to change paid parking to PLZ at AM and PM times.
12/17/2018 to 12/21/2018
3: Added PLZs + Geofence Curb change signs stayed, and TNCs Geofenced up.
1/7/2019 to 1/11/2019
Table 1: Three phases of data collection

17CURB ALLOCATION CHANGE PROJECT
3.2 Traffic Speed and Flow Data
This data was collected by IDAX Data Solutions through installing tube counters in the study area and
converting tube data into quantitative measures of speed and volume. This data was collected for 24 hours
every day over the three phases of data collection, and traffic speeds and volumes were given in 5-minute
intervals for each of the north and south bound directions. The tubes were installed in four locations as
shown in Figure 5.
Figure 5: Approximate locations of tube counters positioned in the study area
Mercer St
Mercer St
Republican St
Harrison St
Thomas St
John St John St
9th Ave
Fairview Ave
Westlake Ave N
Terry Ave N
Boren Ave N
Tube Counter Location
1
2 4
3
18CURB ALLOCATION CHANGE PROJECT
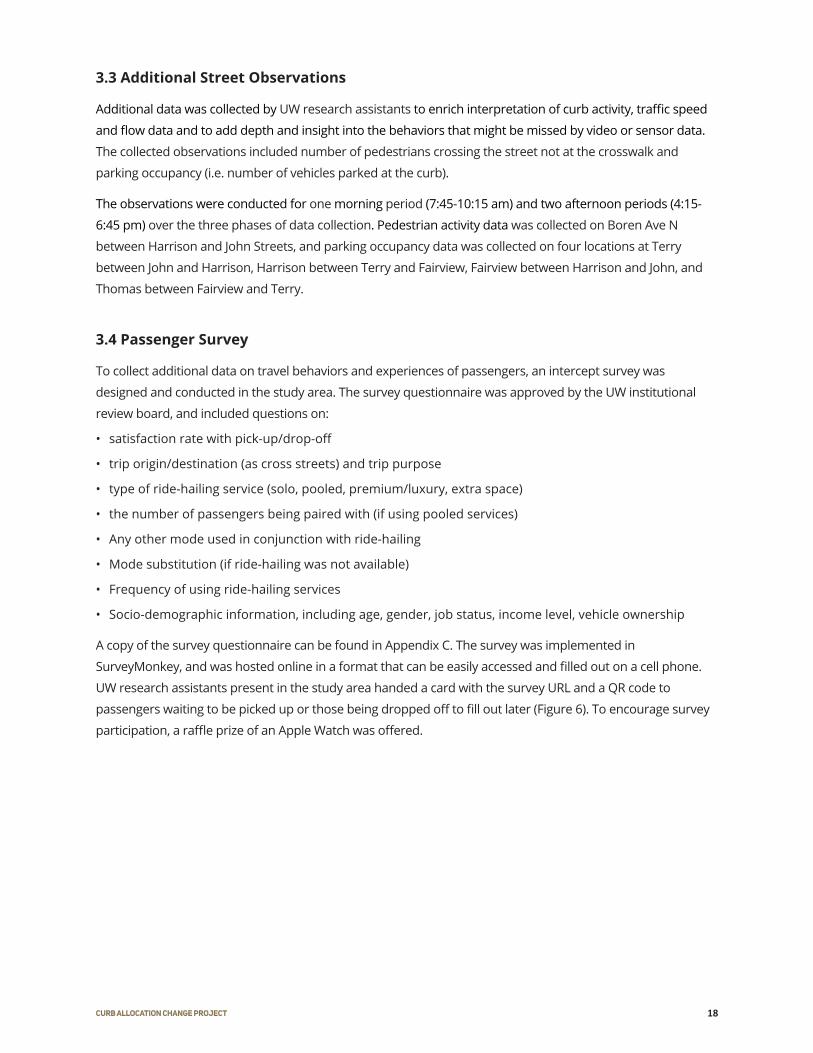
3.3 Additional Street Observations
Additional data was collected by UW research assistants to enrich interpretation of curb activity, traffic speed
and flow data and to add depth and insight into the behaviors that might be missed by video or sensor data.
The collected observations included number of pedestrians crossing the street not at the crosswalk and
parking occupancy (i.e. number of vehicles parked at the curb).
The observations were conducted for one morning period (7:45-10:15 am) and two afternoon periods (4:15-
6:45 pm) over the three phases of data collection. Pedestrian activity data was collected on Boren Ave N
between Harrison and John Streets, and parking occupancy data was collected on four locations at Terry
between John and Harrison, Harrison between Terry and Fairview, Fairview between Harrison and John, and
Thomas between Fairview and Terry.
3.4 Passenger Survey
To collect additional data on travel behaviors and experiences of passengers, an intercept survey was
designed and conducted in the study area. The survey questionnaire was approved by the UW institutional
review board, and included questions on:
• satisfaction rate with pick-up/drop-off
• trip origin/destination (as cross streets) and trip purpose
• type of ride-hailing service (solo, pooled, premium/luxury, extra space)
• the number of passengers being paired with (if using pooled services)
• Any other mode used in conjunction with ride-hailing
• Mode substitution (if ride-hailing was not available)
• Frequency of using ride-hailing services
• Socio-demographic information, including age, gender, job status, income level, vehicle ownership
A copy of the survey questionnaire can be found in Appendix C. The survey was implemented in
SurveyMonkey, and was hosted online in a format that can be easily accessed and filled out on a cell phone.
UW research assistants present in the study area handed a card with the survey URL and a QR code to
passengers waiting to be picked up or those being dropped off to fill out later (Figure 6). To encourage survey
participation, a raffle prize of an Apple Watch was offered.

19CURB ALLOCATION CHANGE PROJECT
The survey was administered at several locations in the neighborhood, which correspond to the designated
pick-up/drop-off points. The survey was conducted during morning (8:30-10:30 am) and evening (5-7 pm)
periods each week. Surveying on the locations other than the three study block-faces was done over the same
dates as phases 1 and 3 of data collection; however, since intercepting passengers would affect the vehicle
stop time and traffic flow, we conducted the survey on the three study block-faces on a Monday and Tuesday
of the week after the data collection phase dates. So, data collection dates for intercept surveys were 12/3-
12/7 and 12/10-12/11 for Baseline phase and 1/7-1/11 and 1/14-1/15 for Phase 3 (Added PLZs + Geofence).
3.5 Supplementary Data Elements
The other data elements that are collected for the project are listed in Table 2.
Figure 6: A sample passenger intercept survey card
DATA ELEMENT DATA DESCRIPTION DATA COLLECTION DATES PROVIDER
Turning Movement Counts
Counts of all movements at the intersections
7-11 AM and 1-7 PM, every day over the three phases of data collection
SDOT
Amazon Garage Data
Number of parking spaces, Number of vehicles in the garage at the start of each data collection period, and Number of vehicles entering/exiting the garage during the data collection period
7-11 AM and 1-7 PM, every day over the three phases of data collection
Amazon
Acyclica Sensors Data
Travel time estimates on nearby arterials
7-11 AM and 1-7 PM, every day over the three phases of data collection
IDAX Data Solutions (through SDOT’s API)
Table 2: Supplementary Data Elements Collected for the Project

20CURB ALLOCATION CHANGE PROJECT
4
Data Analysis

21CURB ALLOCATION CHANGE PROJECT
4 DATA ANALYSIS
4.1 Impacts on Traffic Speed
To explore the extent to which the changes of adding PLZs and geofencing affected traffic speed, a regression
analysis was performed. The regression model studies the effects of traffic volume and other variables
including the number of passenger drop-off and pick-up events on traffic speed.
The main variables used in the regression analysis and the main results from the analysis are reported in the
following subsections. More technical details on the formulations and estimations of the regression model are
reported in Appendix D.
4.1.1 Variable description
The variable of interest in this regression model is traffic speed, which is obtained by averaging the speed of
individual vehicles that passed through the area in a given unit interval of time. Figure 7 shows the average
vehicle speed and traffic volume in 1-hour time intervals (note that the 1-hr interval has been used for ease
of plotting, but in the regression analysis 30-minute intervals were used). Figure 7(a) shows that the average
traffic speed is at the lowest at noon, and then slow again at 6pm. Also, a decrease in average afternoon speed
is observed after adding PLZs and implementing the geofence. However, as can be seen in Figure 7(b), traffic
volume also increased over this period. The highest average volumes were recorded at 8-9am, with another
peak at 5pm.
(b)
Figure 7: (a) Average vehicle speed (miles/hour) by hour of day (b) Average traffic volume
(number of vehicles) by hour of day
(a)

22CURB ALLOCATION CHANGE PROJECT
4.1.2 Results
The detailed parameter estimates of the regression analysis performed using the data described above is
reported in Appendix D, and a summary of the results is as follows:
• Added PLZs (Phase 2) alone did not have a statistically significant effect on average traffic speed in
either of the model formulations.
• Added PLZs and geofencing (Phase 3) had a statistically significant positive effect on traffic speed in
three of the model formulations. In the selected model formulation, we observed that in Phase 1,
adding 10 passenger drop-off events per half an hour decreased average traffic speed by 11.3%; while
adding the same number of passenger drop-off events decreased average traffic speed only by 6.8% in
Phase 3.
• When modelling the Northbound and Southbound traffic separately, it was found that there is a
statistically significant positive effect of adding PLZs and geofencing for the Northbound traffic, but the
effect is not statistically significant for the Southbound traffic.
4.2 TNC Demand and Operation
4.2.1 Passenger Pick-ups/Drop-offs versus Total Traffic Volume
Figure 8 shows average percentage of passenger pick-ups/drop-offs versus traffic volume in 30-minute
intervals for each phase of data collection. According to this figure, passenger pick-ups/drop-offs (PUDO)
constitute 25%-55% of traffic volume on the studied block-faces, and increased between from an average of
29% (8.7 PUDO out of 30.2 vehicles) in Phase 1 to 32% (11.0 PUDO out of 34.3 vehicles) and 39% (13.9 PUDO
out of 35.4 vehicles) in Phases 2 and 3, respectively. The standard deviation of the percentage of passenger
pick-ups/drop-offs throughout the day also increased from 1.3% in Phase 1 to 3.5% and 7.6% in Phases 2 and
3, respectively. The implementation of geofencing may have drawn PUDO activity to the study area and off of
nearby arterial streets during Phase 3.

23CURB ALLOCATION CHANGE PROJECT
Figure 8: Passenger pick-ups/drop-offs as percentage of traffic volume (in 30-minute intervals) for all
three block-faces and both directions

24CURB ALLOCATION CHANGE PROJECT
4.2.2 Vehicle Dwell Time
One of the research questions in this study is the extent to which vehicle dwell time changed after more
PLZs were added and geofencing was implemented. The following subsections report the dwell time analysis
results with respect to TNC vehicle operation, event location and number of passengers across different
phases of study.
4.2.2.1 DWELL TIME ANALYSIS IN TERMS OF PICK-UPS AND DROP-OFFS
Figure 9 shows the cumulative distribution functions (CDF) of vehicle dwell times for pick-up and drop-off
events separately. As can be seen, the drop-offs happened faster (which is not surprising), such that half of the
drop-offs lasted 11 seconds or less, and 90% were under 1 minute and 12 seconds. For pick-ups, on the other
hand, half of them were under 35 seconds and 90% of them were under 4 minutes and 41 seconds. Based on
a Kolmogorov-Smirnov test, the difference between the two distributions was statistically significant at 0.1%
significance level.
4.2.2.2 DWELL TIME ANALYSIS FOR EVENT LOCATIONS
Investigating the dwell times based on the location of events (Figure 10) showed that passenger pick-ups or
drop-offs were the fastest when they took place in the travel lane, and then half way between street and the
curb, versus at the curb. The median dwell times for events happening in the travel lane, half-and-half, and at
curb were respectively 14, 20 and 33 seconds.
Figure 9: Empirical dwell time distributions of passenger pick-up and drop-off events across all three phases
(all three block-faces and both directions)

25CURB ALLOCATION CHANGE PROJECT
90% of the pick-ups/drop-offs occurring in the travel lane took less than 41 seconds, while the corresponding
value for those happening somewhere between street and curb (half-and-half) and at the curb were 1 minute
and 34 seconds, and 4 minute and 35 seconds, respectively. Based on a pairwise Kolmogorov-Smirnov test
and a 3-sample Anderson-Darling test, the difference between dwell time distributions were statistically
significant at less than 0.1% significance level.
4.2.2.3 DWELL TIME ANALYSIS FOR DIFFERENT PHASES OF STUDY
Figure 11 shows dwell time distributions of passenger pick-ups at curb for the three phases of study. As can
be seen, passenger pick-ups on the curb were faster in Phase 3 (when added PLZs and geofencing were in
place) than in Phase s 1 and 2. Based on a pairwise Kolmogorov-Smirnov test and 3-sample Anderson-Darling
test, the difference between Phase 3 and the other two phases are statistically significant at a less than 1.5%
significance level. Additional analyses on dwell times of passenger pick-ups per event location and study
phase can be found in Appendix E.
Similar to pick-ups, drop-offs were faster in Phase 3 than in Phase s 1 and 2 (Figure 12). The difference
between drop-off dwell time distributions in Phase 2 and 3 was statistically significant at a less than 2% level
based on a pairwise Kolmogorov-Smirnov test and 3-sample Anderson-Darling test. In Phase 3, 90% of drop-
off dwell time distribution were under 1 minute 12 seconds, and the dwell time value for the same proportion
for Phase 2 was 1 minute 54 seconds.
Figure 10: Empirical dwell time distributions of passenger pick-up and drop-off events for different event
locations across all three phases (all three block-faces and both directions)

26CURB ALLOCATION CHANGE PROJECT
Figure 11: Empirical dwell time distributions of passenger pick-ups at curb for the three phases of study (all
three block-faces and both directions)
Figure 12: Empirical dwell time distributions of passenger drop-offs at curb for the three phases of study (all
three block-faces and both directions)
27CURB ALLOCATION CHANGE PROJECT
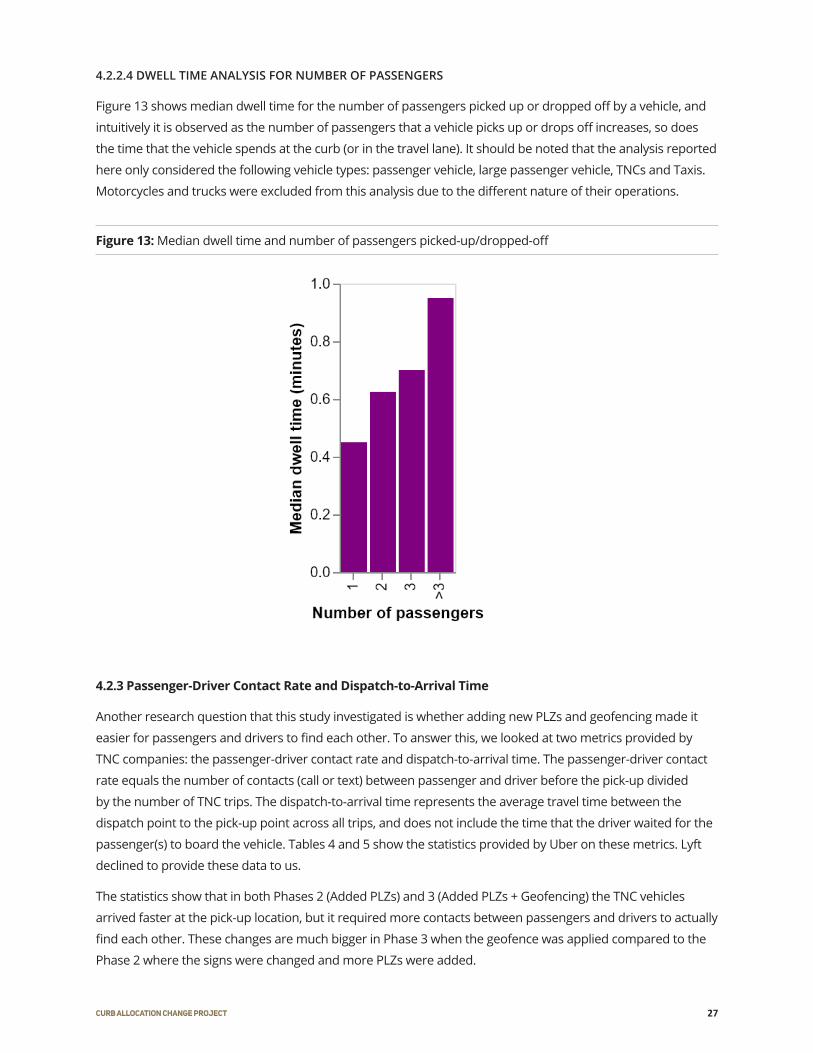
4.2.2.4 DWELL TIME ANALYSIS FOR NUMBER OF PASSENGERS
Figure 13 shows median dwell time for the number of passengers picked up or dropped off by a vehicle, and
intuitively it is observed as the number of passengers that a vehicle picks up or drops off increases, so does
the time that the vehicle spends at the curb (or in the travel lane). It should be noted that the analysis reported
here only considered the following vehicle types: passenger vehicle, large passenger vehicle, TNCs and Taxis.
Motorcycles and trucks were excluded from this analysis due to the different nature of their operations.
4.2.3 Passenger-Driver Contact Rate and Dispatch-to-Arrival Time
Another research question that this study investigated is whether adding new PLZs and geofencing made it
easier for passengers and drivers to find each other. To answer this, we looked at two metrics provided by
TNC companies: the passenger-driver contact rate and dispatch-to-arrival time. The passenger-driver contact
rate equals the number of contacts (call or text) between passenger and driver before the pick-up divided
by the number of TNC trips. The dispatch-to-arrival time represents the average travel time between the
dispatch point to the pick-up point across all trips, and does not include the time that the driver waited for the
passenger(s) to board the vehicle. Tables 4 and 5 show the statistics provided by Uber on these metrics. Lyft
declined to provide these data to us.
The statistics show that in both Phases 2 (Added PLZs) and 3 (Added PLZs + Geofencing) the TNC vehicles
arrived faster at the pick-up location, but it required more contacts between passengers and drivers to actually
find each other. These changes are much bigger in Phase 3 when the geofence was applied compared to the
Phase 2 where the signs were changed and more PLZs were added.
Figure 13: Median dwell time and number of passengers picked-up/dropped-off

28CURB ALLOCATION CHANGE PROJECT
The faster arrival times may be explained by more PLZs being available in Phases 2 and 3, which could have
made it easier for the drivers to find an appropriate location to stop. The dispatch-to-arrival times were even
shorter in Phase 3, as the geofence directed the drivers to designated pick-up points. On the passenger side,
however, it could have caused some confusion as passengers were used to getting picked-up at the point
where they requested, while in Phases 2 and 3 (especially in Phase 3) they had to walk a few feet up or down
the block to find their driver and board the vehicle. This would create the need for the passenger and/or the
driver to make more contacts with each other.
CHANGE PERIOD CHANGE PERCENTAGE
Baseline to Phase 2 1.92%
Phase 2 to Phase 3 4.70%
Baseline to Phase 3 6.71%
CHANGE PERIOD CHANGE PERCENTAGE
Baseline to Phase 2 -1.47%
Phase 2 to Phase 3 -7.65%
Baseline to Phase 3 -9.01%
Table 4: Passenger-driver contact rate changes (source: Uber)
Table 5: Dispatch-to-arrival time changes (source: Uber)
4.3 Curb Use Changes
4.3.1 Compliance
One of the established research questions in this study was whether adding new PLZs and implementing
geofencing increased compliant pick-up/drop-off behaviors in terms of using curb space versus stopping in
the travel lane. Compliance in passenger pick-up/drop-off behaviors was studied by grouping pick-up/drop-
off locations into in-lane authorized curb (curb or half-and-half in a PLZ), and un-authorized curb (curb or
half-and-half at curbs with an allocation other than a PLZ, such as paid parking). Figures 14 and 15 show the
compliance in pick-up and drop-off behaviors respectively.

29CURB ALLOCATION CHANGE PROJECT
As can be seen by comparing Figures 14 and 15, compliance in stop location choice for pick-ups looked
similar to that for drop-offs. In both cases, the percent of un-authorized stops at the curb significantly drops
in Phase s 2 and 3 compared to Phase 1. When considering the cause of this change, however, it should be
noted that in Phases 2 and 3 the available PLZ spaces were about 13 times more than in Phase 1 (274 ft in
Phases 2 and 3 versus 20 ft in Phase 1).
However, the percent of in-lane stops have also decreased in Phases 2 and 3 compared to Phase 1, and
according to the chi-square test, these differences are significant for both pick-up and drop-off operations
(See Appendix F).
Figure 14: Compliance in pick-up behaviors
Figure 15: Compliance in drop-off behaviors
30CURB ALLOCATION CHANGE PROJECT
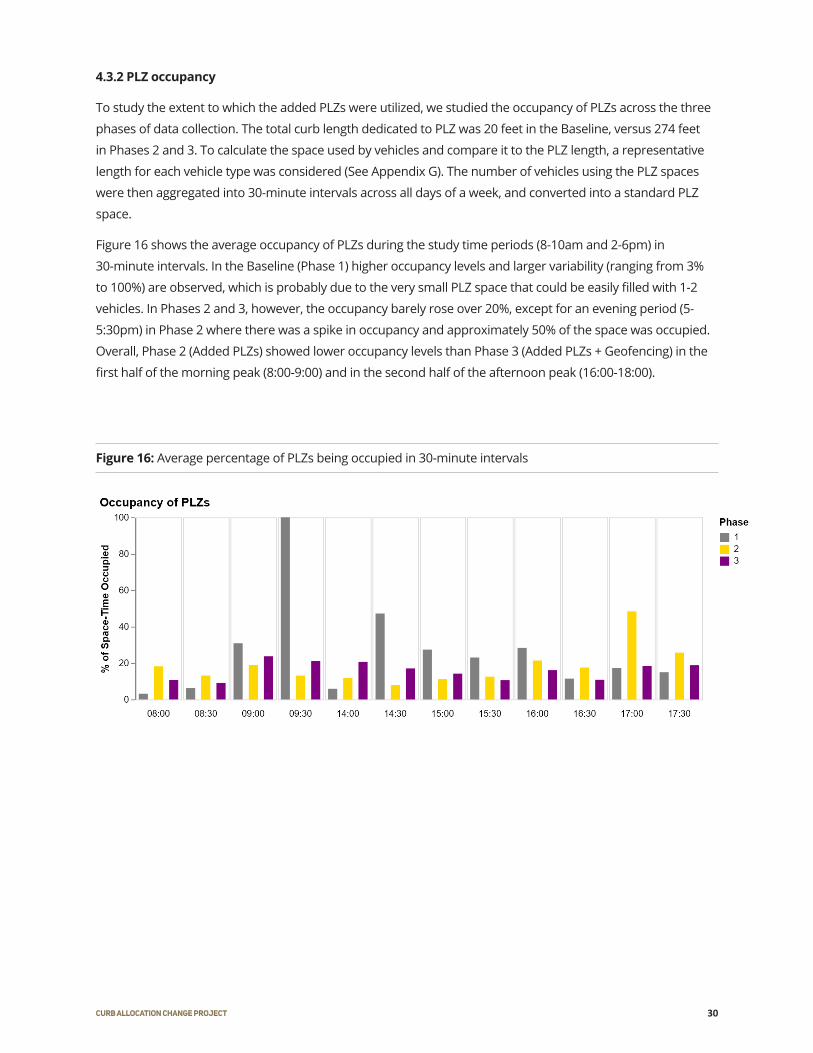
4.3.2 PLZ occupancy
To study the extent to which the added PLZs were utilized, we studied the occupancy of PLZs across the three
phases of data collection. The total curb length dedicated to PLZ was 20 feet in the Baseline, versus 274 feet
in Phases 2 and 3. To calculate the space used by vehicles and compare it to the PLZ length, a representative
length for each vehicle type was considered (See Appendix G). The number of vehicles using the PLZ spaces
were then aggregated into 30-minute intervals across all days of a week, and converted into a standard PLZ
space.
Figure 16 shows the average occupancy of PLZs during the study time periods (8-10am and 2-6pm) in
30-minute intervals. In the Baseline (Phase 1) higher occupancy levels and larger variability (ranging from 3%
to 100%) are observed, which is probably due to the very small PLZ space that could be easily filled with 1-2
vehicles. In Phases 2 and 3, however, the occupancy barely rose over 20%, except for an evening period (5-
5:30pm) in Phase 2 where there was a spike in occupancy and approximately 50% of the space was occupied.
Overall, Phase 2 (Added PLZs) showed lower occupancy levels than Phase 3 (Added PLZs + Geofencing) in the
first half of the morning peak (8:00-9:00) and in the second half of the afternoon peak (16:00-18:00).
Figure 16: Average percentage of PLZs being occupied in 30-minute intervals

31CURB ALLOCATION CHANGE PROJECT
4.3.3 Vehicle Productivity at PLZs
Another measure for studying curb utilization is vehicle productivity at PLZs, which is defined as the
number of individuals served by a vehicle per unit of curb space and per unit of time. For instance, a 15-
foot long passenger vehicle that takes 30 seconds to unload one passenger would have a productivity of
((1/15/0.5)*60=) 8 passengers/foot-hour.
To calculate the vehicle productivity, we excluded motorcycles and trucks, and only considered large and
regular passenger vehicles, TNC vehicles and taxis. To be consistent with passenger pick-up/drop-off
operations in counting the individuals served by a vehicle, the number of individuals served by the vehicles
that parked or un-parked (ended parking and left the curb space) at a curb were multiplied by two, because
these vehicles first unload and then load the individuals.
Figure 17 shows the average productivity of vehicles stopping at PLZs to load/unload individuals by time of
day across the study phases. As can be seen, in both morning and afternoon periods, the vehicle productivity
increased from Phase 1 to Phase 3, with the difference that in the morning, the vehicle productivity also
increased from Phase 2 to Phase 3, while in the afternoon no change was observed between phases 2 and 3.
Figure 17: Vehicle Productivity at PLZs by phase and time of day
32CURB ALLOCATION CHANGE PROJECT
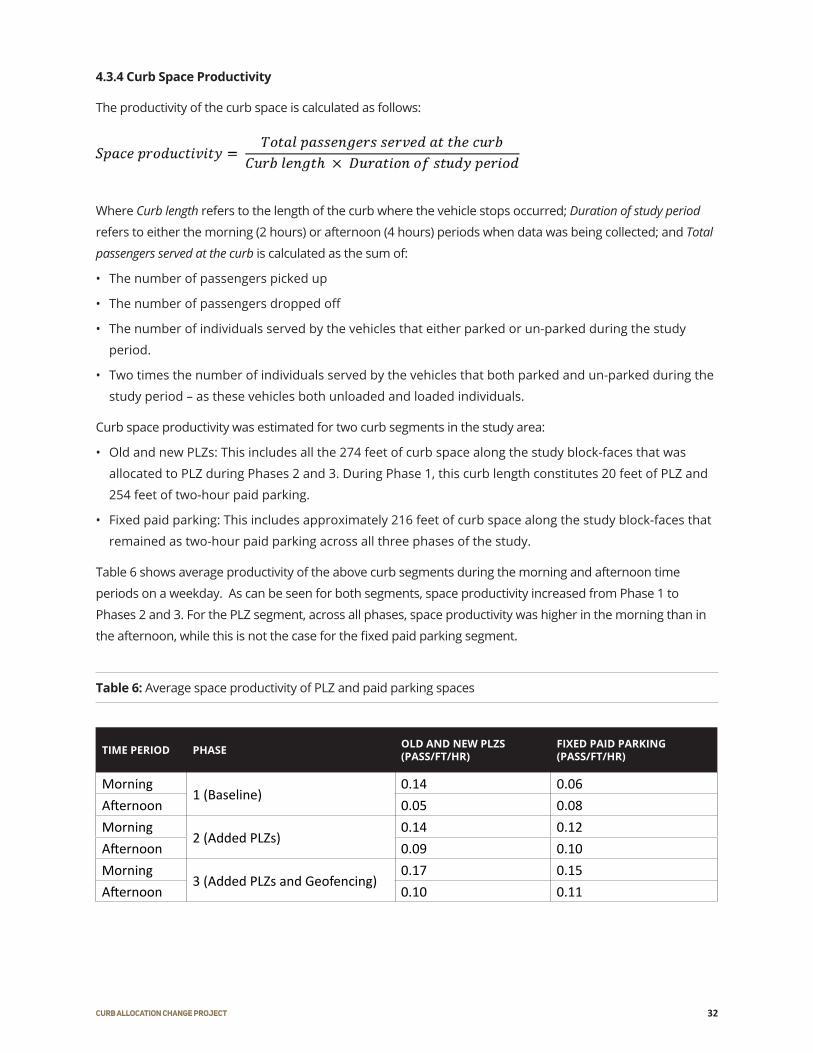
4.3.4 Curb Space Productivity
The productivity of the curb space is calculated as follows:
Where Curb length refers to the length of the curb where the vehicle stops occurred; Duration of study period
refers to either the morning (2 hours) or afternoon (4 hours) periods when data was being collected; and Total
passengers served at the curb is calculated as the sum of:
• The number of passengers picked up
• The number of passengers dropped off
• The number of individuals served by the vehicles that either parked or un-parked during the study
period.
• Two times the number of individuals served by the vehicles that both parked and un-parked during the
study period – as these vehicles both unloaded and loaded individuals.
Curb space productivity was estimated for two curb segments in the study area:
• Old and new PLZs: This includes all the 274 feet of curb space along the study block-faces that was
allocated to PLZ during Phases 2 and 3. During Phase 1, this curb length constitutes 20 feet of PLZ and
254 feet of two-hour paid parking.
• Fixed paid parking: This includes approximately 216 feet of curb space along the study block-faces that
remained as two-hour paid parking across all three phases of the study.
Table 6 shows average productivity of the above curb segments during the morning and afternoon time
periods on a weekday. As can be seen for both segments, space productivity increased from Phase 1 to
Phases 2 and 3. For the PLZ segment, across all phases, space productivity was higher in the morning than in
the afternoon, while this is not the case for the fixed paid parking segment.
TIME PERIOD PHASE OLD AND NEW PLZS (PASS/FT/HR)
FIXED PAID PARKING (PASS/FT/HR)
Morning1 (Baseline)
0.14 0.06Afternoon 0.05 0.08Morning
2 (Added PLZs)0.14 0.12
Afternoon 0.09 0.10Morning
3 (Added PLZs and Geofencing)0.17 0.15
Afternoon 0.10 0.11
Table 6: Average space productivity of PLZ and paid parking spaces
33CURB ALLOCATION CHANGE PROJECT
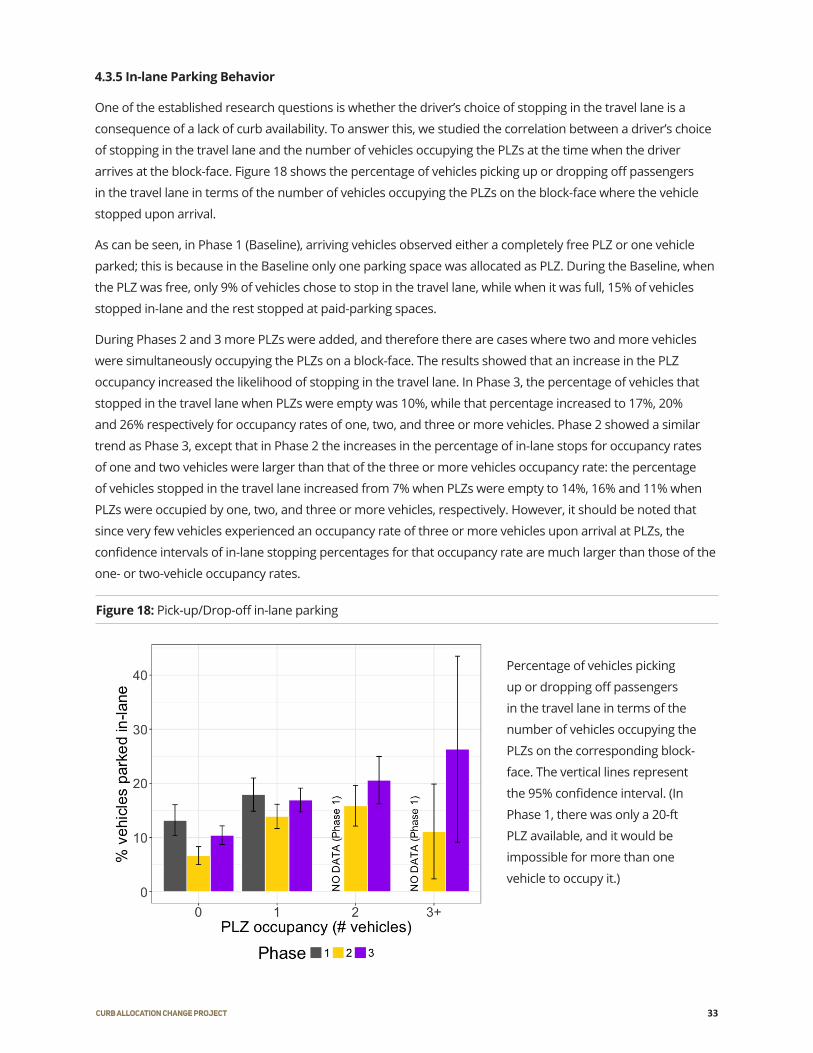
4.3.5 In-lane Parking Behavior
One of the established research questions is whether the driver’s choice of stopping in the travel lane is a
consequence of a lack of curb availability. To answer this, we studied the correlation between a driver’s choice
of stopping in the travel lane and the number of vehicles occupying the PLZs at the time when the driver
arrives at the block-face. Figure 18 shows the percentage of vehicles picking up or dropping off passengers
in the travel lane in terms of the number of vehicles occupying the PLZs on the block-face where the vehicle
stopped upon arrival.
As can be seen, in Phase 1 (Baseline), arriving vehicles observed either a completely free PLZ or one vehicle
parked; this is because in the Baseline only one parking space was allocated as PLZ. During the Baseline, when
the PLZ was free, only 9% of vehicles chose to stop in the travel lane, while when it was full, 15% of vehicles
stopped in-lane and the rest stopped at paid-parking spaces.
During Phases 2 and 3 more PLZs were added, and therefore there are cases where two and more vehicles
were simultaneously occupying the PLZs on a block-face. The results showed that an increase in the PLZ
occupancy increased the likelihood of stopping in the travel lane. In Phase 3, the percentage of vehicles that
stopped in the travel lane when PLZs were empty was 10%, while that percentage increased to 17%, 20%
and 26% respectively for occupancy rates of one, two, and three or more vehicles. Phase 2 showed a similar
trend as Phase 3, except that in Phase 2 the increases in the percentage of in-lane stops for occupancy rates
of one and two vehicles were larger than that of the three or more vehicles occupancy rate: the percentage
of vehicles stopped in the travel lane increased from 7% when PLZs were empty to 14%, 16% and 11% when
PLZs were occupied by one, two, and three or more vehicles, respectively. However, it should be noted that
since very few vehicles experienced an occupancy rate of three or more vehicles upon arrival at PLZs, the
confidence intervals of in-lane stopping percentages for that occupancy rate are much larger than those of the
one- or two-vehicle occupancy rates.
Figure 18: Pick-up/Drop-off in-lane parking
Percentage of vehicles picking
up or dropping off passengers
in the travel lane in terms of the
number of vehicles occupying the
PLZs on the corresponding block-
face. The vertical lines represent
the 95% confidence interval. (In
Phase 1, there was only a 20-ft
PLZ available, and it would be
impossible for more than one
vehicle to occupy it.)

34CURB ALLOCATION CHANGE PROJECT
In general, in the study area, vehicles arriving to pick up or drop off passengers rarely experienced high
occupancy rates of the PLZs; however, in almost all cases, an increase in the PLZ occupancy increased the
likelihood of stopping in-lane. It is also worth noting that in all phases, 7-10% of the arriving vehicles still chose
to stop in the travel lane even when no vehicle was occupying the PLZ spaces.
4.4 Safety Impacts
4.4.1 Conflicts
To investigate the impacts of changes on traffic safety in the study area, we studied the number of conflicts
before and after the changes. Conflicts are defined as a situation where a user of the road (vehicle, bike, or
pedestrian) is interrupted, forced to alter path, or gets engaged in a near-dangerous situation. We defined
conflict categories as vehicle-vehicle, vehicle-bike, vehicle-pedestrian, and pass through the oncoming traffic lane.
Figure 19 shows the average number of conflicts divided by the total number of passenger pick-up and drop-off
events (Figure 19(a)) and by the total traffic volume (Figure 19(b)) in the morning and afternoon periods. And as
can be seen, the changes in conflict rates across the three phases of study were not statistically significant.
We also modeled the passenger pick-up/drop-off events as a series of Bernoulli trials, in which each event
outcome can be a “conflict” or “no conflict”. A binomial regression of the probability of an event resulting in a
conflict was then derived as a function of several explanatory variables, including total traffic volume, number of
pick-up events, number of drop-offs and a set of indicator variables for adding PLZs and geofencing. The results
showed no statistically significant effect of the adding PLZs and geofencing on the probability of a pick-up/
drop-off event being a conflict. The regression parameters estimates are reported in Appendix H.
Figure 19: (a) Proportion of conflicts with respect to passenger pick-up/drop-off events; (b) Proportion of
conflicts with respect to total traffic volume
(a) (b)

35CURB ALLOCATION CHANGE PROJECT
4.5 Passenger Experience
One of the main research questions in the present study was how the TNC passengers responded to the
changes of adding PLZs and implementing geofences. To answer this, we conducted a passenger survey as
explained in section 3.4. The survey response rate was relatively high, with 19% for Phase 1 and 24% for Phase
3 (Table 7).
Table 7: Response Rate
PHASE ACTIVITY NUMBER OF CARDS GIVEN
NUMBER OF COMPLETED SURVEYS RESPONSE RATE
1 Pick-up 170 33 19% 19%
Drop-off 107 19 18%
3 Pick-up 118 28 24% 24%
Drop-off 146 36 25%
Figures 20 and 21 show travelers’ satisfaction statistics respectively for pick-ups and drop-offs. As can be seen
by comparing Figures 20 and 21, travelers satisfaction with pick-up and drop-off has increased following the
curb reallocation and geofence implementation. Although 1 person ranked her pick-up experience as “Awful”
in Phase 3, 79% of passengers rated their pick-up experience between “Excellent” and “Good” in Phase 3;
whereas the corresponding number for Phase 1 is 72%. This difference is even larger for drop-offs, with all
passengers rating their drop-off experience in Phase 3 at least “Good”, and 97% rating it either “Excellent”
or “Very Good”; whereas in Phase 1, 89% of customers rated their experience at least “Good”. It is worth to
mention that the rating scale was the same for pick-ups and drop-offs.
An ordinal logistic regression model was also applied to the survey data to test the significance of changes in
Phase 3 versus the Baseline. The model results are presented in Appendix I, and confirm that the added PLZs
and geofencing significantly contributed to passenger satisfaction level.
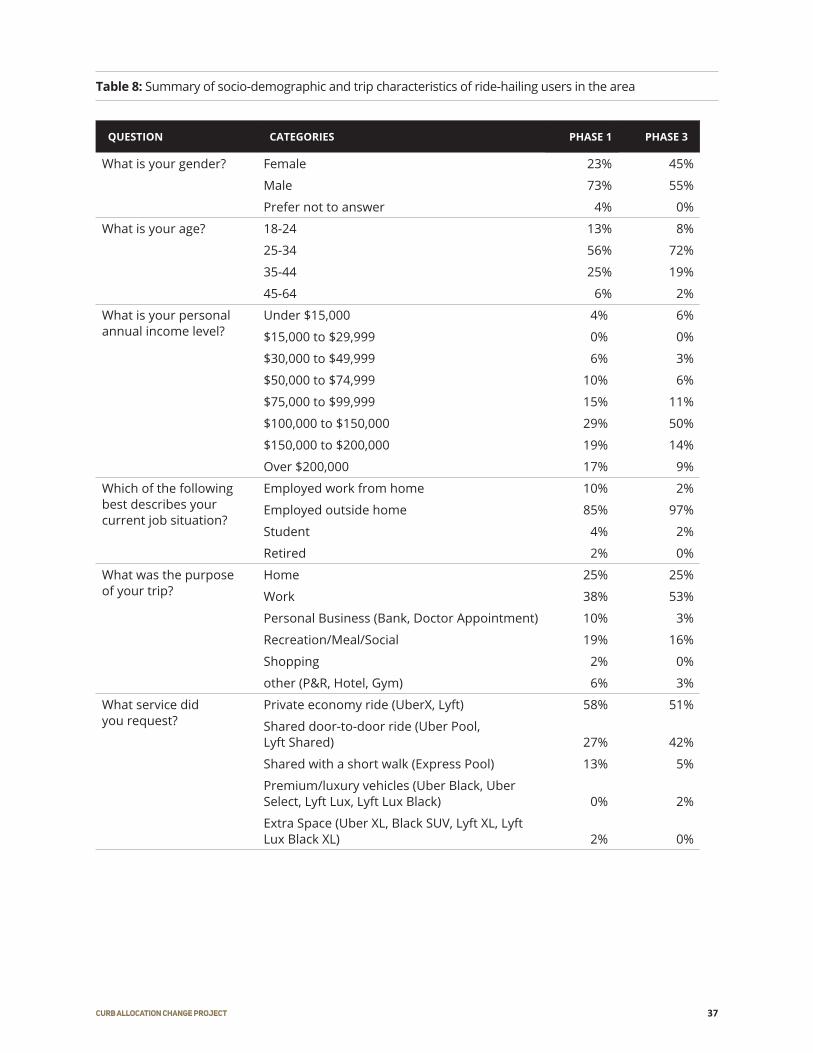
Table 8 presents a summary of the socio-demographic and trip characteristics of ride-hailing users in the area.
As can be seen the sample skews toward male, young (25-34), higher-income individuals (65% or more of the
respondents reported an individual annual income of $100K). About 40-50% of our sample reported making a
work-related trip, and more than half of the sample were frequent ride-hailing users (defined as using ride-
hailing services at least once a week). In both phases, more than half of the respondents reported having used
a private economy ride (e.g. UberX, Lyft) and 70% or more took ride-hailing services all the way from origin to
destination on their trip. Among those who used ride-hailing in connection with another transportation mode
for their trip, a majority reported linking with public transit (bus, light rail, trolley). Nearly half the respondents
stated that they would have taken public transit if ride-hailing were not available, and about one-third said
they would have walked.

36CURB ALLOCATION CHANGE PROJECT
Figure 20: Passenger Satisfaction for Pick-up Behaviors (N=60)
Figure 21: Passenger Satisfaction for Drop-off Behaviors (N=55). There were no poor or awful ratings.
37CURB ALLOCATION CHANGE PROJECT
Table 8: Summary of socio-demographic and trip characteristics of ride-hailing users in the area
QUESTION CATEGORIES PHASE 1 PHASE 3
What is your gender? Female 23% 45%
Male 73% 55%
Prefer not to answer 4% 0%
What is your age? 18-24 13% 8%
25-34 56% 72%
35-44 25% 19%
45-64 6% 2%
What is your personal annual income level?
Under $15,000 4% 6%
$15,000 to $29,999 0% 0%
$30,000 to $49,999 6% 3%
$50,000 to $74,999 10% 6%
$75,000 to $99,999 15% 11%
$100,000 to $150,000 29% 50%
$150,000 to $200,000 19% 14%
Over $200,000 17% 9%
Which of the following best describes your current job situation?
Employed work from home 10% 2%
Employed outside home 85% 97%
Student 4% 2%
Retired 2% 0%
What was the purpose of your trip?
Home 25% 25%
Work 38% 53%
Personal Business (Bank, Doctor Appointment) 10% 3%
Recreation/Meal/Social 19% 16%
Shopping 2% 0%
other (P&R, Hotel, Gym) 6% 3%
What service did you request?
Private economy ride (UberX, Lyft) 58% 51%
Shared door-to-door ride (Uber Pool, Lyft Shared) 27% 42%
Shared with a short walk (Express Pool) 13% 5%
Premium/luxury vehicles (Uber Black, Uber Select, Lyft Lux, Lyft Lux Black) 0% 2%
Extra Space (Uber XL, Black SUV, Lyft XL, Lyft Lux Black XL) 2% 0%

38CURB ALLOCATION CHANGE PROJECT
Table 8: continued
QUESTION CATEGORIES PHASE 1 PHASE 3
If you didn’t use ride-hailing (e.g. Uber or Lyft) all the way from your origin to destination on this trip, what was the other mode of transportation that you used?
(This was a two-part question.)
Just Ride-hailing 77% 69%
Bike 2% 2%
Drive personal car 6% 5%
Car-share 2% 3%
Picked up/Dropped off (by a friend or family member)
2% 3%
Public Transit (Bus, Link, Streetcar) 12% 19%
How would you have made this trip if ride-hailing (e.g. Uber or Lyft) were not available?
Walk 29% 36%
Bike 4% 2%
Drive personal car 10% 8%
Car share 8% 6%
Picked up/Dropped off (by a friend or family member)
2% 3%
Public Transit (Bus, Link, Streetcar) 48% 45%
How often do you generally use ride-hailing services (e.g. Uber or Lyft)?
Daily 13% 23%
A few times a week 27% 42%
Weekly 13% 8%
A few times a month 33% 22%
Monthly 4% 2%
Less than once a month 10% 3%

39CURB ALLOCATION CHANGE PROJECT
5
Discussion of Site-Specific Characteristics

40CURB ALLOCATION CHANGE PROJECT
5 DISCUSSION OF SITE-SPECIFIC CHARACTERISTICS This section highlights additional site-specific characteristics that we feel are important to note as they will be
relevant to traffic in the neighborhood.
5.1 Street Design
Below is a list of street design related items that are noteworthy about the study area.
• Slow speed limits - The speed limit on the study blocks was 25 mph and there were stop signs at all
intersections.
• Numerous construction sites - There were numerous construction activities going on in the close
proximity of the study area. A list of construction activities is provided in Appendix J.
• Lack of lighting - The data collection was done in months of December and January, when days are very
short in Seattle and it gets dark after 4pm. The study blocks were also not very well lit.
• Less formal infrastructure - Some of the curbs were semi-permanent (hand-formed asphalt as opposed
to formed concrete) and also lacked appropriate street paint. On Boren Ave N between Thomas and
Harrison streets, there was no crosswalk between the Amazon buildings on two sides of the street,
however, there were curb bulbs reducing the crossing distance (Figure 22) and pedestrians were
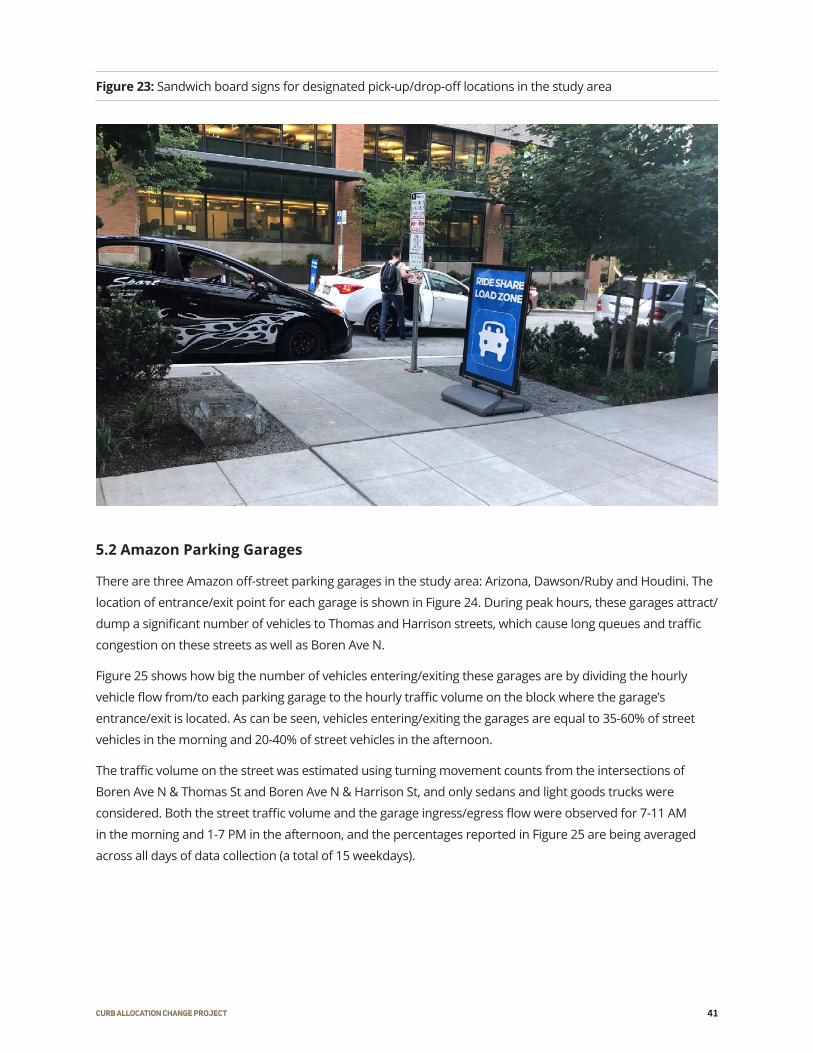
crossing the street frequently. In addition to the signs installed by SDOT, Amazon placed sandwich
board signs for designated pick-up/drop-off locations on sidewalks (Figure 23), and although these
signs helped increase the visibility of designated locations, their sandwich board structure implied a
temporary situation. These create a sense of less formality for the neighborhood infrastructure in the
study area.
Figure 22: Curb bulbs and reduced crossing distance in the area between the Amazon buildings on two
sides of Boren Ave N between Thomas and Harrison streets
41CURB ALLOCATION CHANGE PROJECT
5.2 Amazon Parking Garages
There are three Amazon off-street parking garages in the study area: Arizona, Dawson/Ruby and Houdini. The
location of entrance/exit point for each garage is shown in Figure 24. During peak hours, these garages attract/
dump a significant number of vehicles to Thomas and Harrison streets, which cause long queues and traffic
congestion on these streets as well as Boren Ave N.
Figure 25 shows how big the number of vehicles entering/exiting these garages are by dividing the hourly
vehicle flow from/to each parking garage to the hourly traffic volume on the block where the garage’s
entrance/exit is located. As can be seen, vehicles entering/exiting the garages are equal to 35-60% of street
vehicles in the morning and 20-40% of street vehicles in the afternoon.
The traffic volume on the street was estimated using turning movement counts from the intersections of
Boren Ave N & Thomas St and Boren Ave N & Harrison St, and only sedans and light goods trucks were
considered. Both the street traffic volume and the garage ingress/egress flow were observed for 7-11 AM
in the morning and 1-7 PM in the afternoon, and the percentages reported in Figure 25 are being averaged
across all days of data collection (a total of 15 weekdays).
Figure 23: Sandwich board signs for designated pick-up/drop-off locations in the study area

42CURB ALLOCATION CHANGE PROJECT
Figure 24: Approximate locations of Amazon parking garages entry/exit points in the study area
Figure 25: Off-Street parking garage egress and ingress vehicle flow as percentage of street volume
across all phases

43CURB ALLOCATION CHANGE PROJECT
5.3 High Levels of Unorganized Pedestrian Activity
Pedestrian-vehicle interactions affect traffic operations. We observed high levels of pedestrian activity in the
study area, and high pedestrian volumes (400-500 per hour) crossing the street at points where there was
no crosswalk.
Figure 26: Distribution of pedestrians crossing street at non-crosswalk locations in the study area
Figure 27: Crossing behavior of passengers being picked up or dropped off at the study blocks

44CURB ALLOCATION CHANGE PROJECT
A closer look at the pedestrian activity showed that only 5-7% of those pedestrians were picked up or dropped
off by a vehicle (Figure 26). Moreover, an analysis of crossing behaviors for those who were being picked up or
dropped off showed that 30-40% of them crossed the street at non-crosswalk locations, as part of the pick-up/
drop-off operation (Figure 27).
5.4 Regional Traffic Congestion on Arterials
Figure 28 compares the average vehicle speed profiles for arterials in the proximity of the study area across
different study phases. The study area (Boren Ave N) shows a similar speed profile to Denny Way and Mercer
Street, which are major arterials (2 and 3 lanes per direction, respectively) with access to the Interstate 5
highway, and perpendicularly intersect with Boren Ave. During the study, we observed these arterials getting
very congested during the afternoon peak with spillbacks going onto Boren Ave and sometime causing the
queue of vehicles extending up to two blocks south of Mercer St or north of Denny Way, which in turn resulted
in deterioration in rule-following and some dangerous driving behavior. The corresponding speed graphs
(Figures 28(a), 28(b) and 28(c)) also indicate lower speeds during peak hours and higher speeds during off-
peak hours, showing signs of congestion and possible spillbacks from these congested arterials to Boren Ave.
The speed profiles of Westlake Ave N, Fairview Ave N and 9th Ave N are similar to each other and different
from that of the study area, with generally lower speeds and less variation across time of day. These three
arterials are parallel to Boren Ave and do not intersect with the study area.

45CURB ALLOCATION CHANGE PROJECT
Figure 28: Comparison of average vehicle speed across different arterial roads nearby the study area and
across study phases.
(a) Boren Ave N
(c) Denny Way
(e) Fairview Ave N
(b) Mercer St
(d) Westlake Ave N
(f) 9th Ave N

46CURB ALLOCATION CHANGE PROJECT
6
Conclusion and Recommendations

47CURB ALLOCATION CHANGE PROJECT
6 CONCLUSION AND RECOMMENDATIONS As noted at the beginning of this report, this study focuses on a strategy to manage TNC driver stops when
picking up and dropping off passengers with the goal of improving traffic flow in the vehicle-congested and
pedestrian-heavy South Lake Union (SLU) neighborhood, home to the main campus of Amazon, the retail
company. The two-pronged strategy includes providing additional passenger loading zone (PLZ) spaces and
implementing a geofence, which directs ride-hailing drivers and passengers to designated pick-up and drop-
off spots on a block.
The aim of providing ample designated pick-up and drop-off spots along the curb was to reduce the frequency
with which TNC drivers stop in the travel lane to pick up or drop off passengers and the time they stay stopped
there. The findings show a reduction in both in-lane stops and dwell time in the wake of the expanded PLZs
and geofencing. In other words, by these measures the strategy was a success.
The study findings do not, however, show the strategy producing a significant impact on traffic safety or
roadway travel speed. This is perhaps unsurprising, given that drivers in the study area tend to drive at
relatively slow speeds anyway, navigating around high pedestrian and jaywalking volumes, and seem relatively
comfortable stopping in the middle of the street for short periods of time. Due to the nature of area traffic,
this seems to have relatively little impact on other drivers. Drivers appear to anticipate both this behavior and
the high volumes of vehicles moving onto/off the curb and into/out of driveways and alleys.
Of note is the study observation regarding the high volumes of pedestrians crossing the street at points where
there was no crosswalk (400-500 an hour on average) and passengers’ contribution to that high volume.
Passengers picked-up/dropped-off constituted a small fraction (five to seven percent) of those pedestrians,
but high rates of passengers (30 to 40 percent) cross the street at non-crosswalk locations.
The study finds that while vehicles picking-up/dropping-off passengers clearly account for a large share of traffic
volume in SLU, TNC pick-up and drop-off activity is not the primary cause of congestion. Myriad factors impact
neighborhood congestion, including high vehicle volume overall and bottlenecks moving out of the neighborhood
onto regional arterials. As researchers observed in the afternoon peak, these bottlenecks cause spillbacks onto
local streets. Amazon garages exit vehicles onto streets that then feed into these clogged arterials.
While others can learn from this analysis, this study’s findings apply to streets with comparable speed of
traffic, mix of roadway users, and street design. Roadways with much higher traffic speeds or different
geometric design could be anticipated to produce different results.
Given that research is often conducted with limited time and/or budget, we identify for recommendation
three low-cost, high-yield measures that can inform future research: passenger survey, early site visits, and
limited field observations. The research team’s site visits early in the project were instrumental in identifying
the most appropriate variables and measures as well as the means to collect them. Once the study was
underway, even a few hours of field observation proved invaluable in enriching qualitative understanding
and capturing issues (such as high volumes of unorganized pedestrian crossings) that were not as effectively
captured by other means.
Any initiative to manage the use of curbs and roads (by TNC or others) is part of a city’s broader transportation
policy framework and goals. Whether the strategy this study analyzed is recommended depends on those
goals.

48CURB ALLOCATION CHANGE PROJECT
The strategy had no observable effect on travel speeds or safety. The research team found the increased PLZ
allocation and geofencing strategy reduced dwell times, reduced the number of in-lane pick-ups/drop-offs,
increased curb-use compliance, and increased TNC user satisfaction. However, these outcomes will likely
encourage commuters to use TNC. Results of the study’s passenger survey clearly show that TNC service is
attracting passengers who would have otherwise walked or used transit. If the end goal is to reduce traffic
congestion, measures to reduce—rather than encourage—TNC and passenger car use as the predominant
mode of commuting will yield benefits.
49CURB ALLOCATION CHANGE PROJECT
APPENDIX A: CHANGES MADE BY SDOT IN THE SOUTH LAKE UNION AREA
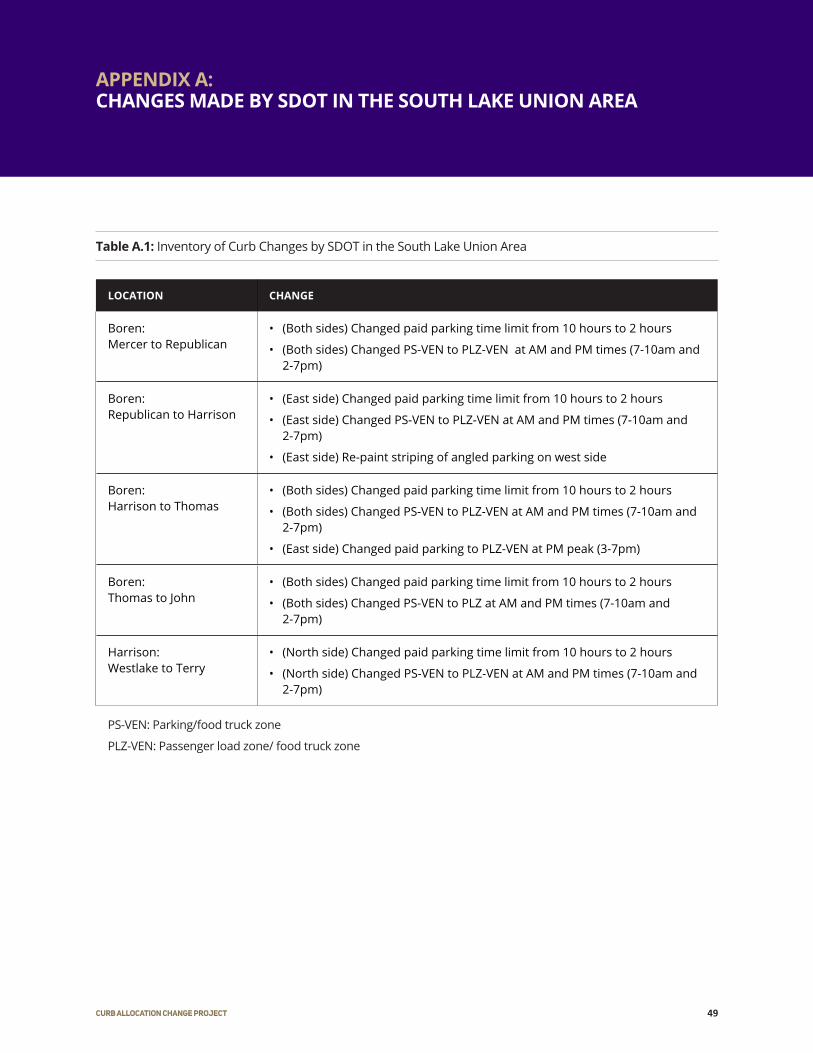
Table A.1: Inventory of Curb Changes by SDOT in the South Lake Union Area
LOCATION CHANGE
Boren: Mercer to Republican
• (Both sides) Changed paid parking time limit from 10 hours to 2 hours
• (Both sides) Changed PS-VEN to PLZ-VEN at AM and PM times (7-10am and 2-7pm)
Boren: Republican to Harrison
• (East side) Changed paid parking time limit from 10 hours to 2 hours
• (East side) Changed PS-VEN to PLZ-VEN at AM and PM times (7-10am and 2-7pm)
• (East side) Re-paint striping of angled parking on west side
Boren: Harrison to Thomas
• (Both sides) Changed paid parking time limit from 10 hours to 2 hours
• (Both sides) Changed PS-VEN to PLZ-VEN at AM and PM times (7-10am and 2-7pm)
• (East side) Changed paid parking to PLZ-VEN at PM peak (3-7pm)
Boren: Thomas to John
• (Both sides) Changed paid parking time limit from 10 hours to 2 hours
• (Both sides) Changed PS-VEN to PLZ at AM and PM times (7-10am and 2-7pm)
Harrison: Westlake to Terry
• (North side) Changed paid parking time limit from 10 hours to 2 hours
• (North side) Changed PS-VEN to PLZ-VEN at AM and PM times (7-10am and 2-7pm)
PS-VEN: Parking/food truck zone
PLZ-VEN: Passenger load zone/ food truck zone

50CURB ALLOCATION CHANGE PROJECT
Figure A.1: Detailed map of changes made by SDOT between Mercer and Republican streets

51CURB ALLOCATION CHANGE PROJECT
Figure A.2: Detailed map of changes made by SDOT between Mercer and Republican streets

52CURB ALLOCATION CHANGE PROJECT
APPENDIX B: AMAZON’S POSTER SENT OUT TO EMPLOYEES REGARDING THE DESIGNATED PICK-UP/DROP-OFF LOCATIONS

53CURB ALLOCATION CHANGE PROJECT
Ride-Hailing Use Travel SurveyUniversity of Washington
Don MacKenzie, Assistant Professor, Civil & Environmental Engineering,
[email protected], 206-685-7198
Andisheh Ranjbari, Research Associate, Civil & Environmental Engineering,
Purpose of the StudyThis survey is part of a study by University of Washington researchers to study the people’s use of ride-hailing
services (e.g. Uber and Lyft). It will take you only 5 minutes to complete the survey.
Cessation of ParticipationYour participation in this study is voluntary and you can stop participating at any time if you do not wish to
answer a question or for any other reason.
ConfidentialityWe will not collect any individual identifiable information. The study records will not be used to put you at any
legal risk of harm.
Electronic Consent Please select your choice below. Clicking on the “Agree” button below indicates that:
you understand the information above
you voluntarily agree to participate, and have not been pressured to do so
you are at least 18 years of age
If you do not wish to participate in the research study, please decline participation by clicking on the “
Disagree” button
Agree
Disagree
APPENDIX C: PASSENGER SURVEY (PICK-UP EXAMPLE)

54CURB ALLOCATION CHANGE PROJECT
Please provide the following information for your ride-hailing trip (e.g. Uber or Lyft) trip from/to South Lake Union.
1. How was your experience with the pick-up for that trip?
6 (Excellent)
5 (Very Good)
4 (Good)
3 (Okay)
2 (Poor)
1 (Awful)
2. Which ride-hailing service did you request for that trip?
Private economy ride (Uber X, Lyft)
Shared door-to-door ride (Uber Pool, Lyft Shared)
Shared with a short walk (Uber Express Pool)
Premium/luxury vehicles (Uber Select, Uber Black, Lyft Lux, Lyft Lux Black)
Extra Space (Uber XL, Black SUV, Lyft XL, Lux Black XL)
3. How many other riders were matched with? (Select NA if you requested a private ride.)
NA (I requested a private ride)
0
1
2
3
4. Where did that trip end? (Enter as city and cross streets)
City
At (Street Name) and (Street Name)
5. Where were you going on that trip?
Home
Work
Personal Business ((bank, doctor appointment, etc.)
Recreation/Meal/Social
Shopping
Other (please specify)

55CURB ALLOCATION CHANGE PROJECT
6. If you didn’t take ride-hailing (e.g. Uber or Lyft) all the way from your origin to destination, what was the other mode of transportation that you used for your trip?
Public Transit (Bus, Link, Streetcar)
Car-share
Picked up/dropped off (by a friend or a family member)
Drive your personal car
Bike
Walk
NA (It was just ride-hailing)
7. If ride-hailing (e.g. Uber or Lyft) were not available, how would have you made this trip?
Drive your personal car
Being picked up/dropped off (by a friend or a family member)
Car-share
Public Transit (Bus, Link, Streetcar)
Bike
Walk
8. How often do you generally use ride-hailing services (e.g. Uber or Lyft)?
Daily
A few times a week
Weekly
A few times a month
Monthly
Less than once a month
9. What is your age? ________
10. What is your gender?
Male
Female
Prefer not to answer

56CURB ALLOCATION CHANGE PROJECT
11. Which of the following best described your current job situation?
Employed, work outside the home
Employed, work from home
Unemployed
Student
Retired
Other (please specify) ________
12. What is your personal annual income level?
Less than $15,000
$15,000 to $29,999
$30,000 to $49,999
$50,000 to $74,999
$75,000 to $99,999
$100,000 to $150,000
$150,000 to $200,000
More than $200,000
13. How many automobiles are available for regular use in your household?
0
1
2
3
More than 3
Thank you for participating in our survey!
If you wish to be entered in a raffle drawing for an Apple Watch, please enter your contact information below.
Email (optional): ________
Phone Number (optional): ________
Thank you for your time!

57CURB ALLOCATION CHANGE PROJECT
In this section we report the details of the lognormal regression analysis of speed on traffic volume and other
variables affecting traffic flow.
Formulation The base formulation of the regression model is specified below:
where:
APPENDIX D: DETAILS ON THE FORMULATION AND ESTIMATION OF THE SPEED REGRESSION MODEL
In the above model formulation, we are particularly interested in the following parameters:
• is the effect of the number of passenger pickup and dropoff in the baseline, i.e. before the curb
reallocation and/or geofencing
• is the effect of the number of passenger pickup and dropoff after the curb changes
• is the effect of the number of passenger pickup and dropoff after the sigange and
the geofencing
average vehicle speed at time
traffic volume at
total no. of passenger pick-ups/drop-offs events at
set of indicator variables controlling for time of day
indicator variable = 1 whenever time took place when geofencing was implemented (phase 3), 0 otherwise
indicator variable = 1 whenever time took place when curb changes were implemented (Phase 2 and 3), 0 otherwise
parameters estimating the free-flow speed under different conditions
parameters estimating the effect of traffic volume and passenger pick-up and drop-off for the baseline condition
parameters estimating the change in the effect of passenger pick-up and drop-off after the curb changes and the introduction of geofencing
random error term

58CURB ALLOCATION CHANGE PROJECT
Estimation Results
For every 30 minutes, the average vehicle speed was recorded, together with total traffic volume and total
number of pick-ups and drop-offs events, during the morning and afternoon peak hours (respectively during
8-10am and 2-6pm), separately for the South Bound (SB) lane and North Bound (NB) lane of the segment
of Boren Avenue North between Harrison Street and Thomas Street. Together, the dataset contains 352
observations in total.
We used this data to estimate four different regression models, listed in Table D.1. The models differ by: (i)
whether all observations are used in the estimation, or whether only SB or NB data is used; (ii) whether the
variable is used in the model, or whether the effect of number pick-ups and drop-offs is accounted
separately in the model. In all regression models, we control for time of the day and whether it was raining
or not.
MODEL DATA USED NO. OBSERVATIONS PICK-UP/DROP-OFF
M1 All data 352 No
M2 all data 352 Yes
M3 Only SB data 176 Yes
M4 Only NB data 176 Yes
The regression parameters are estimated using Ordinary Least Square (OLS) method, while the parameter
standard error are Heteroskedasticity and Autocorrelation Consistent (HAC) robust estimates. Table D.2
reports the estimates of the coefficients, robust standard errors and p-values for the four regression models.
Table D.1: Model specification summary

59CURB ALLOCATION CHANGE PROJECT
Table D.2: Estimation results
COEFFICIENTCOEFFICIENT ESTIMATES
M1 M2 M3 (NB) M4 (SB)
2.803 ***(0.042)
2.809 ***(0.053)
2.763 ***(0.065)
2.845 ***(0.084)
-0.081 ***(0.030)
-0.073 **(0.032)
-0.044(0.046)
-0.060(0.049)
0.013(0.039)
0.006(0.044)
0.005(0.068)
0.009(0.061)
0.001(0.0004)
0.001
(0.0005)
0.0002
(0.0004)
0.001
(0.001)
-0.002 ***(0.0004)
-0.002 ***(0.0005)
-0.002 *(0.001)
-0.002 ***(0.001)
-0.011 ***(0.003)
/ / /
/ -0.011 ***(0.004)
-0.007(0.007)
-0.014 ***(0.005)
/ -0.012 ***(0.004)
-0.008 *(0.004)
-0.016 ***(0.006)
0.003(0.003)
/ / /
/ 0.004(0.004)
0.001(0.007)
0.006(0.006)
/ 0.003(0.003)
-0.001(0.004)
0.004(0.005)
0.005 ***(0.002)
/ / /
/ 0.004(0.003)
0.001(0.003)
0.002(0.005)
/ 0.005 **(0.002)
0.007 **(0.003)
0.001(0.003)
*** p-value ≤ 0.001 ; ** p-value ∈ (0.001, 0.01] ; * p-value ∈ (0.01, 0.05]
To predict the effect of the number of passenger drop-off and pick-up events on average speed we use the
following formulas:
• to estimate the percentage of change in average speed caused by
an increase in 10 passenger drop-off/pick-up events, before the system changes;
• to estimate the percentage of change in average
speed caused by an increase in 10 passenger drop-off/pick-up events, after the system changes.

60CURB ALLOCATION CHANGE PROJECT
APPENDIX E: DWELL TIME ANALYSIS FOR PASSENGER PICK-UPS FOR DIFFERENT EVENT LOCATIONS
Pick-up dwell times happening on street and half way between street and curb also showed statistically
significant differences (at a less than 5% significance level) between the three phases of study based on a
Kolmogorov-Smirnov test.
Pick-ups/Drop-offs happening half way between street and curb were slower in Phase 3 than in Phase 1.
Additionally, events happening on street were faster in Phase 2 than in Phase 1.
Figure E.1: Empirical dwell time distribution of passenger pick-ups by stop location for the three phases of
study (all three block-faces and bot h directions)

61CURB ALLOCATION CHANGE PROJECT
APPENDIX F: CHI-SQUARE TEST RESULTS FOR COMPLIANCE IN PICK-UP/DROP-OFF BEHAVIORS
The null hypothesis is that there is not a significant difference between the number of on-street versus curb
stops across the three phases. However, the p-value results from the chi-square test are very small, which
rejects the null hypothesis.
ON-STREET CURB (AUTHORIZED AND UN-AUTHORIZED)
Phase 1 134 712
Phase 2 116 919
Phase 3 192 1127
df=2, 𝝌2=9.4312, p-value=8.96E-03
ON-STREET CURB (AUTHORIZED AND UN-AUTHORIZED)
Phase 1 145 571
Phase 2 109 826
Phase 3 171 1019
df=2, 𝝌2=24.099, p-value=5.85E-06
Table E.1: Chi-square Test Results for Compliance in Pick-up Operations
Table E.2: Chi-square Test Results for Compliance in Drop-off Operations

62CURB ALLOCATION CHANGE PROJECT
APPENDIX G: VEHICLE REPRESENTATIVE LENGTH
VEHICLE TYPE REPRESENTATIVE LENGTH (FT)
REFERENCE
Passenger vehicle, TNC, and Taxi
15 Minge, E. D., Peterson, S., Weinblatt, H., Coifman, B., & Hoekman, E. (2012). Loop-and length-based vehicle classification: Federal highway administration-pooled fund program [tpf-5 (192)] (No. MN/RC 2012-33). Minnesota Department of Transportation, Research Services.
Large passenger vehicle
22 2019 Ford Transit Passenger Wagon T-350 148” EL High Roof XL Sliding RH Dr DRW Specs. URL: https://www.thecarconnection.com/specifications/ford_transit-passenger-wagon_2019_t-350-148-el-high-roof-xl-sliding-rh-dr-drw. Accessed on May 20, 2019.
Truck 30 Urban Street Design Guide (2018). National Association of City Transportation (NACTO). https://nacto.org/publication/urban-street-design-guide/design-controls/design-vehicle/. Accessed on May 20, 2019.

63CURB ALLOCATION CHANGE PROJECT
APPENDIX H: ESTIMATION RESULTS OF THE BINOMIAL REGRESSION MODEL OF THE PROBABILITY OF A PICK-UP/DROP-OFF EVENT BEING A CONFLICT
Table H.1 reports the parameter estimates, the standard error and the significance level of the estimates, for
the binomial regression model of the probability of a pick-up/drop-off event being a conflict.
COEFFICIENT ESTIMATE STD. ERROR SIGN.
Intercept -2.486 0.320 ***
Volume 0.003 0.003
Volume (opposite lane) 0.007 0.003
No. drop-off events -0.011 0.012
No. pick-up events -0.002 0.016
Rain 0.103 0.105
Added PLZs -0.003 0.130
Added PLZs+Geofencing 0.161 0.108
*** p-value ≤ 0.001 ; ** p-value ∈ (0.001, 0.01] ; * p-value ∈ (0.01, 0.05]
Table H.1: Estimation Results

64CURB ALLOCATION CHANGE PROJECT
Since satisfaction was defined as an ordered variable (in categories from Excellent to Awful), we applied an
ordinal logit model to analyze the data and test the significance of changes on passenger satisfaction (the
outcome variable).
Tables I.1 shows the results for a single-variate model, where the only predictor is study phase, and Table I.2
presents the results for a multivariate model where in addition to the study phase, other predictor variables
are also considered. As can be seen from the t-values, in both models the phase variable was significant.
APPENDIX I: RESULTS OF ORDINAL LOGIT MODEL FOR PASSENGER SATISFACTION
COEFFICIENTS: VALUE STD. ERROR T-VALUE
Phase: 3 0.6462 0.3515 1.838
INTERCEPTS: VALUE STD. ERROR T-VALUE
Aweful|Poor -4.4441 1.0104 -4.3983
Poor|Okay -2.4397 0.4202 -5.8058
Okay|Good -1.3708 0.307 -4.4651
Good|Very Good -0.7057 0.2808 -2.5133
Very Good|Excellent 0.4819 0.2776 1.7363Residual Deviance 311.818AIC 323.818Log Likelihood -155.91 (df=6)
Table I.1: Analysis results for the single-variate model

65CURB ALLOCATION CHANGE PROJECT
COEFFICIENTS: VALUE STD. ERROR T-VALUE
Pick-up 0.8901 0.6827 1.304Phase: 3 0.6954 0.3994 1.741Purpose: Work 2.5395 0.8072 3.146Purpose: PersonalBusiness -1.0555 0.7322 -1.442Purpose: Meal/Social 1.2833 0.5984 2.145Usage Frequency -0.1612 0.1407 -1.145Annual Income > $100K -0.7118 0.4812 -1.479No Mode Connection (Only RH) -1.3035 0.4971 -2.622Transfer to/from Transit 0.9767 0.7489 1.304
INTERCEPTS: VALUE STD. ERROR T-VALUE
Aweful|Poor -5.3257 1.4676 -3.6288Poor|Okay -3.1906 1.1166 -2.8574Okay|Good -1.8718 1.0495 -1.7836Good|Very Good -1.0118 1.0365 -0.9762Very Good|Excellent 0.5543 1.034 0.536Residual Deviance 266.9282AIC 294.9282Log Likelihood -133.464 (df=14)
Table I.2: Analysis results for the multi-variate model
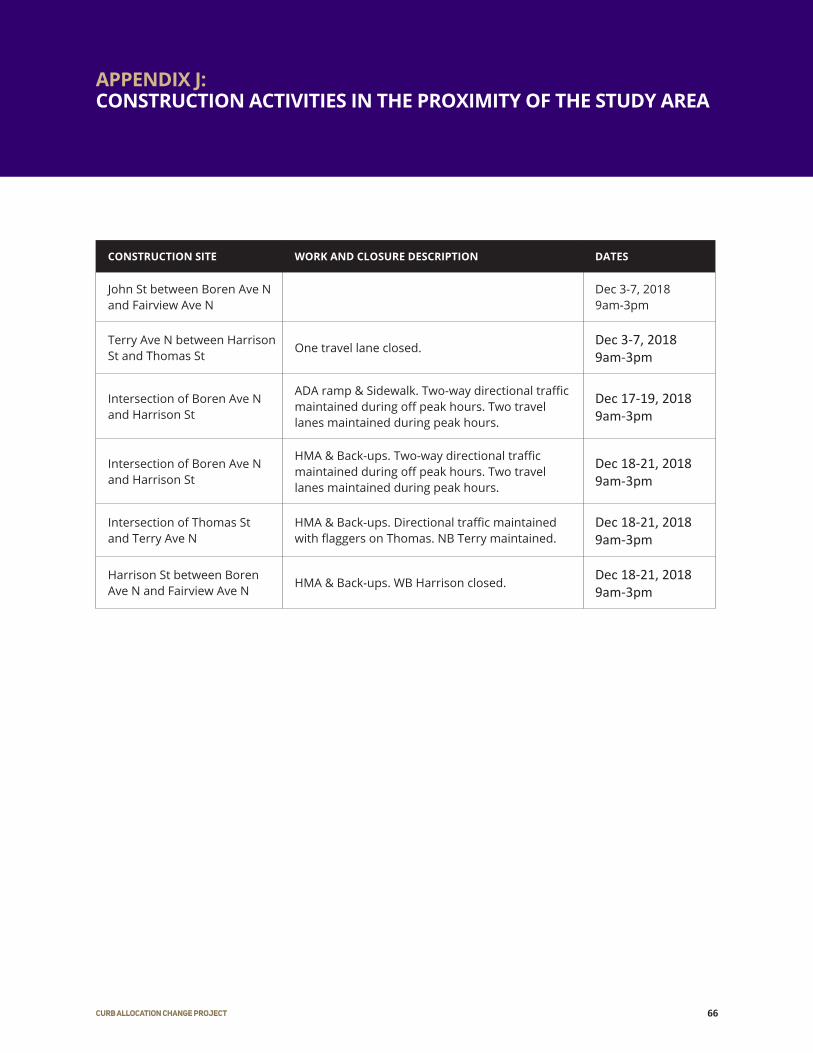
66CURB ALLOCATION CHANGE PROJECT
APPENDIX J: CONSTRUCTION ACTIVITIES IN THE PROXIMITY OF THE STUDY AREA
CONSTRUCTION SITE WORK AND CLOSURE DESCRIPTION DATES
John St between Boren Ave N and Fairview Ave N
Dec 3-7, 20189am-3pm
Terry Ave N between Harrison St and Thomas St
One travel lane closed. Dec 3-7, 20189am-3pm
Intersection of Boren Ave N and Harrison St
ADA ramp & Sidewalk. Two-way directional traffic maintained during off peak hours. Two travel lanes maintained during peak hours.
Dec 17-19, 20189am-3pm
Intersection of Boren Ave N and Harrison St
HMA & Back-ups. Two-way directional traffic maintained during off peak hours. Two travel lanes maintained during peak hours.
Dec 18-21, 20189am-3pm
Intersection of Thomas St and Terry Ave N
HMA & Back-ups. Directional traffic maintained with flaggers on Thomas. NB Terry maintained.
Dec 18-21, 20189am-3pm
Harrison St between Boren Ave N and Fairview Ave N
HMA & Back-ups. WB Harrison closed. Dec 18-21, 20189am-3pm

67CURB ALLOCATION CHANGE PROJECT

68CURB ALLOCATION CHANGE PROJECT
SCTL CENTER
UNIVERSITY OF WASHINGTON
BOX 352700
SEATTLE, WA 98195
Phone: 206.221.6407
Email: [email protected]