cultures of corruption: evidence from diplomatic parking …€¦ · · 2014-07-30cultures of...
TRANSCRIPT

Cultures of Corruption: Evidence from Diplomatic Parking Tickets*
Ray Fisman Edward Miguel
Columbia University and NBER University of California, Berkeley and NBER
First version: March 2006 This version: July 2006
Abstract: Corruption is believed to be a major factor impeding economic development, but the importance of legal enforcement versus cultural norms in controlling corruption is poorly understood. To disentangle these two factors, we exploit a natural experiment, the stationing of thousands of diplomats from around the world in New York City. Diplomatic immunity means there was essentially zero legal enforcement of diplomatic parking violations, allowing us to examine the role of cultural norms alone. This generates a revealed preference measure of government officials’ corruption based on real-world behavior taking place in the same setting. We find strong persistence in corruption norms: diplomats from high corruption countries (based on existing survey-based indices) have significantly more parking violations, and these differences persist over time. In a second main result, officials from countries that survey evidence indicates have less favorable popular views of the United States commit significantly more parking violations, providing non-laboratory evidence on sentiment in economic decision-making. Taken together, factors other than legal enforcement appear to be important determinants of corruption.
* We thank Seema Jayachandran, Dean Yang, Luigi Zingales, and seminar participants at the Harvard Development Economics Lunch, Harvard Behavioral Economics Seminar, Harvard JFK School of Government, Harvard Political Economy discussion group, the University of Michigan, and LSE for helpful suggestions. Adam Sacarny provided superb research assistance. We are especially grateful to the New York City Department of Finance for providing us with data on parking violations, and National Public Radio for alerting us to the existence of these data. All errors are our own. -- R. Fisman, Columbia University Graduate School of Business, Uris 823, New York, NY 10027, USA, phone: 1 (212) 854-9157, fax 1 (212) 854-9895, email: [email protected]. -- E. Miguel, Department of Economics, University of California, 549 Evans Hall #3880, Berkeley, CA 94720-3880, USA, phone: 1 (510) 642-7162, fax: 1 (510) 642-6615, email: [email protected].

1
1. Introduction
The underlying causes of corruption remain poorly understood and widely debated. Yet the study of
corruption beyond the realm of opinion surveys is still in its infancy, and there is little firm evidence
relating corruption to real-world causal factors. Notably, social norms are often mentioned as a primary
contributor to corruption in both the academic literature and the popular press, yet there is no evidence
beyond the most casual of cross-country empirics.1
Research on the causes of corruption is compounded by the difficulties inherent in disentangling
the effect of social norms versus legal enforcement: societies that collectively place less importance on
rooting out corruption, and thus have weak anti-corruption social norms, may simultaneously have less
legal enforcement. Understanding the relative importance of these potential causes of corruption is of
central importance in reforming public institutions to improve governance: if corruption is predominantly
controlled through anti-corruption social norms, interventions that focus exclusively on boosting legal
enforcement will likely fail.
We develop an empirical approach for evaluating the role of social norms in corruption by
studying parking violations among international diplomats living in New York City. Consular personnel
and their families benefit from diplomatic immunity, a privilege which allowed them to avoid paying
parking fines prior to November 2002. We examine differences in the behavior of government employees
from different countries, all living and working in the same city, all of whom can act with impunity in
(illegally) parking their cars. The act of parking illegally fits well with a standard definition of corruption,
i.e., “the abuse of entrusted power for private gain,”2 suggesting that the comparison of parking violations
by diplomats from different societies serves as a plausible measure of the extent of corruption social
norms or a corruption “culture”.
1 See Lambsdorff (2005) for an overview of findings on culture and corruption based on cross-country comparisons. Witzel (2005) provides one of many discussions on the topic in the popular press. Mauro (2004) discusses several models of multiple equilibria in corruption levels that could be seen as capturing corruption culture. Tirole (1996) develops a model of bureaucratic collective reputation that also implies persistent corruption. 2 This is the definition used by the international anti-corruption organization Transparency International (see http://ww1.transparency.org/about_ti/mission.html, accessed online March 9, 2006).

2
This setting has a number of advantages. Most importantly, our approach avoids the problem of
differential legal enforcement levels across countries, and more generally strips out enforcement effects,
since there was essentially no enforcement of parking violations for diplomats during the main study
period. We thus interpret diplomats’ behavior as reflecting their underlying propensity to break rules for
private gain when enforcement is not a consideration. Additionally, because U.N. diplomats are largely
co-located in Midtown Manhattan, we avoid many concerns of unobserved differences in parking
availability across geographic settings.
The first contribution of this approach lies in allowing us to construct a “revealed preference”
measure of corruption for government officials across 146 countries. This objective measure, based on
real rule-breaking in parking, is arguably an improvement over existing country corruption indices that
are typically based on subjective surveys, and it is certainly much cheaper data to collect.3 Other existing
corruption measures are also difficult to interpret – what does moving from a score of “1” to a score of
“2” on a cross-country index really mean? – while our parking violations measure has a much more
precise definition and explicitly cardinal interpretation.
In our main empirical result, we find that this parking violation corruption measure is strongly
positively correlated with other country corruption measures, and that this relationship is robust to
conditioning on region fixed effects, country income, and a wide range of other controls (including
government employee salary measures). This finding arguably validates the usefulness of the new
measure. It also goes against the predictions of standard economic models of crime in situations of zero
legal enforcement (e.g., Becker 1968). These would predict that parking violations should be high across
the board for all diplomats when enforcement is lifted. Instead we find that diplomats from low corruption
countries (e.g., Norway) behave remarkably well even in situations where they can get away with
violations, while those from high corruption countries (e.g., Nigeria) commit many violations, suggesting
that they bring the social norms or corruption culture of their home country with them to New York City.
3 In this sense, our corruption measure is conceptually similar to the Economist magazine’s “Big Mac Index” as a measure of country purchasing power parity.
3
An alternative explanation for this pattern warrants mentioning upfront. It is possible there are
stronger social sanctions – for example, public embarrassment through the media upon returning home –
in low corruption countries against diplomats who commit many parking violations while in New York,
relative to diplomats from high corruption countries. If the potential response of others in the home
country, either informally or formally, is responsible for limiting parking violations, then diplomats’
behaviors are better interpreted as an indication of their home country’s cultural tolerance for corruption
rather than their own personal values. However, this is still consistent with our basic interpretation of the
level of New York City parking violations as a revealed preference measure of country corruption norms.
The parking violations data exist at the individual diplomat level for all U.N. mission diplomats
present in New York City (numbering over 1700 at any given point in time), allowing us to study how
individual behavior evolves over time in a situation of zero enforcement. For diplomats from high
corruption countries of origin, a model of convergence to United States corruption norms would
(presumably) predict a decline in the rate of parking violations over time, as tenure in the U.S. increases.
By contrast, a model of convergence to the “zero enforcement” norm discussed above would imply an
increase in violations over time, particularly for officials from low corruption countries. We do find
evidence that the frequency of violations increases with tenure in New York City. However, in contrast to
both models of norm convergence, there is a statistically significant positive interaction effect of home-
country corruption levels and tenure in New York City, implying much greater increases in violations
over time among diplomats from the high corruption countries.
The parking violation dataset also provides a novel window into the related issues of sentiment
and affinity in individual decision-making. It is often claimed that sentiment has a major impact on
important economic decisions as suggested, for example, by the frequent use of consumer boycotts to
pressure corporate policies and the “capitalization of patriotism” in low yield war bonds. However, the

4
empirical evidence on this score remains contested.4 We find that diplomats from countries where popular
attitudes towards the United States tend to be unfavorable (based on comparable cross-country survey
data) have significantly more parking violations than those from countries where attitudes towards the
United States are largely positive. This setting is one in which diplomats can indulge their personal tastes
for rule-breaking without punishment, and it appears that diplomats from countries where the U.S. is
unpopular derive positive utility from breaking U.S. rules (or suffer less disutility than other diplomats
from doing so).
A final empirical finding is worth highlighting. In the aftermath of the September 11, 2001
attacks, there was a sharp – though temporary – drop in diplomatic parking violations, by roughly 80%.
We find that countries with greater proportions of Muslim population experience particularly sharp
declines. We can only speculate about the exact causes of this change in behavior, but the fear of police
harassment or negative media attention for their home country during that politically delicate period is a
possibility. Also recall that there were hundreds of attacks on Muslims in the United States in the weeks
following the 9/11 attacks (Council on American-Islamic Relations 2002).
The main theoretical implication of these empirical patterns, taken together, is that culture,
norms, and emotions – in other words, factors other than legal enforcement – play a key role in
government officials’ corruption decisions. They suggest that understanding these factors should be taken
seriously in debates about the causes of corruption and the policy measures to combat it.
This is part of a growing literature on the important of cultural background in explaining
individual behavior. Much of this work compares the outcomes and actions of immigrant groups from
different countries. For example, Borjas (1999) finds that home country attributes are predictive of
immigrants’ economic achievement; in the social domain, Fernandez and Fogli (2005) show that fertility
rates among Americans of different countries of origin are correlated with fertility rates in the home
4 There is a small but growing literature on consumer sentiment and purchasing behavior. Chavis and Leslie (2006) examine the effect of the Iraq War on French wine sales and find mixed results. In the domain of corporate social responsibility, Hiscox and Smyth (2006) find that “good labor” labels have a strong impact on consumer demand.

5
country. Closest to our work is Ichino and Maggi (2000), who study absenteeism and misconduct of
employees at an Italian bank, and find that region of origin within Italy predicts shirking.
We also seek to contribute to the growing literatures on corruption specifically and norm
compliance more generally. The recent empirical literature on corruption emphasizes the importance of
developing corruption measures based on real-world decisions rather than survey responses; see Olken
(2006) for a discussion. This paper is the first to our knowledge to develop a revealed preference measure
of corruption that is comparable across countries. Finally, the importance of norm compliance and non-
selfish behavior has been documented in the laboratory (see for example Ledyard (1995)) and more
recently Levitt (2006) provides evidence on norms of non-selfish behavior in the field.
The rest of the paper proceeds as follows: section 2 describes the diplomatic parking situation in
New York City and the violations data, section 3 discusses the rest of the dataset, section 4 contains the
empirical results and the final section concludes.
2. Diplomatic Parking Violations in New York City
Diplomatic immunity provides consular officials and their families with protection from prosecution or
lawsuits in their host country. The original intent of these laws was to protect diplomats from
mistreatment abroad, especially in countries not on friendly terms with the home country.5 However,
these days diplomatic immunity is more commonly viewed as the “best free parking pass in town” (BBC
1998). Diplomatic vehicles possess license plates tagged with the letter “D” that signals diplomatic
status.6 While these vehicles may be ticketed, the car’s registrant is shielded from any punishment for
non-payment of the ticket. Thus one immediate implication of diplomatic immunity – not just in New
York, but also in most other capitals (e.g., London (BBC 1998), Paris (Agence Presse-France 2005),
Seoul (Korea Times 1999)) – has been that it allows diplomats to park illegally but never suffer any threat
5 While the origins of diplomatic protection date back many centuries, the current incarnation is found in the Vienna Convention on Diplomatic Relations of 1961. See http://www.un.int/usa/host_dip.htm for the full text. 6 Note that while the vehicle’s diplomatic status is revealed by the license plate, there is nothing that identifies the country of origin of the vehicle’s registrant.

6
of legal punishment, leaving a “paper trail” of illegal acts with no consequences.7 To illustrate the
magnitude of the problem, between November 1997 and the end of 2002 in New York City, diplomats
accumulated over 150,000 unpaid parking tickets, resulting in outstanding fines of more than $18 million.
The parking violations data are at the level of the individual unpaid violation.8 Drivers have 30
days to pay a ticket before it goes into default, at which point an additional penalty is levied (generally
110% of the initial fine). Diplomats then receive an additional 70 days to pay the ticket plus this penalty
before it is recorded in our dataset as an unpaid violation in default. The information on each violation
includes the license plate number, the name and country of origin of the car’s registrant, the date, time
and location of the violation, the fine and penalty levied, and amount paid (if any). The most common
diplomatic parking violation was parking in a “No Standing – Loading Zone” (43% of violations). The
remainder were spread across a wide range of violation types that imply varying degrees of social harm9:
fines for expired meters accounted for 6% of the total, double-parking for 5%, and parking in front of a
fire hydrant 7%, for instance. We present analyses for different types of violations below. Also note that
in 20% of violations the registrant is the mission itself, signifying an official rather than personal vehicle.
We return to this below in describing our individual-level results. The period of coverage is November
24, 1997 to November 21, 2005. (Refer to the Data Appendix for a more detailed description of the New
York City parking violations dataset.)
A crucial change in legal enforcement took place in October 2002, with the implementation of the
Clinton-Schumer Amendment (named after the two senators from New York State), proposed by the
Bloomberg administration to deal with the diplomat parking problem. This law gave the City permission
to tow diplomatic vehicles, revoke their official U.N. parking permits, and have 110% of the total amount
due deducted from U.S. government aid to the offending diplomats’ countries of origin (Singleton 2004).
7 See http://www.state.gov/m/ds/immunities/c9127.htm. 8 We gratefully acknowledge the New York City Department of Finance, in particular Sam Miller and Gerald Koszner, for compiling these data. 9 Almost all parking violations in the dataset resulted in fines of US$55, making it impossible to assess the extent of social damage by violations’ relative prices.

7
Parking violations fell substantially after this reform, suggesting that increased enforcement can sharply
reduce corruption, but the basic cross-country patterns remain unchanged, as we discuss below.
We thus mainly focus on the pre-reform period, November 1997 through October 2002, since it is
closest to the zero legal enforcement environment we are interested in. For most of the analysis we
employ the total amount of unpaid parking violations for a particular country’s diplomats conditional on
the total number of U.N. permanent mission staff with diplomatic privileges. We obtain staff information
from the U.N. Bluebook for May 1998. Published twice annually, the Bluebook lists all U.N. mission
staff, as well as their official titles. We additionally use U.N. Bluebooks for 1996–2002 to track the U.N.
tenure of individual level violators. Fortunately, the Bluebooks use consistent spellings across editions,
facilitating automated matching across time. In a majority of cases, the spelling and format were also
consistent with the names in the parking violations data; the algorithm automatically matched 71% of
diplomats in the violations database (see the Data Appendix for further details). The first Bluebook we
use is from February 1996, and we use this as our start date for calculating tenure at the United Nations.
That is, we cannot distinguish among arrival times pre-1996, and all individuals included in the February
1996 Bluebook are coded as arriving in that month. As a robustness check, we also limit the sample only
to diplomats who were not yet present in New York in the 1996 Blue Book (reducing the sample by
16%), which allows us to more accurately capture arrival dates, as discussed below.
We also obtained data on the number of diplomatic license plates registered to each mission from
the U.S. Department of State’s Office of Foreign Missions, and we use this data as a control variable in
some specifications. Unfortunately, these data are only available for 2006, though we were assured that
these numbers are largely stable over time.10
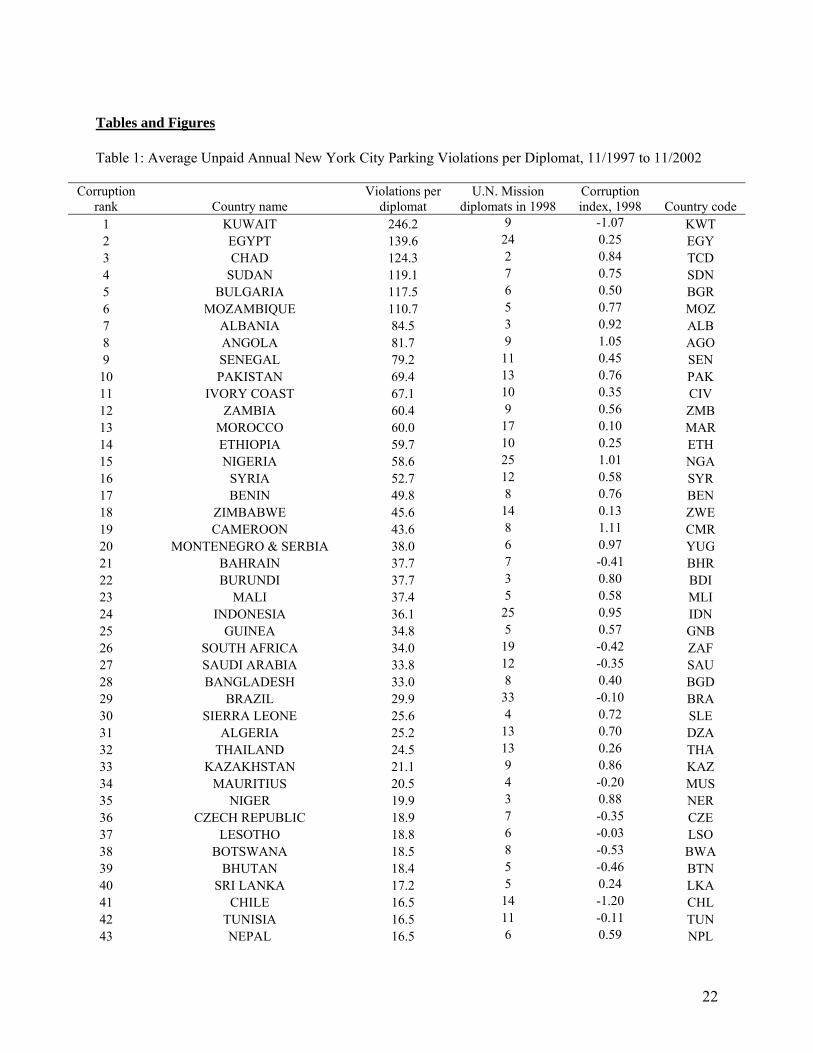
Table 1 presents the annual number of violations per diplomat during November 1997 – October
2002 period by country, along with the total number of diplomats from the May 1998 U.N. Bluebook.
Overall, the basic pattern accords reasonably well with common perceptions of corruption across
countries. The worst parking violators – the ten worst are Kuwait, Egypt, Chad, Sudan, Bulgaria, 10 We thank Murray Smith of the U.S. Office of Foreign Services for these data and for many useful conversations.

8
Mozambique, Albania, Angola, Senegal, and Pakistan – all rank poorly in cross-country corruption
rankings. While many of the countries with zero violations accord well with intuition (e.g., the
Scandinavian countries, Canada), there are a number of surprises. Some of these are countries with very
small missions (e.g., Burkina Faso and the Central African Republic), and a few others have high rates of
parking violations but do pay the fines (these are Bahrain, Malaysia, Oman, and Turkey; we return to this
issue below). The smallest missions may plausibly have fewer violations since each mission is given two
legal parking spaces at the United Nations and this may suffice if the country has very few diplomats.
Figure 1 plots the total violations per month during November 1997 – November 2005. There are
two clear declines in the number of violations – the first comes in September 2001, corresponding to the
period following the World Trade Center attack. The second and more pronounced decline coincides with
increased enforcement in New York City.
3. Cross-country data
We also employ country-level data on economic, political, and social characteristics, and in particular
consider data on country corruption levels, using the corruption measure in Kaufmann et al (2005) from
1998, the earliest year with wide country coverage. This is a composite corruption index that is essentially
the first principal component of a number of other commonly used corruption indices. By definition,
therefore, it is quite highly correlated with the commonly used indices and is extremely highly correlated
(ρ=0.97) with the Transparency International (TI) ratings from the same year. For ease of interpretation,
we reverse the sign of the original measure so that higher values indicate greater corruption. The mean
value of this measure is zero, and it ranges from -2.6 to +1.6 in our sample of countries. The main
advantages of this country measure are that its method of aggregation is clearly defined relative to the TI
measure, and it has broader country coverage than other indices.
The Pew Global Attitudes Survey11 from 2002 (the earliest year that the survey was performed)
provides a measure of anti-American sentiment based on responses to the question: “Please tell me if you 11 These data are publicly available online at http://pewglobal.org/ (accessed March 9, 2006).
9
have a very favorable, somewhat favorable, somewhat unfavorable or very unfavorable opinion of the
United States.” This is coded to take on values from one (most favorable) to four (least favorable) and
then averaged across respondents. To control for general aversion to foreigners, we similarly code
responses to another question from the Pew survey that asks respondents their attitudes towards a
dominant regional country (for example, Argentines are asked to give their opinion of Brazil). The five
countries in the Pew dataset whose citizens viewed the U.S. most favorably in 2002 are Honduras,
Venezuela, Ghana, Philippines, and Nigeria, while the five that viewed the U.S. least favorably are Egypt,
Pakistan, Jordan, Turkey, and Lebanon. The preponderance of Middle Eastern countries may in part be
due to popular opposition there to the U.S. invasion of Iraq, which was imminent by late 2002.
Unfortunately, the Pew data are not available prior to 2002 and thus we are unable to explore whether
changes in popular attitudes over time affect New York City parking violations.
We include a number of other variables that may affect incentives to comply with local laws.
From the data of Kuziemko and Werker (2006), we generate an indicator variable denoting whether the
country received foreign aid from the United States in 1998. We similarly generate a pair of indicator
variables for military and economic aid, respectively, since these two types of aid may reflect different
geopolitical interests: while economic aid recipients may feel beholden to the United States, those
receiving military aid are typically countries that the United States requires as strategic allies.
Finally, we consider whether unpaid violations appear to be driven by an income effect. We
include the logarithm of GDP per capita in 1998 in U.S. dollars taken from the World Development
Indicators in most specifications. Country-level income per capita is strongly correlated with corruption
and with the rule of law, and may be caused in part by underlying corruption levels, complicating efforts
to disentangle corruption effects from income effects. As we discuss below, despite this strong correlation
the main corruption results are robust to including a linear income control. Second, we include the ratio of
government bureaucrats’ salaries to GDP per capita (using data from Schiavo-Campo et al 1999) for the
early 1990s (exact year differs by country) to account for the possibility bureaucrats occupy different
positions in the national income distribution.

10
Our sample consists of all countries that had 1998 populations greater than 500,000 according to
the World Development Indicators, and for which basic country-level data were available. Table 2
presents summary statistics for both the country-level and diplomat-level variables.
4. Empirical Results
The main econometric specification in the cross-country analysis is presented in equation 1:
log(1+Average annual unpaid parking violations)i
= α + β1log(Diplomats)i + β2Corruptioni + Xi′γ + εi (1)
where i denotes the country, Corruption is the 1998 country corruption index, and X is a vector of other
country controls, including region fixed effects, the log of GDP per capita in 1998, among others
depending on the specification, and ε is a standard white noise disturbance term.
The New York City unpaid parking violations measure is robustly positively correlated with the
existing country corruption index conditional on the number of U.N. mission diplomats for that country in
New York City (Table 3, regression 1). The relationship is roughly linear (Figure 2). The coefficient
estimate on the country corruption index is robust to the inclusion of log per capita income (regression 2)
and also to the log of the number of vehicles registered to each mission as a control (regression 3),12
though the point estimate drops by nearly half using the income control. The result is also robust to
controlling for the average government wage relative to per capita income (regression 4) and to region
fixed effects (regression 5). The regions with the greatest average number of unpaid parking violations
relative to the reference region (North America and the Caribbean) are Africa and the Middle East. Note
that while the coefficient on corruption is robustly significantly significant across these specifications, the
coefficient on country per capita income is sensitive to the choice of sample and covariates.
The strong relationship between the parking violation corruption measure and the country
corruption index also holds if the dependent variable is log(1 + Average annual unpaid parking violations 12 A specification using fixed effects for the number of vehicles per mission generates similar results (results not shown). Further, these estimated fixed effects are uniformly increasing in the number of vehicles, implying a monotonic relationship consistent with the linear functional form we report in the table.

11
/ Diplomats) across specifications (Table 4), is robust to specifications where log(Diplomats) is included
as an additional control (results not shown), and similarly holds if a tobit specification is used rather than
OLS (Appendix Table A1).
We obtained similar data on parking violations by embassy diplomats in London as a further
robustness check. This information is reported annually in the minutes of the U.K. House of Lords, as is
information on the number of diplomats from each country residing in London. We use data for the years
1998-2002 to best match the New York City analysis. The London data is coarser than the New York City
data in several ways. First,, only country violation totals are reported (rather than the detailed micro-data
available for New York City), and countries with fewer than ten violations are not reported. Further, the
fact that foreign embassies are scattered throughout London further complicates the interpretation relative
to New York City where U.N. missions are co-located in Midtown Manhattan and thus diplomats face a
similar parking environment. Despite these differences, the results imply a relationship between country
corruption and diplomatic parking violations in London that is remarkably similar to the estimated effects
for U.N. diplomats in New York. In regressions analogous to Table 3 but using London parking violations
as the dependent variable, the coefficient estimate on the country corruption index takes on values ranging
between 0.38 and 0.70, and these effects are statistically significant at over 90% confidence across all
OLS and tobit specifications (results not shown).
The coefficient estimate on the country corruption measure in the New York City data remains
positive and large (0.3) but loses statistical significance if quadratic and cubic polynomials for the log of
country per capita income are included controls, in part because standard errors increase (regression not
shown). However, the implied relationship between country per capita income and parking violations is
non-monotonic: it rises up through (roughly) average per capita income in the sample, before declining.
This pattern argues strongly against the explanation that richer countries are simply able to purchase more
parking spots for their diplomats, in which case we would expect a monotonic negative relationship
between country income and parking violations. We prefer to focus on the specification with a linear log

12
per capita income control since doing so most directly addresses theoretically well-motivated concerns
about such monotonic income effects, rather than including additional highly collinear income controls.13
Since we can follow individual diplomats during their tenure at the U.N., we examine the related
question of whether there is any evolution of diplomat behavior while in New York City. Conceptually,
the relative plausibility of socialization to U.S. norms versus convergence to a uniform high corruption
norm is unclear. If convergence is to U.S. corruption norms, individuals from high corruption countries
should have declining parking violations over time, but there be should be no change in behavior for
diplomats from the low corruption societies. Alternatively, individuals may begin their stay in NYC
unsure as to the extent they can get away with parking violations. Once they successfully “get away with
it” a few times (or hear stories about others getting away with it) and learn about the reality of zero
enforcement, diplomats may become bolder in their violations. Thus convergence to this “zero
enforcement” norm predicts increasing parking violations over time, particularly among diplomats from
low corruption countries. In practice to estimate these effects we use a regression equation of the form:
log (1 + Monthly unpaid parking violations)ijt
= αt + β1log(Months in NYC)ijt + β2{log(Months in NYC)ijt*Corruptioni} + Xijt′γ + εijt (2)
where i again denotes a country and j denotes an individual diplomat from that country in month t, Xijt is a
vector of individual diplomat characteristics, and the final term is the error, which is allowed to be
correlated across monthly observations for the same individual. We include month fixed effects (αt) in all
specifications, and also sometimes include diplomat fixed effects (αij). The two key terms in this analysis
are β1, the effect of increased time spent working as a consular official in New York City on parking
violations for diplomats from countries with a corruption index of zero (corresponding to average
corruption in the sample), and β2, the differential time effect for diplomats from countries with higher
corruption.
13 The strong empirical relationship between country corruption and income may theoretically reflect causal impacts in both directions (poorer countries become more corrupt, or corrupt countries become poorer), and this complicates the interpretation of regressions where both terms are included as controls.

13
The frequency of unpaid violations increases rapidly and statistically significantly with tenure in
New York City (Table 5, regression 1). On average parking violations increase by 8-18% with a doubling
of the length of tenure in New York City. This result is robust to the inclusion of diplomat fixed effects
(regression 2), and to the use of a discrete measure of violations (regressions 4 and 5). In contrast to
models of convergence to U.S. corruption norms, we do not find a negative interaction effect of home-
country corruption levels and tenure in New York. Rather the coefficient estimate on this interaction term
is positive and statistically significant, implying that there is a divergence in the rate of violations over
time, with diplomats from high corruption countries showing increasingly more violations relative to
diplomats from low corruption countries over time, perhaps as they learn about the reality of diplomatic
immunity. However, the point estimates indicate that even diplomats from very low corruption countries
(those with corruption index scores below -2, say) show some smaller increases in violations over time.
Finally, we note that the results are virtually identical if we repeat the analysis dropping individuals that
arrived only after the earliest U.N. Bluebook was published (results not shown), which allows us to more
accurately capture date of arrival but reduces the sample. An additional robustness check based on a split
of the sample by country average parking violations also generated similar results (results not shown).
Various measures of proximity to the U.S. are correlated with fewer unpaid parking violations.
First, the log of the weighted average distance between a country’s population and the U.S. population is
strongly positively correlated with parking violations, even conditional on world region fixed effects
(Table 6, regression 1), indicating that diplomats from countries physically closer to the U.S. have many
fewer New York City violations. The exact reasons for this pattern are elusive, but greater trade,
migration, and tourism between the countries are possible explanations.14
The Pew dataset provides a measure of popular attitudes towards the U.S. in a subset of 42
countries, and here we find that diplomats from countries in which popular attitudes are unfavorable are
significantly more likely to have unpaid parking violations (Table 6, regression 2). The estimated effect is
14 Trade with the United States is indeed negatively correlated with diplomats’ parking violations, but this effect loses statistical significant when we control for geographic distance to the U.S. (results not shown), suggesting there are other factors beyond trade alone.

14
large: a one standard deviation increase in the extent of unfavorable views leads to a more than doubling
of parking tickets. One possible explanation for this result, which would lead to a spurious correlation, is
that individuals in countries that hold negative views about other countries in general also tend to be
corrupt. However, the result remains robust when we include an additional attitude control that reflects
responses to a parallel question on respondents’ dislike of a neighboring country (regression 3). The
coefficient estimate on this additional control is near zero and not statistically significant while the
coefficient estimate on views towards the U.S. remains nearly unchanged and statistically significant at
over 90% confidence. The main limitation of the analysis in regressions 2 and 3 is the small sample size
of only 42 countries15, the countries for which there is Pew survey data. In contrast, the association
between the proportion of Muslim population in a country, which is widely thought to be related to anti-
American popular attitudes, is not significantly related to unpaid parking violations (regression 5) whether
or not region fixed effects are included as controls (results not shown).
The relationship between unpaid New York City parking violations and the country corruption
index remains qualitatively similar, but becomes somewhat weaker, during the post-enforcement period
after November 2002 (Table 7, regressions 1 and 2). This is in part because overall levels of parking
violations fell dramatically (Figure 1). The same is true for the Pew measure of unfavorable attitudes
towards the U.S. (regression 3), which remains positively and statistically significantly correlated with
parking violations. Finally, we note that countries that had higher levels of U.S. economic aid show sharp
drops in parking violations after November 2002 (regression 4), although the point estimate on the aid
coefficient was similarly negative even in the pre-enforcement period. Thus it does not appear that the
new policy of linking U.S. foreign aid to unpaid parking tickets appears was an important component of
the decline in violations.
Figure 1 indicates that there was a sharp drop in violations in the months following the September
11th, 2001 attacks in New York City, and we find that countries with larger proportions of Muslim
15 This decline in sample size is responsible for the loss of statistical significance for the coefficient estimate on Corruption, which nonetheless remains nearly identical in magnitude to the other specifications.

15
population experience particularly pronounced declines. This finding holds in a specification containing
country and month fixed effects (regression 1), when additional country-specific time trends are included
(regression 2), and with an income control (regression 3). Potential explanations for this result included
the possibility that governments in predominantly Muslim countries exerted greater pressure on their
diplomats to limit violations in order to avoid arousing local ire in New York City, or alternatively that
Muslim diplomats may themselves have wished to be unobtrusive given the surge of anti-Muslim feeling
and violence in the wake of the 9/11 attacks. One further potential explanation – that missions from
predominantly Muslim countries withdrew diplomats for safety reasons – can be ruled out: the U.N.
Bluebook shows no post-9/11 decline in the number of diplomats from predominantly Muslim countries
posted in New York (regression not shown).
Further Robustness Checks and Alternative Explanations
As noted in the introduction, informal or formal social sanction against diplomats in the home country
could be partially responsible for restraining parking violations in some cases. In such cases, diplomats’
behaviors are better interpreted as an indication of their home country’s norms or culture rather than their
own personal values. We acknowledge this possibility but note that this account remains consistent with
our interpretation of the level of New York City parking violations as a revealed preference measure of
corruption for government officials from a certain country, in the absence of formal legal enforcement.
Nonetheless, two findings argue against this alternative interpretation as the main driver of our
findings. First, a Lexis-Nexis search of 504 European news outlets (English language or in translation)
using the terms DIPLOMATS and PARKING and NEW YORK yielded only 25 stories during the entire
study period, and these stories were concentrated in just four countries (the United Kingdom, Germany,
France, and Russia). Further, with the exception of several Russian articles, the stories were about the
general problem of diplomatic parking violations in New York City and the 2002 crackdown, rather than
reporting on the behavior of home country diplomats. The possibility of sanctions for returning diplomats
who accumulated parking tickets while abroad is apparently not a leading media issue, in Europe at least.

16
Second, we considered whether unpaid parking violations early in an official’s tenure at the
United Nations in New York City is correlated with the length of his employment there, and further
whether these early violations interact in any way with corruption in the country of origin (i.e., perhaps
violators from low corruption countries could be punished by their government and sent home early). We
find no evidence for any such effects of parking violations on diplomat tenure (regressions not shown).
Obviously, neither of these two findings is completely conclusive. In equilibrium the number of
violations committed will reflect choices made, in part, to avoid home country sanctions. But they are
certainly consistent with the view that home country enforcement was typically weak or nonexistent. A
related concern is that public pressure could have a larger effect on diplomats’ choices in a more
democratic political setting. However, we do not find that the number of parking violations is statistically
significantly related to democracy (as measured by the Polity IV democracy scale in 1998) nor is the
coefficient on corruption affected at all by its inclusion (regressions not shown).
An additional estimation concern is that our country corruption measure may be picking up an
income effect rather than a corruption effect. Wealthier diplomats could potentially have greater means to
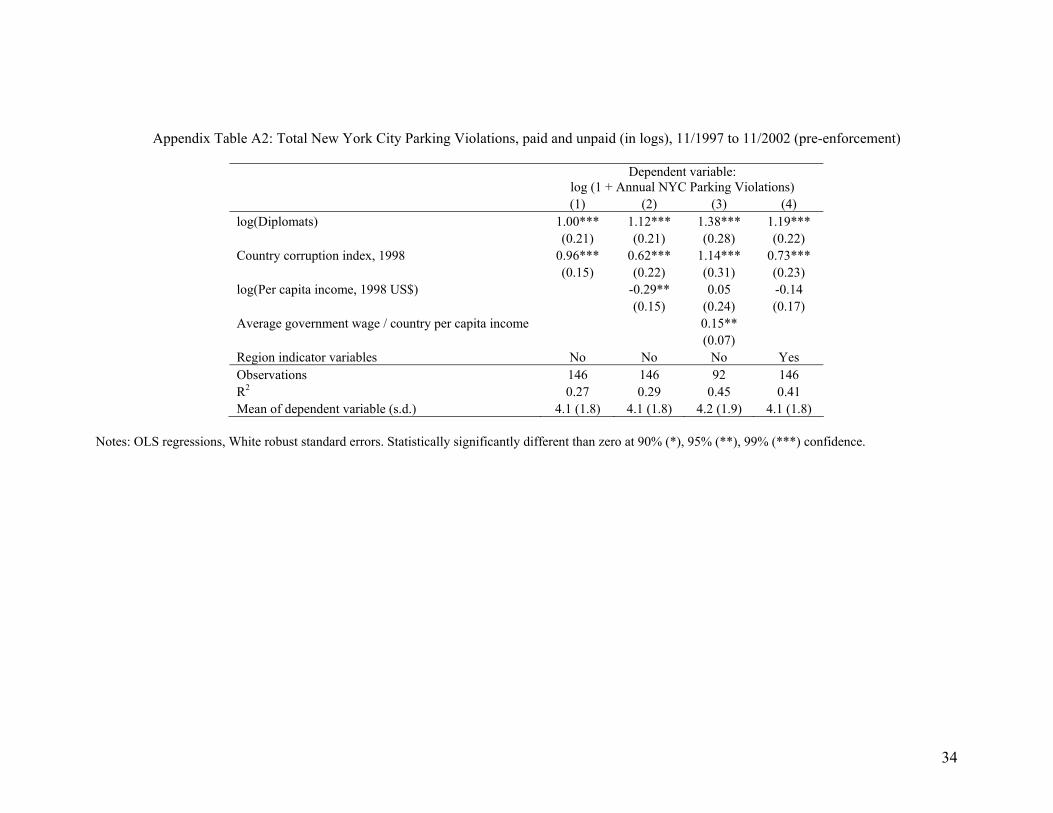
simply pay off any tickets or use parking garages, for example. However, this also seems unlikely. First,
the inclusion of paid violations in our parking violations measure has no effect on the main results
(Appendix Table A2). We also find that the index of country corruption explains unpaid parking
violations even conditional on a linear national per capita income control (and also controlling for the
ratio of bureaucratic wages to per capita income), although our results are attenuated somewhat by the
inclusion of higher order polynomial income controls, as discussed above.
Finally, we examined the predictors of the most socially egregious New York City parking
violations, the rationale being that relatively impoverished diplomats from poor countries might be forced
to park illegally in order to avoid the extra expense of renting a parking spot, but might still try to do so in
a manner that avoids excessive negative social externalities. As indications of extreme violations, we in
particular consider parking in front of a fire hydrant, and violations for double-parking on East-West
streets between 10th and 100th Streets in Manhattan. These are relatively narrow and heavily traveled

17
roads and double parking will often completely block passage. The main results hold robustly for both
types of violations (Appendix Table A3); in other words, diplomats from high corruption countries are
much more likely to commit the most egregious parking violations. Hence our results are not driven
solely by behaviors causing minimal social harm (i.e., an expired meter in a legal parking spot). Once
again, we acknowledge that these tests cannot conclusively rule out that income is playing some role in
driving the country corruption result, but the weight of the evidence argues against this explanation.
A final consideration is whether there is a differential selection mechanism for U.N. diplomats
across countries that might account for the pattern we observe. In particular, it would problematic if the
relatively more corrupt government officials (within the distribution of officials in a country) were
selected for New York postings from high corruption countries. We have no rigorous statistical test to
explore this possibility, but we feel it is unlikely to be of first-order importance for several reasons. First,
U.N. mission staff are selected along a range of common characteristics, including English-language
skills, education and diplomatic experience, and this reduces the gap between diplomats in terms of their
personal attributes. Further, we are not concerned with differential selection of “corrupt” types into the
government bureaucracy versus the private sector across countries, since we are interested in the behavior
of actual government civil servants, like the U.N. mission diplomats we observe. So any selection story
must pertain to selection across branches of the civil service. To the extent that this selection effect is at
work, we might expect it to operate in the opposite direction. For example, in the Transparency
International 2005 survey of the bureaucracy in Kenya – a reasonably high corruption country –
diplomatic missions were rated as the fifth least corrupt among all 34 government ministries.16 It appears
that, if anything, U.N. postings offer fewer opportunities for graft than many other government positions
(e.g., in customs) and thus might likely attract the relatively less corrupt bureaucrats in high corruption
16 This report may be found at http://ww1.transparency.org/surveys/dnld/kenya_bribery_index2005.pdf, accessed May 5, 2006. Transparency International reports on corruption across branches of government for other countries can be found at http://www.transparency.org/policy_research/surveys_indices/asia_pacific, although to our knowledge only in the case of Kenya do they explicitly rank diplomats relative to other branches of government.
18
countries. This would dampen the observed correlation between parking violations and home-country
corruption rather than generating a spurious positive correlation.
5. Conclusion
We exploit a unique natural experiment – the stationing in New York City of thousands of government
officials from 146 countries around the world – in a setting of zero legal enforcement of parking
violations to construct a revealed preference measure of official corruption. We find that this measure is
strongly correlated with existing measures of home country corruption. This finding suggests that cultural
or social norms related to corruption are quite persistent: even when stationed thousands of miles away,
diplomats behave in a manner highly reminiscent of officials in the home country. Norms related to
corruption are apparently deeply engrained, and factors other than legal enforcement are important
determinants of corruption behavior.
The related second empirical finding is the strong negative relationship between affinity for the
United States in the diplomat’s home country and parking violations in New York. This provides real-
world empirical evidence that sentiments matter in economic decision-making in general and for
corruption decisions in particular. One implication of this finding is that government officials’ “feelings”
towards their own nation – for instance, their extent of patriotism, national pride, or strength of national
identity – could also be factors in their corruption decision within the home country.
One important message from our empirical results is that corruption norms are sticky. This result
raises the critical question of whether there are policy interventions that can modify corruption norms
over time. For example, the Bloomberg administration’s enforcement efforts in New York City in 2002
were extremely successful in changing diplomats’ behaviors, and it would be useful to know whether
these changes might additionally have had persistent effects on norms once individuals become
habituated to rule compliant behavior. Such long-run effects of temporary interventions necessarily rely
on a shift in norms (or tastes), and would be consistent with the findings of Di Tella and Schargrodsky

19
(2003) on the persistent effects of auditing on corruption in Argentina. Unfortunately, our context does
not accommodate this analysis.
Finally, our methodology of inexpensively generating cross-country data could potentially be
applied to other settings where comparable individuals from across countries are present in the same place
for a period of concentrated activity (the Olympics Games, for example). In this spirit, in separate work
we are preparing to study the economic decisions of taxi drivers waiting to pick up passengers at John F.
Kennedy International Airport in New York City. This subject pool similarly provides us with a vast
population of thousands of individuals drawn from societies throughout the world. We hope that this, and
other variants on the methodology, will be useful in informing our understanding of how cultural and
social backgrounds lead to long-run differences in beliefs, tastes, values, and economic decisions.
References Becker, Gary S., “Crime and Punishment: An Economic Approach,” Journal of Political Economy, LXXVI (1968), 169-217. Borjas, George J., "The Economic Progress of Immigrants," in Issues in the Economics of Immigration, ed.George J. Borjas, University of Chicago Press (2000), pp. 15-49. Chavis, Larry and Phillip Leslie, “Consumer Boycotts: The Impact of the Iraq War on French Wine Sales in the U.S,” NBER Working Paper No. 11981, 2006. Council on American-Islamic Relations, “Annual Civil Rights Report 2002: Stereotypes and Civil Liberties,” http://www.cair-net.org/asp/execsum2002.asp (accessed March 9, 2006). Di Tella, Rafael, and Ernesto Schargrodsky, "The Role of Wages and Auditing during a Crackdown on Corruption in the City of Buenos Aires," Journal of Law and Economics, XLVI (2003), 269-292. Fernandez, Raquel and Alessandra Fogli, “Fertility: The Role of Culture and Family Experience,” National Bureau of Economic Research Working Paper 11569, 2005. Hiscox, Michael and Nick Smyth, “Is there a Demand for Labor Standards? Evidence from Field Experiments in Social Labeling,” mimeo, Harvard University, 2005. Ichino, Andrea and Giovanni Maggi, "Work Environment and Individual Background: Explaining Regional Shirking Differentials in a Large Italian Firm", Quarterly Journal of Economics, 115(3), 1057-1090 (2000). “Illegal Parking by Diplomats on Rise,” Korea Times, (November 1, 1999).

20
Kang, Sung Won and Hugh Rockoff, “Capitalizing Patriotism: The Liberty Loans of World War I,” NBER Working Paper No. 11919, 2006. Kaufmann, Daniel, Aart Kraay, and Massimo Mastruzzi, “Governance Matters IV: Governance Indicators for 1996–2004,” World Bank Policy Research Working Paper Series No. 3630, 2005. Kuziemko, Ilyana and Eric Werker, “How Much Is a Seat on the Security Council Worth? Foreign Aid and Bribery at the United Nations,” Harvard Business School Working Paper No. 06-029, 2006. Lambsdorff, Johann Graf, “Consequences and Causes of Corruption – What do We Know from a Cross-Section of Countries?” forthcoming in S. Rose-Ackerman and E. Elgar, eds., Handbook of Economic Corruption (2006). Ledyard, John, “Public goods: A survey of experimental research,” in The Handbook of Experimental Economics, edited by J.H. Kagel and A. Princeton University Press, 1995. pp. 111-194. Levitt, Steven D, “An Economist Sells Bagels: A Case Study in Profit Maximization,” National Bureau of Economic Research Working Paper 12152, 2006. Mauro, Paolo. (2004). “The Persistence of Corruption and Slow Economic Growth”, IMF Staff Papers Vol. 51, No. 1. Mayer, Thierry and Soledad Zignago, “Market Access in Global and Regional Trade,” CEPII Working Paper 2005-02, 2005. Olken, Benjamin A., “Corruption Perceptions vs. Corruption Reality,” unpublished manuscript, Harvard University, 2006. Pew Charitable Trust, “What the World Thinks in 2002,” http://pewglobal.org/reports/display.php?ReportID=165 (accessed March 9, 2006). Schiavo-Campo, Salvatore, Giulio de Tommaso, and Amit Mukherjee, "An International Statistical Survey of Government Employment and Wages," World Bank Policy Research Working Paper No. 1806, 1999. Singleton, Don, “Bill Socks Scofflaw Diplos,” New York Daily News (November 21, 2004), City Final Edition, pg. 28. “So what are diplomats immune to?” BBC News, http://news.bbc.co.uk/1/hi/special_report/1998/10/98/e-cyclopedia/196677.stm, October 28, 1998. “Speedy diplomats steer clear of fines in France,” Agence France-Presse, March 16, 2005. Tirole, Jean. (1996). “A Theory of Collective Reputations (with Applications to the Persistence of Corruption and to Firm Quality)”, Review of Economic Studies, 63(1), 1-22. Transparency International, “TI Mission Statement,” http://ww1.transparency.org/about_ti/mission.html (accessed March 9, 2006). US Department of State, “International Religious Freedom Report for 2004,” http://www.state.gov/g/drl/rls/irf/2004/.

21
Vienna Convention on Diplomatic Relations of 1961, http://www.un.int/usa/host_dip.htm. Witzel, Morgen, “How to Respond When Only Bribe Money Talks,” Financial Times (July 11, 2005), London Edition 1, pg 14.
22
Tables and Figures Table 1: Average Unpaid Annual New York City Parking Violations per Diplomat, 11/1997 to 11/2002
Corruption rank Country name
Violations per diplomat
U.N. Mission diplomats in 1998
Corruption index, 1998 Country code
1 KUWAIT 246.2 9 -1.07 KWT 2 EGYPT 139.6 24 0.25 EGY 3 CHAD 124.3 2 0.84 TCD 4 SUDAN 119.1 7 0.75 SDN 5 BULGARIA 117.5 6 0.50 BGR 6 MOZAMBIQUE 110.7 5 0.77 MOZ 7 ALBANIA 84.5 3 0.92 ALB 8 ANGOLA 81.7 9 1.05 AGO 9 SENEGAL 79.2 11 0.45 SEN
10 PAKISTAN 69.4 13 0.76 PAK 11 IVORY COAST 67.1 10 0.35 CIV 12 ZAMBIA 60.4 9 0.56 ZMB 13 MOROCCO 60.0 17 0.10 MAR 14 ETHIOPIA 59.7 10 0.25 ETH 15 NIGERIA 58.6 25 1.01 NGA 16 SYRIA 52.7 12 0.58 SYR 17 BENIN 49.8 8 0.76 BEN 18 ZIMBABWE 45.6 14 0.13 ZWE 19 CAMEROON 43.6 8 1.11 CMR 20 MONTENEGRO & SERBIA 38.0 6 0.97 YUG 21 BAHRAIN 37.7 7 -0.41 BHR 22 BURUNDI 37.7 3 0.80 BDI 23 MALI 37.4 5 0.58 MLI 24 INDONESIA 36.1 25 0.95 IDN 25 GUINEA 34.8 5 0.57 GNB 26 SOUTH AFRICA 34.0 19 -0.42 ZAF 27 SAUDI ARABIA 33.8 12 -0.35 SAU 28 BANGLADESH 33.0 8 0.40 BGD 29 BRAZIL 29.9 33 -0.10 BRA 30 SIERRA LEONE 25.6 4 0.72 SLE 31 ALGERIA 25.2 13 0.70 DZA 32 THAILAND 24.5 13 0.26 THA 33 KAZAKHSTAN 21.1 9 0.86 KAZ 34 MAURITIUS 20.5 4 -0.20 MUS 35 NIGER 19.9 3 0.88 NER 36 CZECH REPUBLIC 18.9 7 -0.35 CZE 37 LESOTHO 18.8 6 -0.03 LSO 38 BOTSWANA 18.5 8 -0.53 BWA 39 BHUTAN 18.4 5 -0.46 BTN 40 SRI LANKA 17.2 5 0.24 LKA 41 CHILE 16.5 14 -1.20 CHL 42 TUNISIA 16.5 11 -0.11 TUN 43 NEPAL 16.5 6 0.59 NPL
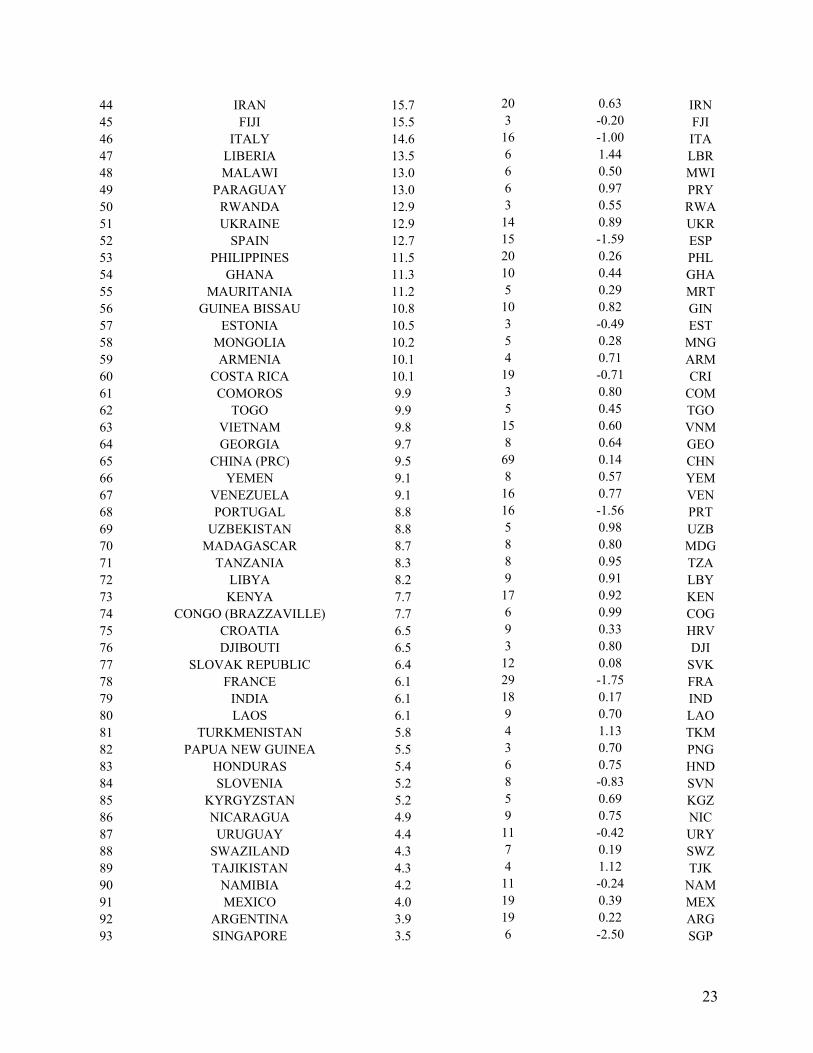
23
44 IRAN 15.7 20 0.63 IRN 45 FIJI 15.5 3 -0.20 FJI 46 ITALY 14.6 16 -1.00 ITA 47 LIBERIA 13.5 6 1.44 LBR 48 MALAWI 13.0 6 0.50 MWI 49 PARAGUAY 13.0 6 0.97 PRY 50 RWANDA 12.9 3 0.55 RWA 51 UKRAINE 12.9 14 0.89 UKR 52 SPAIN 12.7 15 -1.59 ESP 53 PHILIPPINES 11.5 20 0.26 PHL 54 GHANA 11.3 10 0.44 GHA 55 MAURITANIA 11.2 5 0.29 MRT 56 GUINEA BISSAU 10.8 10 0.82 GIN 57 ESTONIA 10.5 3 -0.49 EST 58 MONGOLIA 10.2 5 0.28 MNG 59 ARMENIA 10.1 4 0.71 ARM 60 COSTA RICA 10.1 19 -0.71 CRI 61 COMOROS 9.9 3 0.80 COM 62 TOGO 9.9 5 0.45 TGO 63 VIETNAM 9.8 15 0.60 VNM 64 GEORGIA 9.7 8 0.64 GEO 65 CHINA (PRC) 9.5 69 0.14 CHN 66 YEMEN 9.1 8 0.57 YEM 67 VENEZUELA 9.1 16 0.77 VEN 68 PORTUGAL 8.8 16 -1.56 PRT 69 UZBEKISTAN 8.8 5 0.98 UZB 70 MADAGASCAR 8.7 8 0.80 MDG 71 TANZANIA 8.3 8 0.95 TZA 72 LIBYA 8.2 9 0.91 LBY 73 KENYA 7.7 17 0.92 KEN 74 CONGO (BRAZZAVILLE) 7.7 6 0.99 COG 75 CROATIA 6.5 9 0.33 HRV 76 DJIBOUTI 6.5 3 0.80 DJI 77 SLOVAK REPUBLIC 6.4 12 0.08 SVK 78 FRANCE 6.1 29 -1.75 FRA 79 INDIA 6.1 18 0.17 IND 80 LAOS 6.1 9 0.70 LAO 81 TURKMENISTAN 5.8 4 1.13 TKM 82 PAPUA NEW GUINEA 5.5 3 0.70 PNG 83 HONDURAS 5.4 6 0.75 HND 84 SLOVENIA 5.2 8 -0.83 SVN 85 KYRGYZSTAN 5.2 5 0.69 KGZ 86 NICARAGUA 4.9 9 0.75 NIC 87 URUGUAY 4.4 11 -0.42 URY 88 SWAZILAND 4.3 7 0.19 SWZ 89 TAJIKISTAN 4.3 4 1.12 TJK 90 NAMIBIA 4.2 11 -0.24 NAM 91 MEXICO 4.0 19 0.39 MEX 92 ARGENTINA 3.9 19 0.22 ARG 93 SINGAPORE 3.5 6 -2.50 SGP

24
94 ROMANIA 3.5 10 0.38 ROM 95 UGANDA 3.5 7 0.62 UGA 96 HUNGARY 3.3 8 -0.69 HUN 97 MACEDONIA 3.3 4 0.30 MKD 98 BOLIVIA 3.1 9 0.41 BOL 99 PERU 3.1 9 0.17 PER
100 HAITI 3.0 9 0.85 HTI 101 JORDAN 2.9 9 -0.21 JOR 102 BELARUS 2.7 8 0.60 BLR 103 BELGIUM 2.7 14 -1.23 BEL 104 CYPRUS 2.5 11 -1.38 CYP 105 GUYANA 2.3 5 0.26 GUY 106 AUSTRIA 2.2 21 -2.02 AUT 107 GABON 2.2 8 0.90 GAB 108 RUSSIA 2.0 86 0.69 RUS 109 LITHUANIA 2.0 7 -0.07 LTU 110 EL SALVADOR 1.7 10 0.27 SLV 111 POLAND 1.7 17 -0.49 POL 112 GAMBIA 1.5 8 0.49 GMB 113 MALAYSIA 1.4 13 -0.73 MYS 114 TRINIDAD AND TOBAGO 1.4 6 -0.13 TTO 115 LEBANON 1.3 3 0.32 LBN 116 GERMANY 1.0 52 -2.21 DEU 117 ERITREA 0.8 3 -0.46 ERI 118 MOLDOVA 0.7 4 0.51 MDA 119 KOREA (SOUTH) 0.4 33 -0.11 KOR 120 DOMINICAN REPUBLIC 0.1 22 0.53 DOM 121 FINLAND 0.1 18 -2.55 FIN 122 GUATEMALA 0.1 9 0.63 GTM 123 NEW ZEALAND 0.1 8 -2.58 NZL 124 SWITZERLAND 0.1 10 -2.55 CHE 125 UNITED KINGDOM 0.0 31 -2.33 GBR 126 NETHERLANDS 0.0 17 -2.48 NLD 127 UNTED ARAB EMIRATES 0.0 3 -0.78 UAE 128 AUSTRALIA 0.0 12 -2.21 AUS 129 AZERBAIJAN 0.0 5 1.01 AZE 130 BURKINA FASO 0.0 5 0.51 BFA 131 CENTRAL AFRICAN REPUBLIC 0.0 3 0.55 CAF 132 CANADA 0.0 24 -2.51 CAN 133 COLOMBIA 0.0 16 0.61 COL 134 DENMARK 0.0 17 -2.57 DNK 135 ECUADOR 0.0 9 0.74 ECU 136 GREECE 0.0 21 -0.85 GRC 137 IRELAND 0.0 10 -2.15 IRL 138 ISRAEL 0.0 15 -1.41 ISR 139 JAMAICA 0.0 9 0.26 JAM 140 JAPAN 0.0 47 -1.16 JPN 141 LATVIA 0.0 5 0.10 LVA 142 NORWAY 0.0 12 -2.35 NOR 143 OMAN 0.0 5 -0.89 OMN

25
144 PANAMA 0.0 8 0.28 PAN 145 SWEDEN 0.0 19 -2.55 SWE 146 TURKEY 0.0 25 0.01 TUR Notes: A higher score in the corruption index denotes more corruption.

26
Table 2: Descriptive statistics
Variable Mean Standard
deviation Observations
Panel A: Country-level data Log(Annual unpaid New York City parking violations per diplomat, 11/1997-11/2002) a 2.06 1.41 146 Log(Annual unpaid and paid New York City parking violations per diplomat, 11/1997-11/2002 )a 4.09 1.85 146 Annual unpaid New York City parking violations per diplomat, 11/2002-12/2005 a 0.26 0.34 146 log(Diplomats in the country U.N. Mission, 1998) b 2.21 0.69 146 log(1+Number of license plates registered to the country’s U.N. Mission, 2006)c 1.97 0.90 146 Country corruption index, 1998 d -0.01 1.01 146 log(Per capita income, 1998 US$) e 7.39 1.58 146 Average government wage / Country per capita income, early 1990sf 2.83 2.38 92 log(Weighted distance between populations) g 9.11 0.42 146 Proportion Muslim population, 2004 h 0.28 0.37 146 Unfavorable views towards the United States i 2.23 0.49 42 Unfavorable views towards other countries i 2.25 0.51 42 Received U.S. economic aid, 1998 j 0.69 0.47 144 Received U.S. military aid, 1998 j 0.63 0.48 144 Panel B: Diplomat-level data Monthly New York City parking violations, 11/1997-11/2002 a 0.32 0.65 14408 Length of time at the U.N. Mission in New York City (in months) b 24.98 16.07 14408
Sources: a New York City, Parking Violations Database (provided to the authors by the New York City Department of Finance in December 2005). b United Nations Bluebook 1998. c U.S. Department of State Office of Foreign Missions (provided to the authors by Deputy Director Murray Smith in April 2006). d Composite index from Kaufmann et al. (2005), but here higher values indicate more corruption. e World Development Indicators (2005). f Schiavo-Campo et al. (1999); exact year differs by country. g Mayer and Zignago (2005) h US Department of State (2004) i Pew Global Attitudes Survey 2002. j Data from Kuziemko and Werker (2006).

27
Table 3: Country Characteristics and Unpaid New York City Parking Violations (in logs), 11/1997 to 11/2002 (pre-enforcement)
Dependent variable:
log (1 + Annual NYC Parking Violations) (1) (2) (3) (4) (5) log(Diplomats) 0.86*** 1.04*** 0.56 1.28*** 1.12*** (0.24) (0.24) (0.36) (0.31) (0.26) Country corruption index, 1998 1.04*** 0.56** 0.62** 0.92*** 0.72*** (0.15) (0.24) (0.24) (0.33) (0.25) log(Per capita income, 1998 US$) -0.42** -0.36** -0.19 -0.23 (0.16) (0.16) (0.25) (0.19) log(1 + Diplomatic Vehicles) 0.54** (0.26) Average government wage / country per capita income 0.03 (0.11) Africa region indicator variable 2.92*** (0.67) Asia region indicator variable 2.23*** (0.72) Europe region indicator variable 2.30*** (0.66) Latin America region indicator variable 1.60** (0.77) Middle East region indicator variable 2.83*** (0.89) Oceania region indicator variable 1.99** (0.91) Observations 146 146 146 92 146 R2 0.23 0.26 0.26 0.33 0.34 Mean of dependent variable (s.d.) 3.8 (2.1) 3.8 (2.1) 3.8 (2.1) 3.8 (2.2) 3.8 (2.1)
Notes: OLS regressions, White robust standard errors. Statistically significantly different than zero at 90% (*), 95% (**), 99% (***) confidence.

28
Table 4: Country Characteristics and Unpaid New York City Parking Violations per Diplomat (in logs), 11/1997 to 11/2002 (pre-enforcement) –
alternative specification
Dependent variable:
log (1 + Annual NYC Parking Violations/Diplomat) (1) (2) (3) (4) Country corruption index, 1998 0.61*** 0.27* 0.49** 0.38** (0.08) (0.15) (0.21) (0.17) log(Per capita income, 1998 US$) -0.27** -0.08 -0.11 (0.11) (0.17) (0.13) Average government wage / country per capita income 0.05 (0.08) Region indicator variables No No No Yes Observations 146 146 92 146 R2 0.19 0.22 0.25 0.32 Mean of dependent variable (s.d.) 2.1 (1.4) 2.1 (1.4) 2.0 (1.4) 2.1 (1.4)
Notes: OLS regressions, White robust standard errors. Statistically significantly different than zero at 90% (*), 95% (**), 99% (***) confidence.

29
Table 5: Unpaid Parking Violations over Time for Diplomats, 11/1997 to 11/2002 (pre-enforcement)
Dependent variable:
log(1 + Monthly NYC Parking Violations) Any Monthly NYC Parking Violation
(1) (2) (3) (4) (5) Log(Length of time in New York City (in months)) 0.083*** 0.185*** 0.185*** 0.147*** 0.146*** (0.020) (0.024) (0.024) (0.015) (0.015) Log(Length of time in New York City) * Country corruption index, 1998 0.030** 0.026*** (0.014) (0.008) Month Fixed Effects Yes Yes Yes Yes Yes Diplomat Fixed Effects No Yes Yes Yes Yes Observations 14408 14408 14408 14408 14408 R2 0.03 0.44 0.45 0.32 0.32 Mean of dependent variable (s.d.) 0.32 (0.65) 0.32 (0.65) 0.32 (0.65) 0.32 (0.65) 0.32 (0.65)
Notes: OLS regressions, White robust standard errors with clustering by diplomat. Statistically significantly different than zero at 90% (*), 95% (**), 99% (***) confidence. Observations are at the diplomat-month level.

30
Table 6: Unpaid Parking Violations and Proximity to the U.S., U.S. Aid, and Affinity with the U.S., 11/1997 to 11/2002 (pre-enforcement)
Dependent variable:
log (1 + Annual NYC Parking Violations) (1) (2) (3) (4) (5) log(Diplomats) 1.15*** 0.46 0.41 1.11*** 1.13*** (0.25) (0.51) (0.53) (0.27) (0.26) Country corruption index, 1998 0.72*** 0.72 0.83 0.70*** 0.71*** (0.24) (0.52) (0.56) (0.25) (0.25) log(Per capita income, 1998 US$) -0.24 -0.46 -0.42 -0.32 -0.23 (0.19) (0.35) (0.36) (0.22) (0.19) log(Weighted distance of population from U.S.) 1.65*** (0.58) Unfavorable views towards the U.S. (Pew) 2.55** 2.28* (1.14) (1.27) Unfavorable views towards other countries (Pew) 0.57 (0.66) Received U.S. economic aid -0.70 (0.52) Received U.S. military aid 0.56 (0.35) Proportion Muslim population 0.20 (0.47) Region indicator variables Yes Yes Yes Yes Yes Observations 146 42 42 144 146 R2 0.37 0.47 0.48 0.35 0.34 Mean of dependent variable (s.d.) 3.8 (2.1) 4.4 (2.1) 4.4 (2.1) 3.8 (2.1) 3.8 (2.1)
Notes: OLS regressions, White robust standard errors. Statistically significantly different than zero at 90% (*), 95% (**), 99% (***) confidence.

31
Table 7: Country Characteristics and Unpaid New York City Parking Violations (in logs), 11/2002 to 12/2005 (post-enforcement)
Dependent variable:
log (1 + Annual NYC Parking Violations) (1) (2) (3) (4) log(Diplomats) 0.42*** 0.52*** 0.24 0.53*** (0.11) (0.12) (0.29) (0.13) Country corruption index, 1998 0.30*** 0.33*** 0.41 0.40*** (0.07) (0.11) (0.31) (0.12) log(Per capita income, 1998 US$) 0.04 0.01 -0.05 (0.09) (0.20) (0.10) Unfavorable views towards the U.S. (Pew) 1.29*** (0.40) Received U.S. economic aid -0.53** (0.23) Received U.S. military aid 0.08 (0.17) Region indicator variables No Yes Yes Yes Observations 146 146 42 144 R2 0.14 0.24 0.34 0.27 Mean of dependent variable (s.d.) 1.1 (0.9) 1.1 (0.9) 1.3 (0.9) 1.1 (0.9)
Notes: OLS regressions, White robust standard errors. Statistically significantly different than zero at 90% (*), 95% (**), 99% (***) confidence.

32
Table 8: Unpaid New York City Parking Violations and Muslim Population after September 11, 2001
Dependent variable:
log(1 + Monthly NYC Parking Violations) (1) (2) (3) Post 9/11 * Proportion Muslim population -0.32** -0.48** -0.32** (0.15) (0.19) (0.16) Post 9/11 * log(Per capita income, 1998 US$) -0.007 (0.053) Country Fixed Effects Yes Yes Yes Month Fixed Effects Yes Yes Yes Country-specific time trends No Yes No Observations 7493 7493 7493 R2 0.78 0.82 0.78 Mean of dependent variable (s.d.) 2.7 (1.7) 2.7 (1.7) 2.7 (1.7)
Notes: OLS regressions, White robust standard errors with clustering by country. Statistically significantly different than zero at 90% (*), 95% (**), 99% (***) confidence. Observations are at the country-month level, for the period December, 1997 – November, 2002.

33
Appendix Table A1: Country Characteristics and Unpaid New York City Parking Violations (in logs), 11/1997 to 11/2002 (pre-enforcement)
– tobit specifications
Dependent variable:
log (1 + Annual NYC Parking Violations) (1) (2) (3) (4) log(Diplomats) 0.89*** 1.11*** 1.35*** 1.17*** (0.27) (0.28) (0.35) (0.27) Country corruption index, 1998 1.19*** 0.63** 1.05** 0.83*** (0.19) (0.29) (0.40) (0.30) log(Per capita income, 1998 US$) -0.48** -0.22 -0.27 (0.20) (0.31) (0.22) Average government wage / country per capita income 0.01 (0.11) Region indicator variables No No No Yes Observations 146 146 92 146 Mean of dependent variable (s.d.) 3.8 (2.1) 3.8 (2.1) 3.8 (2.2) 3.8 (2.1)
Notes: Tobit specifications. Statistically significantly different than zero at 90% (*), 95% (**), 99% (***) confidence.
34
Appendix Table A2: Total New York City Parking Violations, paid and unpaid (in logs), 11/1997 to 11/2002 (pre-enforcement)
Dependent variable:
log (1 + Annual NYC Parking Violations) (1) (2) (3) (4) log(Diplomats) 1.00*** 1.12*** 1.38*** 1.19*** (0.21) (0.21) (0.28) (0.22) Country corruption index, 1998 0.96*** 0.62*** 1.14*** 0.73*** (0.15) (0.22) (0.31) (0.23) log(Per capita income, 1998 US$) -0.29** 0.05 -0.14 (0.15) (0.24) (0.17) Average government wage / country per capita income 0.15** (0.07) Region indicator variables No No No Yes Observations 146 146 92 146 R2 0.27 0.29 0.45 0.41 Mean of dependent variable (s.d.) 4.1 (1.8) 4.1 (1.8) 4.2 (1.9) 4.1 (1.8)
Notes: OLS regressions, White robust standard errors. Statistically significantly different than zero at 90% (*), 95% (**), 99% (***) confidence.

35
Appendix Table A3: New York City Parking Violations (in logs), egregious violation types, 11/1997 to 11/2002 (pre-enforcement)
Dependent variable:
log (1 + Annual Cross-town Double-parking) Dependent variable:
log (1 + Annual Fire Hydrant Violations) (1) (2) (3) (4) (5) (6) (7) (8) log(Diplomats) 0.48*** 0.55*** 0.68*** 0.62*** 0.74*** 0.85*** 0.94*** 0.92*** (0.15) (0.15) (0.21) (0.17) (0.16) (0.16) (0.22) (0.17) Country corruption index, 1998 0.43*** 0.24* 0.40** 0.30* 0.62*** 0.30** 0.50** 0.42** (0.08) (0.13) (0.18) (0.15) (0.09) (0.15) (0.21) (0.18) log(Per capita income, 1998 US$) -0.17* -0.09 -0.11 -0.27** -0.15 -0.20 (0.09) (0.15) (0.11) (0.11) (0.16) (0.13) Average government wage / country per capita income 0.03 0.01 (0.06) (0.06) Region indicator variables No No No Yes No No No Yes Observations 146 146 92 146 146 146 92 146 R2 0.14 0.16 0.22 0.27 0.23 0.26 0.32 0.34 Mean of dependent variable (s.d.) 1.1 (1.2) 1.1 (1.2) 1.1 (1.2) 1.1 (1.2) 1.7 (1.4) 1.7 (1.4) 1.7 (1.4) 1.7 (1.4)
Notes: OLS regressions, White robust standard errors. Statistically significantly different than zero at 90% (*), 95% (**), 99% (***) confidence.

36
Figure 1: Total Monthly New York City Parking Violations by Diplomats, 1997-2005 (log scale)
1
10
100
1,000
10,000
Mon
thly
Unp
aid
Park
ing
Viol
atio
ns
11/1997 9/2001 11/2002 11/2005
9/11 Attacks
Increase in Enforcement

37
Figure 2: Country corruption and Unpaid New York City Parking Violations per diplomat (in logs), 11/1997 to 11/2002 (pre-enforcement)
KWT
EGY TCDSDNBGR MOZALBAGOSEN
PAKCIV ZMBMARETH NGASYRBENZWE CMRYUGBHR BDIMLI IDNGNBZAFSAU BGDBRA
SLEDZATHAKAZMUS NERCZE LSOBWABTN LKACHL TUN NPLIRNFJIITA LBRMWI PRYRWA UKRESP PHL GHAMRT GINEST MNG ARMCRI COMTGOVNMGEOCHN YEMVENPRT UZBMDGTZALBYKENCOG
HRV DJISVKFRA IND LAO TKMPNGHNDSVN KGZNICURY SWZ TJKNAM MEXARGSGP ROM UGAHUN MKDBOLPER HTIJOR BLRBELCYP GUYAUT GABRUSLTU SLVPOL GMBMYS TTO LBNDEU ERI MDA
KORDOMFIN GTMNZL GBRNLD AREAUS AZEBFACAFCAN COLDNK ECUGRCIRL ISR JAMJPN LVANOR OMN PANSWE TUR0
24
6
-3 -2 -1 0 1 2Country corruption measure
NYC Violations/Diplomat (logs) Fitted values
Notes: Country abbreviations are presented in Table 1. The line is the quadratic regression fit. The y-axis is log(1+Annual NYC parking violations / Diplomat).

38
Data Appendix
(1) New York City Diplomatic Parking Violation Data The New York City Department of Finance supplied listings of all unpaid parking violations of U.N. Missions. The violations covered the period from November 24, 1997 to November 21, 2005. In order to appear in the database, a violation had to go unpaid for at least 100 days. Data were at the level of the violation, and included the following entries for each violation: • Summons: unique identification number for the violation • License plate number of the violating car • The person to whom the violating car was registered, often the mission itself • Time of violation: included both hour and minute as well as calendar date • Type of violation, e.g. “FIRE HYDRANT” or “EXPIRED METER” • Street address of violation • Initial dollar value of fine issued • Additional dollar penalty for having not paid the fine on time • Amount paid towards the fine, generally zero • Name of country to which the car is registered Data on U.N. diplomats’ paid parking violations (violations that did not go into arrears) were made available to us in aggregate form by the New York City Department of Finance. For each country, we were given statistics for the pre-enforcement period of November 24, 1997 – October 31, 2002 and the post-enforcement period of November 1, 2002 – November 21, 2005.
(2) Country Corruption Index We use the aggregate measure of Kaufmann et al (2005) for the year 1998. Data are available at: http://www.worldbank.org/wbi/governance/data.html#dataset
(3) World Region Classification United Nations region code data, available at http://unstats.un.org/unsd/methods/m49/m49regin.htm, was used to classify countries into the following regions: (1) North America (including Carribbean), (2) South America, (3) Europe, (4) Asia, (5) Oceania, (6) Africa, (7) Middle East. The Middle East was defined as: Egypt, Iran, Pakistan, Bahrain, Cyprus, Iraq, Israel, Jordan, Kuwait, Lebanon, Occupied Palestinian Territory, Oman, Qatar, Saudi Arabia, Syria, Turkey, United Arab Emirates, and Yemen.
(4) International Trade Data Trade data (utilized only in unreported regressions) are taken from http://dataweb.usitc.gov/
(5) Geographic Distance From U.S. Distance from the United States is taken from Mayer and Zignago (2005). Their measure uses city-level data to assess the geographic distribution of population inside each nation. The idea is to calculate distance between two countries based on bilateral distances between the largest cities of those two countries, those inter-city distances being weighted by the share of the city in the overall country’s population. In practice, nearly identical results are obtained using the distance of countries’ capitals from Washington, D.C.
(6) United Nations Bluebooks The United Nations issues its list of mission personnel, or Bluebook, twice yearly. We utilize edition numbers 280 (May 1998) through 288 (August 2002). Documents were retrieved from the UN Official Document System (ODS), available at http://documents.un.org/advance.asp. Searching for the symbol
39
ST/SG/SER.A/### with truncation turned off returns the relevant Blue Book (where ### is the Blue Book edition number).
(7) Mission Staff Counts Edition 280 (May 1998) was checked by hand to count the mission staff and spouses for each country in the Blue Book, producing the following variables. • Mission: Indicator variable indicating whether the country had a U.N. mission • Staff: Simple count of staff. Staff members are always listed with their surnames in bold
(8) Longitudinal Staff Data Bluebook edition numbers 278 through 288 were converted into plain text format. A name-matching program then checked these text files against a list of names extracted from the NYC parking violations data. Names were converted to regular expressions to improve match quality (since names from parking violation data often used forward slashes in place of apostrophes and dashes). A name was considered to have matched (and thus to have been present at the date of the Bluebook’s publication) if its first name and last name appeared on the same line in the Bluebook. If a name matched more one time in the same Blue Book, its matches were checked by hand. The matching program also recorded the country of the mission in which the match was found. This country was checked against the country as specified by the parking violation data to verify match accuracy. Finally, in a small number of cases (20 diplomats), we found that there were gaps in the individual’s appearance in the Blue Book, even though in some cases parking violations in vehicles registered to these individuals took place during the purported absence. We omit these few observations from our analyses, but in practice their inclusion does not affect the results (not shown).
(9) Diplomatic Vehicles Data were provided by Murray Smith, Deputy Director at the U.S. State Department’s Office of Foreign Missions in April 2006. These data report counts of the number of vehicles with diplomatic license plates registered to each mission in early 2006.
(10) Muslim Population Data were taken from the religious demography sections of the U.S. State Department's 2004 International Religious Freedom Report, available online at http://www.state.gov/g/drl/rls/irf/2004/
(11) US Military/Economic Foreign Aid Data These data were provided to us by Iliana Kuziemko and Eric Werker. We utilize data on aid flows from 1998. See Kuziemko and Werker (2006) for details.
(12) London Parking Violations Data Unpaid parking violations of embassy diplomats in London are reported annually in the House of Commons Hansard Written Notes, for all embassies with more than ten violations in the preceding year. We use data from 1998-2002 to best match our U.N. parking violations data. Data may be obtained by searching the parliamentary records for diplomatic parking violations at http://www.publications.parliament.uk/cgi-bin/semaphoreserver?DB=semukparl&FILE=search
(13) London Embassy Diplomatic Staff Counts Data were obtained for 1998 from the London Diplomatic List, which is published annually and records all the representatives of foreign states and Commonwealth countries in London. It is compiled by the British Foreign & Commonwealth Office. Information on ordering is available at http://www.fco.gov.uk.