cultural diversity in management, firm...
TRANSCRIPT

CULTURAL DIVERSITY IN MANAGEMENT, FIRMPERFORMANCE, AND THE MODERATING ROLE OFENTREPRENEURIAL ORIENTATION DIMENSIONS
ORLANDO C. RICHARDUniversity of Texas at Dallas
TIM BARNETTMississippi State University
SEAN DWYERLouisiana Tech University
KEN CHADWICKNicholls State University
Extending previous theorizing on cultural diversity’s organizational effects by inte-grating value-in-diversity and social identity perspectives with the framework ofBlau’s (1977) theory of heterogeneity, we hypothesized curvilinear relationships be-tween racial and gender diversity in management and firm performance. We evaluatedrelationships within the context of firm-level entrepreneurial orientation. Our empir-ical study indicated complex relationships among study variables. It revealed thatinnovativeness positively and risk taking negatively moderated nonlinear relationshippatterns for both racial and gender heterogeneity. Research and practical implicationsare discussed.
In the United States, women hold more than 40percent of the administrative and managerial jobs,and about 17 percent of “officials and managers”are racial minorities (Equal Employment Opportu-nity Commission [EEOC], 2002). Despite thesefacts, there has been little research on the perfor-mance effects of racial and gender heterogeneity inmanagement groups (Williams & O’Reilly, 1998).Instead, management-level diversity studies usu-ally focus on nonvisible types of diversity, such asthe functional background and job tenure of topmanagers (Finkelstein & Hambrick, 1996). Culturaldiversity, however, also encompasses differencesin visible characteristics such as race and gender(Cox, 1994). Several studies of diversity have foundthat it has positive effects at the individual andsmall-group levels (Cox, Lobel, & McLeod, 1991;Watson, Kumar, & Michaelson, 1993), but othershave concluded that heterogeneous groups performless well than homogeneous groups (Pelled, Eisen-hardt, & Xin, 1999; Tsui, Egan, & O’Reilly, 1992).Existing theories do not appear to offer a sufficientexplanation for these inconsistent findings.
We sought to integrate existing theoretical expla-nations (value-in-diversity, social identity, andself-categorization theories) within the context ofBlau’s (1977) theory of heterogeneity and suggestthat the relationship between cultural diversity andperformance is more complex than previous mod-els have suggested. Specifically, we extended ouranalysis beyond simple linear relationships andinvestigated potential curvilinear and contingencyrelationships. We added to the research concerningcultural diversity among managers by examiningtwo visible components of diversity—race and gen-der. Further, instead of analyzing diversity’s effectsat an individual or group level of analysis, we ex-amined how heterogeneity within management af-fects firm performance.
THEORETICAL DEVELOPMENT ANDREFINEMENT
Cultural Diversity in Management and FirmPerformance
Cultural diversity has been studied in both labo-ratory and field settings. In general, lab studies,grounded in the value-in-diversity perspective,have indicated that diversity within work groupsincreases their effectiveness (Cox et al., 1991;
We would like to thank Associate Editor MarshallSchminke and three anonymous AMJ reviewers for theirhelpful comments.
� Academy of Management Journal2004, Vol. 47, No. 2, 255–266.
255
Watson et al., 1993). In contrast, field studies,guided by social identity and related self-categori-zation theories, have suggested that diversity is as-sociated with negative performance outcomes(Pelled et al., 1999; Tsui et al., 1992). In this sec-tion, we integrate predictions from these two per-spectives to provide a theoretical framework basedon Blau’s (1977) theory of heterogeneity.
Blau (1977) suggested that firms with differentlevels of cultural diversity experience dissimilardynamics and organizational outcomes. Withinculturally homogeneous groups, members will tendto communicate with one another more often andin a greater variety of ways, perhaps because theyshare worldviews and a unified culture resultingfrom in-group attachments and shared perceptions(Earley & Mosakowski, 2000). According to socialidentity theory, cultural homogeneity in manage-ment groups may thus increase satisfaction andcooperation and decrease emotional conflict (Tajfel& Turner, 1985; Williams & O’Reilly, 1998). Sincehomogeneous groups do not have significant cul-tural barriers to social intercourse, positive socialassociations and in-group social contacts are fos-tered (Blau, 1977). This formulation suggests thatdeleterious social identity and self-categorizationprocesses will not inhibit an organization with aculturally homogeneous management group.
As cultural diversity increases, however, socialcomparison and categorization processes occur,and in-groups/out-groups and cognitive biases mayemerge, creating barriers to social intercourse(Blau, 1977; Smith, Smith, Olian, Sims, O’Bannon,& Scully, 1994; Tsui et al., 1992). Therefore, asheterogeneity in management groups reaches mod-erate levels, the psychological processes associatedwith social identity theory and self-categorizationprocesses may be more likely to occur. These pro-cesses generate individual behaviors such as soli-darity with others in a race- or gender-based group,conformity to the norms of one’s group, and dis-crimination against out-groups (Tajfel & Turner,1985). To the extent that multiple subcultures existin moderately heterogeneous groups, conflict is po-tentially maximized (Earley & Mosakowski, 2000;Lau & Murnighan, 1998), and intergroup interac-tion and communication may be blocked (Alex-ander, Nuchols, Bloom, & Lee, 1995; Blau, 1977).For example, Earley and Mosakowski (2000) foundthat moderately heterogeneous groups exhibited re-lationship conflict, communication problems, andlow identification of members with an overall workgroup. Within management groups, the difficultiesassociated with moderate levels of heterogeneitymay lead to negative performance outcomes for anorganization.
Although moderate levels of cultural heterogene-ity may create barriers to effective social inter-course, high levels of heterogeneity could actuallyweaken these barriers (Blau, 1977), since groupmembers will be more evenly diffused over thecategories of cultural diversity, and in-group/out-group identities will be reduced (Alexander et al.,1995). In groups with high levels of cultural heter-ogeneity, casual social contacts and communica-tion are more likely to involve members of differentracial/gender groups. Further, the in-group pres-sures that inhibit social interaction with out-groupmembers should be weakened (Blau, 1977). In man-agement groups with high heterogeneity, out-groupdiscrimination is thus less likely to occur. In fact,few common bases for subgroup formation and so-cial identity are likely to exist in managementgroups with relatively high levels of diversity (Ear-ley & Mosakowski, 2000). In addition, we posit thatthe processes associated with the value-in-diversityparadigm are fully realized within highly diversemanagement groups, which further enhances per-formance (Cox et al., 1991; Watson et al., 1993). Anorganization with high levels of cultural heteroge-neity in management may not be inhibited by socialidentity processes because organization membershave many out-group contacts and may, instead,greatly benefit from a diverse pool of resources.
In sum, in keeping with previous research ex-ploring the nonlinearity of human capital effects(Hitt, Bierman, Shimizu, & Kochhar, 2001), we ex-pected cultural heterogeneity in management toexhibit a U-shaped relationship with firm perfor-mance.
Hypothesis 1. Cultural diversity in manage-ment will have a U-shaped curvilinear rela-tionship to performance.
The Moderating Effects of EntrepreneurialOrientation Dimensions
Entrepreneurial orientation defined. The diver-sity of management groups should be studied in lightof relevant contextual factors (Chatman, Polzer, Bar-sade, & Neale, 1998). Firm strategy (Richard, 2000)and strategy process variables are particularly rele-vant to the study of management diversity, sincestrategy formulation and implementation involve in-dividuals at all levels and across all functional areasof management (Burgelman, 1983).
Entrepreneurial orientation is a firm-level con-struct (Covin & Slevin, 1991) that is closely linkedto strategic management and the strategic decisionmaking process (Birkinshaw, 1997; Burgelman,1983; Kanter, 1982; Lumpkin & Dess, 1996; Naman
256 AprilAcademy of Management Journal

& Slevin, 1993). A firm’s entrepreneurial orienta-tion is its propensity to act autonomously, inno-vate, take risks, and act proactively when con-fronted with market opportunities (Lumpkin &Dess, 1996). Entrepreneurial orientation should bedistinguished from entrepreneurship, which re-lates to new business entry and is concerned pri-marily with questions such as, “What business dowe enter?” and “How do we make the new businesssucceed?” Entrepreneurial orientation is a processconstruct and concerns the “methods, practices,and decision-making styles managers use” (Lump-kin & Dess, 1996: 136). Entrepreneurial orientationis grounded in the strategic choice perspective andconcerns the “intentions and actions of key playersfunctioning in a dynamic generative process”(Lumpkin & Dess, 1996: 136). An entrepreneurialorientation promotes initiative (Burgelman, 1983)and what Birkinshaw (1997) called “dispersed” en-trepreneurship, which is the involvement of multi-ple management levels in the formulation andimplementation of entrepreneurial strategies. Anentrepreneurial orientation is not created or im-posed by top management, but reflects the strategicposture as exhibited by multiple layers of manage-ment (Stevenson & Jarillo, 1990).
Entrepreneurial orientation is conceptualized ashaving anywhere from three to five dimensions,which may vary independently (Lumpkin & Dess,1996) and have different moderating effects on therelationship between management diversity andperformance. An organization could exhibit rela-tively high levels of one or more dimensions and, atthe same time, relatively low levels of other dimen-sions (Lyon, Lumpkin, & Dess, 2000). In our re-search, we focused on the three most commonlycited entrepreneurial orientation dimensions: inno-vativeness, risk taking, and proactiveness. Weviewed the dimensions of entrepreneurial orienta-tion as interacting with cultural diversity to affectfirm performance but saw the moderating effects ofthe dimensions as likely to differ.
The moderating effect of innovativeness. Inno-vativeness reflects the propensity of a firm to ac-tively support new ideas, novelty, experimenta-tion, and creative solutions in pursuit of acompetitive advantage (Lumpkin & Dess, 1996).Conceptually, an innovative strategic posture isthought to be linked to firm performance because itincreases the chances that a firm will realize first-mover advantages and capitalize on emerging mar-ket opportunities (Wiklund, 1999). We believe thathomogeneous management groups will performwell in firms with innovative orientations. Mem-bers of homogeneous management groups are likelyto exploit their shared perceptions and high-quality
communication to respond to their organization’sdemand for novelty and creativity. However, thedevelopment of racial and/or gender diversity inmanagement groups may lead to the formation ofin-groups and out-groups, stronger identification ofmembers with other members of their own race orgender than with the management group, and thusthe potential for poor intergroup communicationand increased conflict. In this paper, we argue thatthese negative effects should be highest at moderatelevels of heterogeneity (Hypothesis 1) becausecategorical groups will be large and concentratedenough to promote in-group identification and out-group bias (Blau, 1977; Earley & Mosakowski,2000). Thus, we would expect the combination ofan innovative strategic posture and relatively mod-erate levels of cultural diversity to lead to the low-est levels of firm performance.
Proponents of cultural diversity have maintainedthat the multiple perspectives and insights a cul-turally diverse workforce provides can foster awide range of creative decision alternatives, effec-tive decision making, and high-quality decisions(Cox, 1994, McLeod, Lobel, & Cox, 1996). In termsof strategy formulation and implementation withinmanagement groups, this value-in-diversity per-spective suggests that the attributes of a heteroge-neous management group enhance the develop-ment of strategic alternatives and promote creativeand effective competitive strategies. As the level ofheterogeneity in a management group reaches rel-atively high levels, group members become moreevenly diffused over the categories of cultural di-versity, and in-group/out-group identities are re-duced by the relatively small sizes of homogeneousgroups (Alexander et al., 1995). Thus, communica-tion and interaction should increase because groupmembers have many out-group contacts (Blau,1977). In firms emphasizing the need for innova-tiveness, such relatively heterogeneous manage-ment groups should be able to effectively respondby taking advantage of diverse backgrounds, per-ceptions, and worldviews without suffering greatlyfrom the aforementioned negative social identityand categorization effects. Thus, we expect thecombination of an innovative strategic posture andrelatively high levels of diversity to have the mostpositive impact on firm performance.
Hypothesis 2. The U-shaped relationship be-tween cultural diversity in management andperformance will be significantly stronger infirms with innovative orientations.
The moderating effects of risk taking and pro-activeness. The risk-taking dimension of strategicposture is a firm’s propensity to take business-
2004 257Richard, Barnett, Dwyer, and Chadwick

related chances with regard to strategic actions inthe face of uncertainty. Proactiveness is its propen-sity to take the initiative to compete aggressivelywith other firms (Covin & Slevin, 1989). A strategicposture emphasizing risk taking and proactivenesssuggests that a management group will need highlevels of trust and interpersonal communication.Both the risk-taking and proactiveness dimensionsof entrepreneurial orientation require a firm tomake quick decisions and aggressively compete byimplementing bold and risky strategies in the faceof uncertainty. Timely risks may be a key factor, asstrategic decision speed has been linked to firmperformance (Eisenhardt, 1989).
Members of homogeneous management groupsmay have fewer cognitive and interpersonal barri-ers to overcome in reaching agreement on aggres-sive and risky strategies (Miller, Burke, & Glick,1998; Watson et al., 1993). However, homogeneousgroups may lack the diverse cognitive perspectivesneeded to recognize strategic opportunities and/orsimultaneously consider alternatives, capacitiesthat are essential for decision speed (Eisenhardt,1989; Judge & Miller, 1991). In sum, culturally ho-mogeneous groups do little for risk-taking and pro-active orientations. In contrast, we posit, a moder-ate level of diversity will benefit firms with suchorientations. Research has shown that up to a cer-tain level, diversity relates to task conflict (Pelled etal., 1999), which is disagreement among membersabout the content of tasks being performed (Jehn,1995). Such conflict is suitable for firms that thriveon risk and proactivity. Thus, we predict that amoderate level of diversity in management is idealin a risky or proactive context. Beyond moderatelevels, however, we expect a different effect. Em-pirical research has suggested that high levels ofdiversity reduce agreement-seeking behaviors andsocial cohesion in the context of strategic decisionmaking (Ferrier, 2001). Other studies have indi-cated that diverse decision-making groups areslower to reach consensus than homogeneousgroups (Watson et al., 1993). Consequently, deci-sion-making speed, as well as a firm’s ability toeffect strategic change, are often impeded (Ham-brick, Cho, & Chen, 1996). These potentially nega-tive consequences suggest that a highly diversemanagement might have difficulty operating suc-cessfully in a context characterized by an emphasison risk taking and proactiveness. Thus, we expectthat risk taking and proactiveness will negativelymoderate the relationship between managementgroup heterogeneity and firm performance. Thecombination of a highly proactive and risk-takingposture and high levels of diversity is likely to havethe most negative impact on firm performance.
This presentation represents a shift from the earliercurvilinear predictions, outlined in Hypotheses 1and 2. The first hypothesis proposes a U-shapedrelationship between diversity in management andperformance, and the second, that the U-shapedrelationship will be stronger for more innovativefirms. However, Hypotheses 3 and 4 differ mark-edly, suggesting an inverted U-shaped relationshipbetween cultural diversity in management and per-formance where a moderate level of diversity isadvantageous for risk-taking and proactive firms.
Hypothesis 3. Firm risk taking will moderatethe curvilinear relationship between culturaldiversity in management and performance insuch a way that low and high, but not moder-ate, levels of diversity will negatively relateto performance, resulting in an invertedU-shaped relationship.
Hypothesis 4. Firm proactiveness will moder-ate the curvilinear relationship between cul-tural diversity in management and perfor-mance in such a way that low and high, but notmoderate, levels of diversity will negatively re-late to performance, resulting in an invertedU-shaped relationship.
METHODOLOGY
Sample
Initially, we obtained a stratified random sampleframe consisting of 700 banks with $100 million orless in total assets, 700 with $100–499 million inassets, and 700 with $500 million or more in assets.We sent questionnaires to the 2,100 bank presi-dents, 535 of whom responded. The bank presi-dents completed items related to their firms’ de-grees of entrepreneurial orientation and providedother data not utilized in the present study. Prior tobeginning the current study, we obtained contactinformation for the senior human resource execu-tives of the 535 banks that responded to the firstsurvey and queried these HR executives regardingthe demographic characteristics of their banks’management. Data were collected for fiscal year1998. One hundred fifty-three of the 535 HR exec-utives provided usable data, resulting in a 29 per-cent response rate. The average number of employ-ees in the banks was 154, and the banks had anaverage of 7 branches. The average bank age was 77years.
Measures
Cultural diversity. Using data provided by theHR executives, we assessed the racial and gender
258 AprilAcademy of Management Journal

heterogeneity of each bank’s management group.Because multiple layers of management are in-volved in the strategic process (Birkinshaw, 1997;Burgelman, 1983), we included senior executiveswho set corporate strategy and policies and themanagers who implemented such policies: middlemanagement, department managers, and salariedsupervisors. To simplify reporting, we providedeach HR executive a blank 1998 EEO-1 StandardForm 100. The “officials and managers” job cate-gory was employed to represent the managementgroup. This job category includes administrativeand managerial personnel who set broad policies,exercise overall responsibility for the execution ofthese policies, and direct individual departmentsor special phases of a firm’s operations (EEOC,2002). The nature of banks requires high interde-pendence among management groups and mem-bers particularly within, but also across, branches.The average management group size was 32.
Blau’s (1977) index of heterogeneity was used todevelop measures of racial (white, black, Hispanic,Asian, and Native American) and gender diversityin management. This procedure was consistentwith previous measurements of diversity (Ham-brick et al., 1996; Richard, 2000). Blau’s index (cal-culated as 1 � �Pi
2, where P is the proportion ofindividuals in a category and i is the number ofcategories) could thus theoretically range from 0 to.80. In our sample, Blau index values for raceranged from 0 to .61. Although we do not explicitlycategorize index values into “low,” “moderate,”and “high” heterogeneity here, Blau index values of.25 or above would reflect relatively high heteroge-neity for this sample and management groups inthe financial industry. To reduce kurtosis andskewness, we used the logarithm of the racial di-versity measure.
For gender heterogeneity, we observed index val-ues from 0 to .50, reflecting the entire feasiblerange. Again, the index values represented a con-tinuous measure. However, as with racial heteroge-neity, Blau index values greater than .25 wouldreflect relatively high levels of heterogeneity. Thetest for normality appeared sufficient for the genderdiversity measure, and thus we did not use anytransformation for this measure. Following the ap-proach of Alexander and colleagues (1995), weused the quadratic terms of both racial and genderheterogeneity to test the curvilinear relationshipbetween heterogeneity and performance.
Entrepreneurial orientation. To measure di-mensions of entrepreneurial orientation, we usedCovin and Slevin’s (1989) nine-item entrepreneur-ial orientation scale, which is intended to assessthree components of firm-level entrepreneurial ori-
entation—innovativeness, risk taking, and proac-tiveness. Previous studies have reported evidenceof reliability and validity for the entrepreneurialorientation scale (e.g., Naman & Slevin, 1993).However, questions remain as to the dimensional-ity of the measure (Knight, 1997; Lumpkin & Dess,2001). We factor-analyzed the component itemswith data collected from the presidents of the 382banks that were not included in the sample for thisstudy, employing a maximum likelihood analysiswith oblique rotation.
In evaluating each item’s factor “loading,” weapplied a relatively stringent rule of thumb, accept-ing an item only if it had a .40 or greater loading ona factor that was also at least .20 greater than itsloading on any other factor. We obtained a two-factor solution. Five items loaded on factor 1. Theseitems addressed risk propensity, environmentalboldness (that is, competitive aggressiveness), ag-gressiveness of decision making, competitive pos-ture, and the degree to which a firm was first tomarket with new services, techniques, and/or tech-nologies. Thus, we interpreted this factor as a risk-taking factor. Two items loaded on an innovative-ness factor, as the items concerned the number ofnew or changed service and product lines a finan-cial institution had introduced in the previous fiveyears. Thus, the factor analysis did not result in aseparate factor for proactiveness. To further inves-tigate the dimensionality of the entrepreneurial ori-entation scale, we performed a confirmatory factoranalysis using the 153 respondents to the presentstudy. The CFA confirmed that the same two-factorsolution fitted the data better (GFI � .91) than ei-ther a one-factor (GFI � .80) or a three-factor (GFI �.86) solution. In view of the results of the factoranalyses, we formed risk-taking and innovativenessmeasures for respondents to the current study bysumming the items comprising each factor and di-viding by the number of items. This calculationresulted in measures with scores ranging from 1 to7, with higher scores indicating a stronger propen-sity to engage in firm-level risk-taking or innovativebehaviors. The Cronbach alphas for the risk-takingand innovativeness scales were .78 and .80, respec-tively, with all corrected item-correlations exceed-ing the .40 threshold.
Firm performance. Productivity, an intermedi-ate output measure, is an important performanceindicator in a bank (Mehra, 1996). Productivity wascalculated as the logarithm of net income per em-ployee (Richard, 2000) for year-end 1998. Returnon equity (averaged for the years 1997 and 1998 toaccount for volatility), our bottom-line measure offinancial performance, is a preferred measure of a
2004 259Richard, Barnett, Dwyer, and Chadwick
bank’s financial performance and overall viability(Hopkins & Hopkins, 1997).
Control variables. Racial heterogeneity and theproportion of whites in management are not syn-onymous. For example, two teams, one with 90percent whites and 10 percent blacks and the otherwith 90 percent Hispanics and 10 percent blacks,would have the same Blau index score. Althoughthe nature of our sample (managers in the bankingindustry) is such that the majority of the manage-ment teams were likely to be predominantly white,including a proportional control variable enabledus to interpret the results of our heterogeneity vari-able with more confidence. Therefore, we con-trolled for the percentage of whites in the manage-ment groups. We also controlled for the percentageof men in the management groups. Another control,firm size, was the logarithm of the total dollar valueof bank assets. We also annualized the percentageof asset growth experienced by the banks for 1997–98. Higher percentages reflected a growth strategy,and negative percentages reflected asset reduction.
RESULTS
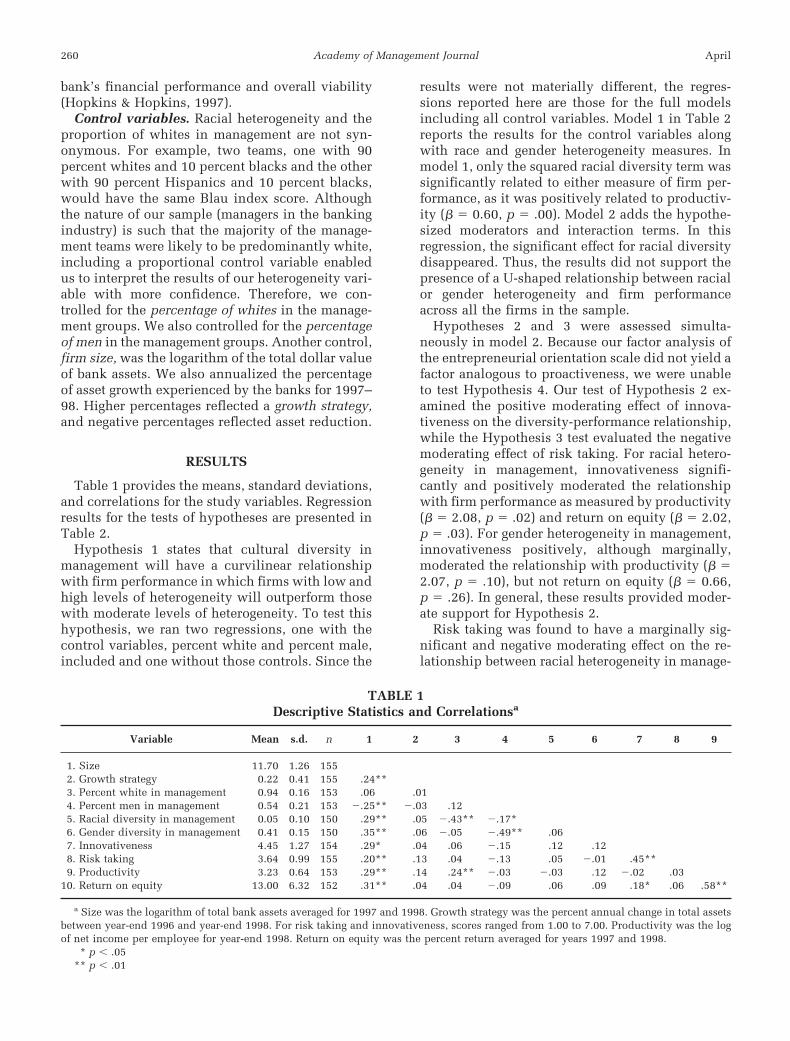
Table 1 provides the means, standard deviations,and correlations for the study variables. Regressionresults for the tests of hypotheses are presented inTable 2.
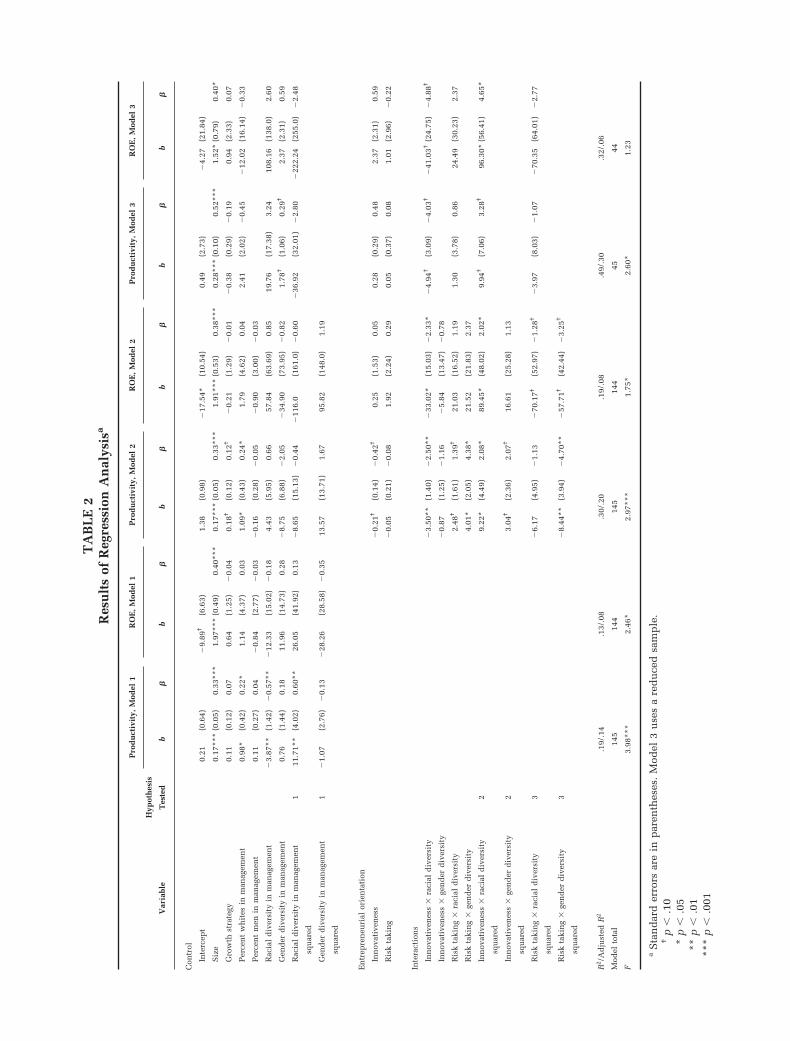
Hypothesis 1 states that cultural diversity inmanagement will have a curvilinear relationshipwith firm performance in which firms with low andhigh levels of heterogeneity will outperform thosewith moderate levels of heterogeneity. To test thishypothesis, we ran two regressions, one with thecontrol variables, percent white and percent male,included and one without those controls. Since the
results were not materially different, the regres-sions reported here are those for the full modelsincluding all control variables. Model 1 in Table 2reports the results for the control variables alongwith race and gender heterogeneity measures. Inmodel 1, only the squared racial diversity term wassignificantly related to either measure of firm per-formance, as it was positively related to productiv-ity (� � 0.60, p � .00). Model 2 adds the hypothe-sized moderators and interaction terms. In thisregression, the significant effect for racial diversitydisappeared. Thus, the results did not support thepresence of a U-shaped relationship between racialor gender heterogeneity and firm performanceacross all the firms in the sample.
Hypotheses 2 and 3 were assessed simulta-neously in model 2. Because our factor analysis ofthe entrepreneurial orientation scale did not yield afactor analogous to proactiveness, we were unableto test Hypothesis 4. Our test of Hypothesis 2 ex-amined the positive moderating effect of innova-tiveness on the diversity-performance relationship,while the Hypothesis 3 test evaluated the negativemoderating effect of risk taking. For racial hetero-geneity in management, innovativeness signifi-cantly and positively moderated the relationshipwith firm performance as measured by productivity(� � 2.08, p � .02) and return on equity (� � 2.02,p � .03). For gender heterogeneity in management,innovativeness positively, although marginally,moderated the relationship with productivity (� �2.07, p � .10), but not return on equity (� � 0.66,p � .26). In general, these results provided moder-ate support for Hypothesis 2.
Risk taking was found to have a marginally sig-nificant and negative moderating effect on the re-lationship between racial heterogeneity in manage-
TABLE 1Descriptive Statistics and Correlationsa
Variable Mean s.d. n 1 2 3 4 5 6 7 8 9
1. Size 11.70 1.26 1552. Growth strategy 0.22 0.41 155 .24**3. Percent white in management 0.94 0.16 153 .06 .014. Percent men in management 0.54 0.21 153 �.25** �.03 .125. Racial diversity in management 0.05 0.10 150 .29** .05 �.43** �.17*6. Gender diversity in management 0.41 0.15 150 .35** .06 �.05 �.49** .067. Innovativeness 4.45 1.27 154 .29* .04 .06 �.15 .12 .128. Risk taking 3.64 0.99 155 .20** .13 .04 �.13 .05 �.01 .45**9. Productivity 3.23 0.64 153 .29** .14 .24** �.03 �.03 .12 �.02 .03
10. Return on equity 13.00 6.32 152 .31** .04 .04 �.09 .06 .09 .18* .06 .58**
a Size was the logarithm of total bank assets averaged for 1997 and 1998. Growth strategy was the percent annual change in total assetsbetween year-end 1996 and year-end 1998. For risk taking and innovativeness, scores ranged from 1.00 to 7.00. Productivity was the logof net income per employee for year-end 1998. Return on equity was the percent return averaged for years 1997 and 1998.
* p � .05** p � .01
260 AprilAcademy of Management Journal
TA
BL
E2
Res
ult
sof
Reg
ress
ion
An
alys
isa
Var
iabl
e
Hyp
oth
esis
Tes
ted
Pro
du
ctiv
ity,
Mod
el1
RO
E,
Mod
el1
Pro
du
ctiv
ity,
Mod
el2
RO
E,
Mod
el2
Pro
du
ctiv
ity,
Mod
el3
RO
E,
Mod
el3
b�
b�
b�
b�
b�
b�
Con
trol
Inte
rcep
t0.
21(0
.64)
�9.
89†
(6.6
3)1.
38(0
.98)
�17
.54*
(10.
54)
0.49
(2.7
3)�
4.27
(21.
84)
Siz
e0.
17**
*(0
.05)
0.33
***
1.97
***
(0.4
9)0.
40**
*0.
17**
*(0
.05)
0.33
***
1.91
***
(0.5
3)0.
38**
*0.
28**
*(0
.10)
0.52
***
1.52
*(0
.79)
0.40
*
Gro
wth
stra
tegy
0.11
(0.1
2)0.
070.
64(1
.25)
�0.
040.
18†
(0.1
2)0.
12†
�0.
21(1
.29)
�0.
01�
0.38
(0.2
9)�
0.19
0.94
(2.3
3)0.
07
Per
cen
tw
hit
esin
man
agem
ent
0.98
*(0
.42)
0.22
*1.
14(4
.37)
0.03
1.09
*(0
.43)
0.24
*1.
79(4
.62)
0.04
2.41
(2.0
2)�
0.45
�12
.02
(16.
14)
�0.
33
Per
cen
tm
enin
man
agem
ent
0.11
(0.2
7)0.
04�
0.84
(2.7
7)�
0.03
�0.
16(0
.28)
�0.
05�
0.90
(3.0
0)�
0.03
Rac
ial
div
ersi
tyin
man
agem
ent
�3.
87**
(1.4
2)�
0.57
**�
12.3
3(1
5.02
)�
0.18
4.43
(5.9
5)0.
6657
.84
(63.
69)
0.85
19.7
6(1
7.38
)3.
2410
8.16
(138
.0)
2.60
Gen
der
div
ersi
tyin
man
agem
ent
0.76
(1.4
4)0.
1811
.96
(14.
73)
0.28
�8.
75(6
.88)
�2.
05�
34.9
0(7
3.95
)�
0.82
1.78
†(1
.06)
0.29
†2.
37(2
.31)
0.59
Rac
ial
div
ersi
tyin
man
agem
ent
squ
ared
111
.71*
*(4
.02)
0.60
**26
.05
(41.
92)
0.13
�8.
65(1
5.13
)�
0.44
�11
6.0
(161
.0)
�0.
60�
36.9
2(3
2.01
)�
2.80
�22
2.24
(255
.0)
�2.
48
Gen
der
div
ersi
tyin
man
agem
ent
squ
ared
1�
1.07
(2.7
6)�
0.13
�28
.26
(28.
58)
�0.
3513
.57
(13.
71)
1.67
95.8
2(1
48.0
)1.
19
En
trep
ren
euri
alor
ien
tati
on
Inn
ovat
iven
ess
�0.
21†
(0.1
4)�
0.42
†0.
25(1
.53)
0.05
0.28
(0.2
9)0.
482.
37(2
.31)
0.59
Ris
kta
kin
g�
0.05
(0.2
1)�
0.08
1.92
(2.2
4)0.
290.
05(0
.37)
0.08
1.01
(2.9
6)�
0.22
Inte
ract
ion
s
Inn
ovat
iven
ess
�ra
cial
div
ersi
ty�
3.50
**(1
.40)
�2.
50**
�33
.02*
(15.
03)
�2.
33*
�4.
94†
(3.0
9)�
4.03
†�
41.0
3†(2
4.75
)�
4.88
†
Inn
ovat
iven
ess
�ge
nd
erd
iver
sity
�0.
87(1
.25)
�1.
16�
5.84
(13.
47)
�0.
78
Ris
kta
kin
g�
raci
ald
iver
sity
2.48
†(1
.61)
1.39
†21
.03
(16.
52)
1.19
1.30
(3.7
8)0.
8624
.49
(30.
23)
2.37
Ris
kta
kin
g�
gen
der
div
ersi
ty4.
01*
(2.0
5)4.
38*
21.5
2(2
1.83
)2.
37
Inn
ovat
iven
ess
�ra
cial
div
ersi
ty
squ
ared
29.
22*
(4.4
9)2.
08*
89.4
5*(4
8.02
)2.
02*
9.94
†(7
.06)
3.28
†96
.30*
(56.
41)
4.65
*
Inn
ovat
iven
ess
�ge
nd
erd
iver
sity
squ
ared
23.
04†
(2.3
6)2.
07†
16.6
1(2
5.28
)1.
13
Ris
kta
kin
g�
raci
ald
iver
sity
squ
ared
3�
6.17
(4.9
5)�
1.13
�70
.17†
(52.
97)
�1.
28†
�3.
97(8
.03)
�1.
07�
70.3
5(6
4.01
)�
2.77
Ris
kta
kin
g�
gen
der
div
ersi
ty
squ
ared
3�
8.44
**(3
.94)
�4.
70**
�57
.71†
(42.
44)
�3.
25†
R2 /A
dju
sted
R2
.19/
.14
.13/
.08
.30/
.20
.19/
.08
.49/
.30
.32/
.06
Mod
elto
tal
145
144
145
144
4544
F3.
98**
*2.
46*
2.97
***
1.75
*2.
60*
1.23
aS
tan
dar
der
rors
are
inp
aren
thes
es.
Mod
el3
use
sa
red
uce
dsa
mp
le.
†p
�.1
0*
p�
.05
**p
�.0
1**
*p
�.0
01

ment and performance for return on equity (� ��1.28, p � .09), but not productivity (� � �1.13,p � .11). Stronger results emerged for gender het-erogeneity, with significant findings for productiv-ity (� � �4.70, p � .02) and marginally significantfindings for return on equity (� � �3.25, p � .09).Thus, the results provided moderate support forHypothesis 3 as well.
Because of the relatively low level of racialheterogeneity in the majority of the managementgroups in our sample, our data related to thisvariable were skewed (more values were close to0, representing homogeneity, than to .80, repre-senting heterogeneity). Violation of normality as-sumptions impedes the interpretation of results,so we duplicated the racial diversity analysis in asample subset that was normally distributed,with racial heterogeneity ranging from low tohigh. The results were similar to those for the fullsample of firms. Subset results in Table 2 (model3) indicated general support for Hypothesis 2,which further increases our confidence in thefull-sample findings.
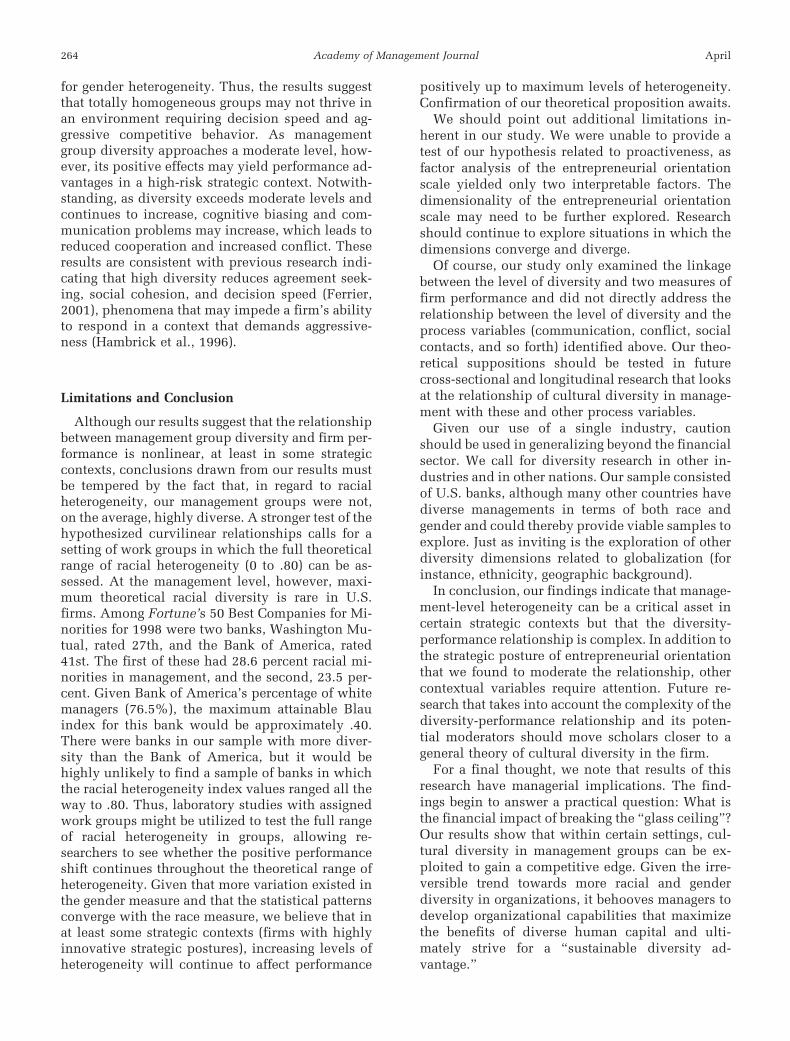
For clarity, we developed graphs of some of theabove moderating effects, which are shown in Fig-ures 1–2. Because of the generally consistent re-sults across both race and gender and the morepowerful statistical results related to race wheninnovativeness was a moderator, in Figure 1 weillustrate the joint effect of racial heterogeneity andinnovativeness on the productivity performancemeasure. We divided the data set into high-innova-tion companies (scoring one standard deviationabove the mean) and low-innovation companies
(scoring one standard deviation below the mean).As Figure 1 demonstrates, the relationship of racialdiversity in management with productivity variesin form according to a firm’s level of innovative-ness. The high-innovativeness curve has a negativeslope as racial diversity in a firm’s managementteam moves from homogeneity through moderateheterogeneity. However, in the high-innovative-ness firms, there is a dramatic positive slope onceracial heterogeneity exceeds about .25 on the Blauindex.
Although only marginal support was found forthe impact of risk taking on the relationship be-tween racial diversity and performance, the find-ings are more robust for gender diversity. There-fore, in Figure 2, we graphed the gender resultsalong the productivity measure at both high andlow levels of risk taking (one standard deviationabove and below the mean). The curvilinear rela-tionship between gender heterogeneity and firmperformance varied according to our predictions. Inhigh-risk-taking firms, there was a definite invertedU-shaped relationship between gender diversityand performance, as firms with homogeneous man-agement groups and very heterogeneous manage-ment groups performed less well than firms withmoderately heterogeneous management groups. Asa whole, the results supported our contention thatrisk taking would emerge as a negative moderatorof the diversity-performance relationship. Our re-sults revealed the complexity of the relationshipsbut were generally supportive of the moderatinghypotheses.
FIGURE 1Interaction Effects of Racial Diversity in Management and Innovativeness
262 AprilAcademy of Management Journal

DISCUSSION
Overview
We hope that this study will represent both adeparture and a fresh beginning in the study of thediversity-performance relationship, particularlyamong managers. We believe our study makes threenoteworthy contributions. One contribution of ourstudy is its attempt to offer a “third-way” theoreti-cal perspective on the diversity-performance relation-ship, as we depart from both the “diversity equalsbetter performance” and “diversity equals poorer per-formance” arguments that have dominated the litera-ture. Our theoretical framework, grounded in Blau’s(1977) theory of heterogeneity and incorporating no-tions from the value-in-diversity, social identity, andsocial categorization literatures, suggests that culturaldiversity and performance may not have a simple,linear relationship. One virtue of this new approachto studying the relationship is its potential for recon-ciling conflicting previous empirical findings.
Previous research into management group diver-sity has focused largely on (1) nonvisible aspects ofdiversity, such as functional background and (2)top management teams. A second contribution ofour study is thus the extension of this area of re-search into visible attributes of cultural diversity—race and gender—at several levels of management.This extension is particularly appropriate in thatour focus on firm performance and the moderatingeffect of entrepreneurial orientation acknowledgesthe role of multiple layers of management in strat-egy formulation, implementation, and entrepre-
neurial behaviors. Finally, until recently, researchhas not addressed contextual factors that may mod-erate the relationship between diversity and per-formance. A final contribution of our study is itsanalysis of the potential moderating effects ofentrepreneurial orientation.
Although our empirical results did not fully sup-port the hypothesized curvilinear relationship be-tween cultural diversity in management and firmperformance, we did observe such effects in spe-cific strategic contexts. More specifically, in firmswith highly innovative strategic postures, both lowand high management group heterogeneity wereassociated with higher productivity than was mod-erate heterogeneity. This effect was strongest forracial diversity. This finding has potentially impor-tant implications. The results suggest, as we ex-pected, that the relationship between cultural di-versity and performance is more complex than thatcaptured by either rubric (“greater diversity equalsbetter/poorer performance”). In short, the findingon diversity suggests that although neither the val-ue-in-diversity perspective nor social identity the-ory is necessarily incorrect, their ability to explainthe diversity-performance relationship might de-pend upon the overall level of diversity within themanagement group under consideration and thecontext within which the group is operating.
In firms characterized by high levels of risk tak-ing, we observed an inverted U-shaped relationshipbetween management group heterogeneity and pro-ductivity, with moderately heterogeneous manage-ment groups exhibiting better performance thanother management groups. This effect was strongest
FIGURE 2Interaction Effects of Gender Diversity in Management and Risk Taking
2004 263Richard, Barnett, Dwyer, and Chadwick
for gender heterogeneity. Thus, the results suggestthat totally homogeneous groups may not thrive inan environment requiring decision speed and ag-gressive competitive behavior. As managementgroup diversity approaches a moderate level, how-ever, its positive effects may yield performance ad-vantages in a high-risk strategic context. Notwith-standing, as diversity exceeds moderate levels andcontinues to increase, cognitive biasing and com-munication problems may increase, which leads toreduced cooperation and increased conflict. Theseresults are consistent with previous research indi-cating that high diversity reduces agreement seek-ing, social cohesion, and decision speed (Ferrier,2001), phenomena that may impede a firm’s abilityto respond in a context that demands aggressive-ness (Hambrick et al., 1996).
Limitations and Conclusion
Although our results suggest that the relationshipbetween management group diversity and firm per-formance is nonlinear, at least in some strategiccontexts, conclusions drawn from our results mustbe tempered by the fact that, in regard to racialheterogeneity, our management groups were not,on the average, highly diverse. A stronger test of thehypothesized curvilinear relationships calls for asetting of work groups in which the full theoreticalrange of racial heterogeneity (0 to .80) can be as-sessed. At the management level, however, maxi-mum theoretical racial diversity is rare in U.S.firms. Among Fortune’s 50 Best Companies for Mi-norities for 1998 were two banks, Washington Mu-tual, rated 27th, and the Bank of America, rated41st. The first of these had 28.6 percent racial mi-norities in management, and the second, 23.5 per-cent. Given Bank of America’s percentage of whitemanagers (76.5%), the maximum attainable Blauindex for this bank would be approximately .40.There were banks in our sample with more diver-sity than the Bank of America, but it would behighly unlikely to find a sample of banks in whichthe racial heterogeneity index values ranged all theway to .80. Thus, laboratory studies with assignedwork groups might be utilized to test the full rangeof racial heterogeneity in groups, allowing re-searchers to see whether the positive performanceshift continues throughout the theoretical range ofheterogeneity. Given that more variation existed inthe gender measure and that the statistical patternsconverge with the race measure, we believe that inat least some strategic contexts (firms with highlyinnovative strategic postures), increasing levels ofheterogeneity will continue to affect performance
positively up to maximum levels of heterogeneity.Confirmation of our theoretical proposition awaits.
We should point out additional limitations in-herent in our study. We were unable to provide atest of our hypothesis related to proactiveness, asfactor analysis of the entrepreneurial orientationscale yielded only two interpretable factors. Thedimensionality of the entrepreneurial orientationscale may need to be further explored. Researchshould continue to explore situations in which thedimensions converge and diverge.
Of course, our study only examined the linkagebetween the level of diversity and two measures offirm performance and did not directly address therelationship between the level of diversity and theprocess variables (communication, conflict, socialcontacts, and so forth) identified above. Our theo-retical suppositions should be tested in futurecross-sectional and longitudinal research that looksat the relationship of cultural diversity in manage-ment with these and other process variables.
Given our use of a single industry, cautionshould be used in generalizing beyond the financialsector. We call for diversity research in other in-dustries and in other nations. Our sample consistedof U.S. banks, although many other countries havediverse managements in terms of both race andgender and could thereby provide viable samples toexplore. Just as inviting is the exploration of otherdiversity dimensions related to globalization (forinstance, ethnicity, geographic background).
In conclusion, our findings indicate that manage-ment-level heterogeneity can be a critical asset incertain strategic contexts but that the diversity-performance relationship is complex. In addition tothe strategic posture of entrepreneurial orientationthat we found to moderate the relationship, othercontextual variables require attention. Future re-search that takes into account the complexity of thediversity-performance relationship and its poten-tial moderators should move scholars closer to ageneral theory of cultural diversity in the firm.
For a final thought, we note that results of thisresearch have managerial implications. The find-ings begin to answer a practical question: What isthe financial impact of breaking the “glass ceiling”?Our results show that within certain settings, cul-tural diversity in management groups can be ex-ploited to gain a competitive edge. Given the irre-versible trend towards more racial and genderdiversity in organizations, it behooves managers todevelop organizational capabilities that maximizethe benefits of diverse human capital and ulti-mately strive for a “sustainable diversity ad-vantage.”
264 AprilAcademy of Management Journal
REFERENCES
Alexander, J., Nuchols, B., Bloom, J., & Lee, S. 1995.Organizational demography and turnover: An exam-ination of multiform and nonlinear heterogeneity.Human Relations, 48: 1455–1480.
Birkinshaw, J. 1999. The determinants and consequencesof subsidiary initiative in multinational corpora-tions. Entrepreneurship Theory and Practice, 24:9–36.
Birkinshaw, J. 1997. Entrepreneurship in multinationalcorporations: The characteristics of subsidiaryinitiatives. Strategic Management Journal, 18:207–229.
Blau, P. M. 1977. Inequality and heterogeneity. NewYork: Free Press.
Burgelman, R. A. 1983. Corporate entrepreneurship andstrategic management: Insights from a process study.Management Science, 29: 1349–1364.
Chatman, J. A., Polzer, J. T., Barsade, S. G., & Neale, M. A.1998. Being different yet feeling similar: The influ-ence of demographic composition and organiza-tional culture on work processes and outcomes. Ad-ministrative Science Quarterly, 43: 749–780.
Covin, J. G., & Slevin, D. P. 1991. A conceptual model ofentrepreneurship as firm behavior. Entrepreneur-ship Theory and Practice, 16: 7–25.
Covin, J. G., & Slevin, D. P. 1989. Strategic managementof small firms in hostile and benign environments.Strategic Management Journal, 10: 75–87.
Cox, T. 1994. Cultural diversity in organizations: The-ory, research, and practice. San Francisco: Berrett-Koehler.
Cox, T., Lobel, S. A., & McLeod, P. L. 1991. Effects ofethnic group cultural differences on cooperative andcompetitive behavior on a group task. Academy ofManagement Journal, 4: 827–847.
Earley, P. C., & Mosakowski, E. 2000. Creating hybridteam cultures: An empirical test of transnationalteam functioning. Academy of Management Jour-nal, 43: 26–49.
EEOC. 2002. Job patterns for women and minorities inprivate industry. http://www.eeoc.gov/stats/jobpat/jobpat.html.
Eisenhardt, K. M. 1989. Making fast strategic decisions inhigh-velocity environments. Academy of Manage-ment Journal, 32: 543–576.
Ferrier, J. 2001. Navigating the competitive landscape:The drivers and consequences of competitive aggres-siveness. Academy of Management Journal, 44:858–877.
Finkelstein, S., & Hambrick, D. C. 1996. Strategic lead-ership: Top executives and their effects on organi-zations. St. Paul: West.
Hambrick, D. C., Cho, T., & Chen, J. M. 1996. The influ-ence of top management team heterogeneity on
firms’ competitive moves. Administrative ScienceQuarterly, 41: 659–684.
Hopkins, W. E., & Hopkins, S. A. 1997. Strategic plan-ning-financial performance relationships in banks: Acausal examination. Strategic Management Jour-nal, 18: 635–652.
Hitt, M. A., Bierman, L., Shimizu, K., Kochhar, R. 2001.Direct and moderating effects of human capital onstrategy and performance in professional servicefirms: A resource-based perspective. Academy ofManagement Journal, 44: 13–28.
Jehn, K. 1995. A multimethod examination of the bene-fits and detriments of intragroup conflict. Adminis-trative Science Quarterly, 40: 256–282.
Judge, W. Q. & Miller, A. 1991. Antecedents and out-comes of decision speed in different environmentalcontexts. Academy of Management Journal, 34:449–463.
Kanter, R. M. 1982. The middle manager as innovator.Harvard Business Review, 60(4): 95–106.
Knight, G. A. 1997. Cross-cultural reliability and validityof a scale to measure firm entrepreneurial orienta-tion. Journal of Business Venturing, 12: 213–225.
Mehra, A. 1996. Resource and market based determi-nants of performance in the U.S. banking industry.Strategic Management Journal, 17: 307–322.
Lau, D. C., & Murnighan, J. K. 1998. Demographic diver-sity and faultlines: The compositional dynamics oforganizational groups. Academy of ManagementReview, 23: 325–340.
Lumpkin, G. T., & Dess, G. G. 2001. Linking two dimen-sions of entrepreneurial orientation to firm perfor-mance: The moderating role of environment and in-dustry life cycle. Journal of Business Venturing, 16:429–451.
Lumpkin, G. T., & Dess, G. G. 1996. Clarifying the entre-preneurial orientation construct and linking it toperformance. Academy of Management Review,21: 135–172.
Lyon, D. W., Lumpkin, G. T., & Dess, G. G. 2000. Enhanc-ing entrepreneurial orientation research: operation-alizing and measuring a key strategic decisionmaking process. Journal of Management, 26:1055–1085.
McLeod, P. L., Lobel, S. A., & Cox, T. H. 1996. Ethnicdiversity and creativity in small groups. SmallGroup Research, 27: 246–264.
Mehra, A. 1996. Resource and market based determi-nants of performance in the U. S. banking industry.Strategic Management Journal, 17: 307–322.
Miller, C. C., Burke, L. M., & Glick, W. 1998. Cognitivediversity among upper-echelon executives: Implica-tions for strategic decision processes. StrategicManagement Journal, 19: 39–58.
2004 265Richard, Barnett, Dwyer, and Chadwick

Naman, J. L., & Slevin, D. P. 1993. Entrepreneurship andthe concept of fit: A model and empirical tests. Stra-tegic Management Journal, 14: 137–153.
Pelled, L. H., Eisenhardt, K. M., & Xin, K. R. 1999. Ex-ploring the black box: An analysis of work groupdiversity, conflict, and performance. AdministrativeScience Quarterly, 44: 1–28.
Richard, O. 2000. Racial diversity, business strategy, andfirm performance. Academy of Management Jour-nal, 43: 164–177.
Smith, K. G., Smith, K. A., Olian, J. D., Sims, H. P.,O’Bannon, D. P., & Scully, J. A. 1994. Top manage-ment team demography and process: The role ofsocial integration and communication. Administra-tive Science Quarterly, 39: 412–438.
Stevenson, H. H., & Jarillo, J. C. 1990. A paradigm ofentrepreneurship: Entrepreneurial management.Strategic Management Journal, 11: 17–27.
Tajfel, H., & Turner, J. 1985. The social identity of inter-group behavior. In S. Worchel & W. Austin (Eds.),Psychology and intergroup relations: 7–24: Chi-cago: Nelson-Hall.
Tsui, A., Egan, T., & O’Reilly, C. 1992. Being different:Relational demography and organizational attachment.Administrative Science Quarterly, 37: 549–579.
Watson, W. E., Kumar, K., & Michaelsen, L. K. 1993.Cultural diversity’s impact on interaction processand performance: comparing homogeneous and di-verse task groups. Academy of Management Jour-nal, 36: 590–602.
Wiklund, J. 1999. The sustainability of the entrepreneur-ial orientation-performance relationship. Entrepre-neurial Theory and Practice, 24: 37–48.
Williams, K., & O’Reilly, C. 1998. Forty years of diversity
research: A review. In B. M. Staw & L. L. Cummings(Eds.), Research in organizational behavior: 77–140. Greenwich, CT: JAI Press.
Orlando C. Richard is an assistant professor of humanresource management and organizational behavior andPh.D. program coordinator at the University of Texas atDallas. He completed postdoctoral research at the SloanSchool of Management after earning his Ph.D. in businessadministration from the University of Kentucky. His re-search focuses on organizational demography, organiza-tional justice, and mentoring relationships.
Tim Barnett ([email protected]) is an associ-ate professor of management at Mississippi State Univer-sity, where he received his D.B.A. His research interestsinclude ethical decision making in organizations, theimpact of religious faith on workplace behavior, andsocial identity and social exchange processes in organi-zations.
Sean Dwyer (Ph.D., University of Alabama) is an associ-ate professor of marketing at the College of Administra-tion and Business, Louisiana Tech University. His areasof research interest include sales force management, in-ternational marketing, cross-cultural/global selling, andcultural diversity.
Ken Chadwick is an assistant professor in the Manage-ment and Marketing Department at Nicholls State Uni-versity. He received his D.B.A. from Louisiana Tech Uni-versity. His research interests include the performance ofentrepreneurially oriented firms, diversity, and smallbusiness management.
266 AprilAcademy of Management Journal
