cuando comenzar, hasta cuanto llegar y …“n...initiation of antihypertensive treatment grade 2...
TRANSCRIPT
CUANDO COMENZAR, HASTA CUANTO LLEGAR Y CON QUE TRATAR AL
PACIENTE HIPERTENSO CON DM2
Patricio López-Jaramillo MD PhD FACP
Director de Investigaciones y de la Clínica de Síndrome Metabólico, Prediabetes y Diabetes, FOSCAL
Director de Investigaciones de la Facultad de Medicina UDES
Presidente de la Sociedad Latinoamericana de Hipertension (LASH) 2014-2016
Bucaramanga-Colombia
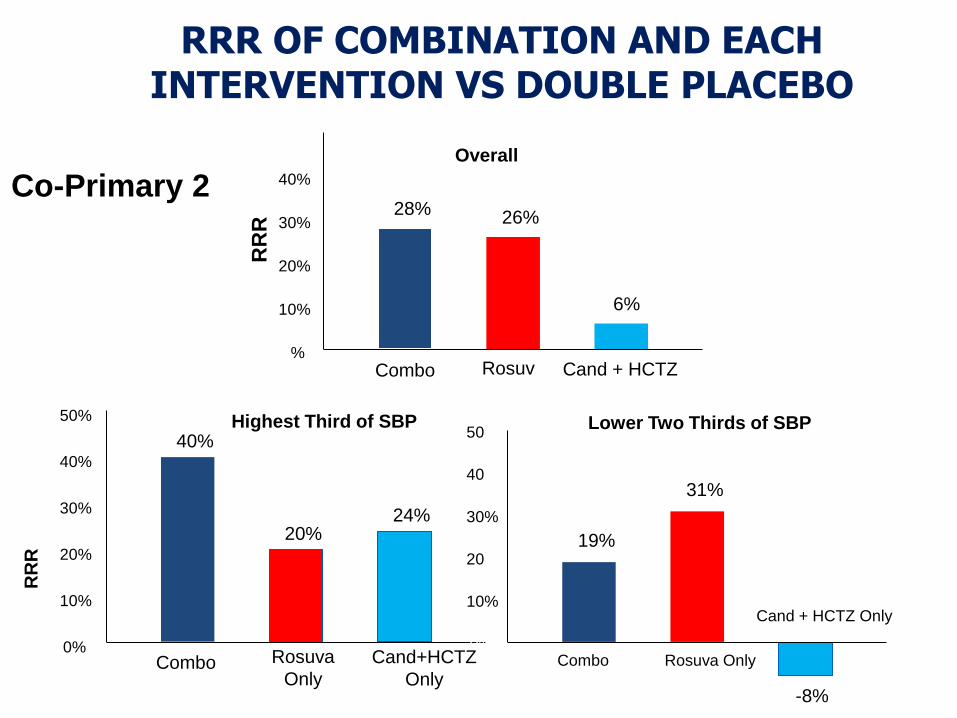
RRR OF COMBINATION AND EACH INTERVENTION VS DOUBLE PLACEBO
Overall
RR
R
0%
10%
20%
30%
40%
50%
28% 26%
6%
Combo Rosuva
Only Cand + HCTZ
Only
34
Co-Primary 2
RR
R
0%
10%
20%
30%
40%
50%
40%
20% 24%
Combo Rosuva
Only
Cand+HCTZ
Only
Highest Third of SBP
0%
10%
20%
30%
40%
50%
19%
31%
-8%
Combo Rosuva Only
Cand + HCTZ Only
Lower Two Thirds of SBP
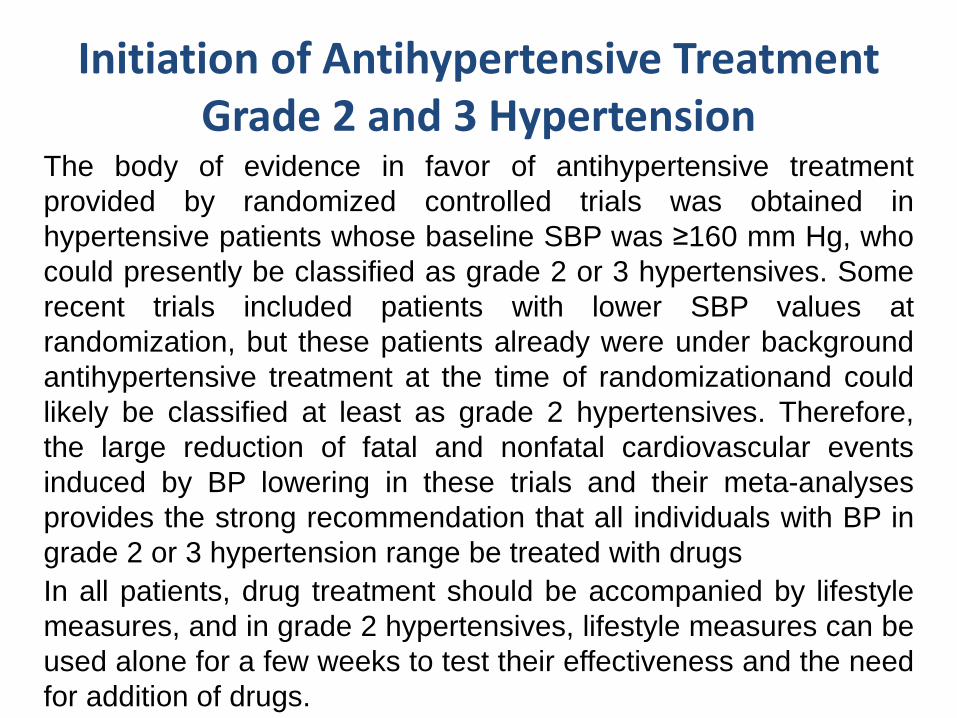
Initiation of Antihypertensive Treatment Grade 2 and 3 Hypertension
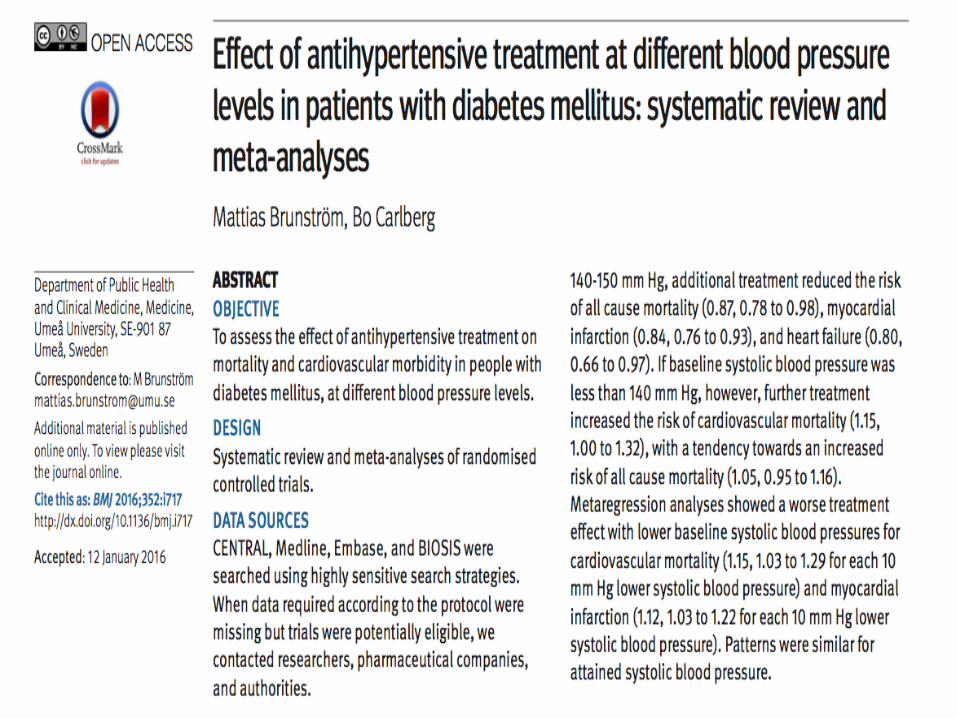
The body of evidence in favor of antihypertensive treatment
provided by randomized controlled trials was obtained in
hypertensive patients whose baseline SBP was ≥160 mm Hg, who
could presently be classified as grade 2 or 3 hypertensives. Some
recent trials included patients with lower SBP values at
randomization, but these patients already were under background
antihypertensive treatment at the time of randomizationand could
likely be classified at least as grade 2 hypertensives. Therefore,
the large reduction of fatal and nonfatal cardiovascular events
induced by BP lowering in these trials and their meta-analyses
provides the strong recommendation that all individuals with BP in
grade 2 or 3 hypertension range be treated with drugs
In all patients, drug treatment should be accompanied by lifestyle
measures, and in grade 2 hypertensives, lifestyle measures can be
used alone for a few weeks to test their effectiveness and the need
for addition of drugs.
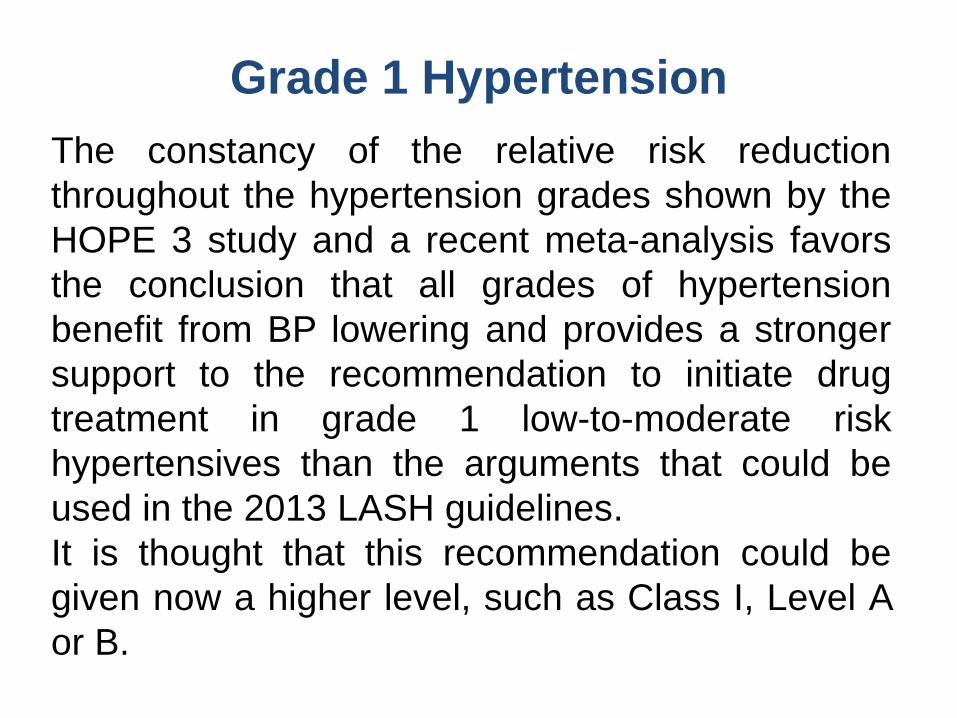
The constancy of the relative risk reduction
throughout the hypertension grades shown by the
HOPE 3 study and a recent meta-analysis favors
the conclusion that all grades of hypertension
benefit from BP lowering and provides a stronger
support to the recommendation to initiate drug
treatment in grade 1 low-to-moderate risk
hypertensives than the arguments that could be
used in the 2013 LASH guidelines.
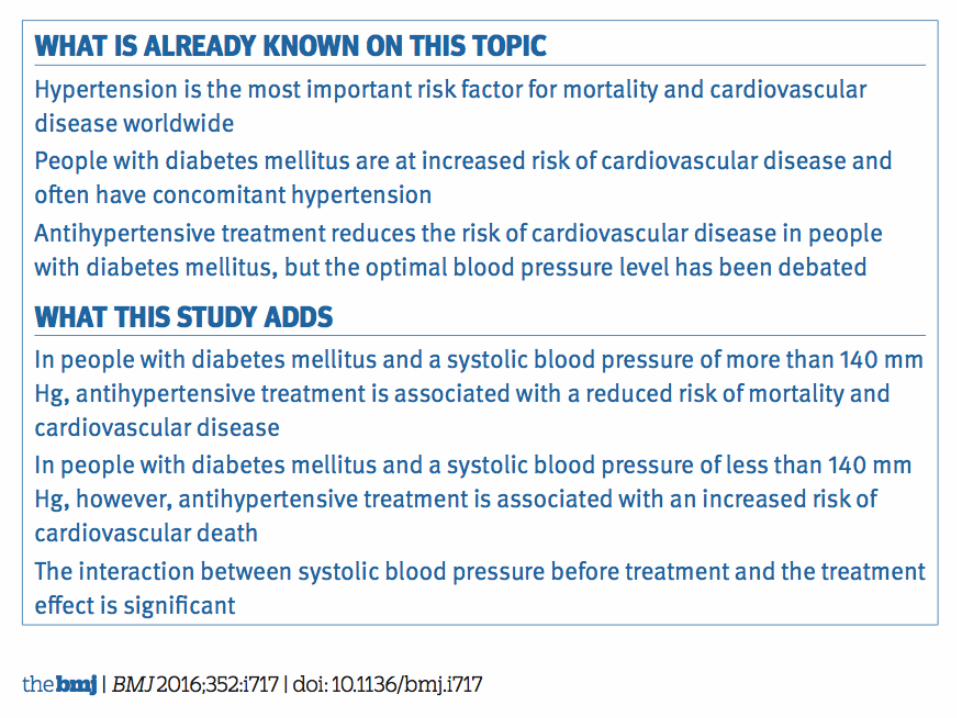
It is thought that this recommendation could be
given now a higher level, such as Class I, Level A
or B.
Grade 1 Hypertension
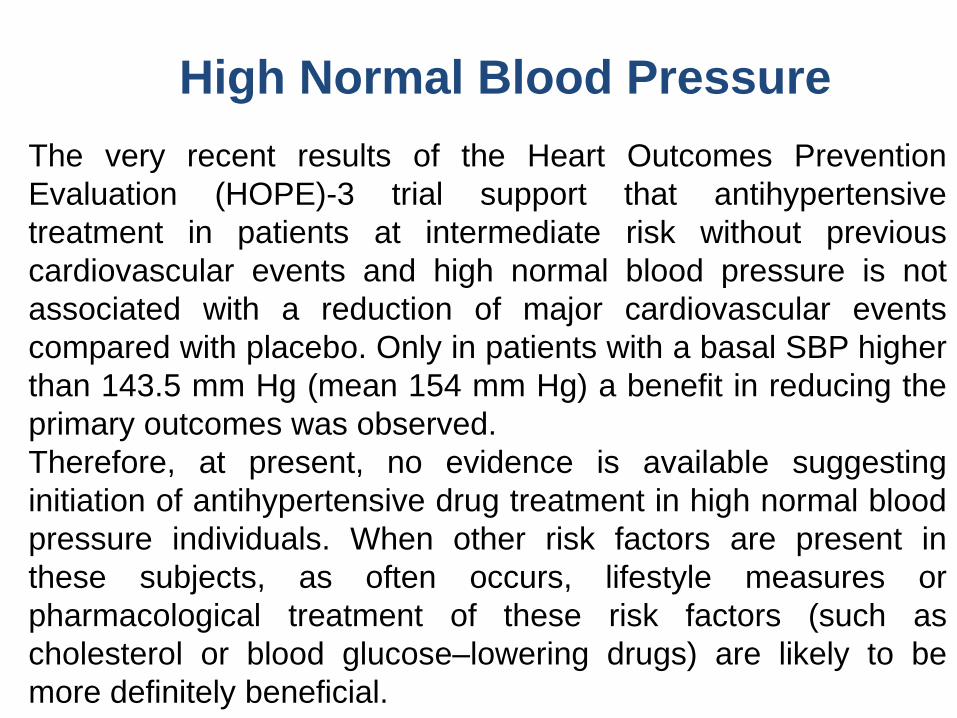
The very recent results of the Heart Outcomes Prevention
Evaluation (HOPE)-3 trial support that antihypertensive
treatment in patients at intermediate risk without previous
cardiovascular events and high normal blood pressure is not
associated with a reduction of major cardiovascular events
compared with placebo. Only in patients with a basal SBP higher
than 143.5 mm Hg (mean 154 mm Hg) a benefit in reducing the
primary outcomes was observed.
Therefore, at present, no evidence is available suggesting
initiation of antihypertensive drug treatment in high normal blood
pressure individuals. When other risk factors are present in
these subjects, as often occurs, lifestyle measures or
pharmacological treatment of these risk factors (such as
cholesterol or blood glucose–lowering drugs) are likely to be
more definitely beneficial.
High Normal Blood Pressure

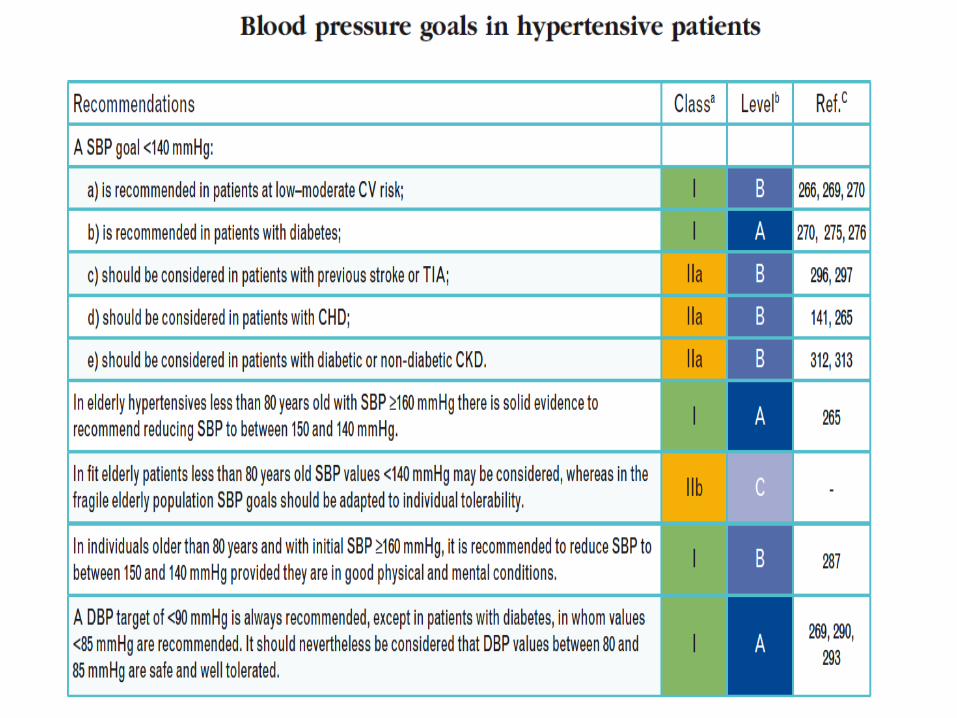
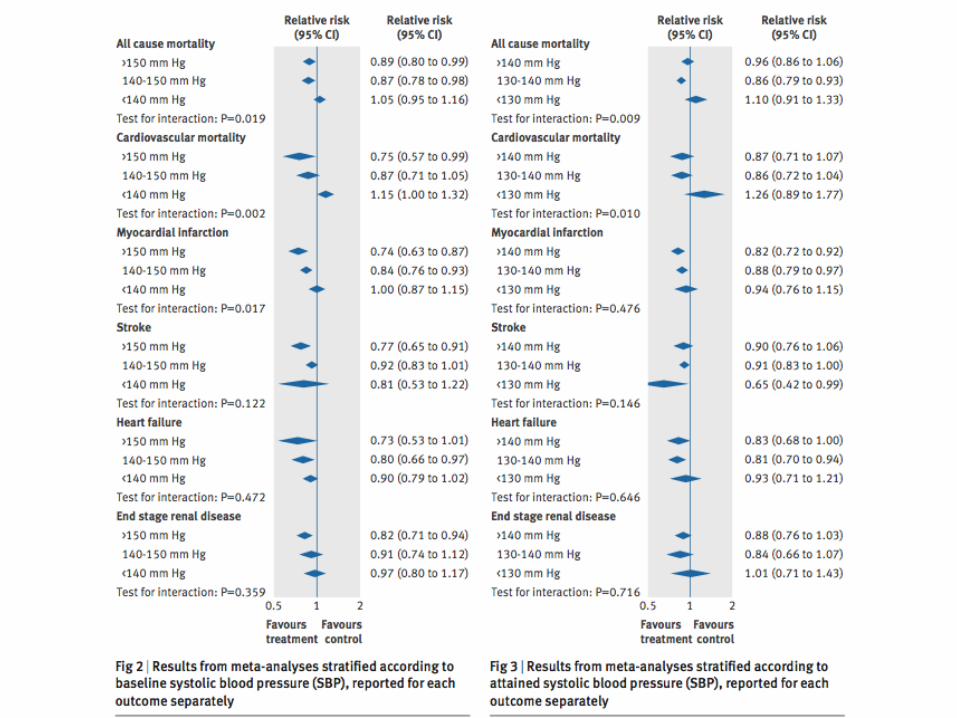
Blood Pressure Treatment Targets
The Lower the Better Versus the J-Shaped
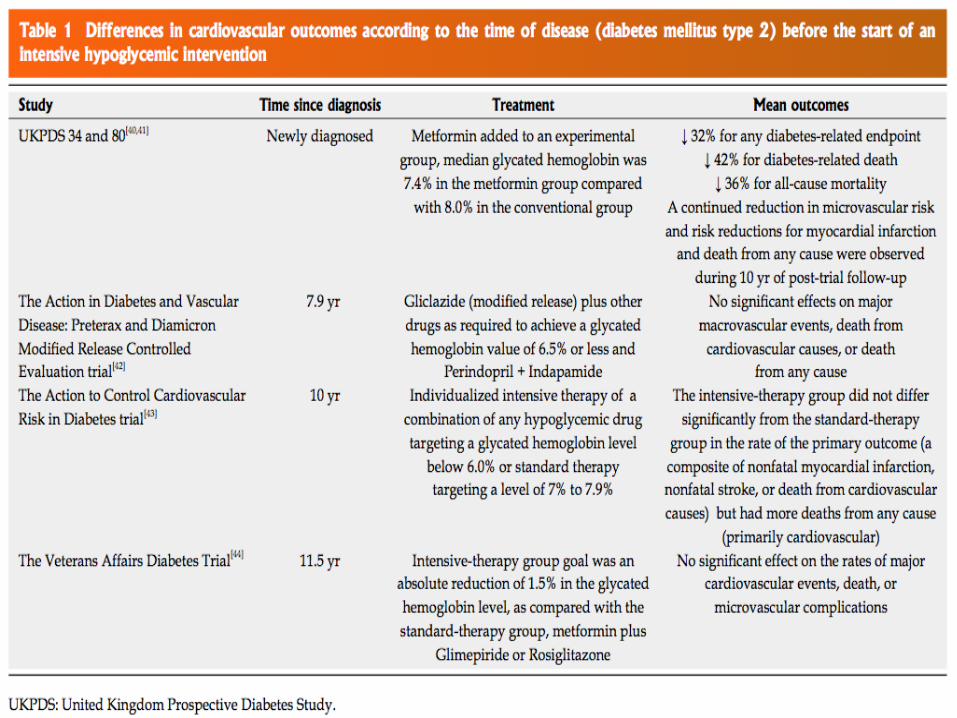
Curve Hypothesis The Latin America consensus on hypertension in patients with type 2 diabetes
mellitus and metabolic syndrome recommended a SBP target of less than 140
mm Hg as in nondiabetic hypertensive individuals.
The overall reductions in stroke and all vascular events were related to the
degree of BP lowering achieved in the range between 140 and 130 mm Hg,
but in no one of these studies was the average achieved BP <130 mm Hg.
The results of SPRINT and another recent trial have been included in an
updated meta-analysis of all 35 trials of BP lowering (138 452 individuals) that
could be stratified according to the usual cutoffs of achieved SBP. Lowering
SBP below 130 mm Hg was found to reduce relative risk of major
cardiovascular outcomes, but the absolute cardiovascular risk reduction was
definitely smaller, and the risk of permanent treatment discontinuations for
adverse events significantly greater than in the trials in which SBP was
lowered across the cutoff of 140 mm Hg.
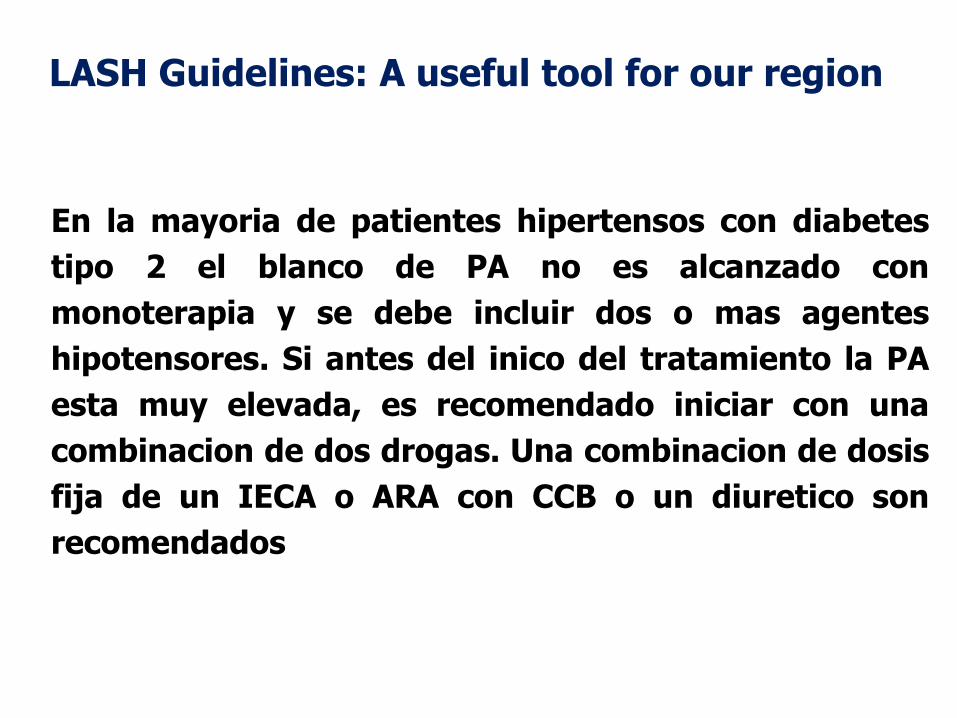
LASH Guidelines: A useful tool for our region
En la mayoria de patientes hipertensos con diabetes
tipo 2 el blanco de PA no es alcanzado con
monoterapia y se debe incluir dos o mas agentes
hipotensores. Si antes del inico del tratamiento la PA
esta muy elevada, es recomendado iniciar con una
combinacion de dos drogas. Una combinacion de dosis
fija de un IECA o ARA con CCB o un diuretico son
recomendados
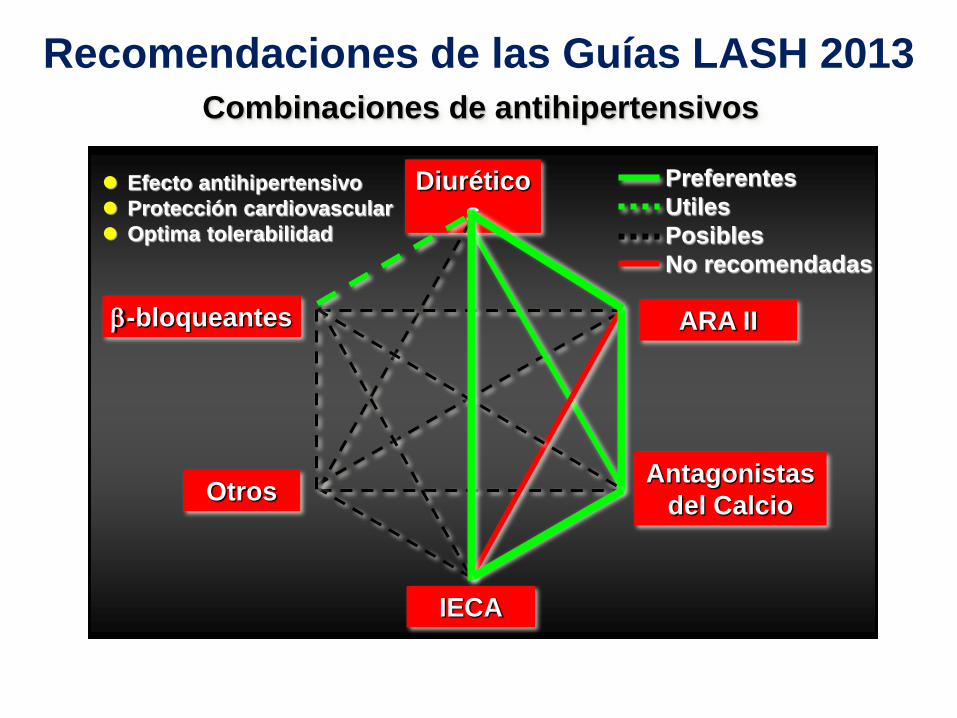
Diurético
s
IECA
Antagonistas
del Calcio
ARA II -bloqueantes
Otros
Combinaciones de antihipertensivos
Efecto antihipertensivo
Protección cardiovascular
Optima tolerabilidad
Recomendaciones de las Guías LASH 2013
Preferentes
Utiles
Posibles
No recomendadas

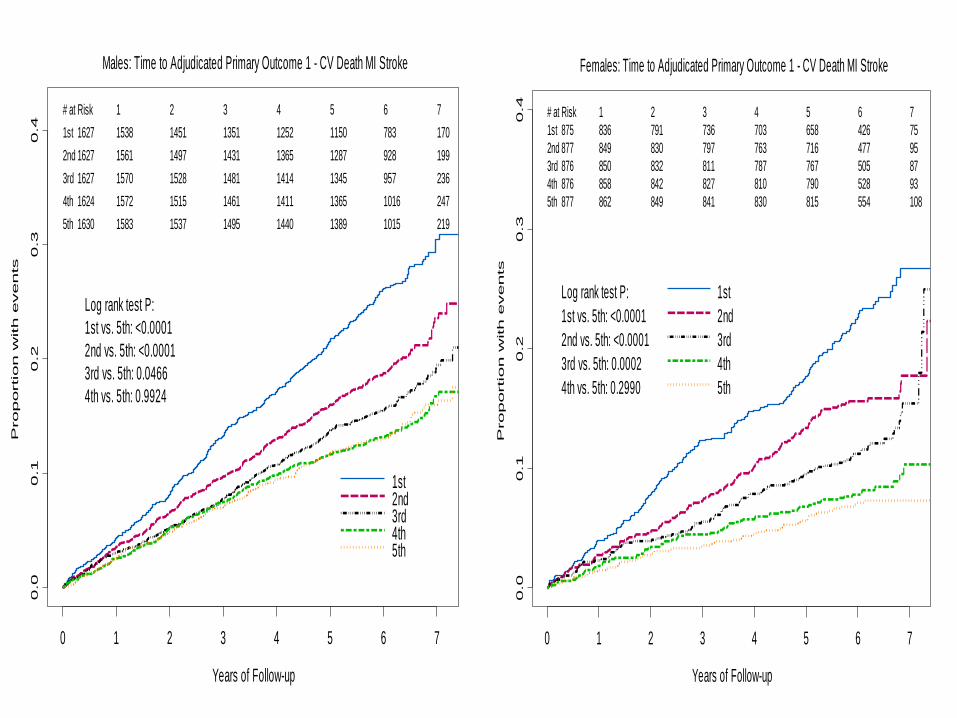
Years of Follow-up
Proportio
n w
ith events
0.0
0.1
0.2
0.3
0.4
0 1 2 3 4 5 6 7
1st2nd3rd4th5th
# at Risk 1 2 3 4 5 6 7
1st
2nd
3rd
4th
5th
1627 1538 1451 1351 1252 1150 783 170
1627 1561 1497 1431 1365 1287 928 199
1627 1570 1528 1481 1414 1345 957 236
1624 1572 1515 1461 1411 1365 1016 247
1630 1583 1537 1495 1440 1389 1015 219
Log rank test P:
1st vs. 5th: <0.0001
2nd vs. 5th: <0.0001
3rd vs. 5th: 0.0466
4th vs. 5th: 0.9924
Males: Time to Adjudicated Primary Outcome 1 - CV Death MI Stroke
Years of Follow-up
Proportio
n w
ith events
0.0
0.1
0.2
0.3
0.4
0 1 2 3 4 5 6 7
1st
2nd
3rd
4th
5th
# at Risk 1 2 3 4 5 6 7
1st
2nd
3rd
4th
5th
875 836 791 736 703 658 426 75
877 849 830 797 763 716 477 95
876 850 832 811 787 767 505 87
876 858 842 827 810 790 528 93
877 862 849 841 830 815 554 108
Log rank test P:
1st vs. 5th: <0.0001
2nd vs. 5th: <0.0001
3rd vs. 5th: 0.0002
4th vs. 5th: 0.2990
Females: Time to Adjudicated Primary Outcome 1 - CV Death MI Stroke
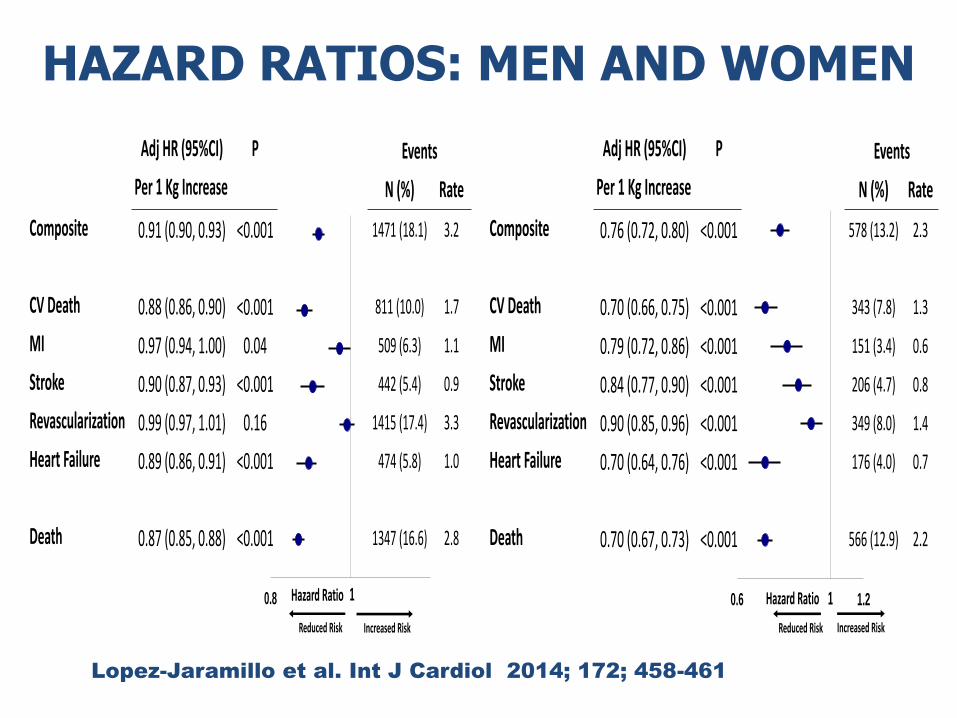
HAZARD RATIOS: MEN AND WOMEN
Adj HR (95%CI) P Events
Per 1 Kg Increase N (%) Rate
Composite 0.91 (0.90, 0.93) <0.001 1471 (18.1) 3.2
CV Death 0.88 (0.86, 0.90) <0.001 811 (10.0) 1.7
MI 0.97 (0.94, 1.00) 0.04 509 (6.3) 1.1
Stroke 0.90 (0.87, 0.93) <0.001 442 (5.4) 0.9
Revascularization 0.99 (0.97, 1.01) 0.16 1415 (17.4) 3.3
Heart Failure 0.89 (0.86, 0.91) <0.001 474 (5.8) 1.0
Death 0.87 (0.85, 0.88) <0.001 1347 (16.6) 2.8
Hazard Ratio
Reduced Risk
10.8
Increased Risk
Lopez-Jaramillo et al. Int J Cardiol 2014; 172; 458-461
Hazard Ratio
Reduced Risk
0.6 1.21
Increased Risk
Adj HR (95%CI) P Events
Per 1 Kg Increase N (%) Rate
Composite 0.76 (0.72, 0.80) <0.001 578 (13.2) 2.3
CV Death 0.70 (0.66, 0.75) <0.001 343 (7.8) 1.3
MI 0.79 (0.72, 0.86) <0.001 151 (3.4) 0.6
Stroke 0.84 (0.77, 0.90) <0.001 206 (4.7) 0.8
Revascularization 0.90 (0.85, 0.96) <0.001 349 (8.0) 1.4
Heart Failure 0.70 (0.64, 0.76) <0.001 176 (4.0) 0.7
Death 0.70 (0.67, 0.73) <0.001 566 (12.9) 2.2