ctv performance assessment seminar - carbon · pdf filectv performance assessment seminar...
TRANSCRIPT

CTV PERFORMANCE
ASSESSMENT SEMINAR
Presented by
Stephen Phillips and
Hugh Maclean
of
Seaspeed Marine Consulting Ltd

INTRODUCTION
The Carbon Trust - The Carbon Trust’s mission is to accelerate the move to
a sustainable, low carbon economy.
CT Offshore Wind Accelerator – The CT OWA brings together nine
offshore wind developers to work towards reducing the cost of renewable
energy.”
Developers – O&M costs to be reduced. Lack of realistic performance data
restricting accuracy of O&M modelling. Ability to specify and deploy more
suitable vessels for each specific site.
CTV Industry – Designers/Builders/Owners/Operators of more capable
vessels are not able to properly describe or prove performance benefits
without better understanding and definition of current vessel performance.
Research programme instigated ……………

RESEARCH AIMS
Improve Understanding - To better understand the performance and
limiting factors of current fast CTV’s in relation to environmental conditions.
• investigated catamarans, monohulls and SWATH
• in transit, approach and transfer modes
• computer simulation, model tests, sea trials and discussions with industry
Information Presentation - To provide a straightforward means of
performance assessment and data presentation.
• gives the required availability data for O&M modelling
• provides the industry with the information needed to fully understand
how their craft perform and are limited in relation to weather conditions
• presentation of research findings to enable benchmarking
Dissemination of findings is crucial …………….

SEMINAR AIMS
Dissemination and Discussion of
Research Findings
1. How CTV performance was, is and could be specified and assessed
2. Discuss the important performance parameters and influencing factors
3. Present benchmark data presentation (P-Plots)
4. Discuss performance thresholds
5. Describe design implications
6. Discuss the practical application of P-Plots
7. Discussion session

1. CTV SPECIFICATION
General Safety and Operability
• Class Rules and/or Operational Regulations
Functionality
• Technical Specification (speed/power/machinery/outfit etc) often
assured by sea trials and acceptance documentation. i.e. Vessel capable
of carrying X tonnes payload at Y knots
Availability
• Ability to handle local conditions (e.g. port limitations)
• Ability of the vessel to reach/work on the wind farm in weather
conditions: Operational Performance
• Reliability, and ability to repair when required
Cost
• Newbuild cost, depreciation, running costs, charter rates.

1. CTV PERFORMANCE
Traditional
• contract to undertake calm water sea trials and define speed (and
possibly power and fuel consumption) at contract payload
Early CTV
• in addition to above, include an operational sea states statement in the
contract
Emerging
• sea trials assessing vessels capability and comparing to current baseline
performance - leading to a more defined operability
requirement/statement and assessment of vessels performance.
Future
• continuous monitoring of vessel performance, analysed and displayed on
board and ashore allowing monitoring of performance by all parties

2. INFLUENCING FACTORS
FOR TRANSIT
Parameters
Safety limits
• Personnel
• Vessel
Voluntary limits
• Comfort, motion sickness
• Avoidance of damage
Influencing Factors
Vertical and Horizontal acceleration
Vessel control (broaching)
Speed
Vertical acceleration
Roll and pitch
Slamming and green-water

2. INFLUENCING FACTORS
FOR TRANSFER
Parameters
• Safety
• Step across transfer
• Foredeck working
• Avoidance of damage
Influencing Factors
Fender slips
Loss of contact
Impacts
Roll/Lateral acceleration
Slamming
Green-water

3. PERFORMANCE PLOTS
Data gathering
• market sector study

3. PERFORMANCE PLOTS
Data gathering
• market sector study
• baseline vessel definition - computational studies and physical scale
modelling to understand performance issues.
• sea trials on existing vessels / feedback from operators and technicians
• interaction with developers, designers, regulators and researchers
regarding performance limitations
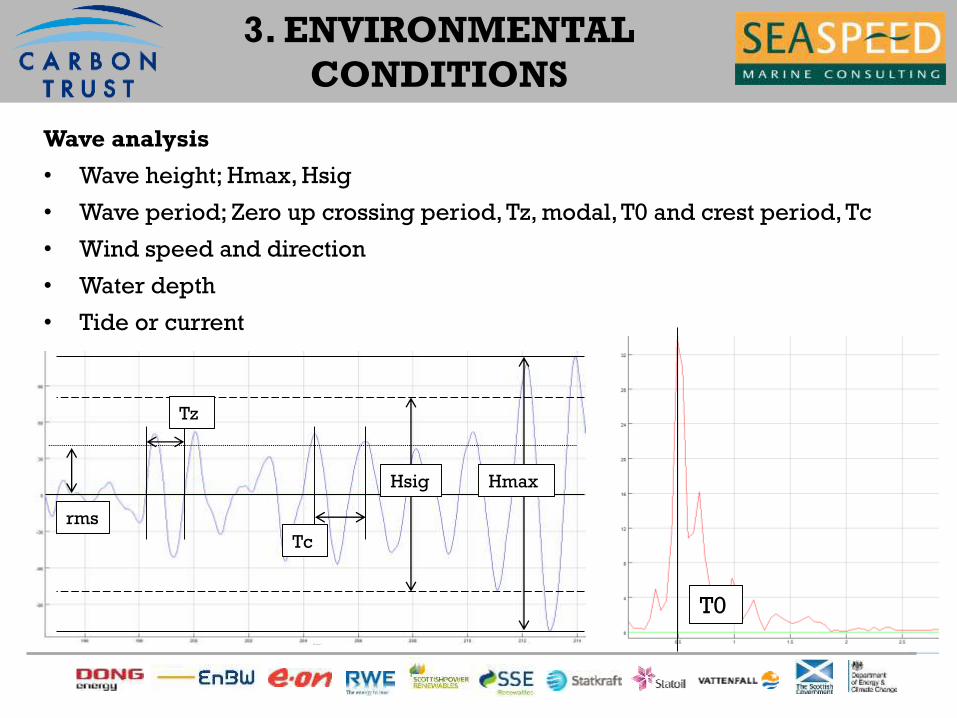
3. ENVIRONMENTAL
CONDITIONS
Wave analysis
• Wave height; Hmax, Hsig
• Wave period; Zero up crossing period, Tz, modal, T0 and crest period, Tc
• Wind speed and direction
• Water depth
• Tide or current
Tc
rms
Hsig Hmax
Tz
T0

3. PERFORMANCE
THRESHOLDS
Transit limiting criteria
Criteria Value
Vertical acceleration, rms 0.15g
Horizontal acceleration, rms 0.1g
Roll, rms 6.0 deg
Pitch, rms 5.0 deg
Transfer limiting criteria
Criteria Value
Vertical acceleration, rms -
Horizontal acceleration, rms -
Roll, rms 3.0 deg
Pitch, rms -
Zero slip confidence level 95%
Slip size 0.3 m

3. TRANSIT P-PLOTS
22m Propeller Catamaran
Sh
ip S
pe
ed
, kts
Following Sea
Head Sea
Beam
Sea
Long period limit line
Standard period limit line
Short period limit line

3. TRANSIT P-PLOTS
26m Propeller Catamaran – with sea trials data
Sh
ip S
pe
ed
, kts
Long period limit line
Standard period limit line
Short period limit line

3. TRANSFER P-PLOTS
22m Propeller Catamaran

3. TRANSFER P-PLOTS
26m Propeller Catamaran – with sea trials data

3. APPROACH MODE
Approach P-Plots - Under Discussion
• No P-Plots developed to date – uncertain parameters and thresholds
• Limited by ability to manoeuvre on to tower which is down to helmsman’s
skill as much as vessel ability
• Vessel propulsion system response time
• Vessel’s manoeuvrability

4. PERFORMANCE
THRESHOLDS
Transit limiting criteria
Criteria Original Value Current value
Vertical acceleration, rms 0.15g 0.15g
Horizontal acceleration, rms 0.1g 0.1g
Roll, rms 6.0 deg 6.0 deg
Pitch, rms 4.0 deg 5.0 deg
Transfer limiting criteria
Criteria Original Value Current value
Vertical acceleration, rms 0.05g -
Horizontal acceleration, rms 0.04g -
Roll, rms 2.5 deg 3.0 deg
Pitch, rms 2.0 deg -
Zero slip confidence level 90% 95%
Slip size +/- 0.1 m 0.3 m

5. DESIGN FEATURES
FreeboardMinimise wet deck slams in transit and transfer

5. DESIGN FEATURES
ThrustMaximise transfer capability – and load carrying speed in transit
Transit
P-Plot
Transfer
P-Plot

5. DESIGN FEATURES
Vessel size and typeMinimise vessel motions in transit
18m
22m
26m

5. DESIGN FEATURES
Propulsor arrangementPosition and type to avoid ventilation
Fixed pitch propeller
Controllable pitch propeller
Volvo Penta IPS
Waterjet

5. DESIGN FEATURES
Access systemsIncreased safety and/or extended capability
TAS
MaXcessTDD
Windgrip
V-Grip
Mobimar

6. PRACTICAL
APPLICATION OF P-PLOTS
Practical Application of P-Plots
• no versatile means of comparing vessel performance was previously
available
• these performance plots are designed to be the most appropriate
representation of the operational performance CTV’s
• operational performance plots allow a vessel of any configuration to be
compared to an industry benchmark (with respect to Transit and Transfer)
• there are validated vessel monitoring systems (VMS) available that can
be fitted to provide the required data from normal operations.
• there are straightforward guidelines being developed to provide the
required sea trial data to compare with the benchmark performance plots

6. PRACTICAL
PERFORMANCE TRIALS
Existing proposal outlined in “Conduct of offshore access performance evaluation
trials” OWA-S2-A-Y2-1 October 2015 (to be updated with input from current
research).
Summary of essential aspectsTransit
• Run for 5-10 minutes at each of 5 headings (Head, BQ, Beam, SQ, Following)
• Record Hsig, period and direction, and wind speed and direction
• Record displacement during trials (fuel, people, payloads)
• Measure rms vertical and horizontal accelerations along with pitch and roll
• For a range of speeds say 15, 20 and 25 knots or maximum and comfortable
Transfer
• 10 minute push on transfer
• Record number of slips, engine rpm, vessel motion (as above)
• Record Hsig, period and direction, and wind speed and direction
• Confidence of no-slip, % = [1 – (number of slips/number of waves)] x 100

7. DISCUSSION
National Workboat Association Questions
• How will the data be measured?
• What will it cost per vessel to measure the data to the highest standard?
• Who pays for the data monitoring equipment and for the data output?
• How long will the data collection be measured before the first bench-marks
are written or presented?
• What will be the finalised slip accountability rate that will be measured
against?
• How will the data be shared across the industry from Charterer to Charter
and Operator to Operator?
• Who owns the data?
• What will happen to my data?
• How will OWA stop the ability for P-Plots to become part of a contractable
performance measurement clause?

7. DISCUSSION
Discussion Period
Seminar Aims
1. How CTV performance was, is and could be specified and assessed
2. Discuss the important performance parameters and influencing factors
3. Present benchmark data presentation (P-Plots)
4. Discuss performance thresholds
5. Describe design implications
6. Discuss the practical application of P-Plots
7. Discussion session

8. END OF SEMINAR
CTV Performance
Assessment Seminar - End
Thank you for your attention

P-Plot seminar

P-Plot seminar
PERFORMANCE THRESHOLDS
Description RMS Vertical Acceleration
RMS Lateral Acceleration
RMS Roll Motion
Light Manual Work 0.20 g 0.10 g 6.0 °
Heavy Manual Work 0.15 g 0.07 g 4.0 °
Intellectual Work 0.10 g 0.05 g 3.0 °
Transit Passengers 0.05 g 0.04 g 2.5 °
Cruise Liner 0.02 g 0.03 g 2.0 °
Seakeeping performance criteria for human effectiveness –Limiting Criteria with regard to accelerations (vertical and
lateral and roll motion (NORDFORSK, 1987)