ctc claims data collection and analyses update ctc steering committee february 13, 2015 1
TRANSCRIPT

CTC CLAIMS DATA COLLECTION AND ANALYSES UPDATE CTC Steering Committee
February 13, 2015
1
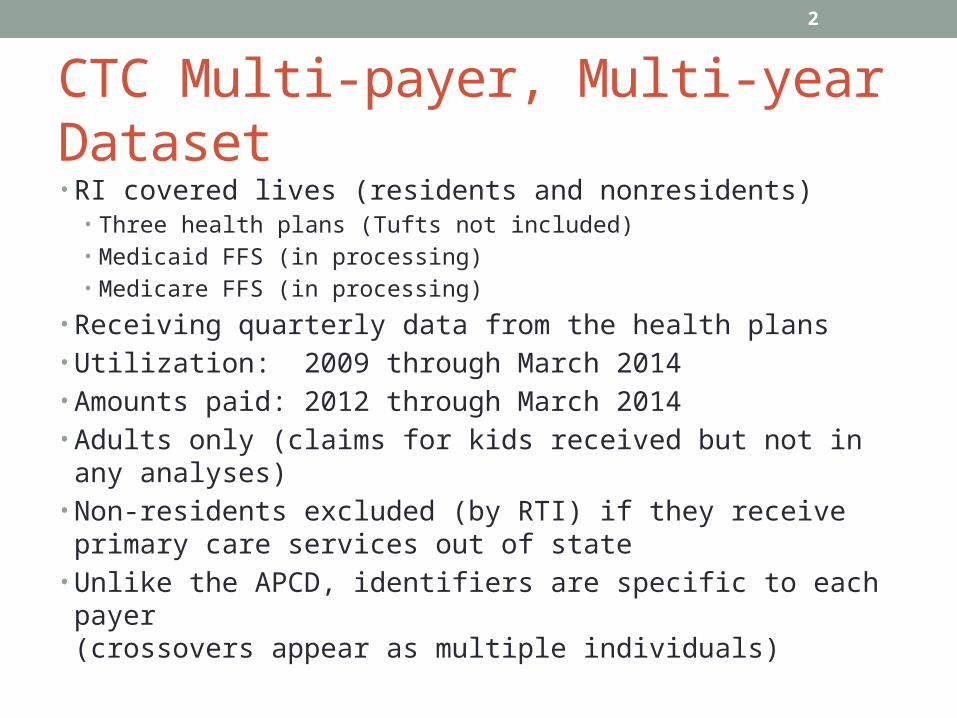
2
CTC Multi-payer, Multi-year Dataset• RI covered lives (residents and nonresidents)
• Three health plans (Tufts not included)• Medicaid FFS (in processing)• Medicare FFS (in processing)
• Receiving quarterly data from the health plans • Utilization: 2009 through March 2014• Amounts paid: 2012 through March 2014 • Adults only (claims for kids received but not in any
analyses)• Non-residents excluded (by RTI) if they receive primary
care services out of state• Unlike the APCD, identifiers are specific to each payer
(crossovers appear as multiple individuals)

Profile of Data from Three Plan (Adults), 2013 (in thousands)
Total
All CTC practices
Other Medical Homes
Comparison practices
Attributed outside RI Unattributed
Persons1 557 117 75 199 20 146
Member years2 474 106 69 176 18 106
1 Each member is counted the percent of time they were in each group with their total time adding to one person.
2 Each member is counted in only one group per month based on attribution for that month.

CTC Cohort 1: 15 practice sites
• Blackstone Valley Community Health Care, Inc. • Coastal Medical, Inc. - Greenville • Coastal Medical, Inc. - Hillside • Coastal Medical, Inc. - Narragansett • Coastal Medical, Inc. - Wakefield • Family Health and Sports Medicine • Kristine Cuniff • Memorial Hospital Family Care Center• South County Hospital Family Medicine • South County Internal Medicine • Stuart Demirs • Thundermist CHC - Wakefield • Thundermist CHC - Woonsocket • University Family Medicine • University Medicine - Governor Street Primary Care
4

CTC Cohort 2: 21 practice sites
• Anchor Medical Associates - Lincoln • Anchor Medical Associates - Providence • Anchor Medical Associates - Warwick • Aquidneck Medical Associates - Newport • Aquidneck Medical Associates - Portsmouth • Associates in Primary Care Medicine • East Bay Community Action Program - East Providence • East Bay Community Action Program - Newport • Medical Associates of RI - Bristol • Medical Associates of RI - East Providence • Ocean State Medical, LLC • Tri Town Community Action Program • University Internal Medicine • University Medicine - 909 North Main Street • University Medicine - Barrington • University Medicine - East Ave • University Medicine - Plain Street • University Medicine - Warwick Family Medicine • WellOne Primary Medicine - Foster • WellOne Primary Medicine - North Kingstown • WellOne Primary Medicine - Pascoag
5
6
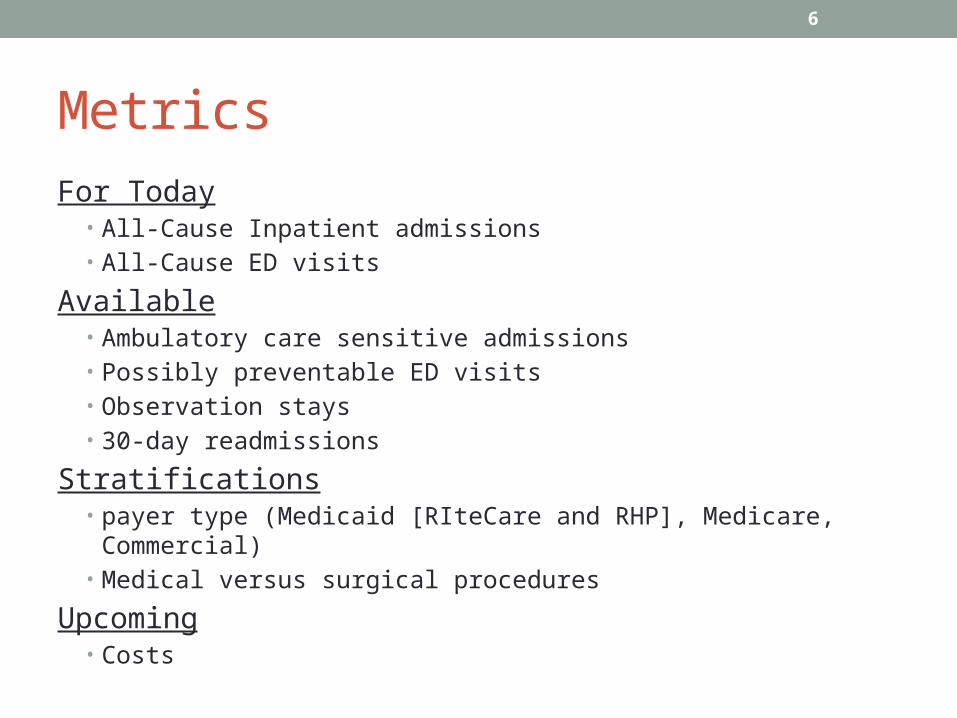
Metrics
For Today• All-Cause Inpatient admissions• All-Cause ED visits
Available• Ambulatory care sensitive admissions• Possibly preventable ED visits• Observation stays • 30-day readmissions
Stratifications• payer type (Medicaid [RIteCare and RHP], Medicare, Commercial)• Medical versus surgical procedures
Upcoming• Costs

Default: Rate for Rolling Years(Trailing Four Quarters)
Numerator
Number of measure-specified events (e.g., ED visits) in the trailing four quarters.
Denominator
Sum of all time with coverage (in monthly chunks) in the trailing year across the covered population, expressed as 1,000 member-months.
7

CTC Cohort 1 and Comparison Changes
8
Changes 2013 - 2014
GroupYear Ending
Mar 2013Year Ending
Mar 2014 Difference % Difference(A) (B) (B-A) (B-A)/A
All-cause inpatient admissions per 1000 member months:
(1) CTC Cohort 1 6.23 6.26 0.03 0.48%
(2) Comparison 7.50 7.19 (0.31) (4.13)%
Difference (1-2) 0.34 4.61%
All-cause ED visits per 1000 member months:
(1) CTC Cohort 1 25.76 25.54 (0.22) (0.85%)
(2) Comparison 21.31 21.90 0.59 2.77%
Difference (1-2) (0.81) (3.62%)
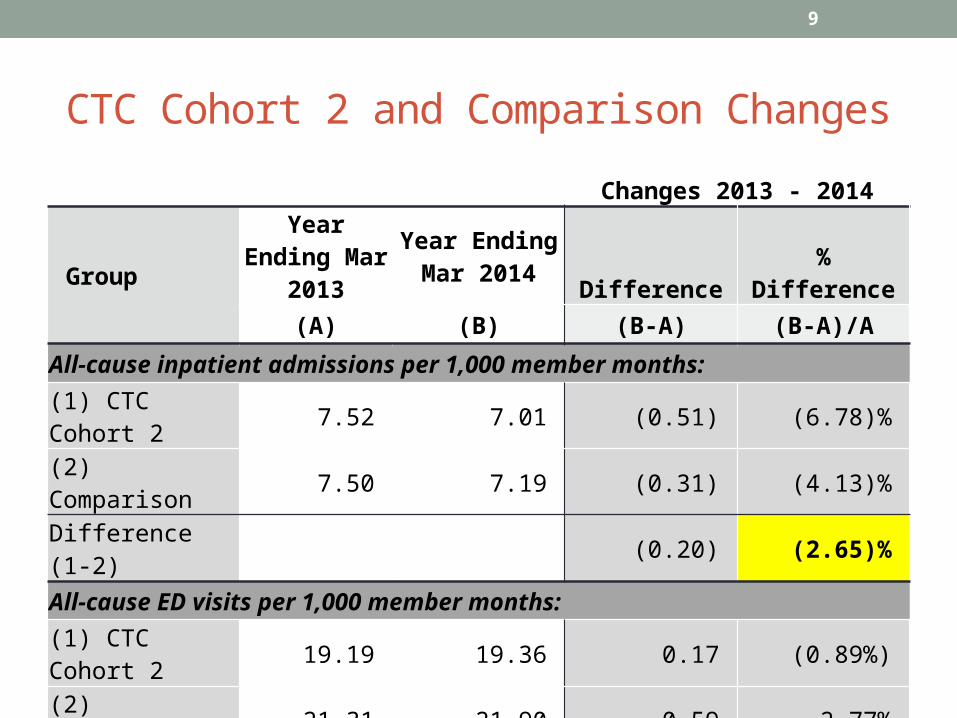
CTC Cohort 2 and Comparison Changes
9
Changes 2013 - 2014
GroupYear Ending
Mar 2013Year Ending
Mar 2014 Difference % Difference(A) (B) (B-A) (B-A)/A
All-cause inpatient admissions per 1,000 member months:
(1) CTC Cohort 2 7.52 7.01 (0.51) (6.78)%
(2) Comparison 7.50 7.19 (0.31) (4.13)%
Difference (1-2) (0.20) (2.65)%
All-cause ED visits per 1,000 member months:
(1) CTC Cohort 2 19.19 19.36 0.17 (0.89%)
(2) Comparison 21.31 21.90 0.59 2.77%
Difference (1-2) (0.42) (1.88%)

Payer Type Mix
Cohort 1 Cohort 2 Comparison
2013 2014 2013 2014 2013 2014
Commercial 68% 66% 71% 70% 69% 68%
Medicare Advantage
13
13 18 18 17 17
RIteCare 14 16 8 9 9 11
RHP 5 5 3 3 3 4
Medicaid FFS1
0 0 0 0 2 1
1Medicaid data from EOHHS is in processing

11
All-Cause Admission Rate: All Payers3/
2012
6/20
12
9/20
12
12/2
012
3/20
13
6/20
13
9/20
13
12/2
013
3/20
14
4
5
6
7
8
9
6.7
6.2 6.3
7.17.5
7.0
7.6 7.57.2
Cohort 1 (N=39,502)Cohort 2(N=50,522)Comparison(N=180,457)N=avg.member-years
Year Ending
Even
ts per 1000 mem
ber m
onths
12
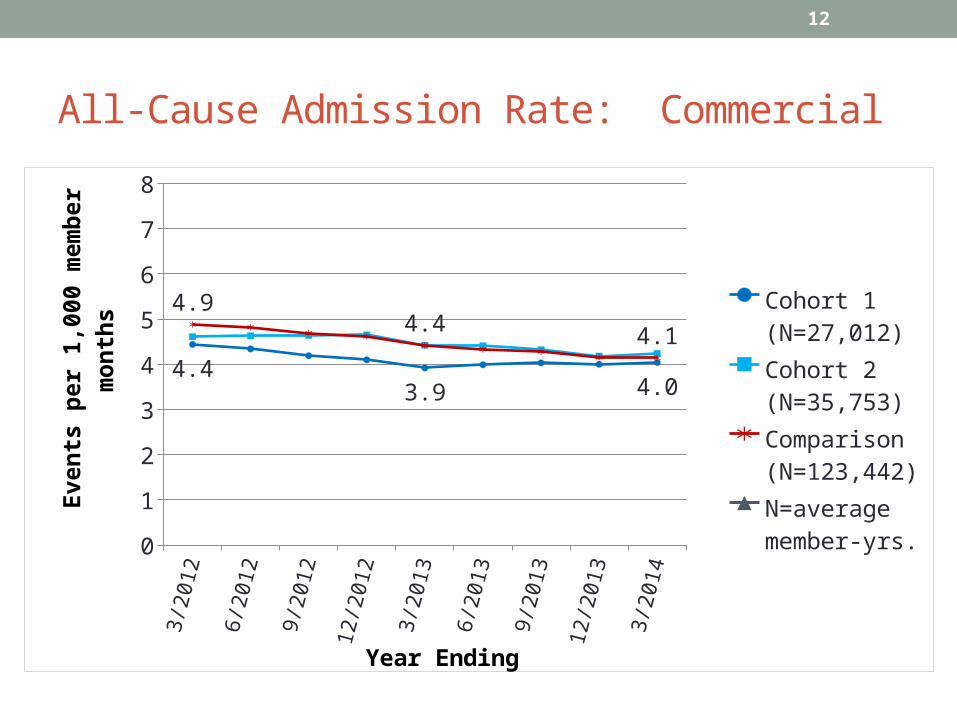
All-Cause Admission Rate: Commercial3/
2012
6/20
12
9/20
12
12/2
012
3/20
13
6/20
13
9/20
13
12/2
013
3/20
14
0
1
2
3
4
5
6
7
8
4.43.9 4.0
4.94.4 4.1
Cohort 1 (N=27,012)Cohort 2(N=35,753)Comparison(N=123,442)N=averagemember-yrs.
Year Ending
Even
ts per 1,000 m
embe
r mon
ths

13
All-Cause Admission Rate: Medicare Advantage
3/20
12
6/20
12
9/20
12
12/2
012
3/20
13
6/20
13
9/20
13
12/2
013
3/20
14
14
15
16
17
18
19
20
21
22
16.8
18.5
17.5
17.4
20.2
18.0
19.3
20.3
19.4Cohort 1 (N=5,094)Cohort 2(N=9,130)Comparison(N=30,883)N=average. member-yrs.
Year Ending
Even
ts per 1,000 m
embe
r mon
ths

14
All-Cause Admission Rate: RiteCare3/
2012
6/20
12
9/20
12
12/2
012
3/20
13
6/20
13
9/20
13
12/2
013
3/20
14
0
1
2
3
4
5
6
7
8
3.9
3.23.3
3.2
4.2Cohort 1 (N=5,350)Cohort 2(N=4,173)Comparison(N=15,945)N = averagemember-yrs.
Year Ending
Even
ts per 1000 mem
ber m
onths
15
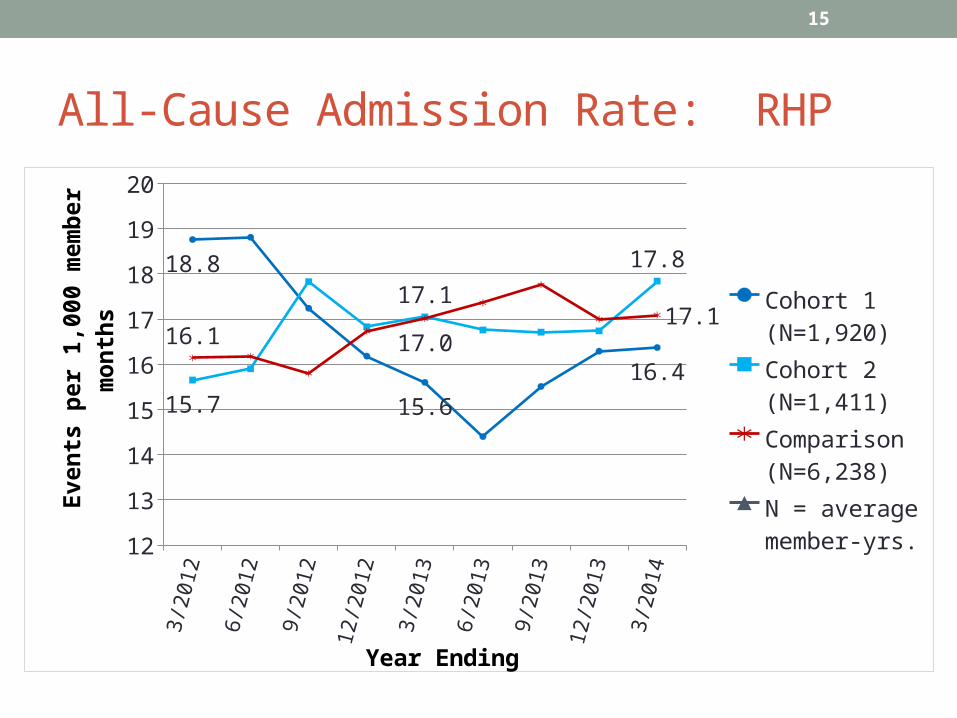
All-Cause Admission Rate: RHP3/
2012
6/20
12
9/20
12
12/2
012
3/20
13
6/20
13
9/20
13
12/2
013
3/20
14
12
13
14
15
16
17
18
19
20
18.8
15.6
16.415.7
17.1
17.8
16.1 17.017.1 Cohort 1
(N=1,920)Cohort 2(N=1,411)Comparison(N=6,238)N = averagemember-yrs.
Year Ending
Even
ts per 1,000 m
embe
r mon
ths

16
ED Visit Rate: All Payers3/
2012
6/20
12
9/20
12
12/2
012
3/20
13
6/20
13
9/20
13
12/2
013
3/20
14
18
20
22
24
26
24.6
25.8 25.5
18.2
19.2 19.4
20.5
21.321.9
Cohort 1 (N=39,502)Cohort 2(N=50,522)Comparison(N=180,45)N = averagemember-yrs.
Year Ending
Even
ts per 1,000 m
embe
r mon
ths
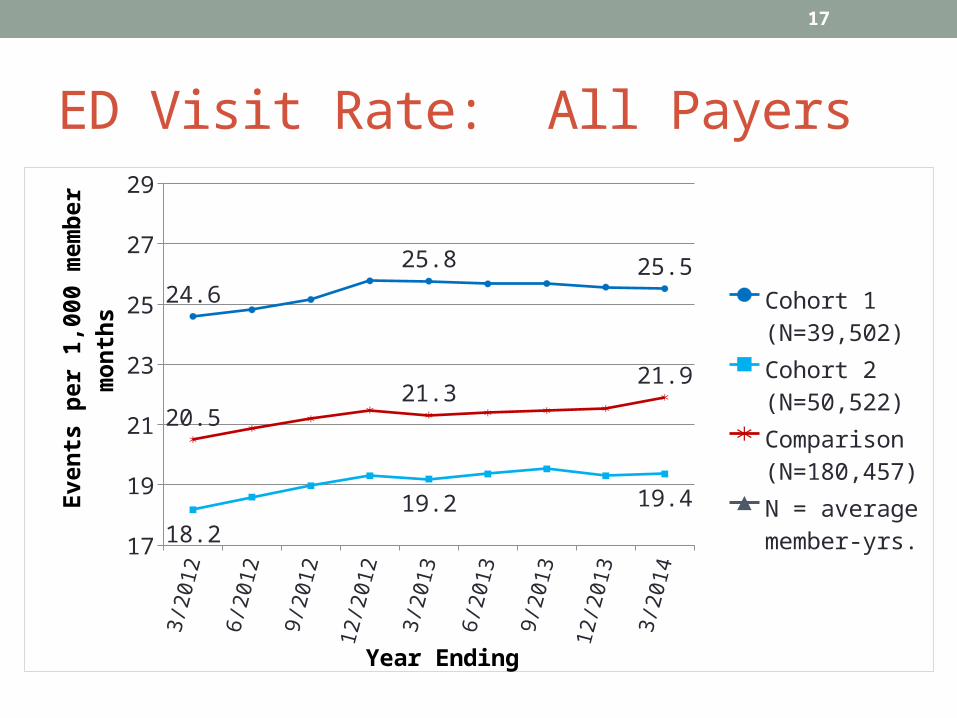
17
ED Visit Rate: All Payers3/
2012
6/20
12
9/20
12
12/2
012
3/20
13
6/20
13
9/20
13
12/2
013
3/20
14
17
19
21
23
25
27
29
24.6
25.8 25.5
18.219.2 19.4
20.521.3
21.9
Cohort 1 (N=39,502)Cohort 2(N=50,522)Comparison(N=180,457)N = averagemember-yrs.
Year Ending
Even
ts per 1,000 m
embe
r mon
ths

18
ED Visit Rate: Commercial3/
2012
6/20
12
9/20
12
12/2
012
3/20
13
6/20
13
9/20
13
12/2
013
3/20
14
10
11
12
13
14
15
16
17
18
13.914.2 14.0
13.2 13.3 13.4
15.0 15.1 14.9Cohort 1 (N=27,012)Cohort 2(N=35,753)Comparison(N=123,442)N = averagemember-yrs.
Year Ending
Even
ts per 1,000 m
embe
r mon
ths
19
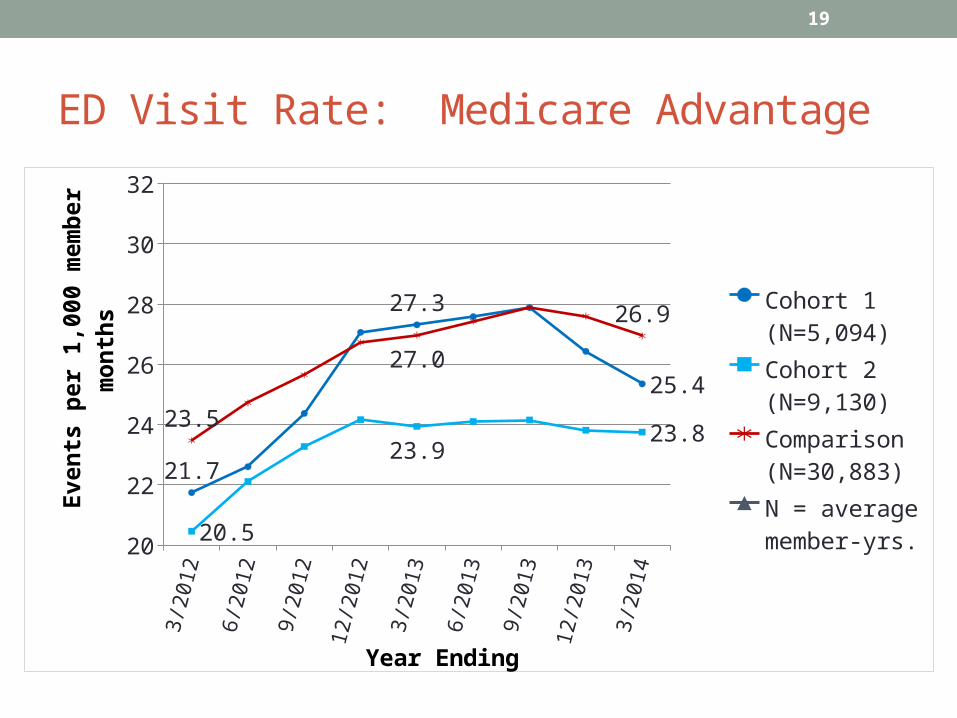
ED Visit Rate: Medicare Advantage3/
2012
6/20
12
9/20
12
12/2
012
3/20
13
6/20
13
9/20
13
12/2
013
3/20
14
20
22
24
26
28
30
32
21.7
27.3
25.4
20.5
23.923.823.5
27.0
26.9 Cohort 1 (N=5,094)Cohort 2(N=9,130)Comparison(N=30,883)N = averagemember-yrs.
Year Ending
Even
ts per 1,000 m
embe
r mon
ths
20
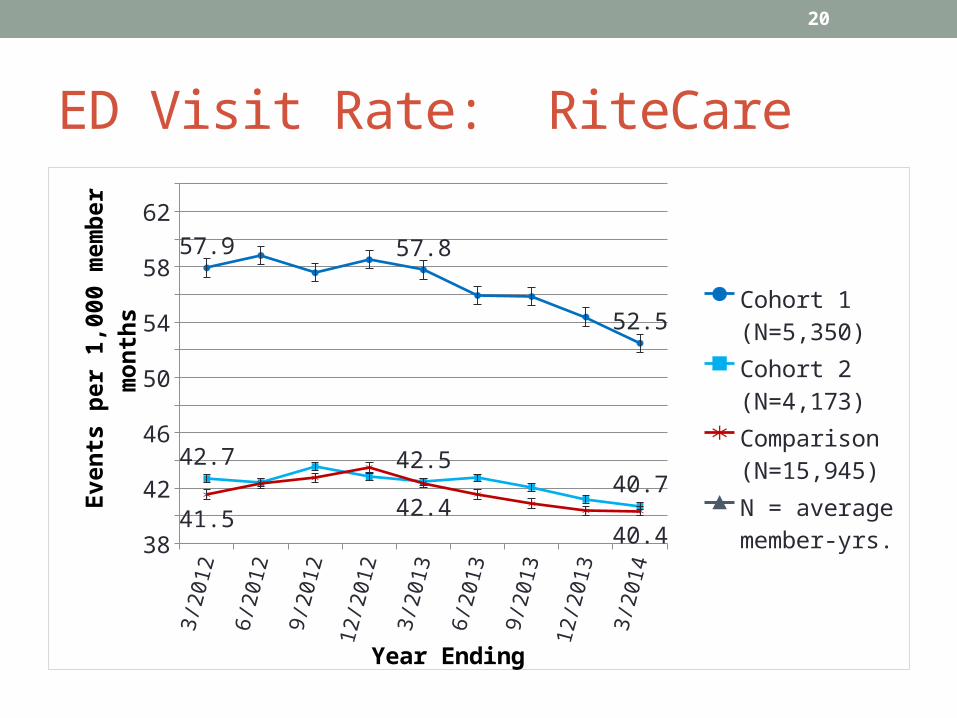
ED Visit Rate: RiteCare3/
2012
6/20
12
9/20
12
12/2
012
3/20
13
6/20
13
9/20
13
12/2
013
3/20
14
3840424446485052545658606264
57.9 57.8
52.5
42.7 42.540.7
41.5 42.440.4
Cohort 1 (N=5,350)Cohort 2(N=4,173)Comparison(N=15,945)N = averagemember-yrs.
Year Ending
Even
ts per 1,000 m
embe
r mon
ths

21
ED Visit Rate: RHP3/
2012
6/20
12
9/20
12
12/2
012
3/20
13
6/20
13
9/20
13
12/2
013
3/20
14
5660646872768084889296
100104
94.0 93.7 94.0
56.6
67.4 69.5
60.8 65.9
74.8
Cohort 1 (N=1,920)Cohort 2(N=1,411)Comparison(N=6,238)N = averagemember-yrs.
Year Ending
Even
ts per 1,000 m
embe
r mon
ths
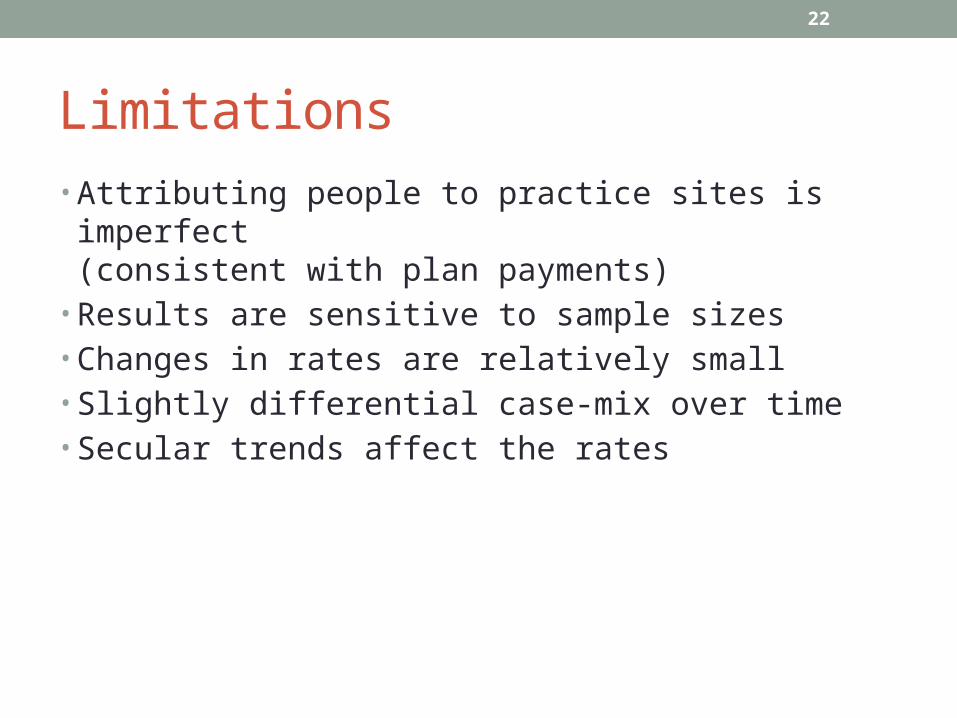
Limitations• Attributing people to practice sites is imperfect
(consistent with plan payments)• Results are sensitive to sample sizes• Changes in rates are relatively small• Slightly differential case-mix over time• Secular trends affect the rates
22

Next Steps• Adding Medicare and Medicaid FFS claims now • Compare risk-adjusted (adjusted for age, gender, and
health status) rates• Program Evaluation Committee focusing on developing a
more robust evaluation plan for CTC • Comparison groups is slightly different• Risk adjustment• Meaningful subgroups• Statistical tests • Accounting for when practices joined CTC
23

Total Cost of Care Measures• Measure is dollars per member per month ($PMPM)
• Raw expenditures based on allowed amounts• Price-adjusted measures using HealthPartners Total Cost of Care
Methodology (National Quality Forum certified)• Risk-adjusted (similar to utilization rates)
• Currently benchmarking against known expenditures from plans as a validity check
• Using all costs instead of a subset (utilizations measures have exclusions)
24
25
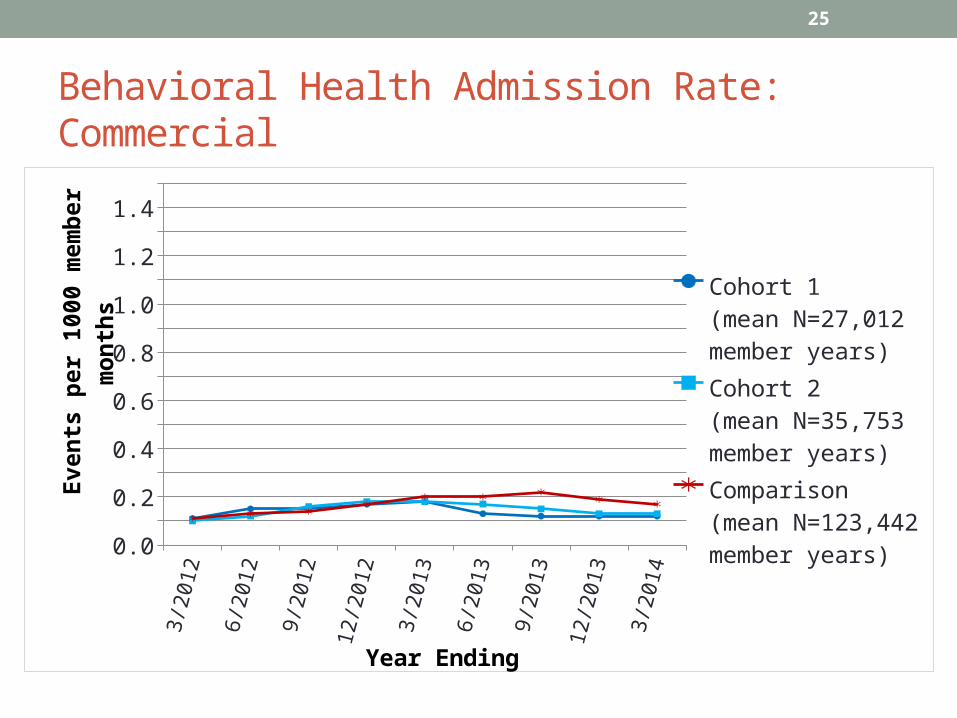
Behavioral Health Admission Rate: Commercial3/
2012
6/20
12
9/20
12
12/2
012
3/20
13
6/20
13
9/20
13
12/2
013
3/20
14
0.0
0.2
0.4
0.6
0.8
1.0
1.2
1.4
Cohort 1 (mean N=27,012 member years)Cohort 2(mean N=35,753 member years)Comparison(mean N=123,442 member years)
Year Ending
Even
ts per 1000 mem
ber m
onths
26
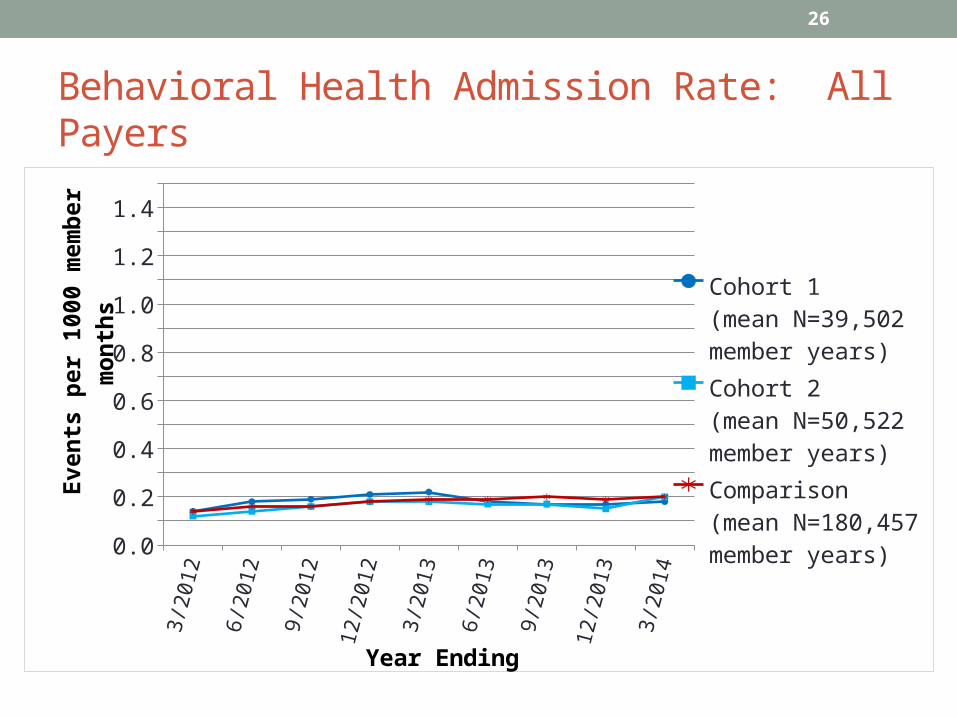
Behavioral Health Admission Rate: All Payers3/
2012
6/20
12
9/20
12
12/2
012
3/20
13
6/20
13
9/20
13
12/2
013
3/20
14
0.0
0.2
0.4
0.6
0.8
1.0
1.2
1.4
Cohort 1 (mean N=39,502 member years)Cohort 2(mean N=50,522 member years)Comparison(mean N=180,457 member years)
Year Ending
Even
ts per 1000 mem
ber m
onths

27
Behavioral Health Admission Rate: Commercial3/
2012
6/20
12
9/20
12
12/2
012
3/20
13
6/20
13
9/20
13
12/2
013
3/20
14
0.0
0.2
0.4
0.6
0.8
1.0
1.2
1.4
Cohort 1 (mean N=27,012 member years)Cohort 2(mean N=35,753 member years)Comparison(mean N=123,442 member years)
Year Ending
Even
ts per 1000 mem
ber m
onths
28
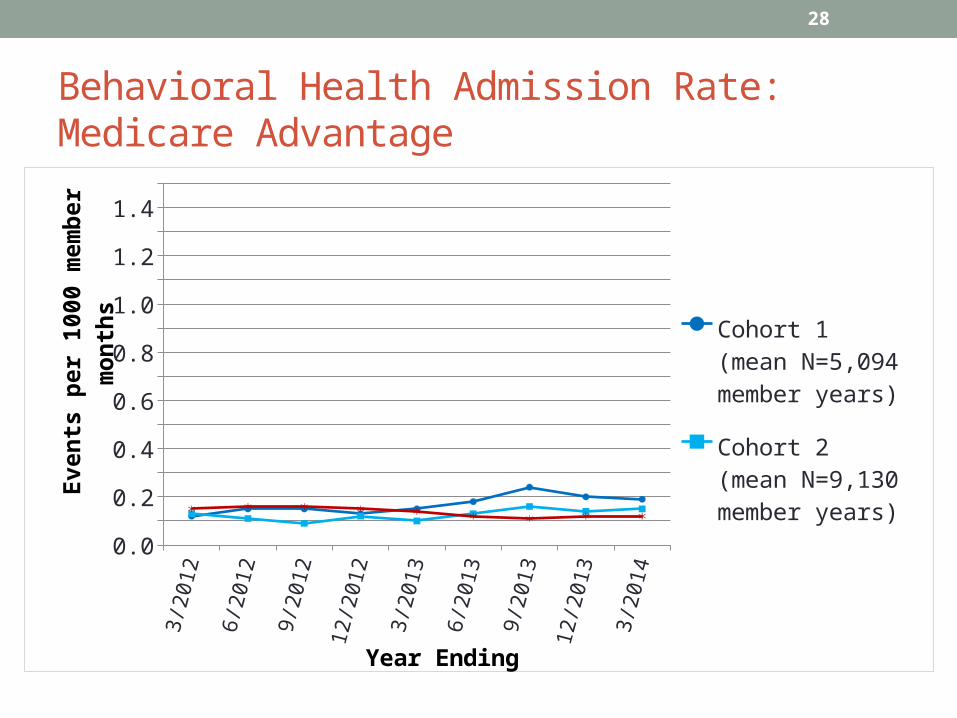
Behavioral Health Admission Rate: Medicare Advantage
3/20
12
6/20
12
9/20
12
12/2
012
3/20
13
6/20
13
9/20
13
12/2
013
3/20
14
0.0
0.2
0.4
0.6
0.8
1.0
1.2
1.4
Cohort 1 (mean N=5,094 member years)Cohort 2(mean N=9,130 member years)Comparison(mean N=30,883 member years)
Year Ending
Even
ts per 1000 mem
ber m
onths

29
Behavioral Health Admission Rate: RiteCare3/
2012
6/20
12
9/20
12
12/2
012
3/20
13
6/20
13
9/20
13
12/2
013
3/20
14
0.0
0.2
0.4
0.6
0.8
1.0
1.2
1.4
Cohort 1 (mean N=5,350 member years)Cohort 2(mean N=4,173 member years)Comparison(mean N=15,945 member years)
Year Ending
Even
ts per 1000 mem
ber m
onths
30
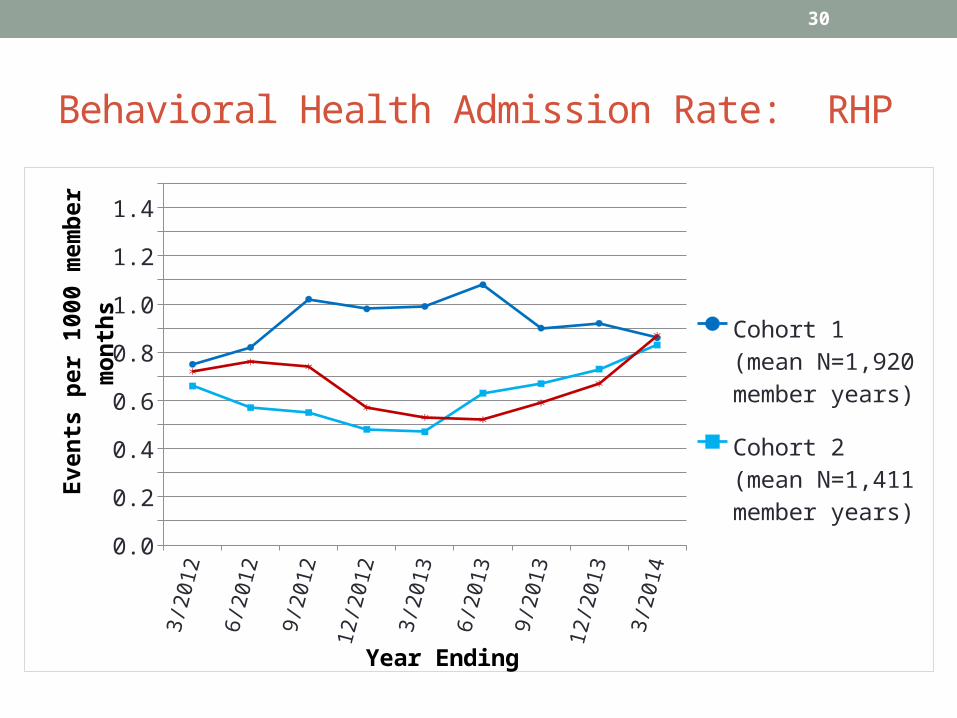
Behavioral Health Admission Rate: RHP3/
2012
6/20
12
9/20
12
12/2
012
3/20
13
6/20
13
9/20
13
12/2
013
3/20
14
0.0
0.2
0.4
0.6
0.8
1.0
1.2
1.4
Cohort 1 (mean N=1,920 member years)Cohort 2(mean N=1,411 member years)Comparison(mean N=6,238 member years)
Year Ending
Even
ts per 1000 mem
ber m
onths
31
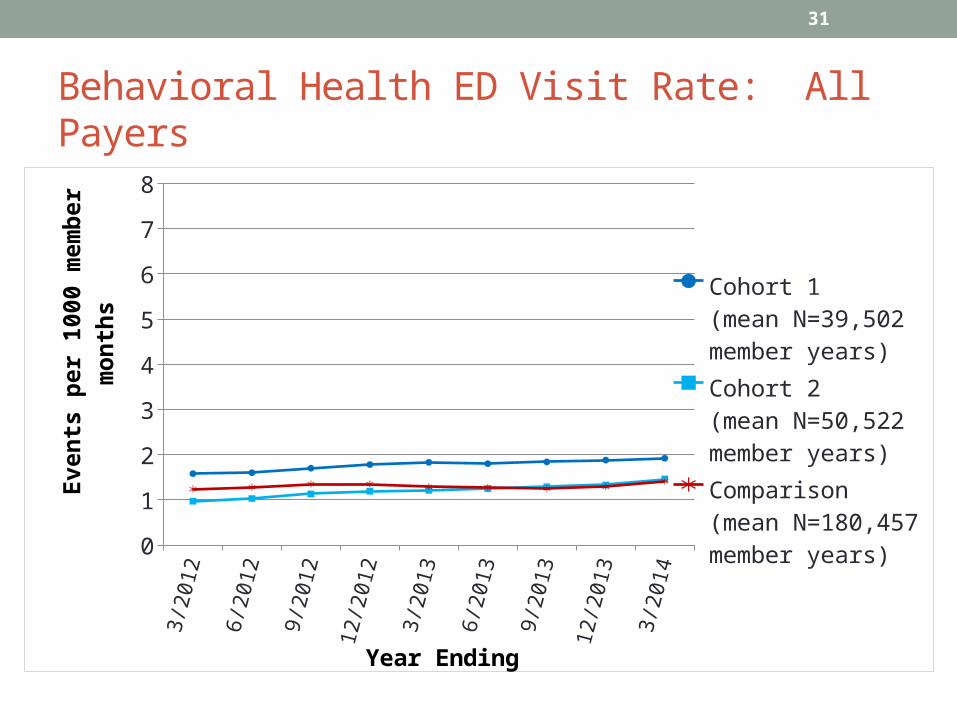
Behavioral Health ED Visit Rate: All Payers3/
2012
6/20
12
9/20
12
12/2
012
3/20
13
6/20
13
9/20
13
12/2
013
3/20
14
0
1
2
3
4
5
6
7
8
Cohort 1 (mean N=39,502 member years)Cohort 2(mean N=50,522 member years)Comparison(mean N=180,457 member years)
Year Ending
Even
ts per 1000 mem
ber m
onths

32
Behavioral Health ED Visit Rate: Commercial3/
2012
6/20
12
9/20
12
12/2
012
3/20
13
6/20
13
9/20
13
12/2
013
3/20
14
0
1
2
3
4
5
6
7
8
Cohort 1 (mean N=27,012 member years)Cohort 2(mean N=35,753 member years)Comparison(mean N=123,442 member years)
Year Ending
Even
ts per 1000 mem
ber m
onths

33
Behavioral Health ED Visit Rate: Medicare Advantage
3/20
12
6/20
12
9/20
12
12/2
012
3/20
13
6/20
13
9/20
13
12/2
013
3/20
14
0
1
2
3
4
5
6
7
8
Cohort 1 (mean N=5,094 member years)Cohort 2(mean N=9,130 member years)Comparison(mean N=30,883 member years)
Year Ending
Even
ts per 1000 mem
ber m
onths
34
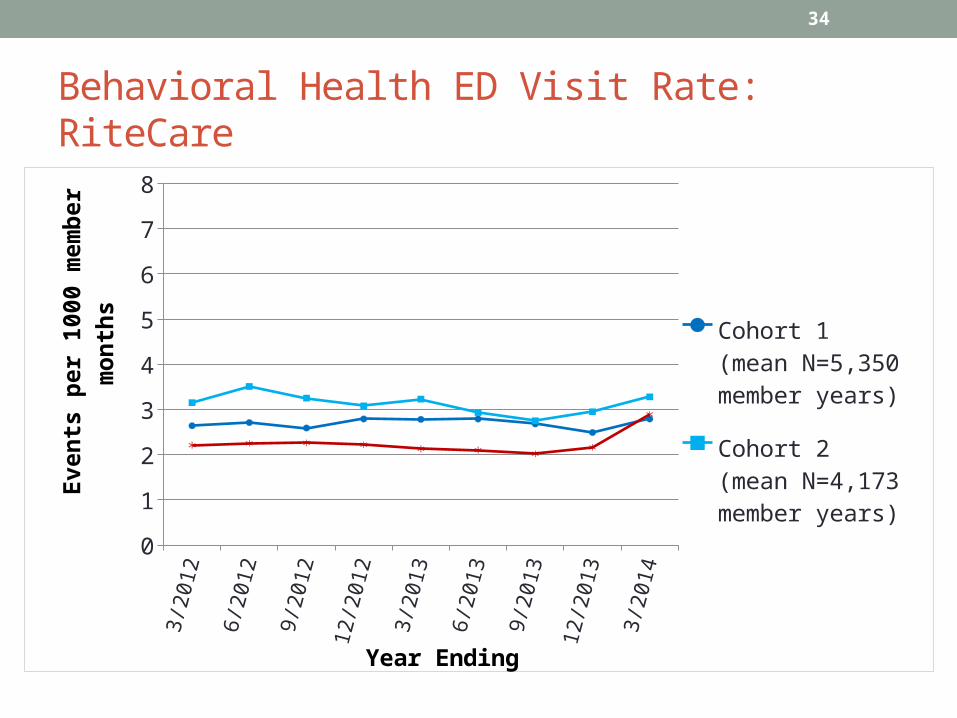
Behavioral Health ED Visit Rate: RiteCare3/
2012
6/20
12
9/20
12
12/2
012
3/20
13
6/20
13
9/20
13
12/2
013
3/20
14
0
1
2
3
4
5
6
7
8
Cohort 1 (mean N=5,350 member years)Cohort 2(mean N=4,173 member years)Comparison(mean N=15,945 member years)
Year Ending
Even
ts per 1000 mem
ber m
onths
35
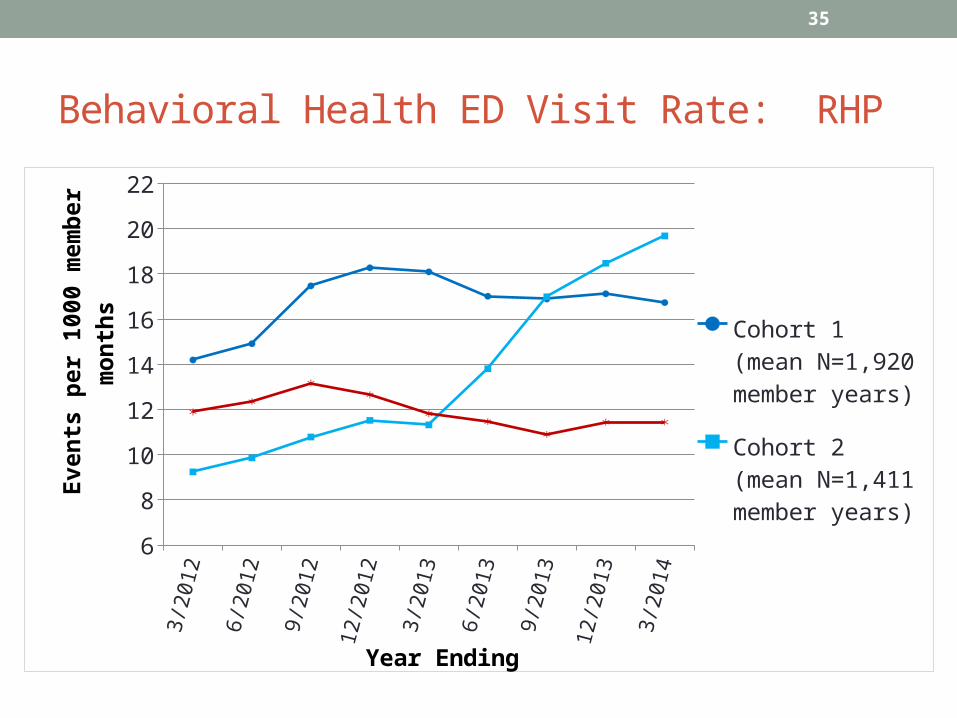
Behavioral Health ED Visit Rate: RHP3/
2012
6/20
12
9/20
12
12/2
012
3/20
13
6/20
13
9/20
13
12/2
013
3/20
14
6
8
10
12
14
16
18
20
22
Cohort 1 (mean N=1,920 member years)Cohort 2(mean N=1,411 member years)Comparison(mean N=6,238 member years)
Year Ending
Even
ts per 1000 mem
ber m
onths