csulb student profiles 2006-2007 characteristics & aspirations
Post on 20-Dec-2015
219 views
TRANSCRIPT
CSULB Student CSULB Student ProfilesProfiles
2006-20072006-2007
Characteristics & AspirationsCharacteristics & Aspirations
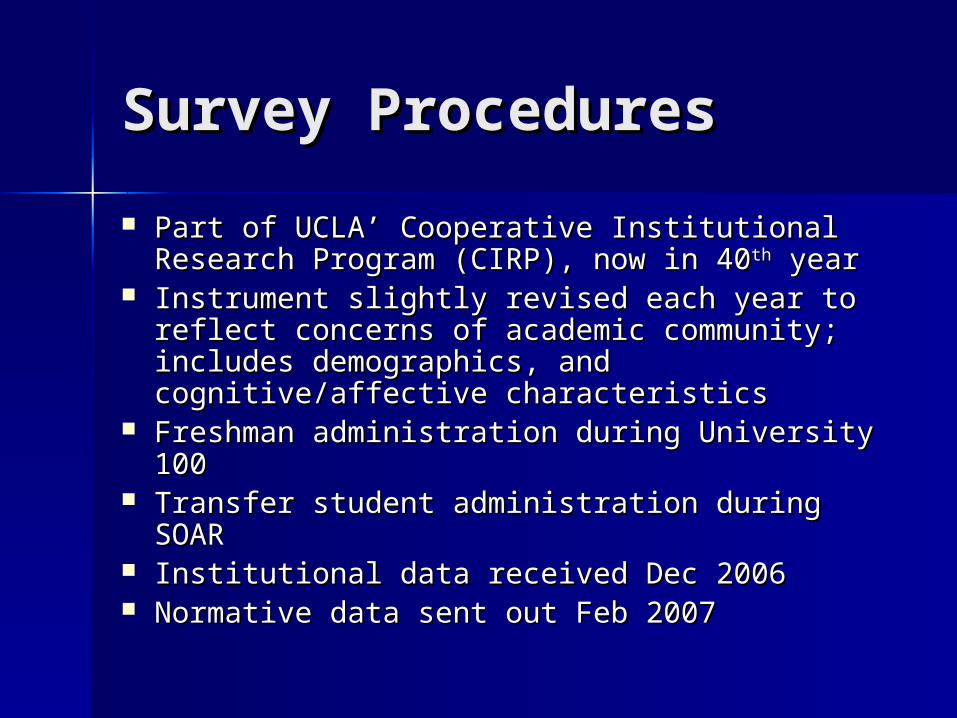
Survey ProceduresSurvey Procedures
Part of UCLA’ Cooperative Institutional Part of UCLA’ Cooperative Institutional Research Program (CIRP), now in 40Research Program (CIRP), now in 40thth year year
Instrument slightly revised each year to Instrument slightly revised each year to reflect concerns of academic community; reflect concerns of academic community; includes demographics, and includes demographics, and cognitive/affective characteristicscognitive/affective characteristics
Freshman administration during University Freshman administration during University 100100
Transfer student administration during SOARTransfer student administration during SOAR Institutional data received Dec 2006Institutional data received Dec 2006 Normative data sent out Feb 2007Normative data sent out Feb 2007

Students Surveyed Since Students Surveyed Since 19971997
0500
10001500200025003000350040004500
1997
1998
1999
2000
2001
2002
2003
2004
2005
2006
Freshmen
TransferStudents
Total surveyed since 1997 = 42,462
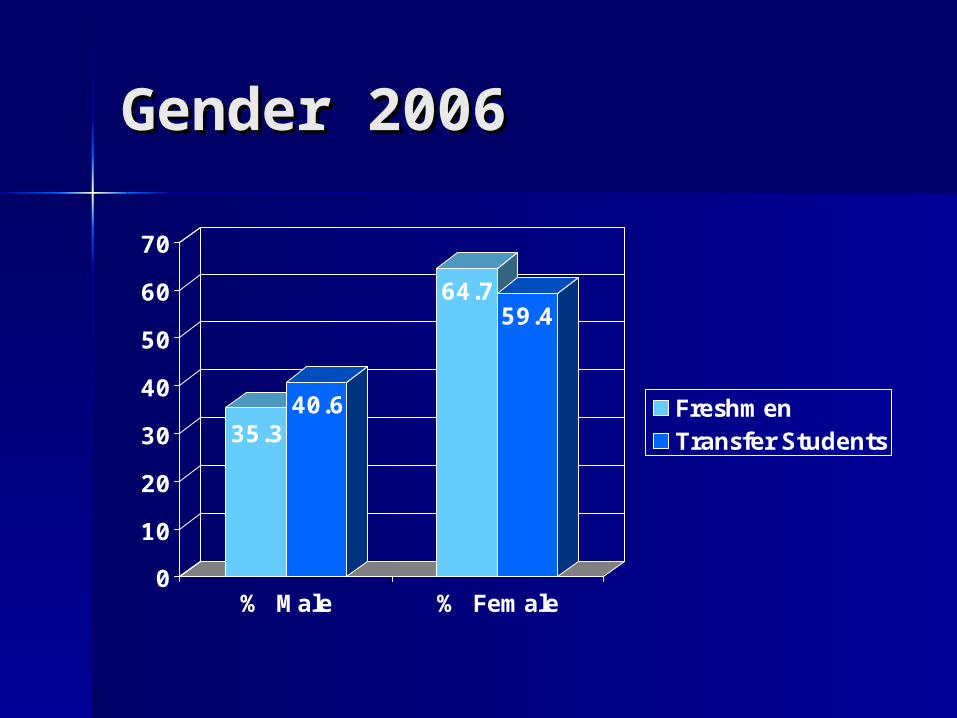
Gender 2006Gender 2006
35.340.6
64.759.4
0
10
20
30
40
50
60
70
% Male % Female
FreshmenTransfer Students

Ethnicity 2006Ethnicity 2006
% Freshmen% Freshmen % Transfer% Transfer
WhiteWhite 39.839.8 45.645.6
African AmerAfrican Amer 5.85.8 4.84.8
Amer IndianAmer Indian 2.32.3 2.22.2
Asian AmerAsian Amer 29.229.2 27.427.4
LatinoLatino 33.033.0 28.928.9
OtherOther 7.57.5 7.77.7

Native English 2006 Native English 2006
75.1 72
24.9 28
0
10
20
30
40
50
60
70
80
% NativeEnglish
% Non-nativeEnglish
FreshmenTransfer Students
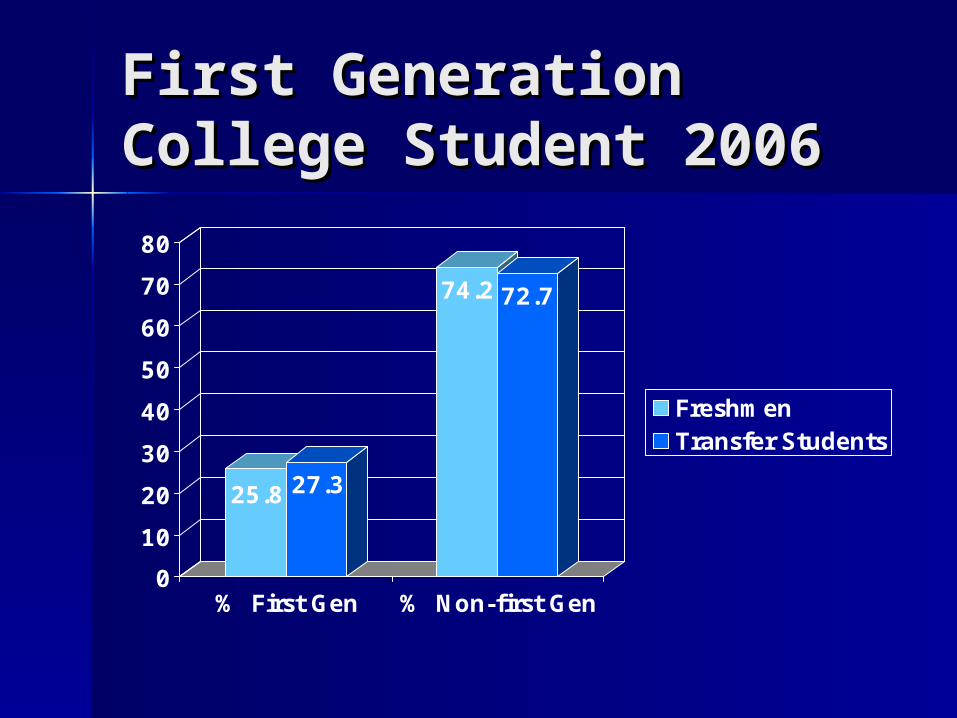
First Generation First Generation College Student 2006College Student 2006
25.8 27.3
74.2 72.7
0
10
20
30
40
50
60
70
80
% First Gen % Non-first Gen
FreshmenTransfer Students
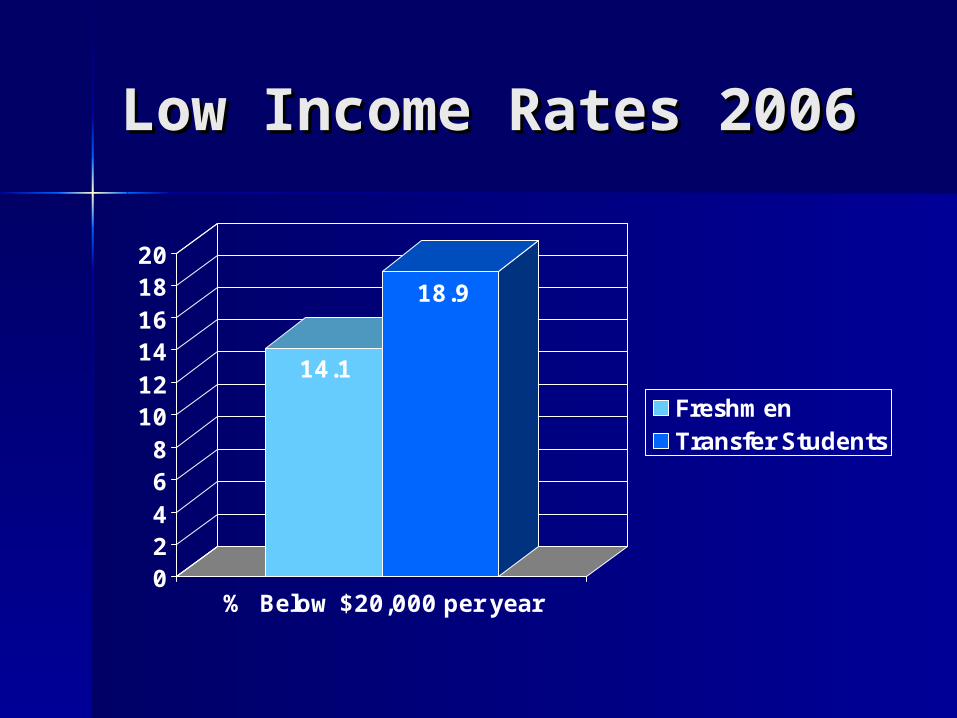
Low Income Rates Low Income Rates 2006 2006
14.1
18.9
02468
101214161820
% Below $20,000 per year
FreshmenTransfer Students
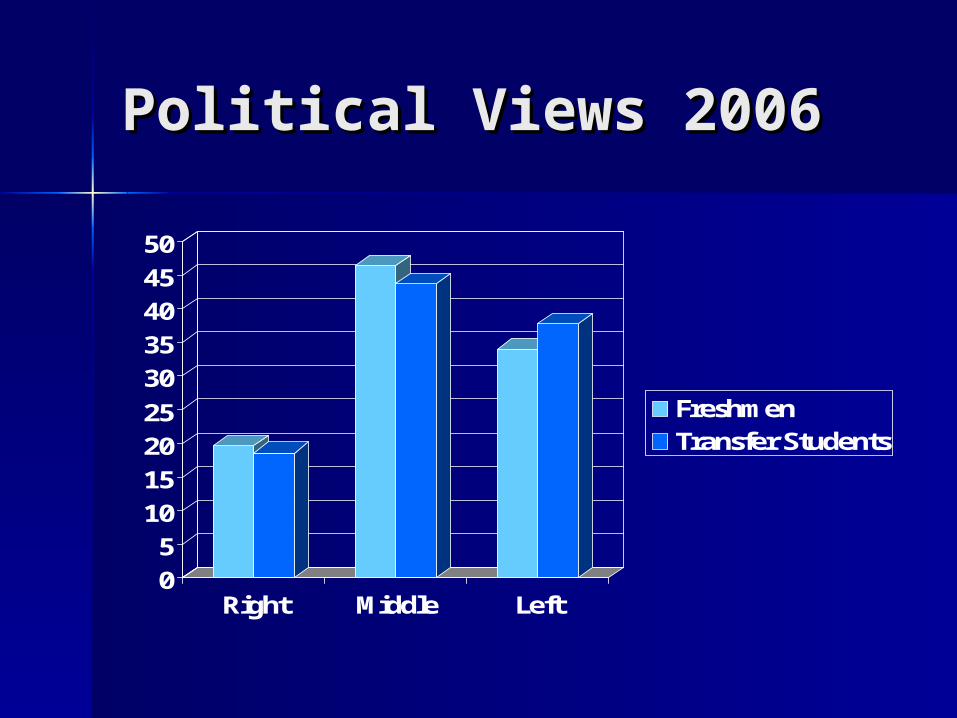
Political Views 2006Political Views 2006
05
101520253035404550
Right Middle Left
FreshmenTransfer Students

Political Views by Ethnicity Political Views by Ethnicity 20062006
0
10
20
30
40
50
60
Right Middle Left
African AmerAsian AmerLatinoWhiteMulticultural
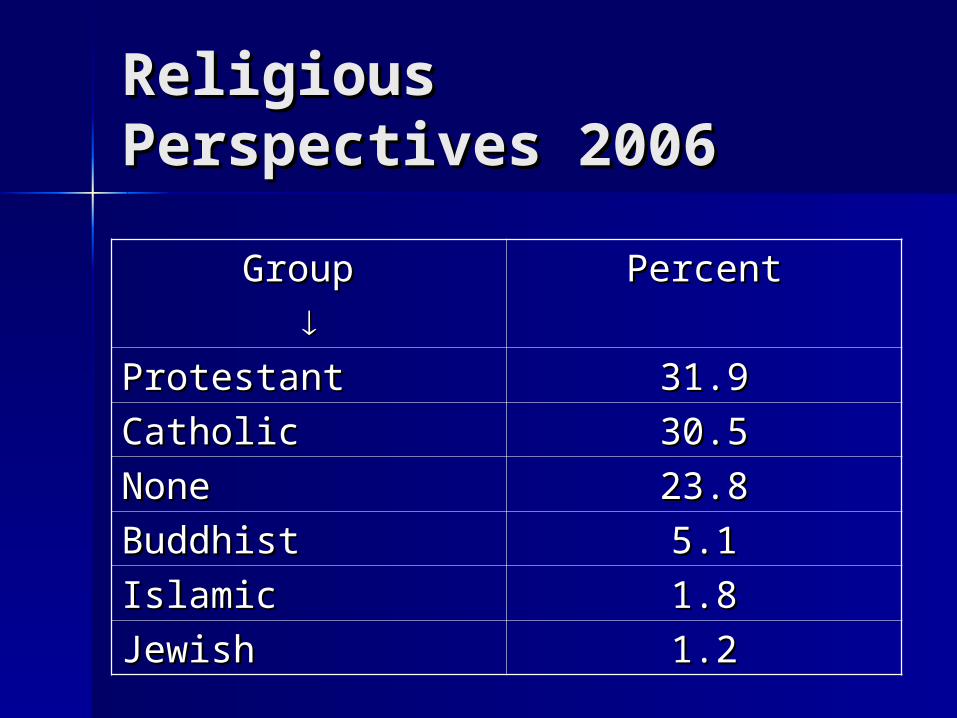
Religious Perspectives Religious Perspectives 20062006
Group Group
PercentPercent
ProtestantProtestant 31.931.9
CatholicCatholic 30.530.5
NoneNone 23.823.8
BuddhistBuddhist 5.15.1
IslamicIslamic 1.81.8
JewishJewish 1.21.2
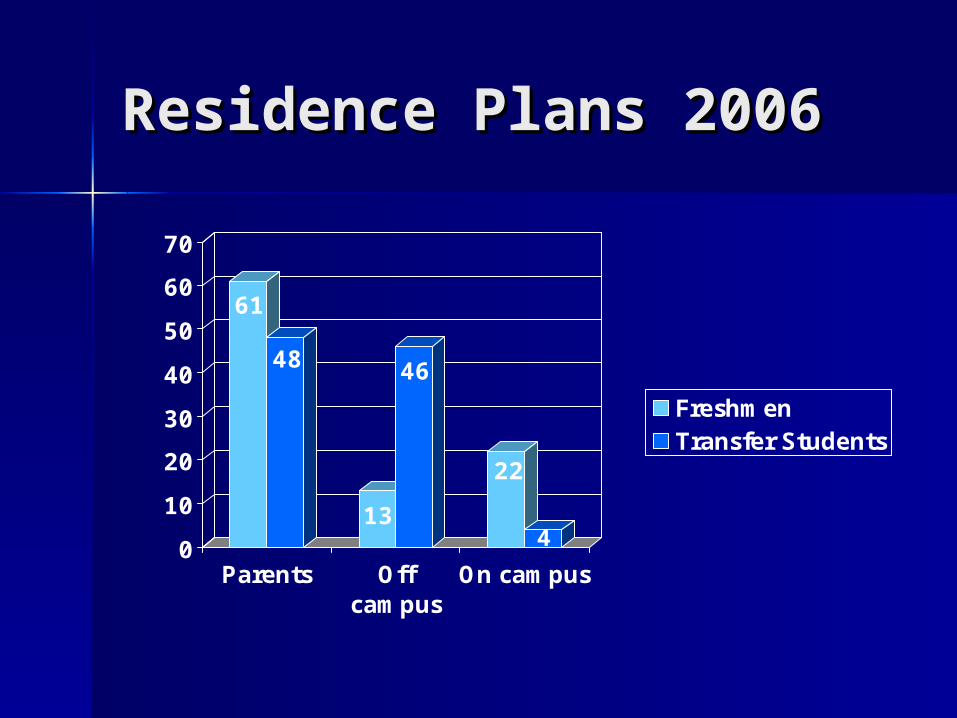
Residence Plans 2006Residence Plans 2006
61
48
13
46
22
40
10
20
30
40
50
60
70
Parents Offcampus
On campus
FreshmenTransfer Students

Degree Aspirations Degree Aspirations 20062006
1 5
2629
5552
1815
0
10
20
30
40
50
60
< BA BA MA,MS Doc
FreshmenTransfer Students
Aspiring to Graduate Degrees: 73% of Freshmen & 67% of Transfer Students

Enrollment Issues Enrollment Issues 20062006
Some or Some or very good very good chance will chance will
% Freshmen% Freshmen % Transfers% Transfers
Change Change majormajor
51.051.0 28.228.2
Need more Need more time to time to degreedegree
57.857.8 59.859.8
Transfer to Transfer to another another schoolschool
30.530.5 10.510.5
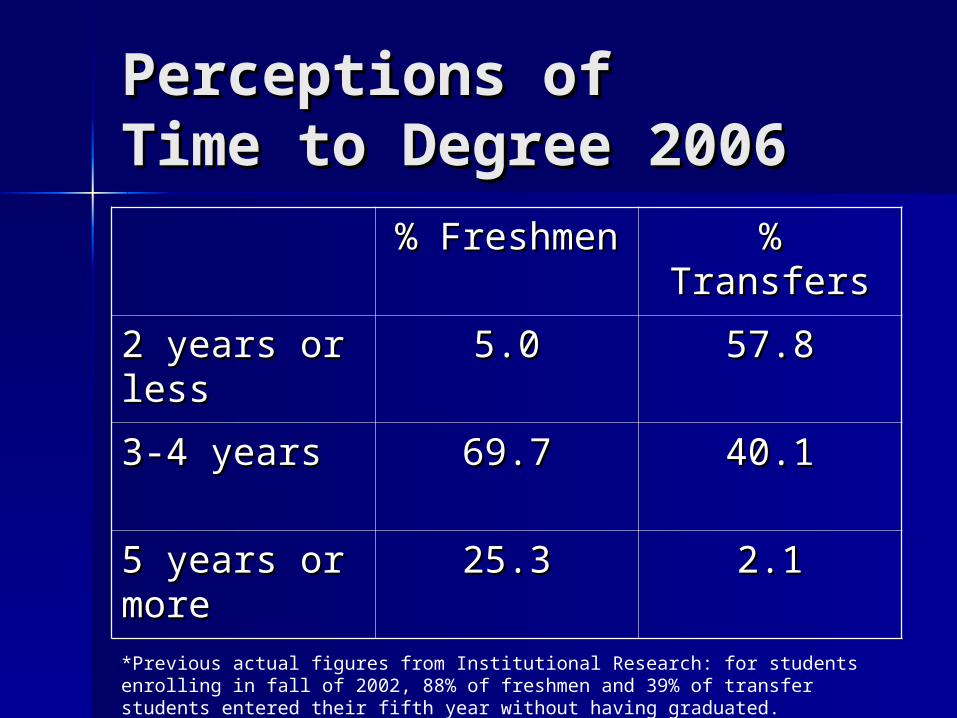
Perceptions of Perceptions of Time to Degree 2006Time to Degree 2006
% Freshmen% Freshmen % Transfers% Transfers
2 years or 2 years or lessless
5.05.0 57.857.8
3-4 years3-4 years 69.769.7 40.140.1
5 years or 5 years or moremore
25.325.3 2.12.1
*Previous actual figures from Institutional Research: for students enrolling in fall of 2002, 88% of freshmen and 39% of transfer students entered their fifth year without having graduated.
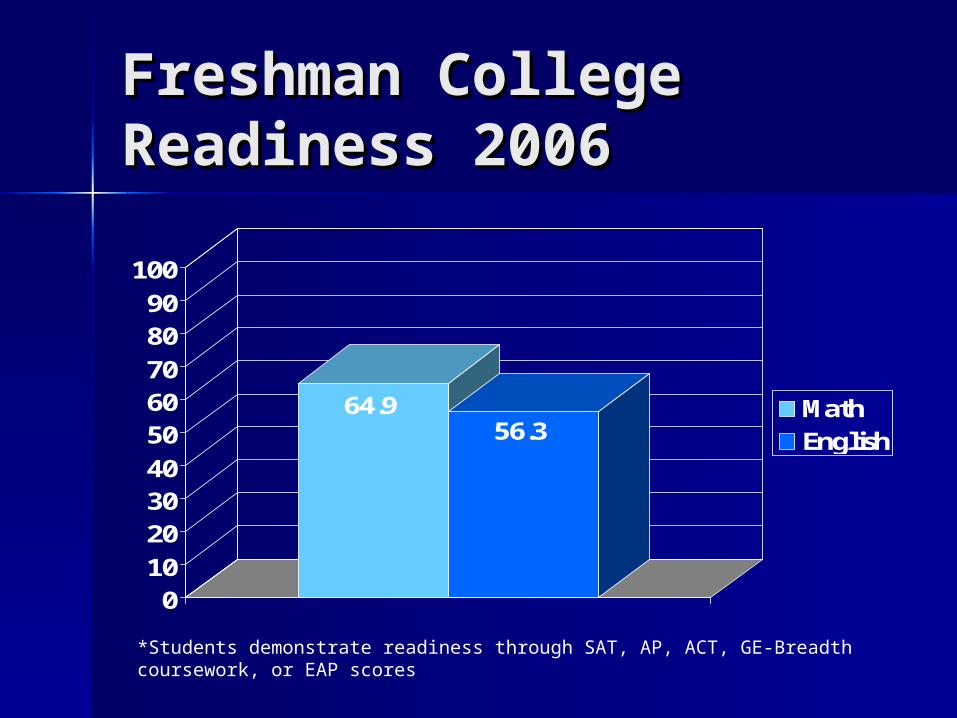
Freshman College Freshman College Readiness 2006Readiness 2006
64.956.3
0102030405060708090
100
MathEnglish
*Students demonstrate readiness through SAT, AP, ACT, GE-Breadth coursework, or EAP scores
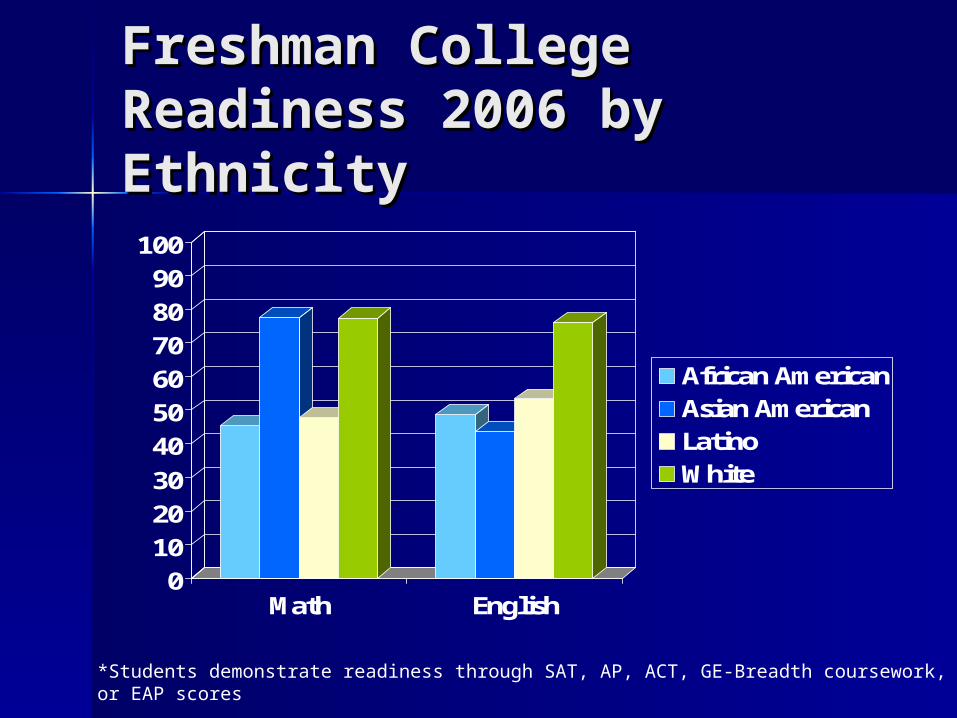
Freshman College Freshman College Readiness 2006 by Readiness 2006 by EthnicityEthnicity
0102030405060708090
100
Math English
African AmericanAsian AmericanLatinoWhite
*Students demonstrate readiness through SAT, AP, ACT, GE-Breadth coursework, or EAP scores

AP Courses Taken in HS AP Courses Taken in HS by Ethnicity 2006by Ethnicity 2006
0102030405060708090
100
African AmericanAsian AmericanLatinoWhite

Intentions to Work Intentions to Work Full-Time by Ethnicity Full-Time by Ethnicity 20062006
0
5
10
15
20
25
Some Chance Very Good Chance
African AmerAsian AmerLatinoWhiteMulticultural
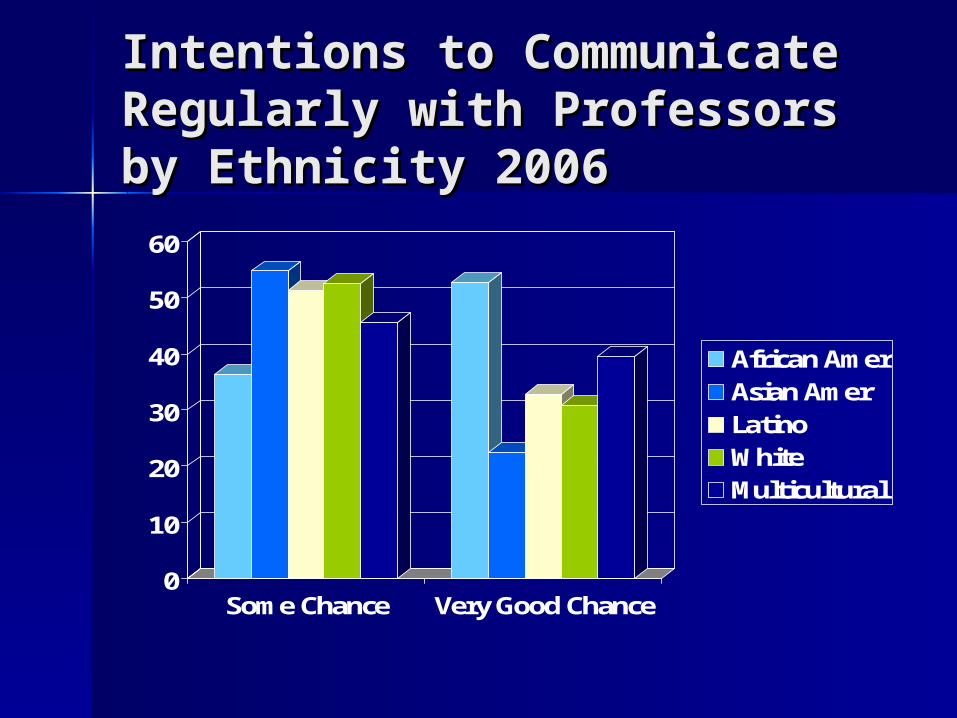
Intentions to Communicate Intentions to Communicate Regularly with Professors Regularly with Professors by Ethnicity 2006by Ethnicity 2006
0
10
20
30
40
50
60
Some Chance Very Good Chance
African AmerAsian AmerLatinoWhiteMulticultural

Top Reasons for Top Reasons for Attending College by Attending College by Ethnicity 2006Ethnicity 2006
EthnicityEthnicity
11stst Reason Reason 22ndnd Reason Reason
African AmerAfrican Amer Make more money Make more money (2.83)(2.83)
Learn things that Learn things that interest me (2.80)interest me (2.80)
Asian AmerAsian Amer Learn things that Learn things that interest me (2.75)interest me (2.75)
Make more money Make more money (2.72)(2.72)
LatinoLatino Learn things that Learn things that interest me (2.82)interest me (2.82)
Make more money Make more money (2.75)(2.75)
White White Learn things that Learn things that interest me (2.77)interest me (2.77)
Make more money Make more money (2.72)(2.72)
MulticulturalMulticultural Make more money Make more money (2.82)(2.82)
Get a better job Get a better job (2.78)(2.78)
Scale: 1=not important to 3=very important

Self Ratings 2006Self Ratings 2006
EthnicityEthnicity
Academic Academic
AbilityAbilityMath Math
AbilityAbilityWriting Writing
AbilityAbility
African AmerAfrican Amer 3.793.79 3.253.25 3.493.49
Asian AmerAsian Amer 3.623.62 3.333.33 3.123.12
LatinoLatino 3.643.64 3.083.08 3.283.28
White White 3.873.87 3.213.21 3.593.59
MulticulturalMulticultural 3.743.74 3.093.09 3.503.50
Scale: 1=lowest 10% to 5=highest 10%

Top Goals by Ethnicity Top Goals by Ethnicity 20062006
EthnicityEthnicity
11stst Goal Goal 22ndnd Goal Goal
African AmerAfrican Amer Be well off Be well off financially (3.53)financially (3.53)
Help others in Help others in difficulty (3.22)difficulty (3.22)
Asian AmerAsian Amer Be well off Be well off financially (3.38)financially (3.38)
Raise a family Raise a family (3.20)(3.20)
LatinoLatino Be well off Be well off financially (3.35)financially (3.35)
Raise a family Raise a family (3.11)(3.11)
White White Raise a family Raise a family (3.17)(3.17)
Be well off Be well off financially (3.06)financially (3.06)
MulticulturalMulticultural Be well off Be well off financially (3.47)financially (3.47)
Raise a family Raise a family (3.17)(3.17)
Scale: 1=not important to essential
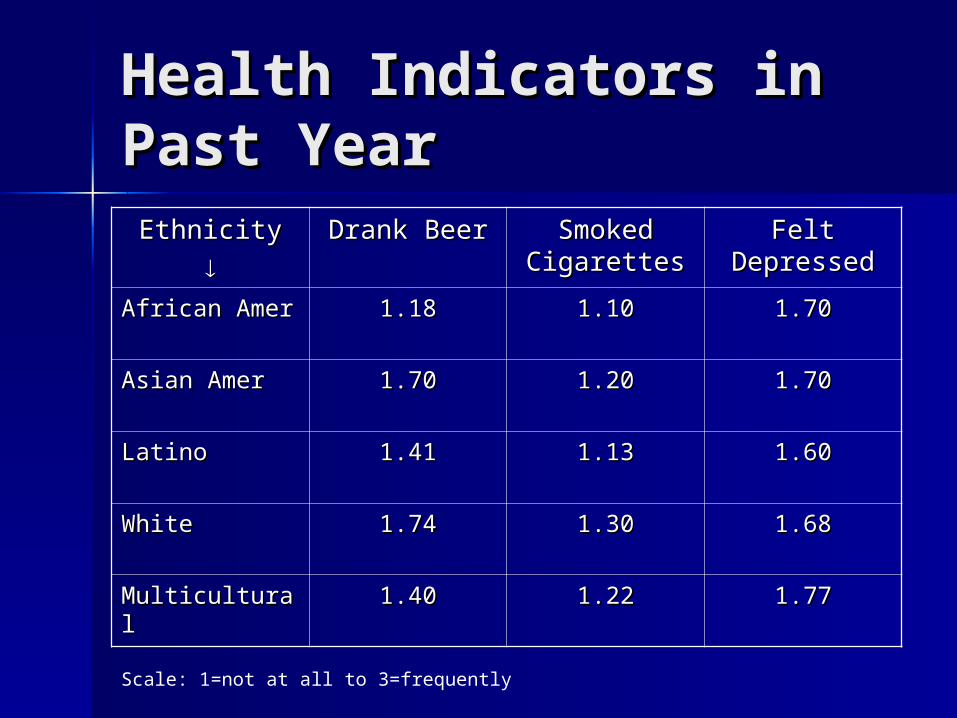
Health Indicators in Health Indicators in Past YearPast Year
EthnicityEthnicity
Drank BeerDrank Beer Smoked Smoked
CigarettesCigarettesFelt Felt
DepressedDepressed
African AmerAfrican Amer 1.181.18 1.101.10 1.701.70
Asian AmerAsian Amer 1.701.70 1.201.20 1.701.70
LatinoLatino 1.411.41 1.131.13 1.601.60
White White 1.741.74 1.301.30 1.681.68
MulticulturalMulticultural 1.401.40 1.221.22 1.771.77
Scale: 1=not at all to 3=frequently
Website and Contact Website and Contact InfoInfo Please visit the Student Please visit the Student
Assessment Findings Website at:Assessment Findings Website at:
CSULB Student Assessment FindingCSULB Student Assessment Findingss
If you’d like analyses or access to If you’d like analyses or access to the databases, please contact Dr. the databases, please contact Dr. Susan Platt: Susan Platt: [email protected]@csulb.edu