csiro wealth from oceans flagship review of the harvest strategy for the commonwealth small pelagic...
TRANSCRIPT
CSIRO WEALTH FROM OCEANS FLAGSHIP
Review of the harvest strategy for the Commonwealth small pelagic fishery
Tony Smith
Hobart, March 24, 2015

Outline
• What is a harvest strategy?
• The current SPF harvest strategy
• The review
• Results
• Conclusions
Insert presentation title
What is a harvest strategy?
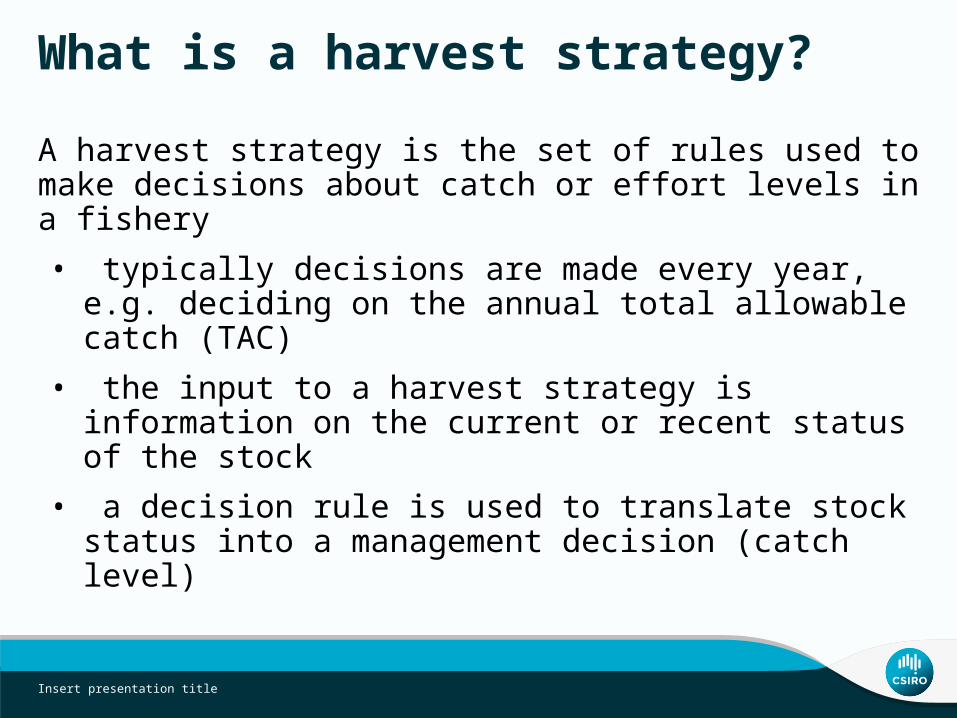
A harvest strategy is the set of rules used to make decisions about catch or effort levels in a fishery
• typically decisions are made every year, e.g. deciding on the annual total allowable catch (TAC)
• the input to a harvest strategy is information on the current or recent status of the stock
• a decision rule is used to translate stock status into a management decision (catch level)
Insert presentation title

The current SPF harvest strategy
• Input into the strategy is the latest egg survey estimate of stock size for each stock
• There are three “tier” levels for the harvest strategy depending on how recent the information is on stock size
• Tier 1: survey in last 5 years• Tier 2: survey older than five years• Tier 3: no recent survey
• The TAC is set using a harvest rate (HR) applied to the most recent survey estimate – a proportion of that estimate
• e.g. Tier 2: the HR is 7.5%, so if the most recent stock size estimate is 10,000t, the TAC would be750t
Insert presentation title

The current SPF harvest strategy
For the current harvest strategy
• The Tier 1 HR averages 15% (steps 20, 17.5, 15, 12.5, 10 each year as the survey ages)
• The Tier 2 HR is 7.5% (half Tier 1), with a maximum possible value of 5,000 t
• The Tier 3 TAC is set at 500 tonnes
• The Tier 1 and 2 harvest rates are the same for all species and stocks
Insert presentation title

The review
• The current SPF harvest strategy was adopted in 2009
• It is normal practice to review these every five years or so
• This review was funded by FRDC and CSIRO
• Two objectives:
1. Provide advice on best practice reference points for the four main target species
2. Provide advice on suitable harvest rates to achieve management objectives for the four main target species in the SPF*
* Note: east and west stocks considered separately
Insert presentation title
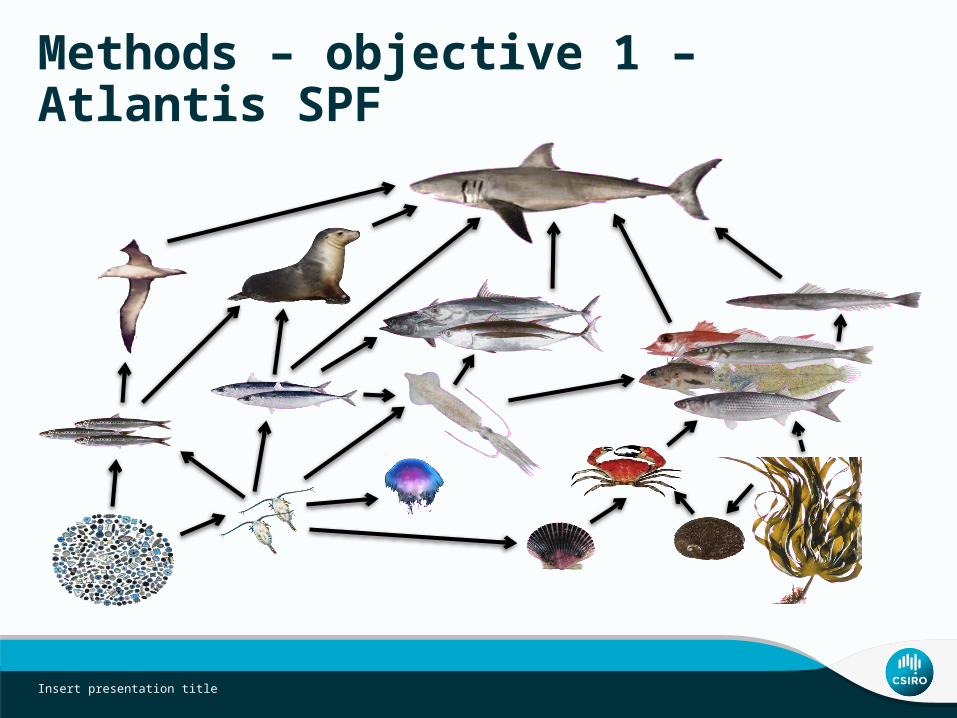
Methods – objective 1 – Atlantis SPF
Insert presentation title
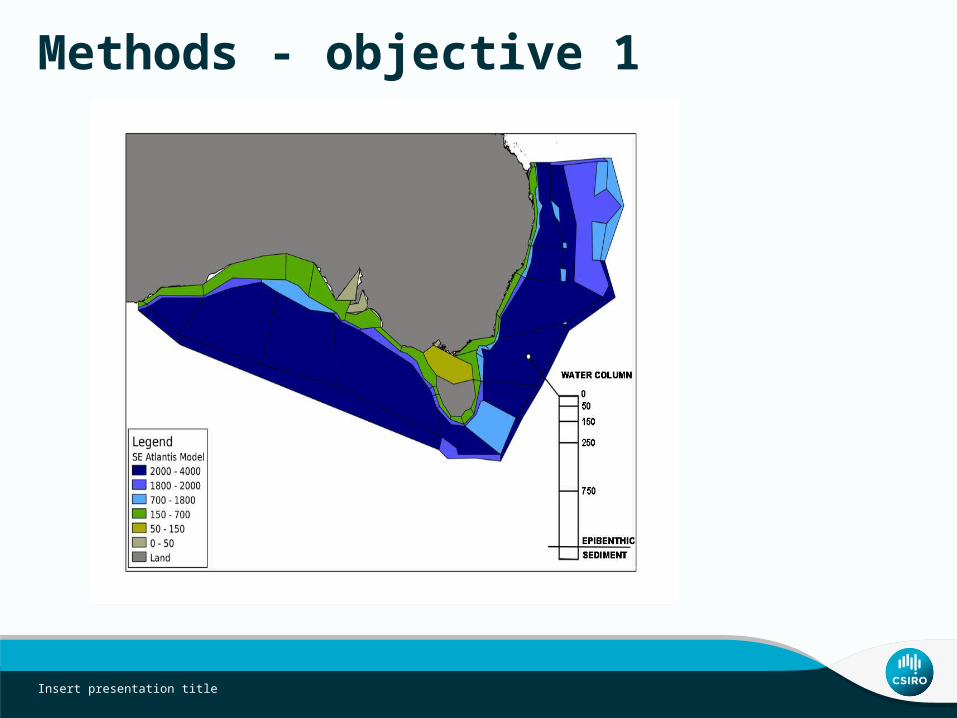
Methods - objective 1
Insert presentation title

Results – objective 1
• Simulated different depletion levels for each stock and for all stocks together
• Looked at how other species and trophic groups in the model changed in abundance due to effects of fishing the SPF species
• Basic finding – minimal impact on predators and other species in the ecosystem
• Why?
• No species rely entirely on SPF species
• Most predators are opportunistic feeders (eat what is available)
• From previous work – get bigger impacts of fishing krill or mesopelagics (lantern fish, myctophids)
Insert presentation title

Predicting tuna diets
Insert presentation title

Methods – objective 2
• Test different harvest strategies to see which ones best meet management objectives (achieve targets and avoid limits)
• The targets (biomass relative to unfished biomass) have been informed by results from objective 1 – aiming for 50% depletion
• The limits are specified in the Commonwealth Harvest Strategy Policy – less than 10% chance of falling below 20% of unfished biomass
• Test various scenarios for applying Tier 1 and Tier 2
• Test for robustness to uncertainty in frequency and accuracy of surveys, stock productivity, fishery selectivity
Insert presentation title

Results – objective 2
• Looked at harvest rates that would result in a 50% chance of being above or below B50 (half the unfished biomass)
• HR at Tier 1 to achieve the target and avoid the limit varies across the species:
• Blue mackerel – 23%• Jack mackerel – 12%• Redbait – 10%• Sardine – 33%
• Taking account of uncertainties (probability of exceeding the limits) could lower the values for blue mackerel and sardines slightly
• Tier 2 HR – still half that for Tier 1 – can improve performance by having more frequent surveys
Insert presentation title
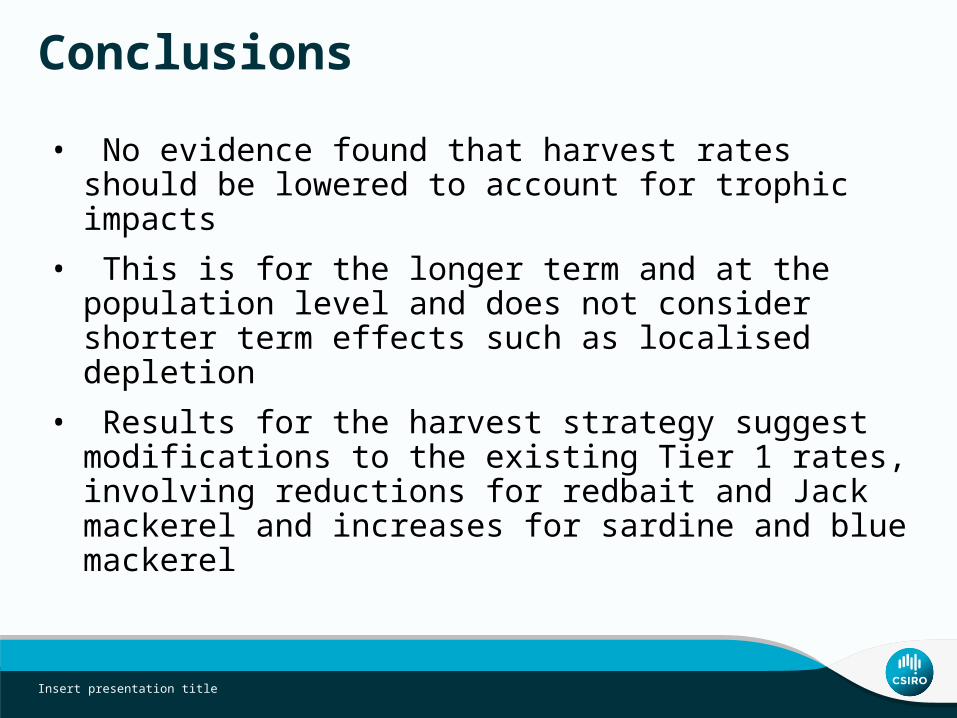
Conclusions
• No evidence found that harvest rates should be lowered to account for trophic impacts
• This is for the longer term and at the population level and does not consider shorter term effects such as localised depletion
• Results for the harvest strategy suggest modifications to the existing Tier 1 rates, involving reductions for redbait and Jack mackerel and increases for sardine and blue mackerel
Insert presentation title
Thank you
Oceans and Atmosphere Research FlagshipTony Smith
WEALTH FROM OCEANS