cse881 project diabetes risk classification qingpeng/project/map.html jingshu chen qingpeng zhang...
Post on 19-Dec-2015
213 views
TRANSCRIPT

CSE881 project
Diabetes Risk Classification
http://www.cse.msu.edu/~qingpeng/Project/map.html
Jingshu Chen Qingpeng Zhang Ming Wu
CSE@MICHIGAN STATE UNIVERSITY
Don’t let Diabetes get you!

Diabetes• 23.6 million/7.8% of the population in the United States
• estimated 17.9 million have been diagnosed
unfortunately, 5.7 million people (or nearly one quarter) are unaware that they have the disease.

Outline
Overview
Methodology
Experimental Setup
Experimental Evaluation
Visualization Demo
Conclusions & Questions?

Overview
Data Set
Data Mining MethodsGenetic+CFSEval+ J48|JRip|NaiveByesGenetic+consistency+ J48|JRip|NaiveByesRanker+infoGain+ J48|JRip|NaiveByesRanksearch+CFSEval+ J48|JRip|NaiveByesGenetic+classfier+ J48|JRip|NaiveByes
Motivationan effective classification methodimportant featuresBehavior/ indicator --- Diabetes

Related workPima Indian diabetic database (PIDD) at the UCIrvine Machine Learning Lab
The database has n=768 patients each with 8 medical examinations, for an incidence rate of 34.9%.
many studies applying data mining techniques to the PIDD(70%-81%)
C4.5 and it was 71.1%(Quinlan 1993)k-NN for k=9 75.3%(Ripley 1996)neural network (Smith, Everhart et al. 1988)
Method:

Method: data and preprocessing
Select consistent Questions from survey(96-07) (Ming)
Extract records from original data files (Ming) files in ASCII format. fixed record length of about 1000
positions. Extract attributes according to the code book.
Demographic: state, age, gender, height/weight, education income,
employ
Facts: health state, insurance, behavior: diet, exercise, tobacco/alcohol use
medical examination: blood pressure, heart-disorder, drug
Opinions: opinion about AIDS, safety, medical policy…
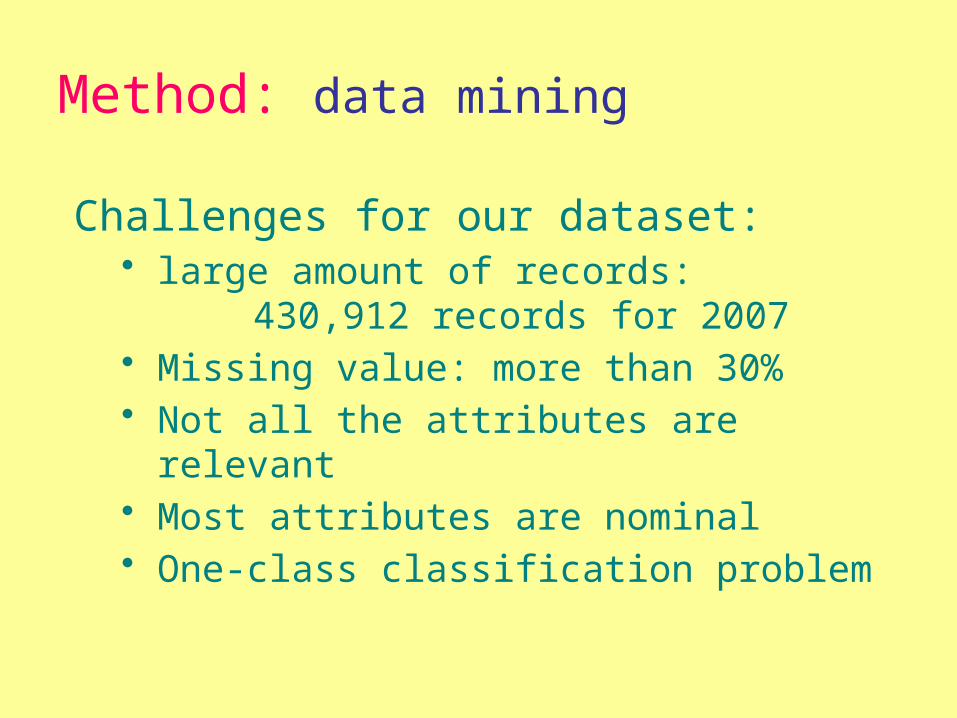
Challenges for our dataset:• large amount of records:
430,912 records for 2007• Missing value: more than 30% • Not all the attributes are relevant• Most attributes are nominal• One-class classification problem
Method: data mining

Split records according to their states (Jingshu)
before split, each data file have at least 190000 instances.
after split, not only fix out record reduction, but also can get information by areas.
Divide records into training data and test data by random(Jingshu)
Method: data mining

Data mining(Jingshu)
Classifiers: Decision Tree J48, Rule Based JripNaiveBayes
Attribute Selection:
Classifier
Information Gain ranking
Correlation-based Feature Selection(CFS)
Consistency-based Subset Evaluation

Method: Visualization
Visualizationmethod accuracy diagram(Jingshu)Display selected feature by states(Qingpeng)
Google Map APIDiabete Risk Calculate(Qingpeng)Design container to hold all visual results(Qingpeng)

Experimental Setup
Experiments were conducted on Intel(R) core(TM)2 Duo CPU [email protected], running Windows Vista,4GB RAM
Tools:Weka 3.4.13/Python/Gnuplot
After processing, we have 12year*50states data files, each with 5000more*50attributes

Experimental Evaluation
Classification accuracy with classifier J48

Experimental Evaluation
Classification accuracy with classifier JRip

Experimental Evaluation
Classficiation accuracy with classifier Naïve Bayes

Experimental Evaluation
Average Accuracy(take california for example)

Visualization Demo
Web page: http://www.cse.msu.edu/~qingpeng/Project/index.html

Conclusion
Classification on Diabetes:Consistency+Genetic+ JRip, with average accuracy >97%.
Insights: top features:
Future work:To use selected feature result to do some diabete risk calculator
Demographic: Age, Employ, Sex
Facts: GeneralHealthy, BodyMassIndex, FluShot Exercise, Alcohol, Fruit,
BloodPressure, Heart-disorder

Questions?