cse 403 lecture 19 reliability testing slides created by marty stepp
TRANSCRIPT

CSE 403Lecture 19
Reliability Testing
slides created by Marty Stepphttp://www.cs.washington.edu/403/
2
Load testing
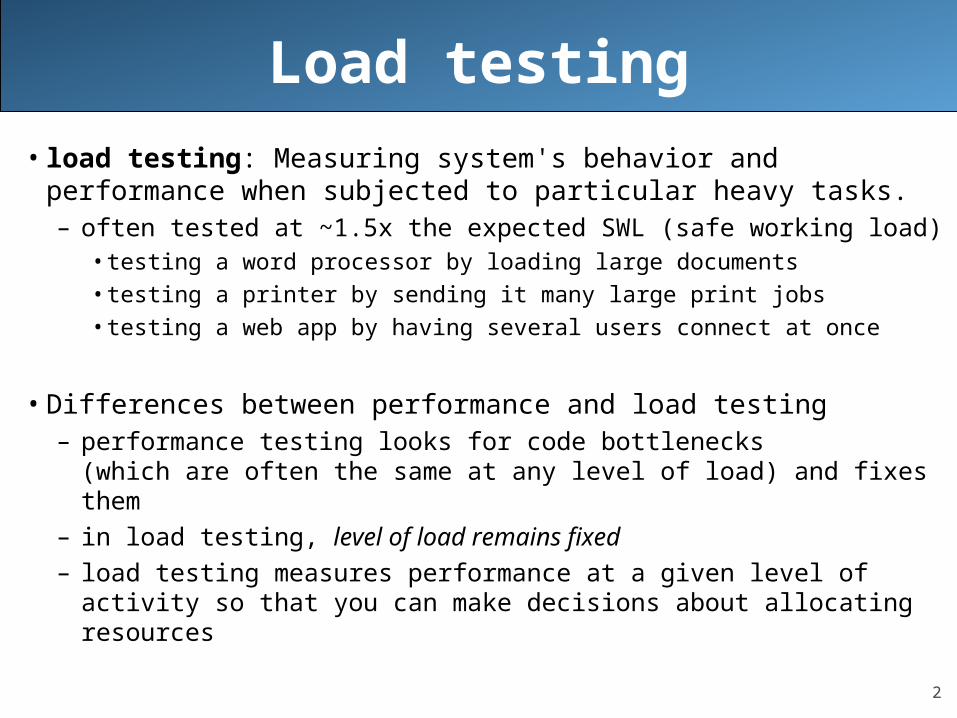
• load testing: Measuring system's behavior and performance when subjected to particular heavy tasks.– often tested at ~1.5x the expected SWL (safe working load)
•testing a word processor by loading large documents•testing a printer by sending it many large print jobs•testing a web app by having several users connect at once
• Differences between performance and load testing– performance testing looks for code bottlenecks
(which are often the same at any level of load) and fixes them– in load testing, level of load remains fixed– load testing measures performance at a given level of activity
so that you can make decisions about allocating resources

3
Goals of load tests
• Expose bugs that don't show up during normal usage– memory leaks / memory management problems– buffer overflows– concurrency problems / race conditions
• Ensure that system meets performance requirements– load tests can be done repeatedly as regression tests to
make sure system retains required performance

4
Stress testing
• stress testing: An extreme load test where the system is subjected to much higher than usual load.– often an error (timeout, etc.) is the expected result
• Goals of stress testing– see how gracefully the system handles unreasonable
conditions– discover any data loss or corruption problems when under load– test recoverability and recovery time
• Difference between load and stress testing– stress testing often runs at a level of load far beyond load tests– stress tests are meant to break things– there's no clear boundary between a load test and stress test

5
JMeter
• Apache's JMeter software performs load tests on a web server– Youtube Video: Getting Started with JMeter

6
Android Monkey
• Android UI/Application Exerciser Monkey: Simulates lots of random clicks / UI interactions on your app.– adb shell monkey [options] <event-count>
e.g. adb shell monkey -p your.package.name -s 42 -v 500– random, but can be seeded (-s 42) so results are
repeatable
– runs until:•given number of events are done•emulator exits your app•app crashes / throws exception•app-not-responding state
– http://developer.android.com/tools/help/monkey.html
7
System reliability
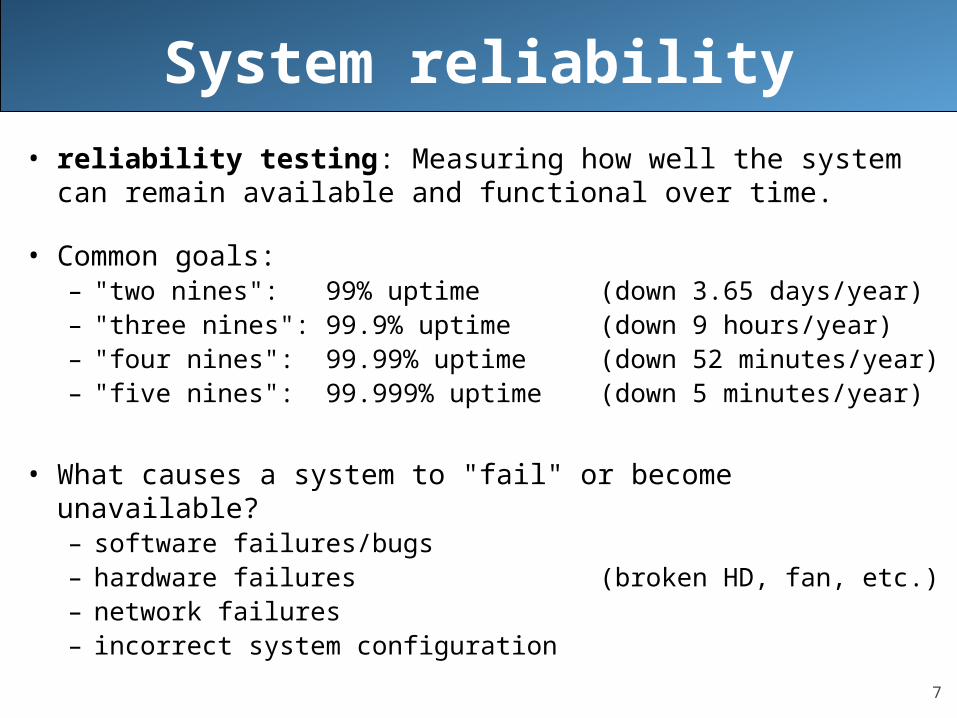
• reliability testing: Measuring how well the system can remain available and functional over time.
• Common goals:– "two nines": 99% uptime (down 3.65 days/year)– "three nines": 99.9% uptime (down 9 hours/year)– "four nines": 99.99% uptime (down 52
minutes/year)– "five nines": 99.999% uptime (down 5 minutes/year)
• What causes a system to "fail" or become unavailable?– software failures/bugs– hardware failures (broken HD, fan, etc.)– network failures– incorrect system configuration

8
Estimating failures• Most hardware fails very early or late
– mean time between failures (MTBF)– FITS: failures per billion hours
• Software failure depends on:– quality of design and process– complexity and size of system– experience of development team– percentage of reused code– depth of testing performed
– "bathtub curve" (see right)– Software failures are often measured per 1000 lines of code.
9
Things to test
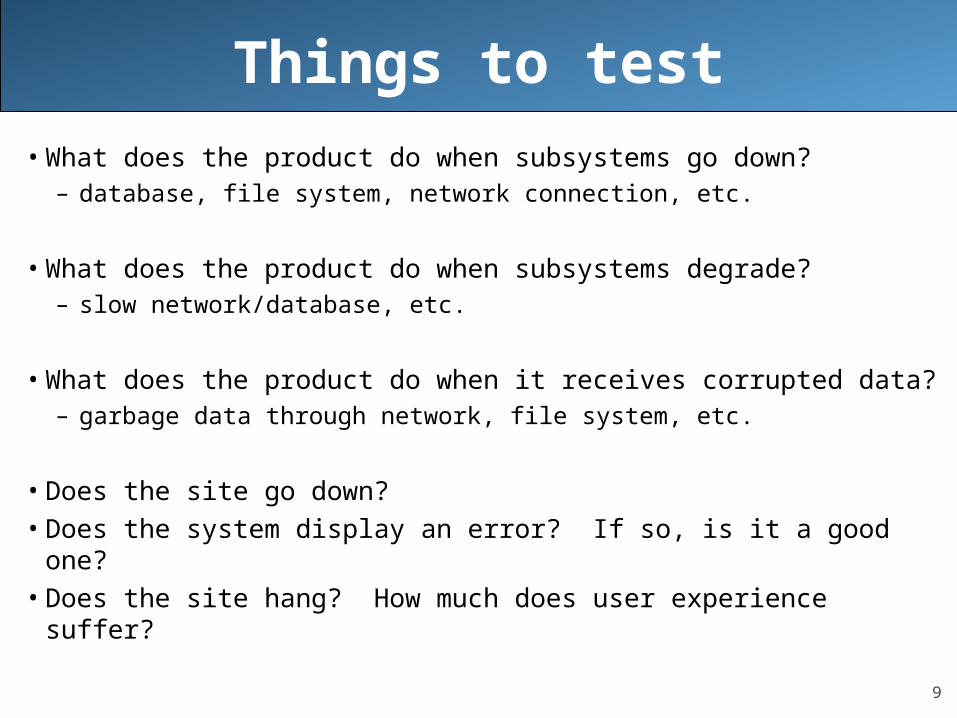
• What does the product do when subsystems go down?– database, file system, network connection, etc.
• What does the product do when subsystems degrade?– slow network/database, etc.
• What does the product do when it receives corrupted data?– garbage data through network, file system, etc.
• Does the site go down?• Does the system display an error? If so, is it a good one?• Does the site hang? How much does user experience
suffer?

10
Improving reliability
• Replicate crucial system components– example: three web servers, two database servers, etc.
• Benefits of replication– system is only considered unavailable if BOTH are down– 2 replicas * 99% reliability => 99.99% reliability
• massive replication (e.g. Google)– If we have 20k machines and
each has 99% reliability, howoften will a machine fail?

11
Repairing failures• Some failure recovery can be automated:
– roll back transaction / fall back to another database– shift the load to another machine(s)– redirect to another site– reboot (Windows!)
• Some failure recovery requires a human component:– on-site support staff– on-call developers or QA engineers
• Estimating failure recovery time– MTTR (mean time to repair)
•< 10 minutes if problem/fix are known•1 hour to 2 weeks if not•availability = MTBF / (MTBF + MTTR)
12
Logging
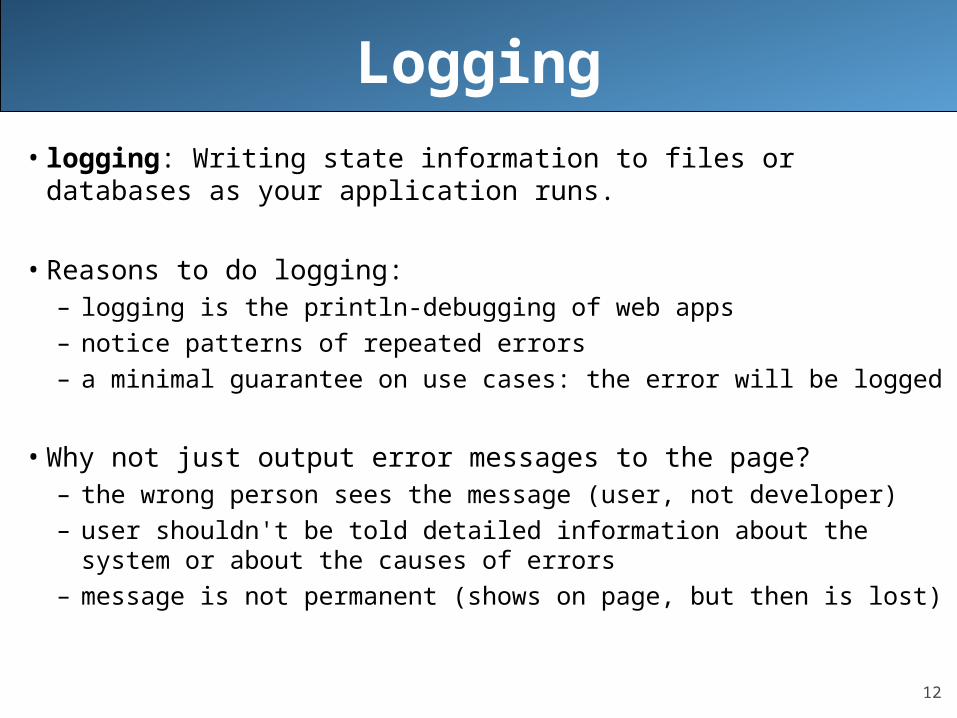
• logging: Writing state information to files or databases as your application runs.
• Reasons to do logging:– logging is the println-debugging of web apps– notice patterns of repeated errors– a minimal guarantee on use cases: the error will be logged
• Why not just output error messages to the page?– the wrong person sees the message (user, not developer)– user shouldn't be told detailed information about the
system or about the causes of errors– message is not permanent (shows on page, but then is lost)
13
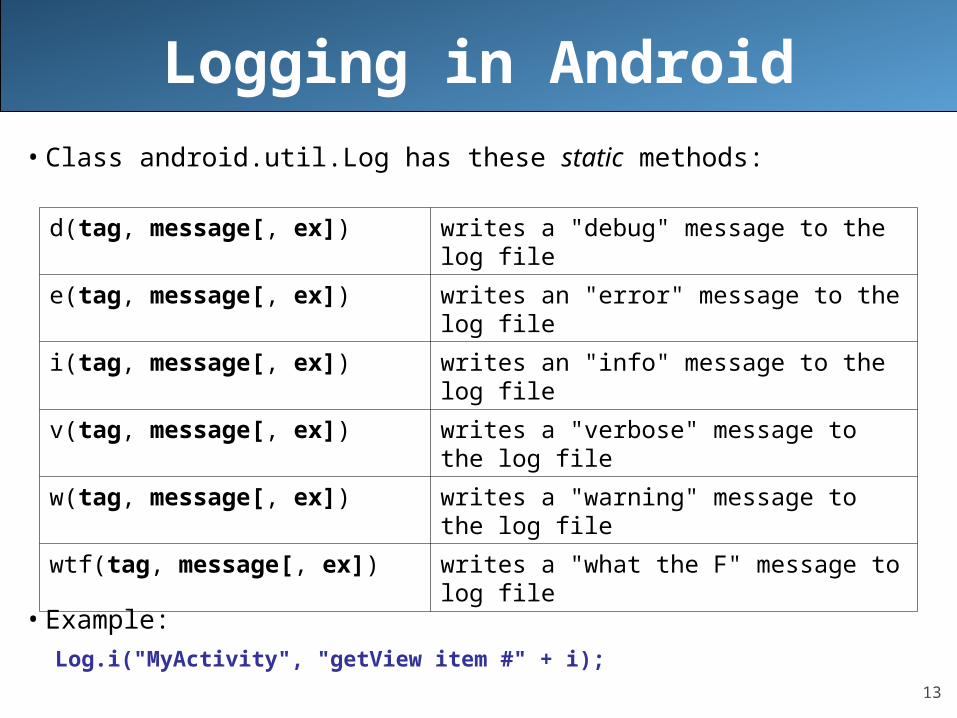
Logging in Android
• Class android.util.Log has these static methods:
• Example:Log.i("MyActivity", "getView item #" + i);
d(tag, message[, ex]) writes a "debug" message to the log file
e(tag, message[, ex]) writes an "error" message to the log file
i(tag, message[, ex]) writes an "info" message to the log file
v(tag, message[, ex]) writes a "verbose" message to the log file
w(tag, message[, ex]) writes a "warning" message to the log file
wtf(tag, message[, ex]) writes a "what the F" message to log file

14
LogCat
• logcat: A tool for viewing Android logs.– viewable in Eclipse– runnable as a stand-alone tool
•adb logcat -v formate.g. adb logcat -v long

15
What to log
• log mostly errors, not success cases (don't flood the log file)
• log enough detail that you can understand it later– What page was the error on?– What method or command was called?– What parameters were passed?– What was the current date/time?– Who was the current user or IP (if known)?– What was the complete stack trace of any exception/error?
• Suggestion: switch log files daily– (many web frameworks do this for you automatically)
16
Properties of Java logging
• It is easy to suppress all log records or just those below a certain level, and just as easy to turn them back on.
• Minimal penalty for leaving logging code in your application.
• Log records can be directed to different handlers, for display in the console, for storage in a file, and so on.
• Logs can be formatted in different ways, e.g. text or XML.
• By default, logging configuration is controlled by a config file.
17
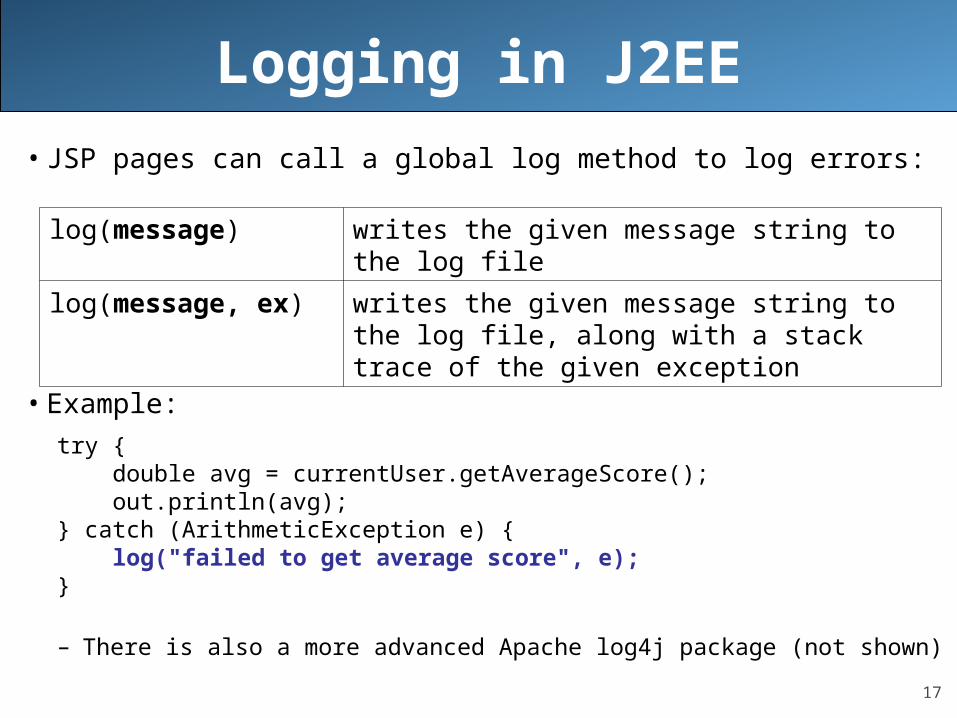
Logging in J2EE
• JSP pages can call a global log method to log errors:
• Example:
try { double avg = currentUser.getAverageScore(); out.println(avg);} catch (ArithmeticException e) { log("failed to get average score", e);}
– There is also a more advanced Apache log4j package (not shown)
log(message) writes the given message string to the log file
log(message, ex) writes the given message string to the log file, along with a stack trace of the given exception

18
java.util.logging
• log levels: Partition different kinds/severities of log messages.– Java's: SEVERE, WARNING, INFO, CONFIG, FINE, FINER, FINEST
• Using the global logger:– Logger.global.info("File->Open menu selected");– Logger.global.setLevel(Level.FINE);
– logger.warning(message);– logger.fine(message);– logger.log(Level.FINEST, message);
• A specific logger for one part of your application:– Logger myLog = Logger.getLogger("com.uw.myapp");

19
Logging in Ruby on Rails
• Rails built-in logger lets you log errors, warnings, etc.:
require 'logger'
def add_to_cart product = Product.find(params[:id]) @cart = find_cart @cart.add_product(product)rescue ActiveRecord::RecordNotFound logger.error("invalid product #{params[:id]}" ) flash[:notice] = "Invalid product" redirect_to :action => 'index'end
•logger methods:– logger.error, logger.fatal, logger.warn, logger.info
20
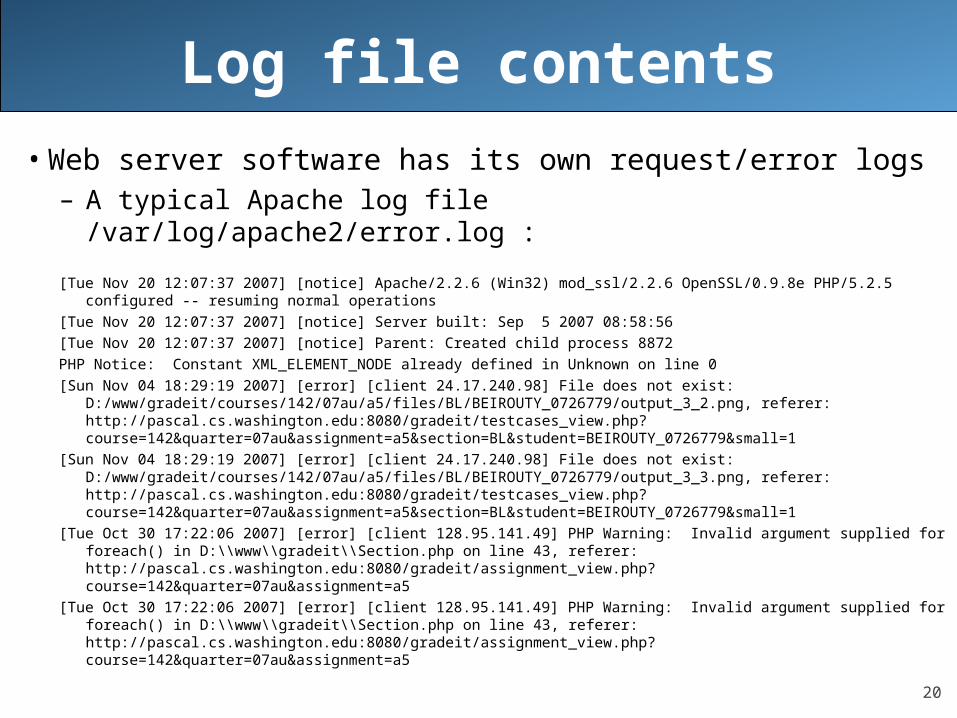
Log file contents
• Web server software has its own request/error logs– A typical Apache log file /var/log/apache2/error.log :
[Tue Nov 20 12:07:37 2007] [notice] Apache/2.2.6 (Win32) mod_ssl/2.2.6 OpenSSL/0.9.8e PHP/5.2.5 configured -- resuming normal operations
[Tue Nov 20 12:07:37 2007] [notice] Server built: Sep 5 2007 08:58:56
[Tue Nov 20 12:07:37 2007] [notice] Parent: Created child process 8872
PHP Notice: Constant XML_ELEMENT_NODE already defined in Unknown on line 0
[Sun Nov 04 18:29:19 2007] [error] [client 24.17.240.98] File does not exist: D:/www/gradeit/courses/142/07au/a5/files/BL/BEIROUTY_0726779/output_3_2.png, referer: http://pascal.cs.washington.edu:8080/gradeit/testcases_view.php?course=142&quarter=07au&assignment=a5§ion=BL&student=BEIROUTY_0726779&small=1
[Sun Nov 04 18:29:19 2007] [error] [client 24.17.240.98] File does not exist: D:/www/gradeit/courses/142/07au/a5/files/BL/BEIROUTY_0726779/output_3_3.png, referer: http://pascal.cs.washington.edu:8080/gradeit/testcases_view.php?course=142&quarter=07au&assignment=a5§ion=BL&student=BEIROUTY_0726779&small=1
[Tue Oct 30 17:22:06 2007] [error] [client 128.95.141.49] PHP Warning: Invalid argument supplied for foreach() in D:\\www\\gradeit\\Section.php on line 43, referer: http://pascal.cs.washington.edu:8080/gradeit/assignment_view.php?course=142&quarter=07au&assignment=a5
[Tue Oct 30 17:22:06 2007] [error] [client 128.95.141.49] PHP Warning: Invalid argument supplied for foreach() in D:\\www\\gradeit\\Section.php on line 43, referer: http://pascal.cs.washington.edu:8080/gradeit/assignment_view.php?course=142&quarter=07au&assignment=a5

21
Viewing Rails logs$ gem install production_log_analyzer \ --include-dependencies
• Then, to identify potential performance bottlenecks in our application, use pl_analyze command to generate a report:$ pl_analyze log/production.logRequest Times Summary: Count Avg Std Dev Min MaxALL REQUESTS: 8 0.011 0.014 0.002 0.045PeopleController#index: 2 0.013 0.010 0.003 0.023PeopleController#show: 2 0.002 0.000 0.002 0.003PeopleController#create: 1 0.005 0.000 0.005 0.005PeopleController#new: 1 0.045 0.000 0.045 0.045
Slowest Request Times:PeopleController#new took 0.045sPeopleController#index took 0.023sPeopleController#create took 0.005sPeopleController#index took 0.003sPeopleController#show took 0.003s

22
Performance counters• performance counter: A piece of hardware or software
inserted to aid in measuring the efficiency of a system.– hardware perf counters are often special registers in a chip– software perf counters are timing code inserted and logged
• software (e.g. perfmon) can be installed to aid perf. counters
• programmers can add their own monitoring code– grab system time before and after a task; log it– ask for system info (RAM, HD, CPU %, etc.); log it
– counters increase continuously•e.g. hit counter, DB query counter, error counter
– gauges report an absolute value at a given time•e.g. RAM free; CPU usage

23
Web site monitoring
• web site monitoring: A program or third-party machine "pings" your server periodically to make sure it is live.– downloadable scripts/apps (ZABBIX, Spong,
CheckWebSite)•many based on SNMP (simple network monitoring protocol)•JMX (Java Management Extensions) for J2EE web apps
– paid services (ExternalTest, SiteUpTime)
– internal: installed on your own server, as root– external: runs on another server, connects remotely

24
Reliability Engineer (SRE)
• software reliability engineer (SRE): Responsible for making sure network services stay running.– a job description recently popularized by Google– a mix of coding, sw. engineering, testing, system administration
• some SRE responsibilities:– review specs/design to point out vulnerabilities and problems– make sure that sites and products can tolerate growth/scaling– help deploy hardware and servers for new products/sites– write scripts to automate reliability tests, monitoring, sys. config– carry pager that goes off if site goes down or subsystems fail– analyze logs and data to discover potential issues
• goal: Heavily automate diagnosis and repair of major issues.
25
Quotes from an SRE"Much of (SRE) is just encouraging people to add proper instrumentation to software, especially performance counters, and then graphing the output. Code coverage doesn't hurt, but that's more of a safety measure for engineers. They're less likely to have problems and be woken up at 3am to resolve an issue if the code is tested first, especially test cases where their dependencies are slow or broken."
"Performance counters are a big help. Logging is an even bigger help if you can replay logs to do load/performance tests in the future. Degrading gracefully under heavy load or subcomponent failure is a good approach that gets insufficient attention. In some cases, latency may be more important than correctness."
"Monitoring is a little simpler. There are black box tests that can be run on the outside to see if the service is responding correctly or not. With the right performance counters you can start to do white box monitoring. e.g. if the ms of CPU needed per request step outside some bound of "normal" that may need some investigation. Is a limited resource being starved? Is it one particularly complicated query that is coming in repeatedly? Is that query malicious?"
-- Andy Carrel, SRE, Google

26
SRE interview questions• What is the difference between a hard and soft link?• What is an inode, and what is inside it?• What is RAID, and how does it work?
• What is a "zombie process"?• What happens when a process is forked?• Describe how a ping and a traceroute work.
• When user types "google.com" in the browser, what happens?
• Describe the TCP/IP 3-way handshake: Syn, Syn/Ack, Ack.• What is the difference between a network switch and a hub?
• Write a shell script to rename *.html to *.htm and vice versa.• Write a program to remove all userids matching a pattern.