csc_txt vol 01_2010_12_en
TRANSCRIPT

Prepared and published by
CSI
200 Wellington Street West, 15th Floor Toronto, Ontario M5V 3C7
Telephone: 416.364.9130Toll-free: 1.866.866.2601
Fax: 416.359.0486 Toll-free fax: 1.866.866.2660
www.csi.ca
Canadian Securities CourseVolume 1
Where leaders learn fi nancial services.

Copies of this publication are for the personal use of
properly registered students whose names are entered
on the course records of CSI Global Education Inc.
(CSI)®. This publication may not be lent, borrowed
or resold. Names of individual securities mentioned
in this publication are for the purposes of comparison
and illustration only and prices for those securities were
approximate fi gures for the period when this publication
was being prepared.
Every attempt has been made to update securities industry
practices and regulations to refl ect conditions at the time
of publication. While information in this publication has
been obtained from sources we believe to be reliable, such
information cannot be guaranteed nor does it purport
to treat each subject exhaustively and should not be
interpreted as a recommendation for any specifi c product,
service, use or course of action. CSI assumes no obligation
to update the content in this publication.
A Note About References to Third Party Materials: There may be references in this publication to third party
materials. Those third party materials are not under the
control of CSI and CSI is not responsible for the contents
of any third party materials or for any changes or updates
to such third party materials. CSI is providing these
references to you only as a convenience and the inclusion
of any reference does not imply endorsement of the third
party materials.
ISBN: 978-1-926694-56-6
First printing: 1997Revised and reprinted: 2000, 2001, 2002, 2003, 2004, 2005, 2006, 2007, 2008, 2010
Copyright © 2010 by CSI Global Education Inc.
Notices Regarding This Publication: This publication is strictly intended for information and
educational use. Although this publication is designed to
provide accurate and authoritative information, it is to be
used with the understanding that CSI is not engaged in
the rendering of fi nancial, accounting or other professional
advice. If fi nancial advice or other expert assistance is
required, the services of a competent professional should
be sought.
In no event shall CSI and/or its respective suppliers be
liable for any special, indirect, or consequential damages or
any damages whatsoever resulting from the loss of use, data
or profi ts, whether in an action of contract negligence, or
other tortious action, arising out of or in connection with
information available in this publication.
© 2010 CSI Global Education Inc. All rights reserved. No part of this publication may be
reproduced, stored in a retrieval system, or transmitted
in any form by any means, electronic, mechanical,
photocopying, recording, or otherwise, without the prior
written permission of CSI Global Education Inc.
© CSI GLOBAL EDUCATION INC. (2010) i
Preface
This course covers the three central elements of the Canadian securities industry: investment products, fi nancial markets, and the role of fi nancial intermediaries. Its goal is to help you understand the Canadian fi nancial services marketplace and introduce you to industry terminology and practices.
We begin in Volume 1 with an overview of the industry. Your focus should be on gaining an understanding of the different fi nancial markets and the securities that trade on those markets. In Volume 2, the focus shifts to analyzing the various fi nancial products so that you better understand how they are used as part of a well-planned portfolio of investments.
Our goal for you is that you gain the knowledge necessary to apply towards an exciting career in fi nancial services or to your own personal fi nancial circumstances.
This edition of the Canadian Securities Course (CSC) textbook was prepared in the Fall of 2009 and updated in the Fall of 2010. This edition retains all of the enhancements included in its predecessor edition, the 40th anniversary of the Canadian Securities Course released in 2004. The CSC textbook is updated and revised on a regular basis to better refl ect the rapidly changing fi nancial services industry.

PREFACE iii
© CSI GLOBAL EDUCATION INC. (2010)
Key Chapter FeaturesLearning features included as part of each chapter include:
Chapter Outlines: The chapter outline lets you know what content will be covered in the chapter and will prepare you for the material you are about to read.
Learning Objectives: The learning objectives help to focus your studies on important topic areas. Be sure to read each objective before you begin a chapter; the objectives specify precisely what you are expected to know after reading the chapter and studying the material. To highlight their importance, we have linked each objective directly to the chapter’s major headings.
Chapter Openers: Each chapter begins with a short overview of the importance and relevance of the material to be covered. The openers set the stage by linking the chapter content to the real world and should help increase your motivation.
Key Terms: A list of key terms is provided at the start of each chapter. Understanding the terminology and jargon of the securities industry is an important part of your success in this course. Each key term is boldfaced in the chapter and appears in the glossary included at the end of the textbook.
Chapter Summaries: Each chapter closes with a concise summary of the material organized by learning objective. The summaries will help to reinforce the relationship between the material and the chapter learning objectives and may suggest areas of weakness that require further study.
Thanks are due to those students and industry representatives who provided input into the revision process, either through their suggestions or by providing or verifying information for the book.
Canadian Securities Course Online ModulesYour registration as a student in the Canadian Securities Course includes access to online modules that guide your progress through the course materials. The modules are designed as study guides that help reinforce the textbook content and assess your knowledge. We suggest you log on to the online course and use the modules along with your text.
Enhancements to the CSC textbook include providing you with better links between the textbook and the CSC online modules. You will see icons throughout the text that correspond to the various learning resources included in the online modules. Each icon has a matching learning resource for the particular topic discussed in the text.
A description for each of the icons in the CSC online modules follows.
GETTING STARTED
Getting Started is provided to set up your expectations for each online module. It provides an introduction to the module’s purpose and content. There may also be a review activity or additional reading as preparation for the study of the module’s content.
LEARNING ACTIVITIES
The Learning Activities provide you with a variety of online exercises to test your knowledge of the material. The activities may be case- or scenario-based and allow you to practice calculations or comprehension of key concepts discussed in the text.

CANADIAN SECURITIES COURSE • VOLUME 1iv
© CSI GLOBAL EDUCATION INC. (2010)
POST-LESSON ASSESSMENT
Post-lesson tests are designed to test the key concepts in each chapter and module. You can complete a post-lesson test after studying the material in the chapter. Your results may suggest areas of weakness that require further study.
CSI Global Education Inc. CSI has been setting the standard for world-class, life-long education for financial professionals for more than 30 years. Having trained over 700,000 global professionals, makes us the preferred partner for individual and corporate financial services education internationally. Our expertise extends from securities to mutual funds, from banking and trust to insurance, from portfolio management to financial planning and wealth management.
CSI is a thought leader whose real world training sets professionals apart in their field, by developing them into leaders who are able to excel in their chosen careers. Our focus on leading educational and ethical standards means that our graduates have met the highest level of proficiency and certification. We develop course content based on industry trends and continuous involvement from our worldwide partners to ensure our graduates are the most current in every financial sector.
CSI is a partner – Working collaboratively with practitioners and industry regulators leads to a higher educational standard in an evolving financial services marketplace. Anticipating industry requirements allows us to develop relevant curriculum and testing for real world application.
CSI grants designations that have become a true measure of expertise. We focus on state of the art industry knowledge that is the recognized standard for regulatory authorities, financial organizations and associations in Canada and around the globe. Our graduates come with highly endorsed credentials respected throughout the financial services industry.
CSI is valued for its expertise in both course content and program delivery. CSI has established professional designations in growing specialties like financial derivatives and wealth management, adding to our respected and established courses and seminars. We’ve also pioneered the use of the Internet as a powerful tool for teaching and professional development, launching online courses and study aids.
CSI – leaders in innovative, lifelong education for career-minded financial professionals. CSI courses are available on demand in a variety of formats anywhere and anytime to suit the needs of learners and their organizations.

© CSI GLOBAL EDUCATION INC. (2010) v
Contents
SECTION I
THE CANADIAN INVESTMENT MARKETPLACE
1 The Capital Market ....................................................................1•1What is Investment Capital? ........................................................................... 1•5
Characteristics of Capital ............................................................................................ 1•5Why Capital Is Needed ............................................................................................... 1•6
Who are the Sources and Users of Capital? .................................................. 1•6Sources of Capital ....................................................................................................... 1•7Users of Capital .......................................................................................................... 1•8
What are the Financial Instruments? ............................................................. 1•9Debt Instruments ....................................................................................................... 1•9Equity Instruments ................................................................................................... 1•10Investment Funds ..................................................................................................... 1•10Derivatives and Other Financial Instruments ............................................................ 1•10
What are the Financial Markets? ...................................................................1•11Auction Markets in Canada ...................................................................................... 1•11Stock Exchanges Around the World .......................................................................... 1•14Dealer Markets ......................................................................................................... 1•17Private Equity ........................................................................................................... 1•19Trends in Financial Markets ...................................................................................... 1•21
Summary ...........................................................................................................1•22
VOLUME I

© CSI GLOBAL EDUCATION INC. (2010)
CANADIAN SECURITIES COURSE • VOLUME 1vi
2 The Canadian Securities Industry ...............................................2•1Overview of the Canadian Securities Industry .............................................. 2•5
The Role of Financial Intermediaries .............................................................. 2•8Types of Firms ............................................................................................................ 2•9Organization within Firms ........................................................................................ 2•10How Securities Firms are Financed ........................................................................... 2•12Dealer, Principal and Agency Functions .................................................................... 2•12The Clearing System ................................................................................................. 2•14Trends in the Securities Industry ............................................................................... 2•14
Banks as Financial Intermediaries ..................................................................2•15Schedule I Chartered Banks ...................................................................................... 2•15Schedule II and Schedule III Banks .......................................................................... 2•16Trends in the Role of Banks ...................................................................................... 2•17
Trust Companies, Credit Unions and Life Insurance Companies ..............2•18Trust and Loan Companies ....................................................................................... 2•18Credit Unions and Caisses Populaires ....................................................................... 2•18Insurance Companies ............................................................................................... 2•19Trends in Insurance .................................................................................................. 2•20
Investment Funds, Savings Banks, Pension Plans, Sales Finance and Consumer Loan Companies ....................................................................2•21
Investment Funds ..................................................................................................... 2•21Savings Banks ........................................................................................................... 2•21Pension Plans ............................................................................................................ 2•22Sales Finance and Consumer Loan Companies ......................................................... 2•22
Summary .......................................................................................................... 2•23

© CSI GLOBAL EDUCATION INC. (2010)
CONTENTS vii
3 The Canadian Regulatory Environment ......................................3•1Who are the Regulators? .................................................................................. 3•5
The Offi ce of the Superintendent of Financial Institutions ......................................... 3•5Canada Deposit Insurance Corporation ...................................................................... 3•5Credit Union Deposit Insurance Corporation ............................................................. 3•6The Provincial Regulators ........................................................................................... 3•6The Self-Regulatory Organizations ............................................................................. 3•7Canadian Investor Protection Fund ............................................................................ 3•9Mutual Fund Dealers Association Investor Protection Corporation .......................... 3•11Role of Arbitration.................................................................................................... 3•12Ombudsman for Banking Services and Investments .................................................. 3•12
What are the Principles of Securities Legislation? ......................................3•13Full,True and Plain Disclosure .................................................................................. 3•13Registration .............................................................................................................. 3•14The National Registration Database (NRD) ............................................................. 3•15Know Your Client Rule ............................................................................................. 3•15Fiduciary Duty ......................................................................................................... 3•16
What are the Ethics of Trading? .....................................................................3•16Examples of Unethical Practices ................................................................................ 3•17Prohibited Sales Practices .......................................................................................... 3•18
What are Public Company Disclosures and Investor Rights? .....................3•18Continuous Disclosure ............................................................................................. 3•18Statutory Rights for Investors ................................................................................... 3•20Proxies and Proxy Solicitation ................................................................................... 3•21
Takeover Bids and Insider Trading .................................................................3•21Takeover Bids ........................................................................................................... 3•22Insider Trading ......................................................................................................... 3•23
Summary .......................................................................................................... 3•25
© CSI GLOBAL EDUCATION INC. (2010)
CANADIAN SECURITIES COURSE • VOLUME 1viii
SECTION II
THE ECONOMY
4 Economic Principles ...................................................................4•1Foundations of Economics................................................................................ 4•6
Microeconomics and Macroeconomics ....................................................................... 4•6The Decision Makers .................................................................................................. 4•7Demand and Supply ................................................................................................... 4•7
Economic Growth ............................................................................................. 4•9Measuring Gross Domestic Product .......................................................................... 4•10Productivity and Determinants of Economic Growth ............................................... 4•13
The Business Cycle ...........................................................................................4•15Phases of the Business Cycle ..................................................................................... 4•16Using Economic Indicators ....................................................................................... 4•18Identifying Recessions ............................................................................................... 4•20
The Canadian Labour Market .........................................................................4•21Labour Market Indicators ......................................................................................... 4•22Types of Unemployment ........................................................................................... 4•23
Interest Rates ................................................................................................... 4•25Determinants of Interest Rates .................................................................................. 4•25How Interest Rates Affect the Economy ................................................................... 4•26Expectations and Interest Rates ................................................................................. 4•26
Money and Infl ation ......................................................................................... 4•28The Nature of Money ............................................................................................... 4•28Infl ation .................................................................................................................... 4•29Disinfl ation .............................................................................................................. 4•32Defl ation .................................................................................................................. 4•33

© CSI GLOBAL EDUCATION INC. (2010)
CONTENTS ix
International Economics ................................................................................ 4•34The Balance of Payments .......................................................................................... 4•34The Exchange Rate ................................................................................................... 4•37
Summary .......................................................................................................... 4•40
5 Economic Policy .........................................................................5•1Economic Theories ........................................................................................... 5•5
Rational Expectations Theory ..................................................................................... 5•5Keynesian Theory ....................................................................................................... 5•5Monetarist Theory ...................................................................................................... 5•6Supply-Side Economics .............................................................................................. 5•6
Fiscal Policy ........................................................................................................ 5•6The Federal Budget .................................................................................................... 5•7How Fiscal Policy Affects the Economy ...................................................................... 5•9
The Bank of Canada .........................................................................................5•11Role of the Bank of Canada ...................................................................................... 5•11Functions of the Bank of Canada .............................................................................. 5•11
Monetary Policy ................................................................................................5•13Implementing Monetary Policy ................................................................................ 5•13Open Market Operations .......................................................................................... 5•14Cash Management Operations .................................................................................. 5•16
Government Policy Challenges.......................................................................5•17The Consequences of Failed Fiscal Policy .................................................................. 5•18
Summary ...........................................................................................................5•19

© CSI GLOBAL EDUCATION INC. (2010)
CANADIAN SECURITIES COURSE • VOLUME 1x
SECTION III
INVESTMENT PRODUCTS
6 Fixed-Income Securities: Features and Types ...............................6•1The Fixed-Income Marketplace....................................................................... 6•6
The Rationale for Issuing Fixed-Income Securities ...................................................... 6•6Size of the Fixed-Income Market ................................................................................ 6•7
Fixed-Income Terminology and Features ...................................................... 6•7Interest on Bonds........................................................................................................ 6•7Face Value and Denomination .................................................................................... 6•8Price and Yield ............................................................................................................ 6•8Term to Maturity ........................................................................................................ 6•9Liquid Bonds, Negotiable Bonds and Marketable Bonds ............................................ 6•9Callable Bonds .......................................................................................................... 6•10Sinking Funds and Purchase Funds ........................................................................... 6•11Extendible and Retractable Bonds ............................................................................. 6•12Convertible Bonds and Debentures .......................................................................... 6•13Protective Provisions of Corporate Bonds ................................................................. 6•15
Government of Canada Securities .................................................................6•16Marketable Bonds ..................................................................................................... 6•16Treasury Bills ............................................................................................................ 6•16Canada Savings Bonds .............................................................................................. 6•17
Provincial and Municipal Government Securities ........................................6•18Guaranteed Bonds .................................................................................................... 6•19Provincial Securities .................................................................................................. 6•20Municipal Securities ................................................................................................. 6•20
Corporate Bonds ..............................................................................................6•21Mortgage Bonds ....................................................................................................... 6•21Collateral Trust Bonds .............................................................................................. 6•22Equipment Trust Certifi cates .................................................................................... 6•22Subordinated Debentures ......................................................................................... 6•22

© CSI GLOBAL EDUCATION INC. (2010)
CONTENTS xi
Floating-Rate Securities ............................................................................................ 6•22Corporate Notes ....................................................................................................... 6•23Strip Bonds ............................................................................................................... 6•23Domestic, Foreign and Eurobonds ............................................................................ 6•23Preferred Securities ................................................................................................... 6•24
Other Fixed-Income Securities ..................................................................... 6•25Bankers’ Acceptances ................................................................................................ 6•25Commercial Paper .................................................................................................... 6•25Term Deposits .......................................................................................................... 6•25Guaranteed Investment Certifi cates .......................................................................... 6•25
Bond Quotes and Ratings ............................................................................... 6•26
Summary .......................................................................................................... 6•30
7 Fixed Income Securities: Pricing and Trading ..............................7•1Bond Pricing Principles ..................................................................................... 7•5
Calculating the Fair Price of a Bond ............................................................................ 7•7Calculating the Yield on a Treasury Bill .................................................................... 7•11Calculating the Current Yield on a Bond .................................................................. 7•11Calculating the Yield to Maturity on a Bond ............................................................ 7•11
Term Structure of Interest Rates ...................................................................7•14The Real Rate of Return ........................................................................................... 7•14The Yield Curve ....................................................................................................... 7•15
Bond Pricing Properties ..................................................................................7•17The Relationship Between Bond Prices and Interest Rates ........................................ 7•17The Impact of Maturity ............................................................................................ 7•18The Impact of the Coupon ....................................................................................... 7•19The Impact of Yield Changes .................................................................................... 7•20Duration as a Measure of Bond Price Volatility ......................................................... 7•20
Bond-Switching Strategies ............................................................................. 7•22

© CSI GLOBAL EDUCATION INC. (2010)
CANADIAN SECURITIES COURSE • VOLUME 1xii
Bond Market Trading ...................................................................................... 7•24Clearing and Settlement ........................................................................................... 7•25Calculating Accrued Interest ..................................................................................... 7•25
Bond Indexes .....................................................................................................7•27Canadian Bond Market Indexes ................................................................................ 7•27Global Indexes .......................................................................................................... 7•28
Summary ...........................................................................................................7•29
8 Equity Securities: Common and Preferred Shares ........................8•1Common Shares ................................................................................................ 8•5
Benefi ts of Common Share Ownership ....................................................................... 8•5Capital Appreciation ................................................................................................... 8•6Dividends ................................................................................................................... 8•6Voting Privileges ....................................................................................................... 8•10Tax Treatment ........................................................................................................... 8•11Stock Splits and Consolidations ................................................................................ 8•12Reading Stock Quotations ........................................................................................ 8•14
Preferred Shares ..............................................................................................8•15The Preferred’s Position ............................................................................................ 8•15Why Companies Issue Preferred Shares ..................................................................... 8•16Why Investors Buy Preferred Shares .......................................................................... 8•17Preferred Share Features ............................................................................................ 8•17Straight Preferreds ..................................................................................................... 8•19Convertible Preferreds .............................................................................................. 8•19Retractable Preferreds ............................................................................................... 8•21Floating-Rate Preferreds ............................................................................................ 8•22Foreign-Pay Preferreds .............................................................................................. 8•23Other Types of Preferreds .......................................................................................... 8•23
© CSI GLOBAL EDUCATION INC. (2010)
CONTENTS xiii
Stock Indexes and Averages........................................................................... 8•24Canadian Market Indexes ......................................................................................... 8•25U.S. Stock Market Indexes ........................................................................................ 8•28International Market Indexes and Averages ............................................................... 8•30
Summary .......................................................................................................... 8•32
9 Equity Securities: Equity Transactions .........................................9•1Cash Accounts ................................................................................................... 9•5
Cash Account Rules .................................................................................................... 9•5Free Credit Balances .................................................................................................. 9•5
Margin Accounts ................................................................................................ 9•6Long Margin Accounts ............................................................................................... 9•6Margining Long Positions ........................................................................................... 9•7
Short Selling ....................................................................................................... 9•9How Short Selling is Done ......................................................................................... 9•9Dangers of Short Selling ........................................................................................... 9•12
Trading and Settlement Procedures ..............................................................9•13Trading Procedures ................................................................................................... 9•13
Buying and Selling Securities ..........................................................................9•16
Summary ...........................................................................................................9•19
10 Derivatives ................................................................................10•1What is a Derivative? ...................................................................................... 10•5
Features Common to All Derivatives ........................................................................ 10•5Derivative Markets.................................................................................................... 10•6Exchange-Traded versus OTC Derivatives ................................................................ 10•6
Types of Underlying Assets ............................................................................ 10•9Commodities ............................................................................................................ 10•9Financials .................................................................................................................. 10•9

© CSI GLOBAL EDUCATION INC. (2010)
CANADIAN SECURITIES COURSE • VOLUME 1xiv
Why Investors Use Derivatives ....................................................................10•10Individual Investors ................................................................................................ 10•10Institutional Investors ............................................................................................. 10•11Corporations and Businesses ................................................................................... 10•12Derivative Dealers ................................................................................................... 10•14
Options ............................................................................................................10•14Option Exchanges .................................................................................................. 10•17Option Strategies for Individual and Institutional Investors .................................... 10•18Option Strategies for Corporations ......................................................................... 10•25
Forwards and Futures ................................................................................... 10•26Key Terms and Defi nitions ..................................................................................... 10•27Futures Exchanges .................................................................................................. 10•28Futures Strategies for Investors ................................................................................ 10•30
Rights and Warrants ..................................................................................... 10•33Rights ..................................................................................................................... 10•33Warrants ................................................................................................................. 10•36
Summary ........................................................................................................ 10•38
SECTION IV
THE CORPORATION
11 Financing and Listing Securities ................................................11•1Types of Business Structures ..........................................................................11•6
Incorporated Businesses ..................................................................................11•6Public and Private Corporations ............................................................................... 11•9The Structure of the Organization .......................................................................... 11•12
Government Financings ................................................................................. 11•13Canadian Government Issues .................................................................................. 11•14Provincial and Municipal Issues .............................................................................. 11•16

© CSI GLOBAL EDUCATION INC. (2010)
CONTENTS xv
Corporate Financings..................................................................................... 11•16Equity Financing .................................................................................................... 11•17Debt Financing and Other Alternatives .................................................................. 11•19
The Corporate Financing Process ................................................................ 11•19The Dealer’s Advisory Relationship with Corporations ........................................... 11•20The Method of Offering ......................................................................................... 11•22The Prospectus ....................................................................................................... 11•23Other Documents and Sale of the Issue .................................................................. 11•26After-Market Stabilization ...................................................................................... 11•29
Other Methods of Distributing Securities to the Public ...........................11•30Junior Company Distributions ............................................................................... 11•30Options of Treasury Shares and Escrowed Shares .................................................... 11•31Capital Pool Company Program ............................................................................. 11•31NEX ....................................................................................................................... 11•32
The Listing Process ........................................................................................11•32Advantages and Disadvantages of Listing ................................................................ 11•32Listing Procedure for a Company ........................................................................... 11•34Withdrawing Trading Privileges .............................................................................. 11•34
Summary .........................................................................................................11•36
12 Corporations and their Financial Statements .............................12•1The Balance Sheet ...........................................................................................12•5
Classifi cation of Assets .............................................................................................. 12•6Classifi cation of Liabilities ...................................................................................... 12•11Shareholders’ Equity ............................................................................................... 12•13
The Earnings Statement................................................................................12•14Structure of the Earnings Statement ........................................................................ 12•14The Operating Section (items 28 to 34) ................................................................. 12•15The Non-Operating Section (items 35 and 36)....................................................... 12•16The Creditors’ Section (items 37 and 38) ............................................................... 12•17The Owners’ Section (items 40 to 45) .................................................................... 12•17

© CSI GLOBAL EDUCATION INC. (2010)
CANADIAN SECURITIES COURSE • VOLUME 1xvi
The Retained Earnings Statement ...............................................................12•19
The Cash Flow Statement .............................................................................12•19Operating Activities ................................................................................................ 12•20Financing Activities (items 51 to 54) ...................................................................... 12•21Investing Activities (items 55 to 57) ........................................................................ 12•21The Change in Cash Flow (items 58 to 60) ............................................................ 12•21Supplemental Information (items 61 to 62) ............................................................ 12•21
The Annual Report.........................................................................................12•22Footnotes to the Financial Statements ..................................................................... 12•22The Auditor’s Report .............................................................................................. 12•22Trends in accounting standards ............................................................................... 12•23
Summary .........................................................................................................12•25
Appendix A - Sample Financial Statements ...............................................12•26
Glossary . ........................................................................................G•1
Selected Web Sites .......................................................................Web•1
Index............................................................................................ Ind•1
© CSI GLOBAL EDUCATION INC. (2010)
CONTENTS xvii
SECTION V
INVESTMENT ANALYSIS
13 Fundamental and Technical Analysis .........................................13•1Overview of Analysis Methods ....................................................................... 13•5
Fundamental Analysis ............................................................................................... 13•5Quantitative Analysis ................................................................................................ 13•5Technical Analysis ..................................................................................................... 13•5Market Theories ....................................................................................................... 13•6
Fundamental Macroeconomic Analysis .........................................................13•7The Fiscal Policy Impact ........................................................................................... 13•7The Monetary Policy Impact .................................................................................... 13•8The Flow of Funds Impact...................................................................................... 13•10The Infl ation Impact .............................................................................................. 13•11
Fundamental Industry Analysis ....................................................................13•12Classifying Industries by Product or Service ............................................................ 13•12Classifying Industries by Stage of Growth ............................................................... 13•14Classifying Industries by Competitive Forces .......................................................... 13•15Classifying Industries by Stock Characteristics ........................................................ 13•16
Fundamental Valuation Models ...................................................................13•18Dividend Discount Model ...................................................................................... 13•18Using the Price-Earnings Ratio ............................................................................... 13•19
Technical Analysis ..........................................................................................13•20Comparing Technical Analysis to Fundamental Analysis ......................................... 13•21Commonly Used Tools in Technical Analysis .......................................................... 13•21
Summary .........................................................................................................13•29
VOLUME 2

© CSI GLOBAL EDUCATION INC. (2010)
CANADIAN SECURITIES COURSE • VOLUME 1xviii
14 Company Analysis ....................................................................14•1Overview of Company Analysis ..................................................................... 14•5
Earnings Statement Analysis ..................................................................................... 14•5Balance Sheet Analysis .............................................................................................. 14•6Other Features of Company Analysis ........................................................................ 14•8
Interpreting Financial Statements ............................................................... 14•9Trend Analysis ........................................................................................................ 14•10External Comparisons ............................................................................................. 14•11
Financial Ratio Analysis .................................................................................14•12Liquidity Ratios ...................................................................................................... 14•13Risk Analysis Ratios ................................................................................................ 14•15Operating Performance Ratios ................................................................................ 14•22Value Ratios ............................................................................................................ 14•27
Assessing Preferred Share Investment Quality ..........................................14•34Dividend Payments ................................................................................................. 14•35 Credit Assessment ................................................................................................... 14•35Selecting Preferreds ................................................................................................. 14•36How Preferreds Fit Into Individual Portfolios ......................................................... 14•37
Summary .........................................................................................................14•39
Appendix A: Company Financial Statements ............................................ 14•40
Appendix B: Sample Company Analysis .................................................... 14•44

© CSI GLOBAL EDUCATION INC. (2010)
CONTENTS xix
SECTION VI
PORTFOLIO ANALYSIS
15 Introduction to the Portfolio Approach .....................................15•1Risk and Return ............................................................................................... 15•5
Rate of Return ......................................................................................................... 15•6Risk ........................................................................................................................ 15•10
Portfolio Risk and Return ..............................................................................15•12Calculating the Rate of Return on a Portfolio ......................................................... 15•14Measuring Risk in a Portfolio ................................................................................. 15•14Combining Securities in a Portfolio ........................................................................ 15•15
Overview of the Portfolio Management Process .......................................15•19
Objectives and Constraints ...........................................................................15•20Return and Risk Objectives .................................................................................... 15•20Investment Objectives............................................................................................. 15•21Investment Constraints ........................................................................................... 15•24Managing Investment Objectives ............................................................................ 15•27
The Investment Policy Statement ...............................................................15•27
Summary .........................................................................................................15•31
16 The Portfolio Management Process ...........................................16•1Developing an Asset Mix ................................................................................ 16•5
The Asset Mix .......................................................................................................... 16•5Setting the Asset Mix ................................................................................................ 16•6
Portfolio Manager Styles ...............................................................................16•13Equity Manager Styles ............................................................................................ 16•13Fixed-Income Manager Styles ................................................................................. 16•16

© CSI GLOBAL EDUCATION INC. (2010)
CANADIAN SECURITIES COURSE • VOLUME 1xx
Asset Allocation .............................................................................................16•17Balancing the Asset Classes ..................................................................................... 16•20Strategic Asset Allocation ........................................................................................ 16•20Ongoing Asset Allocation ....................................................................................... 16•22Passive Management ............................................................................................... 16•23
Portfolio Monitoring ......................................................................................16•24Monitoring the Markets and the Client .................................................................. 16•24Monitoring the Economy ....................................................................................... 16•25A Portfolio Manager’s Checklist .............................................................................. 16•30
Evaluating Portfolio Performance ................................................................16•32Measuring Portfolio Returns ................................................................................... 16•32Calculating the Risk-Adjusted Rate of Return ......................................................... 16•33Other Factors in Performance Measurement ........................................................... 16•34
Summary .........................................................................................................16•35
SECTION VII
ANALYSIS OF MANAGED PRODUCTS
17 Evolution of Managed and Structured Products ........................17•1Managed and Structured Products ................................................................17•4
What Is a Managed Product? .................................................................................... 17•4What Is a Structured Product? .................................................................................. 17•5
A Comparison of Managed and Structured Products .................................17•6Advantages of Managed Products .............................................................................. 17•6Advantages of Structured Products ............................................................................ 17•7Disadvantages of Managed Products ......................................................................... 17•7Disadvantages of Structured Products ....................................................................... 17•8
Risks Involved With Managed and Structured Products .............................17•9Types of Risk ............................................................................................................ 17•9
Types of Managed and Structured Products ...............................................17•10
© CSI GLOBAL EDUCATION INC. (2010)
CONTENTS xxi
The Evolving Market for Managed and Structured Products ................... 17•11Market Growth Factors for Managed and Structured Products ............................... 17•11
Changing Compensation Models ..................................................................17•12
Summary .........................................................................................................17•13
18 Mutual Funds: Structure and Regulation ..................................18•1What Is a Mutual Fund? .................................................................................. 18•5
Advantages of Mutual Funds..................................................................................... 18•5Disadvantages of Mutual Funds ................................................................................ 18•7
The Structure of Mutual Funds ..................................................................... 18•8Organization of a Mutual Fund ................................................................................ 18•9Pricing Mutual Fund Units or Shares ...................................................................... 18•10Charges Associated with Mutual Funds .................................................................. 18•11
Labour-Sponsored Venture Capital Corporations ....................................18•15Advantages of Labour-Sponsored Funds ................................................................. 18•15Disadvantages of Labour-Sponsored Funds ............................................................. 18•16
Regulating Mutual Funds ...............................................................................18•16Mutual Fund Regulatory Organizations .................................................................. 18•17National Instrument 81-101 and 81-102 ................................................................ 18•17General Mutual Fund Requirements ....................................................................... 18•18The Simplifi ed Prospectus ...................................................................................... 18•18
Other Forms and Requirements ................................................................. 18•20Registration Requirements for the Mutual Fund Industry ....................................... 18•21Mutual Fund Restrictions ....................................................................................... 18•22Distribution of Mutual Funds by Financial Institutions .......................................... 18•26
Summary ........................................................................................................ 18•28

© CSI GLOBAL EDUCATION INC. (2010)
CANADIAN SECURITIES COURSE • VOLUME 1xxii
19 Mutual Funds: Types and Features ............................................19•1Types of Mutual Funds .................................................................................... 19•5
Cash and Equivalents Funds ..................................................................................... 19•5Fixed-Income Funds ................................................................................................. 19•6Balanced Funds......................................................................................................... 19•6Equity Funds ............................................................................................................ 19•7Specialty and Sector Funds ....................................................................................... 19•9Index Funds .............................................................................................................. 19•9Comparing Fund Types .......................................................................................... 19•10
Fund Management Styles ..............................................................................19•10Indexing and Closet Indexing ................................................................................. 19•11Multi-Manager ....................................................................................................... 19•11
Redeeming Mutual Fund Units or Shares ...................................................19•12Tax Consequences................................................................................................... 19•12Reinvesting Distributions ....................................................................................... 19•14Types of Withdrawal Plans ...................................................................................... 19•15Suspension of Redemptions .................................................................................... 19•18
Comparing Mutual Fund Performance ........................................................19•19Reading Mutual Fund Quotes ................................................................................ 19•19Measuring Mutual Fund Performance ..................................................................... 19•20Issues that Complicate Mutual Fund Performance .................................................. 19•22
Summary ........................................................................................................ 19•25
20 Segregated Funds and Other Insurance Products .......................20•1Features of Segregated Funds ....................................................................... 20•5
Owners and Annuitants ............................................................................................ 20•5Benefi ciaries .............................................................................................................. 20•6Maturity Guarantees ................................................................................................. 20•6Death Benefi ts .......................................................................................................... 20•8Creditor Protection ................................................................................................... 20•9Bypassing Probate ................................................................................................... 20•10

© CSI GLOBAL EDUCATION INC. (2010)
CONTENTS xxiii
Cost of the Guarantees ........................................................................................... 20•10Bankruptcy and Family Law ................................................................................... 20•10Disclosure Documents ............................................................................................ 20•11Comparison to Mutual Funds ................................................................................. 20•11
Taxation of Segregated Funds ..................................................................... 20•12Impact of Allocations on Net Asset Values .............................................................. 20•13Tax Treatment of Guarantees .................................................................................. 20•15Tax Treatment of Death Benefi ts ............................................................................. 20•16
Regulation of Segregated Funds .................................................................. 20•17Monitoring Solvency .............................................................................................. 20•17The Role Played by Assuris ..................................................................................... 20•17
Other Insurance Products ............................................................................ 20•18Guaranteed Minimum Withdrawal Benefi t Plans ................................................... 20•18Portfolio Funds ....................................................................................................... 20•19Protected Funds ...................................................................................................... 20•19
Summary ....................................................................................................... 20•21
21 Hedge Funds.............................................................................21•1Overview of Hedge Funds ...............................................................................21•5
Comparisons to Mutual Funds ................................................................................. 21•5Who Can Invest in Hedge Funds? ............................................................................ 21•6History of Hedge Funds ........................................................................................... 21•7Size of the Hedge Fund Market ................................................................................ 21•8Tracking Hedge Fund Performance ........................................................................... 21•8
Benefi ts and Risks of Hedge Funds ................................................................21•9Benefi ts ..................................................................................................................... 21•9Risks ....................................................................................................................... 21•10Due Diligence......................................................................................................... 21•13

© CSI GLOBAL EDUCATION INC. (2010)
CANADIAN SECURITIES COURSE • VOLUME 1xxiv
Hedge Fund Strategies ..................................................................................21•14Relative Value Strategies .......................................................................................... 21•15Event-Driven Strategies........................................................................................... 21•17Directional Funds ................................................................................................... 21•18
Funds of Hedge Funds ....................................................................................21•21Advantages .............................................................................................................. 21•21Disadvantages ......................................................................................................... 21•22
Summary .........................................................................................................21•23
22 Exchange-Listed Managed Products ..........................................22•1Closed-End Funds ............................................................................................ 22•4
Advantages of Closed-End Funds .............................................................................. 22•4Disadvantages of Closed-End Funds ......................................................................... 22•5
Income Trusts .................................................................................................. 22•6Real Estate Investment Trusts (REITs) ...................................................................... 22•7Royalty or Resource Trusts ........................................................................................ 22•7Business Trusts .......................................................................................................... 22•8
Exchange-Traded Funds .................................................................................. 22•9Trading ETFs ............................................................................................................ 22•9The Market for ETFs .............................................................................................. 22•10Recent Trends in ETFs ............................................................................................ 22•11Regulatory Issues .................................................................................................... 22•12
Listed Private Equity ......................................................................................22•12Structure of Listed Private Equity Companies ......................................................... 22•13Advantages and Disadvantages of Listed Private Equity .......................................... 22•14
Summary .........................................................................................................22•16

© CSI GLOBAL EDUCATION INC. (2010)
CONTENTS xxv
23 Fee-Based Accounts ...................................................................23•1Overview of Fee-Based Accounts ................................................................. 23•4
Managed Accounts ................................................................................................... 23•5Fee-Based Non-Managed Accounts ........................................................................... 23•6Advantages and Disadvantages of Fee-Based Accounts .............................................. 23•6Discretionary Accounts ............................................................................................. 23•7
Types of Managed Accounts ........................................................................... 23•8Single-Manager Accounts ......................................................................................... 23•8Multi-Manager Accounts ........................................................................................ 23•10Private Family Offi ce .............................................................................................. 23•13
Summary .........................................................................................................23•14
24 Structured Products ..................................................................24•1Principal-Protected Notes ............................................................................. 24•5
PPN Guarantors, Manufacturers and Distributors .................................................... 24•5The Structure of PPNs.............................................................................................. 24•6Risks Associated with PPNs ...................................................................................... 24•8Tax Implications of PPNs ....................................................................................... 24•10
Index-Lined Guaranteed Investment Certifi cates .....................................24•11Structure of Index-Linked GICs ............................................................................. 24•12How Returns are Determined ................................................................................. 24•12Risks Associated with Index-Linked GICs .............................................................. 24•13Tax Implications ..................................................................................................... 24•13
Split Shares .....................................................................................................24•14What are Split Shares? ............................................................................................. 24•14Risks Associated with Split Shares ........................................................................... 24•15Tax Implications ..................................................................................................... 24•16
Canadian Originated Preferred Securities (COPrS) .................................24•17

© CSI GLOBAL EDUCATION INC. (2010)
CANADIAN SECURITIES COURSE • VOLUME 1xxvi
Asset-Backed Securities ................................................................................24•17The Securitization Process ...................................................................................... 24•17Asset-Backed Commercial Paper ............................................................................. 24•19
Mortgage-Backed Securities ........................................................................ 24•20Structure and Benefi ts of MBS ................................................................................ 24•21
Summary ........................................................................................................ 22•24
SECTION VIII
WORKING WITH THE CLIENT
25 Canadian Taxation ....................................................................25•1Taxation ............................................................................................................ 25•5
The Income Tax System in Canada ........................................................................... 25•5Types of Income ....................................................................................................... 25•6Calculating Income Tax Payable ................................................................................ 25•7Taxation of Investment Income ................................................................................ 25•7Tax-Deductible Items Related to Investment Income .............................................. 25•10
Calculating Investment Gains and Losses ...................................................25•11Disposition of Shares .............................................................................................. 25•12Disposition of Debt Securities ................................................................................ 25•13Capital Losses ......................................................................................................... 25•14Tax Loss Selling ...................................................................................................... 25•16Minimum Tax......................................................................................................... 25•16
Tax Deferral Plans ..........................................................................................25•17Registered Pension Plans (RPPs) ............................................................................. 25•17Registered Retirement Savings Plans (RRSPs) ......................................................... 25•18Registered Retirement Income Funds (RRIFs) ........................................................ 25•22Deferred Annuities ................................................................................................. 25•22Tax Free Savings Accounts (TFSA) ......................................................................... 25•23Registered Educations Savings Plans (RESPs) ......................................................... 25•24
© CSI GLOBAL EDUCATION INC. (2010)
CONTENTS xxvii
Tax Planning Strategies ................................................................................ 25•26
Summary ........................................................................................................ 25•28
26 Working with the Retail Client .................................................26•1Financial Planning ............................................................................................ 26•5
The Financial Planning Process ..................................................................... 26•6Interview the Client: Establish the Client Advisor Engagement ................................ 26•6Data Gathering and Determining Goals and Objectives ........................................... 26•6Identify Financial Problems and Constraints ............................................................. 26•8Develop a Written Financial Plan and Implement the Recommendations ................. 26•9Periodically Review and Revise the Plan and Make New Recommendations ............. 26•9
Financial Planning Aids ..................................................................................26•10Life Cycle Analysis .................................................................................................. 26•10The Financial Planning Pyramid ............................................................................. 26•11
Ethics and the Advisor ...................................................................................26•12The Code of Ethics ................................................................................................. 26•12Standards of Conduct ............................................................................................. 26•13Standard A – Duty of Care ..................................................................................... 26•14Standard B – Trustworthiness, Honesty, Fairness .................................................... 26•15Standard C – Professionalism .................................................................................. 26•17Standard D – Conduct in Accordance with Securities Acts ..................................... 26•19Standard E – Confi dentiality .................................................................................. 26•20
Summary ........................................................................................................ 26•21
Appendix A .................................................................................................... 26•23
Appendix B – Client Scenarios .................................................................... 26•27

© CSI GLOBAL EDUCATION INC. (2010)
CANADIAN SECURITIES COURSE • VOLUME 1xxviii
27 Working With the Institutional Client ......................................27•1Who Are Institutional Clients? ...................................................................... 27•4
The Institutional Marketplace .................................................................................. 27•4
Suitability Requirements: Institutional vs. Retail Clients ...........................27•7Suitability Standards for Institutional Clients ............................................................ 27•7
Roles and Responsibilities in the Institutional Market ................................ 27•8The Role of the Institutional Salesperson .................................................................. 27•9The Role of the Institutional Trader ........................................................................ 27•12
Summary .........................................................................................................27•14
Glossary ..........................................................................................G•1
Selected Web Sites .......................................................................Web•1
Index............................................................................................ Ind•1

© CSI GLOBAL EDUCATION INC. (2010)
SECTION I
The Canadian Investment Marketplace


© CSI GLOBAL EDUCATION INC. (2010) 1•1
Chapter 1
The Capital Market
© CSI GLOBAL EDUCATION INC. (2010)1•2
1
The Capital Market
CHAPTER OUTLINE
What is Investment Capital?• Characteristics of Capital• Why Capital Is Needed
Who are the Sources and Users of Capital?• Sources of Capital• Users of Capital
What are the Financial Instruments?• Debt Instruments• Equity Instruments• Investment Funds• Derivatives and Other Financial Instruments
What are the Financial Markets?• Auction Markets in Canada• Stock Exchanges Around the World• Dealer Markets• Private Equity • Trends in Financial Markets
Summary

© CSI GLOBAL EDUCATION INC. (2010) 1•3
LEARNING OBJECTIVES
By the end of this chapter, you should be able to:
1. Defi ne investment capital and describe its role in the economy.
2. Describe how individuals, businesses, governments and foreign agencies supply and use capital in the economy.
3. Differentiate between the types of fi nancial instruments used in capital transactions.
4. Explain the role of fi nancial markets in the Canadian fi nancial services industry, distinguish among the types of fi nancial markets, and describe how auction markets and dealer markets work.
5. Explain what private equity is, how it has grown and the different ways of investing in this market.
THE CAPITAL MARKET
The Canadian securities industry plays a signifi cant role in sustaining and expanding the Canadian economy. The industry grows and evolves to meet the ever-changing needs of Canadian investors, both from domestic and international perspectives.
In some way, we are all affected by the securities industry. The vital economic function the industry plays is based on a simple process: the transfer of money from those who have it (savers) to those who need it (users). This capital transfer process is made possible through the use of a variety of fi nancial instruments: stocks, bonds, mutual funds and derivatives. Financial intermediaries, such as banks, trust companies and investment dealers, have evolved to make the transfer process effi cient.
The fi rst two chapters of this textbook focus on the three central elements of the securities industry: investment markets, products and intermediaries. The emphasis throughout the course, however, is on securities. The text examines the main types of investment products, how to analyze them, how they are sold, and how they are used as part of a well-planned portfolio of investments.
For those new to this material, we offer a suggestion: stay informed about the markets and the industry because it will help you better understand the material presented in this textbook. There are countless sources of fi nancial market information, including newspapers, the Internet, books and magazines. The course material will be that much easier to grasp if you can relate it to the activity that unfolds each day in the fi nancial markets. Ultimately, this will help you achieve your goal of becoming an informed and effective participant in the securities industry.
© CSI GLOBAL EDUCATION INC. (2010)1•4
KEY TERMS
Alternative trading systems (ATSs) Investment fund
Approved Participants Market capitalization
Auction market Market makers
Budget Mutual fund
Canadian National Stock Exchange (CNSX) Montreal Exchange (ME)
Canadian Unlisted Board Inc. (CUB) Open-end fund
CanDeal Option
Can PX Participating Organizations
Capital Personal disposable income
CBID Preferred shares
Common shares Primary market
Dealer markets Quotation and trade reporting systems (QTRS)
Debt Retail investors
Derivative Secondary market
Equity Stock exchange
ICE Futures Canada Toronto Stock Exchange (TSX)
Institutional Investors TSX Venture Exchange
Investment advisors (IAs)

ONE • THE CAPITAL MARKET 1•5
© CSI GLOBAL EDUCATION INC. (2010)
WHAT IS INVESTMENT CAPITAL?
In general terms, capital is wealth – both real, material things such as land and buildings, and representational items such as money, stocks and bonds. All of these items have economic value. Capital represents the invested savings of individuals, corporations, governments and many other organizations and associations. It is in short supply and is arguably the world’s most important commodity.
Capital savings are useless by themselves. Only when they are harnessed productively do they gain economic significance. Such utilization may take the form of either direct or indirect investment.
Capital savings can be used directly by, for example, a couple investing their savings in a home; a government investing in a new highway or hospital; or a domestic or foreign company paying start-up costs for a plant to produce a new product.
Capital savings can also be harnessed indirectly through the purchase of such representational items as stocks or bonds or through the deposit of savings in a financial institution. The indirect investment process is the principal focus of this course.
Indirect investment occurs when the saver buys the securities issued by governments and corporations, who in turn use the funds for direct productive investment – equipment, supplies, etc. Such investment is normally made with the assistance of the retail or institutional sales department of the investment advisor’s firm.
Characteristics of CapitalCapital has three important characteristics. It is mobile, sensitive to its environment and scarce. Therefore capital is extremely selective. It attempts to settle in countries or locations where government is stable, economic activity is not over-regulated, the investment climate is hospitable and profitable investment opportunities exist. The decision as to where capital will flow is guided by country risk evaluation, which analyzes such things as:
• The political environment – whether the country is involved or likely to be involved in internal or external confl ict
• Economic trends – growth in gross domestic product, infl ation rate, levels of economic activity, etc.
• Fiscal policy – levels of taxes and government spending and the degree to which the government encourages savings and investment
• Monetary policy – the sound management of the growth of the nation’s money supply and the extent to which it promotes price and foreign exchange stability
• Opportunities for investment and satisfactory returns on investment when considering the risks to be accepted
• Characteristics of the labour force – whether it is skilled and productive
WHAT IS INVESTMENT CAPITAL?
CANADIAN SECURITIES COURSE • VOLUME 11•6
© CSI GLOBAL EDUCATION INC. (2010)
Because of its mobility and sensitivity, capital moves in or out of countries or localities in anticipation of changes in taxation, exchange policy, trade barriers, regulations, government attitudes, etc. It moves to where the best use can be made of it and attempts to avoid areas where the above factors are not positive. Thus, capital moves to uses and users that offer the highest risk-adjusted returns. Capital is scarce worldwide and it cannot be increased synthetically or by government decree. It is in great demand everywhere.
Why Capital Is NeededAn adequate supply of capital is essential for Canada’s future well-being. Enough new and efficient plant and equipment must be put in place to ensure expanded output capability, improved productivity, increased competitiveness and the development of innovative, sought-after new products. If capital investment is inadequate, the result will be insufficient output, declining productivity, rising unemployment, decreasing competitiveness in domestic and international markets – in short, lower living standards.
The securities industry attaches great importance to the savings and investment process. It is constantly in touch with governments with a view to improving the saving and investment process. The industry advocates changes, when appropriate, in both government policies and the tax system. These proposed changes are designed to encourage more saving and the investment of savings in productive plant and equipment.
WHO ARE THE SOURCES AND USERS OF CAPITAL?
The only source of capital is savings. When revenues of non-financial corporations, individuals, governments and non -residents exceed their expenditures, they have savings to invest.
Non-financial corporations, such as steel makers, food distributors and machinery manufacturers, have historically generated the largest part of total savings mainly in the form of earnings, which they retain in their businesses. These internally generated funds are usually available only for internal use by the corporation and are not normally invested in other companies’ stocks and bonds. Thus, corporations are not important providers of permanent funds to others in the capital market.
Individuals may decide, especially if given incentives to do so, to postpone consumption now in order to save so that they can consume in the future. Governments that are able to operate at a surplus are “savers” and able to invest their surpluses. Other governments are “dis-savers” and must borrow in capital markets to meet their deficits. Most governments also own or control Crown corporations or agencies that may generate retained earnings for investment. Both federal and provincial governments, until recently, have been running deficits and, therefore, have not been significant suppliers of investment capital.
Non-residents, both corporations and private investors, have long regarded Canada as a good place to invest. Canada has traditionally relied on savings for both direct plant and equipment investment in Canada and portfolio investment in Canadian securities.
WHO ARE THE SOURCES AND USERS OF CAPITAL?
ONE • THE CAPITAL MARKET 1•7
© CSI GLOBAL EDUCATION INC. (2010)
Sources of CapitalRetail and institutional investors are a significant source of investment capital. Retail investors are individual investors who buy and sell securities for their own personal accounts, and not for another company or organization. Institutional investors are organizations, such as a pension fund or mutual fund company, that trade large volumes of securities and typically have a steady flow of money to invest. Retail investors generally buy in smaller quantities than larger, institutional investors.
For example, by the end of 2007, individual Canadians had just over $500 billion in personal savings deposits at the chartered banks alone. They had many more billions of dollars at other financial intermediaries such as trust companies, credit unions and investment dealers. Canadians also have other substantial assets in the form of securities investments made either directly or indirectly through investment funds and pension plans, equity in homes and businesses, cash values of insurance policies, retirement plans, etc.
Over the past ten years, Canadian investors’ holdings of securities have doubled to more than $600 billion today. Ten years ago, 22% of the average investor’s financial assets (bank accounts, registered retirement savings plans, pension, insurance, etc.) were stocks. Today, this share has grown to 30%. Canadians are increasingly turning to the securities industry to ensure their prosperity and future retirement security.
Foreign investors also are a significant source of investment capital. Historically, Canada has depended upon large inflows of foreign investment for continued growth. Foreign direct investment in Canada has tended to concentrate in particular industries: manufacturing, petroleum and natural gas, and mining and smelting. There are many industries that are largely Canadian-controlled (e.g., merchandising, finance, agriculture, transportation, construction, utilities). Some industries also have restrictions with respect to foreign investment.
Canada’s use of foreign investment, while necessary, has its costs. Some Canadian economic nationalists feel that direct foreign investment implies control. They feel that foreign investment leads to long-term outflows of interest and dividend payments, negatively affecting our international balance of payments. They also fear that foreign owners may favour their own domestic plants, or subsidiaries in other countries over their Canadian subsidiaries in the pursuit of export markets, research and development efforts, and in plant closings or layoffs during recessions.
The debate on the appropriate level of foreign investment in Canada will, no doubt, continue. But over the past 20 years there has been a significant swing in government policy away from the protection of Canadian businesses. The Canadian Government and the business community recognize that foreign capital continues to be needed and that foreign investors must be made to feel that Canada is a safe and attractive country in which to invest.

CANADIAN SECURITIES COURSE • VOLUME 11•8
© CSI GLOBAL EDUCATION INC. (2010)
Users of CapitalBased on the simplest categorization, the users of capital are individuals, businesses and governments. These can be both Canadian and foreign users. The ways in which these groups use capital are described below.
INDIVIDUALS
Individuals may require capital to finance housing, consumer durables (e.g., automobiles, appliances) or other types of consumption. They usually obtain it through incurring indebtedness in the form of personal loans, mortgage loans or charge accounts. Since individuals do not issue securities to the public and the focus of this text is on securities, individual capital users are not discussed further.
Just as foreign individuals, businesses or governments can supply capital to Canada, capital can flow in the other direction. Foreign users (mainly businesses and governments) may access Canadian capital by borrowing from Canadian banks or by making their securities available to the Canadian market. Foreign users will want Canadian capital if they feel that they can access this capital at a less expensive rate than their own currency. Access to foreign securities benefits Canadian investors, who are thus provided with more choice and an opportunity to further diversify their investments.
BUSINESSES
Canadian businesses require massive sums of capital to finance day-to-day operations, to renew and maintain plant and equipment as well as to expand and diversify activities. A substantial part of these requirements is generated internally (e.g., profits retained in the business), while some is borrowed from financial intermediaries (principally the chartered banks). The remainder is raised in securities markets through the issuance of short-term money market paper, medium- and long-term debt, and preferred and common shares. These instruments are discussed in detail in later chapters.
THE FEDERAL GOVERNMENT
Governments in Canada are major issuers of securities in public markets, either directly or through guaranteeing the debt of their Crown corporations.
Each year the Minister of Finance presents the government’s budget to Parliament. The budget details the government’s estimate of its revenues and expenses, which in turn results in a projection of a budget surplus or budget deficit.
When revenues fail to meet expenditures and/or when large capital projects are planned, the federal government must borrow. The government makes use of four main instruments: treasury bills (T-bills), marketable bonds, Canada Savings Bonds (CSBs) and Canada Premium Bonds (CPBs). The characteristics of each of these instruments are discussed in detail in the material on fixed-income products.
PROVINCIAL AND MUNICIPAL GOVERNMENTS
Like the federal government, the provinces issue debt directly themselves and may guarantee unconditionally the interest and principal of securities issued by their Crown corporations, such as the Alberta Municipal Financing Corporation, Hydro Québec, and New Brunswick Electric Power Commission.

ONE • THE CAPITAL MARKET 1•9
© CSI GLOBAL EDUCATION INC. (2010)
When revenues fail to meet expenditures and/or when large capital projects are planned, provinces must borrow. They may issue non-marketable bonds (i.e., bonds that do not trade in the secondary markets) to the federal government or borrow funds from Canada Pension Plan (CPP) assets (or the Québec Pension Plan in the case of Québec).
Alternatively, a province may issue debt domestically through a syndicate of investment dealers who sell the issue to financial institutions or to retail investors. In addition to conventional debt issues, some provinces issue their own short-term treasury bills and, in some cases, their own savings bonds similar to CSBs issued by the federal government.
As an alternative to domestic issues, a province may also issue marketable debentures, payable in U.S. currency in the American market or in other currencies in international markets.
Municipalities are responsible for the provision of streets, sewers, waterworks, police and fire protection, welfare, transportation, distribution of electricity and other services for individual communities. Since many of the assets used to provide these services are expected to last for twenty or more years, municipalities attempt to spread their cost over a period of years through the issuance of instalment debentures (or serial debentures).
WHAT ARE THE FINANCIAL INSTRUMENTS?
Transferring money from one person to another may seem relatively straightforward. Why then do we need formal financial instruments called securities?
As a way of distributing capital in a large, sophisticated economy, securities have many advantages. Securities are formal, legal documents, which set out the rights and obligations of the buyers and sellers. They tend to have standard features, which facilitates their trading. Furthermore, there are many types of securities, enabling both investors (buyers) and users (sellers) of capital to meet their particular needs.
Much of this text deals with the characteristics of different financial instruments. The following brief discussion of instruments is included here to remind the reader that financial instruments (products) are one of the three key components of the securities industry. The other two components, financial markets and financial intermediaries, will be covered in subsequent chapters.
Debt InstrumentsDebt instruments formalize a relationship in which the issuer promises to repay the loan at maturity, and in the interim makes interest payments to the investor. The term of the loan ranges from very short to very long, depending on the type of instrument. Bonds, debentures, mortgages, treasury bills and commercial paper are all examples of debt instruments (also referred to as fixed-income securities).
Bonds and debentures are among the most common forms of debt instrument. They are issued by all levels of government, many corporations, and some educational and religious organizations. The term bond is sometimes used colloquially to refer to both bonds and debentures, but these two instruments differ in terms of how they are secured. A bond is secured by specific assets
WHAT ARE THE FINANCIAL INSTRUMENTS?
Complete the on-line activity associated with
this section.

CANADIAN SECURITIES COURSE • VOLUME 11•10
© CSI GLOBAL EDUCATION INC. (2010)
of the issuer, while a debenture is secured only by the general credit of the issuer and not by a specific pledge of assets. These securities are discussed in more detail in the chapter on fixed-income securities.
Equity InstrumentsEquities are usually referred to as stocks or shares because the investor actually buys a “share” of the company, thus gaining an ownership stake in the company. As an owner, the investor participates in the corporation’s fortunes. If the company does well, the value of the company may increase, giving the investor a capital gain when the shares are sold. In addition, the company may distribute part of its profit to shareowners in the form of dividends. Unlike interest on a debt instrument, however, dividends are not obligatory.
Different types of shares have different characteristics and confer different rights on the owners. In general, there are two main types of stock: common and preferred.
Ownership of a company’s common shares (or stock) usually gives shareholders the right to vote at the company’s annual meeting and also a claim on its profits. The company may issue a dividend to common shareholders when business is profitable, but it is under no obligation to do so.
In contrast, owners of preferred shares generally are entitled to a fixed dividend that must be paid out of earnings before any dividend is paid to common shareowners. As well, should the firm wind up its affairs, preferred shareholders have a prior claim on the assets of the company before common shareholders. Unlike common shareholders, however, preferred shareholders usually have no vote on the direction of management unless the company fails to pay preferred dividends.
Investment FundsAn investment fund is a company or trust that manages investments for its clients. The most common form is the open-end fund, also known as a mutual fund. The fund raises capital by selling shares or units to investors, and then invests that capital. As unitholders, the investors receive part of the money made from the fund’s investments.
The key advantages of investment funds are that they are professionally managed and provide a relatively inexpensive way to diversify a portfolio. For example, an equity fund may invest in hundreds of stocks, which many individual investors could not afford to do directly. The Canadian market offers a wide and ever-expanding range of mutual funds.
Derivatives and Other Financial InstrumentsUnlike stocks and bonds, derivatives are suited mainly for more sophisticated investors. Derivatives are products based on or derived from an underlying instrument, such as a stock or an index.
For example, an option grants the holder the right, but not the obligation, to buy or sell a certain quantity of an underlying instrument at a set price for a set period of time. Options and futures enable investors to profit or protect themselves from changes in the underlying instrument’s price. The wide range of option-trading strategies makes them useful for many investors. Successful trading, however, requires a high degree of knowledge.

ONE • THE CAPITAL MARKET 1•11
© CSI GLOBAL EDUCATION INC. (2010)
In the past few years, investment dealers have used the concept of financial engineering to create hybrid products that have various combinations of characteristics of debt, equity and investment funds. Two of the most popular are income trusts and exchange-traded funds. Both of these types of securities trade on stock exchanges.
These instruments, and other products, will be discussed in later chapters.
WHAT ARE THE FINANCIAL MARKETS?
Securities are a key element in the efficient transfer of capital from savers to users, benefiting both. Many of the benefits of investment products, however, depend on the existence of efficient markets in which these securities can be bought and sold. A well-organized market provides speedy transactions and low transaction costs, along with a high degree of liquidity and effective regulation.
Like a farmers’ market, a securities market provides a forum in which buyers and sellers meet. But there are important differences. In the securities markets, buyers and sellers do not meet face to face. Instead, intermediaries, such as investment advisors (IAs) or bond dealers, act on their clients’ behalf.
Unlike most markets, a securities market may not manifest itself in a physical location. This is possible because securities are intangible – at best, pieces of paper, and often not even that. Of course, some securities markets do have a physical component. Other securities markets, such as the bond market, exist in “cyberspace” as a computer- and telephone-based network of dealers who may never see their counterparts’ faces. In Canada, all exchanges are electronic.
The capital market or securities market is made up of many individual markets. For example, there are stock markets, bond markets and money markets. In addition, securities are sold on primary and secondary markets. The primary market is the market where a security is sold when it is first issued and sold to investors. For example, a company will use an initial public offering (IPO) to sell common shares to the public for the very first time. It is on this market that the user of capital, such as a business or government, receives capital from investors. Subsequent trading takes place in the secondary market and it is here where individual investors trade among themselves.
The secondary market is extremely important. It enables investors who originally bought the investment products to sell them and obtain cash. Without secondary market liquidity – the ability to sell the securities with ease at a reasonable price – investors would not buy securities in the primary market.
Auction Markets in CanadaMarkets can also be divided into auction and dealer markets. In an auction market, clients’ bids and offers for a stock are channelled to a single central market and compete against each other. The bid is the highest price a buyer is willing to pay for the security being quoted, while the offer (or ask) is the lowest price a seller will accept. Brokerage firms usually act as agents for their clients. The prices of all transactions on an auction market are publicly visible. Canada’s stock exchanges are auction markets.
WHAT ARE THE FINANCIAL MARKETS?

CANADIAN SECURITIES COURSE • VOLUME 11•12
© CSI GLOBAL EDUCATION INC. (2010)
A stock exchange is a marketplace where buyers and sellers of securities meet to trade with each other and where prices are established according to the laws of supply and demand. On Canadian exchanges, trading is carried on in common and preferred shares, rights and warrants, listed options and futures contracts, instalment receipts, exchange-traded funds (ETFs), income trusts, and a few convertible debentures. On some U.S. and European exchanges, bonds and debentures are traded along with equities.
Canada has five exchanges: the Toronto Stock Exchange (TSX) and the TSX Venture Exchange, the Montreal Exchange (MX, also known as the Bourse de Montréal), owned by the TMX Group Inc., the Canadian National Stock Exchange (CNSX), formerly the Canadian Trading and Quotation System (CNQ), and the ICE Futures Canada. Each exchange is responsible for the trading of certain products.
• The TSX lists senior equities, some debt instruments that are convertible into a listed equity, income trusts and Exchange-Traded Funds (ETFs).
• The TSX Venture Exchange trades junior securities and a few debenture issues.
• CNSX trades securities of emerging companies.
• The Montreal Exchange trades all fi nancial and equity futures and options.
• ICE Futures Canada trades agricultural futures and options.
Liquidity is fundamental to the operation of an exchange. A liquid market is characterized by:
• Frequent sales
• Narrow price spread between bid and offering prices
• Small price fl uctuations from sale to sale
During trading hours, Canada’s exchanges receive thousands of buy and sell orders from all parts of the country and abroad.

ONE • THE CAPITAL MARKET 1•13
© CSI GLOBAL EDUCATION INC. (2010)
Table 1.1 provides the share volume and dollar value of listed trading on the TSX and the TSX Venture.
TABLE 1.1 TOTAL SHARE VOLUME AND DOLLAR VALUE OF TRANSACTIONS FOR ALL TSX AND TSX VENTURE
Comparative Share Volumes (Billions)
Exchange 2009 2008 2007 2006
TSX 118.5 109.2 96.1 82.0
TSX Venture 46.8 44.1 53.1 37.7
Total Shares 165.3 153.3 149.2 119.7
Comparative Dollar Values of Transactions (Billions)
Exchange 2009 2008 2007 2006
TSX 1,398.4 1,853.2 1,697.2 1,415.5
TSX Venture 16.1 23.8 44.9 33.3
Total Value 1,414.5 1,877.0 1,742.1 1,448.8
Source: Bloomberg
EXCHANGE MEMBERSHIPS
When a stock exchange is founded, memberships are sold to different individuals. Historically, in order to trade on an exchange, a firm had to own a “seat.” The term seat originated with the old practice of brokers trading securities while seated around a table. Today, the term means a right of entrance to a stock exchange. The seat itself is a valid and valuable asset that may be sold or leased subject to conditions in the exchange’s by-laws. There are currently two types of exchange ownership. One is the original not-for-profit membership, in which the firm must own a seat to be a member.
The second type of exchange ownership is a for-profit private company, where the exchange is owned by shareholders. All Canadian exchanges are set up as for-profit companies. Firms who have access to the trading facilities are known as “Participating Organizations” or “Approved Participants,” and do not have to be shareholders. The Toronto Stock Exchange became a for-profit private company in 2000. The TMX Group became the first North American exchange to become a publicly listed company.
Each exchange sets its own requirements for permitting access to trading facilities. Member firms may be publicly owned. There are requirements regarding the amount of capital necessary to carry on business, and key personnel (officers and directors and all others who deal with the public) must complete required courses of study.
CANADIAN SECURITIES COURSE • VOLUME 11•14
© CSI GLOBAL EDUCATION INC. (2010)
GOVERNING BODIES
The administration and policy setting of the exchanges are the responsibilities of each exchange’s Board of Directors. Each board is comprised of at least one permanent exchange official (e.g., the president) plus some experienced senior executives from the member firms who serve as Directors for stipulated terms of office. Included on each board are two to six highly qualified Public Governors appointed or elected from outside the brokerage community. Public Governors represent the interests of investors as a whole, as well as listed companies, and provide governing bodies with outside points of view and expertise.
The provincial securities acts allow the exchanges to exercise considerable self-regulation. These exchanges define acceptable standards of behaviour for member firms and their directors, officers and employees. They also have established extensive rules for trading securities and any other approved instruments on the exchange. They set listing and reporting requirements for listed companies, and they assist in the screening of statements of material facts or exchange offering prospectuses which are frequently accepted by securities commissions in lieu of standard prospectuses for some types of distributions on the exchanges.
HOW EXCHANGES ARE FINANCED
Sources of income used to meet operating and development costs include:
• transaction fees paid for each order executed on the exchange;
• fees paid by corporations when their securities are originally listed;
• sustaining fees paid annually by corporations to keep listings in good standing;
• fees paid by corporations subsequent to listing with respect to any changes in capital structure; and
• the sale of historical trading and market information.
Stock Exchanges Around the WorldThere are over 80 stock exchanges in over 60 nations. Usually a good gauge of a country’s economy is the size and organization of its exchanges. North America has 10 exchanges; Europe has in excess of 35; Central and South America, around 10; and the balance are in Africa, Asia and Australia.
The World Federation of Exchanges reports that the New York Stock Exchange (NYSE) was the largest stock exchange in the world in 2009 in terms of domestic market capitalization – a reflection of the comprehensive value of the stock exchange at that time. The TSX ranked eighth.

ONE • THE CAPITAL MARKET 1•15
© CSI GLOBAL EDUCATION INC. (2010)
Table 1.2 shows the ten largest stock markets in the world by domestic market capitalization by along with total value of shares traded.
TABLE 1.2 THE TEN LARGEST STOCK MARKETS IN THE WORLD - 2009
(In Millions of U.S. Dollars)
ExchangeDomestic Market
CapitalizationTotal Value of Trading
1. NYSE Euronext (US) 11,837,793 17,521,119
2. Tokyo SE Group 3,306,082 3,704,009
3. NASDAQ 3,239,492 13,608,077
4. NYSE Euronext (Europe) 2,869,393 1,935,240
5. London SE 2,769,444 1,771,811
6. Shanghai SE 2,704,779 5,055,691
7. Hong Kong Exchanges 2,305,143 1,416,450
8. TMX Group 1,676,814 1,245,457
9. BME Spanish Exchanges 1,434,541 1,259,213
10. .BM&F BOVESPA (Brazil) 1,337,247 644,732
Source: World Federation of Exchanges, www.world-exchanges.org.

CANADIAN SECURITIES COURSE • VOLUME 11•16
© CSI GLOBAL EDUCATION INC. (2010)
EXHIBIT 1.1 CHANGES TO THE CANADIAN STOCK EXCHANGES
Securities trading has existed in Canada since 1832. Over the years there have been many changes. The late 1990s saw radical changes to securities trading in Canada. In March 1999, Canada’s four major stock exchanges announced that they had reached an agreement to restructure along lines of market specialization. The restructuring was intended to ensure a strong and globally competitive market system, and this resulted in three specialized exchanges:
• The Toronto Stock Exchange became Canada’s senior equities market and gave up its participation in derivatives trading and the junior equity market.
• The Alberta Stock Exchange, the Winnipeg Stock Exchange and the Vancouver Stock Exchange merged to create a single, national junior equities market, called the Canadian Venture Exchange (CDNX). This new market also consolidated the operations of the Canadian Dealing Network (CDN) as of October 2000.
• The Montréal Exchange became the exclusive exchange for fi nancial futures and options in Canada. Responsibility for all equities once traded on Montréal transferred to the TSX or the TSX Venture Exchange.
During the year 2000, the Toronto Stock Exchange also joined the Global Equity Market Alliance with seven other stock exchanges to discuss the creation of a round-the-clock, global marketplace.
The Canadian Venture Exchange became a wholly owned subsidiary of the Toronto Stock Exchange in 2001. In April 2002, the Toronto Stock Exchange rebranded its abbreviated name from the TSE to TSX, while CDNX was renamed the TSX Venture Exchange. These changes were part of a rebranding initiative as the TSX and its subsidiaries prepared to go public in the fall of 2002. Under the rebranding program, the TSX, TSX Venture Exchange and TSX Markets Inc. (the arm of the TSX that sell market information and trading services) are collectively known as the TSX Group of companies. In November 2002, the TSX (now the TMX Group) Group Inc. went public, becoming the fi rst listed stock exchange in North America.
In 2004, the Canadian Trading and Quotation System gained recognition as a stock exchange by the Ontario Securities Commission. The intent of CNSX is to provide an alternative market to the TSX Venture Exchange for emerging companies.
CNSX is based on a combination of auction and dealer markets and liquidity is enhanced on a security-by-security basis via market makers. Dealers accessing this marketplace are required to be members of the Investment Industry Regulatory Organization (IIROC) of Canada (formerly the Investment Dealers Association and Market Regulation Services Inc.) and must comply with CNSX’s trading and sales practice rules. Trading on CNSX is also regulated by IIROC in the same way as the other Canadian exchanges and must therefore follow the Universal Market Integrity Rules (UMIR).
CNSX also has its own trading rules and policies in addition to UMIR. The exchange also has minimum quotation requirements for public fl oat and business activity that are less stringent than those of the TSX Venture Exchange.
In 2008, the TSX and the Montreal Exchange merged to form the TMX Group.

ONE • THE CAPITAL MARKET 1•17
© CSI GLOBAL EDUCATION INC. (2010)
Dealer MarketsDealer markets are the second major type of market on which securities trade. They consist of a network of dealers who trade with each other, usually over the telephone or over a computer network. Unlike auction markets, where the individual buyer’s orders are entered, a dealer market is a negotiated market where only the dealers’ bid and ask quotations are entered by those dealers acting as market makers in a particular security.
Almost all bonds and debentures are sold through dealer markets. These dealer markets are less visible than the auction markets for equities, so many people are surprised to learn that the volume of trading on the dealer market for debt securities is 14 times larger than the equity market.
Dealer markets are also referred to as over-the-counter (OTC) or as unlisted markets - securities on these markets are not listed on an organized exchange as they are on auction markets.
THE UNLISTED EQUITY MARKET
The volume of unlisted equity business is much smaller than the volume of stock exchange transactions. The exact size of Canadian OTC dealings cannot be measured because complete statistics are not available. Many junior issues trade OTC, but so too do the shares of a few conservative industrial companies whose boards of directors have for one reason or another decided not to seek stock exchange listing for one or more issues of their equities. The unlisted market does not set listing requirements for the stocks traded on its system (hence the term “unlisted market”) nor does it attempt to regulate the companies. Many of the stocks sold on the unlisted market are more speculative, and in most cases offer lower liquidity, than listed securities.
TRADING IN THE UNLISTED MARKET
Over-the-counter trading in equities is conducted in a similar manner to bond trading. One veteran described the OTC market as a “market without a market place.” In the OTC market, individual investors’ orders are not entered into the market or displayed on the computer system. Instead, dealers, who are acting as market makers, enter their bid and ask quotations. These market makers hold an inventory of the securities in which they have agreed to “make a market.” They sell from this inventory to buyers and add to the inventory when they acquire securities from sellers. The market makers post their individual bid (the highest price the maker will pay) and ask (the lowest price the maker will accept) quotations. The willingness of the market makers to quote bid and ask prices provides liquidity to the system (although the market makers do have the right to refuse to trade at these prices). When an investor wishes to buy or sell an unlisted security, the broker consults the bid/ask quotations of the various market makers to identify the best price, and then contacts the market maker to complete the transaction. The broker charges a commission for this service.
OVER-THE-COUNTER DERIVATIVES MARKET
Derivatives also trade in dealer or OTC markets. The OTC derivative market is dominated by financial institutions, such as banks and brokerage houses, who trade with other corporate clients and other financial institutions. This market has no trading floor and no regular trading hours. Traders do not meet in person to negotiate transactions and the market stays open 24 hours a day. One of the attractive features of OTC derivative products is that they can be custom designed by the buyer and seller. As a result, these products tend to be somewhat more complex, as special features are added to the basic properties of options and forwards.

CANADIAN SECURITIES COURSE • VOLUME 11•18
© CSI GLOBAL EDUCATION INC. (2010)
REPORTING TRADES IN THE UNLISTED MARKET
In most of Canada, there is no requirement for firms to report unlisted trades. Ontario is the exception. The Ontario Securities Commission (OSC) requires that trades of unlisted securities be reported through the Canadian Unlisted Board Inc. (CUB). CUB was launched as an automated system after the reorganization of the equity markets in Canada. It offers an Internet web-based system for dealers to report completed trades in unlisted and unquoted equity securities in Ontario, as required under the Ontario Securities Act.
QUOTATION AND TRADE REPORTING SYSTEMS
Quotation and trade reporting systems (QTRS) are recognized stock markets that operate in a similar manner to exchanges and provide facilities to users to post quotations and report trades. Traditionally, a QTRS is a mechanism for dealers to post quotations indicating the prices at which they are willing to buy and sell stock. The market itself does not match buy and sell orders; they are negotiated and trades are reported after the fact. This is the traditional model for NASDAQ.
ALTERNATIVE TRADING SYSTEMS
Alternative trading systems (ATSs) are privately owned computerized networks that match orders for securities outside of recognized exchange facilities. Also referred to as Proprietary Electronic Trading Systems (PETS), they can be owned by individual brokerage firms or by groups of brokerage firms. Profits are made via revenues from the trading system itself and go to the owner(s) of the system.
These systems bypass the exchanges because a brokerage firm operating an ATS can match orders directly from its own inventory, or act as an agent in bringing buyers and sellers together. Since there is one less intermediary, more of the commission charged to the client is kept by the dealer. Most client users of these systems are institutional investors, who can reduce transaction costs considerably. Some non-brokerage-owned ATSs even allow buyers and sellers to contact each other directly and negotiate a price.
In Canada, the development of an ATS network has been far slower than it has been in the United States. Only since 2001 has the regulatory framework existed for the creation of an ATS market (in contrast, ATSs have been operating in the United States since 1969). ATSs now in operation in Canada include CNSX’s Pure Trading, Bloomgerg Tradebook Canada, OMEGA ATS, Chi-X Canada and Alpha Trading System, an ATS established by nine of Canada’s leading financial institutions.
Alternative trading systems have the potential, however, to threaten market stability due to lessened market transparency, cross-border trading issues and technological glitches such as insufficient system capacity. In Canada, ATSs are members of the Investment Industry Regulatory Organization of Canada (IIROC). The trading activity of ATS is also regulated by IIROC.
IIROC is discussed in more detail in Chapter 3.

ONE • THE CAPITAL MARKET 1•19
© CSI GLOBAL EDUCATION INC. (2010)
ELECTRONIC TRADING SYSTEMS
With the exception of a few debentures listed on the TSX and TSX Venture Exchanges, all bond and money market securities trade OTC. In the past few years, three electronic trading systems have been launched in Canada.
CanDeal, a member of IIROC, is a joint venture between Canada’s six largest investment dealers, and is operated by the TSX. It is recognized as both an ATS and an investment dealer. It offers institutional investors access to federal bond bid and offer, prices and yields from its six bank-owned dealers, which represent more than 80% of the transactions in the bond market. CanDeal intends to expand to provincial bonds, corporate debt and commercial paper.
CBID, also a member of IIROC and an ATS, operates two distinct marketplaces: retail and institutional. The retail marketplace, Canada’s first electronic fixed-income multi-dealer retail marketplace, was launched in July 2001 and is accessible by registered dealers on behalf of retail clients. The institutional marketplace, launched in July 2002, is accessible by registered dealers, institutional investors, governments and pension funds. CBID currently has over 2,500 Canadian debt instruments trading..
CanPX is a joint venture of Investment Industry Association of Canada (IIAC)/IIROC member firms. The CanPX system provides investors with real-time bid and offer prices and hourly trade data. Issues include Government of Canada bonds and treasury bills, provincial bonds and some corporate bonds..
Private EquityPrivate equity is the financing of firms unwilling or unable to find capital using public means – for example, via the stock or bond markets. The term “private equity” is a bit of a misnomer as this asset class really encompasses debt and equity investment. Long term returns on private equity typically exceed most other asset classes. But in exchange for these returns, private equity also exposes investors to far higher risks.
Private equity plays a specific role in financial markets, in Canada and in other markets worldwide. It complements publicly traded equity by allowing businesses to obtain financing when issuing equity in the public markets may prove difficult or impossible. A good example is venture capital. Venture capital finances businesses at a time when they produce little or no cash flows, invest most or all revenue in more or less unproven technologies or production processes, and have little or no assets to offer as collateral. In such situations, firms must typically turn to investors that are ready to take substantially more risk against significantly higher profit prospects if the venture is successful.
There are several means by which private equity investors finance firms.
• Leveraged Buyout – This is the acquisition of companies fi nanced with equity and debt. Buyouts are one of the most commonly used forms of private equity.
• Growth Capital – The fi nancing of expanding fi rms for their acquisitions or high growth rates.
• Turnaround – Investments in underperforming or out of favour industries that are in either fi nancial need or operating restructuring.

CANADIAN SECURITIES COURSE • VOLUME 11•20
© CSI GLOBAL EDUCATION INC. (2010)
• Early Stage Venture Capital – Investments in fi rms that are in the infancy stages of developing products or services in high growth industries such as health care or technology. These fi rms usually have a limited number of customers.
• Late stage Venture Capital – The fi nancing of fi rms which are more established but still not profi table enough to be self-suffi cient. Revenue growth is still very high.
• Distressed debt – This is the purchase of debt securities of private or public companies that are trading below par due to fi nancial troubles at the fi rm.
THE HISTORY OF PRIVATE EQUITY
Private deals have always existed by definition (e.g., when one individual or company sells assets directly to another individual or company). However, one source identifies 1901 as the first time a private deal in the modern sense of the word was struck. In that year, J.P. Morgan acquired Carnegie Steel Company from Andrew Carnegie and Henry Phipps for the then tidy sum of $480 million.
Other sources identify an organized private equity market emerging in 1946 to stopgap the inadequacy of financing for new businesses. The American Research and Development Corporation (ARD) was founded to create a private organization to attract institutional investors.
It is only in 1978, when the so-called ‘prudent man’ rule (tending to limit investments in smaller companies and riskier instruments) was amended that venture capital began to grow rapidly. Additional support to venture capital was brought by a 1980 ‘safe harbour’ ruling granting limited partnership managers access to performance-based compensation.
SIZE OF THE PRIVATE EQUITY MARKET
The growth of private equity has been remarkable over the last 25 years. In 2007 there were 133 buyout transactions in Canada worth $64.1 billion (Source: Bloomberg). This included the proposed buyout of BCE by Ontario Teachers’ Pension Plan, Providence Equity Partners, Madison Dearborn Partners and Merrill Lynch Global Private Equity. Without the proposed BCE deal, $16.9 billion in buyouts were recorded year-to-date at the end of the 2007 third quarter alone, with $3.3 billion and 39 transactions in the third quarter itself, compared to $12.2 billion (and 107 buyouts) for all of 2006.
Given that investment minimums tend to be relatively high compared to traditional investing in the retail market, these investments cater mostly to individuals and organizations with sizeable portfolios and resources. For this reason, private equity investors are typically:
• Public pension plans
• Private pension plans
• Endowments
• Foundations
• Wealthy individuals and family offi ces
Given the features of private equity and the differences it shows with other assets typically held in investor portfolios, its role is one of return enhancement and to a certain extent, of portfolio diversification. Return enhancement is the reward for accepting much lower liquidity typical of private equity, particularly when compared to investing in the common shares of a highly liquid stock like Royal Bank or Encana. Recent annual reports of the largest pension fund managers,

ONE • THE CAPITAL MARKET 1•21
© CSI GLOBAL EDUCATION INC. (2010)
such as the Caisse de Dépôt et placement du Québec, OMERS and the Ontario Teachers Pension Plan, have shown private equity returns well ahead of traditional portfolio asset classes.
Trends in Financial MarketsThere have been many changes to global capital markets over the last several years:
• Physical marketplaces (the trading fl oors) are becoming obsolete, while virtual marketplaces or electronic trading systems are reducing the need for human participants in the market mechanism.
• Exchanges are merging to meet the challenge of globalization. Ten years ago, there were over 200 exchanges in the world; today there are fewer than 100.
• In addition to mergers, exchanges are forming alliances, partnerships and electronic links with exchanges in other countries to foster global trading.
• To prepare themselves for accelerating competition, most exchanges have demutualized, moving from not-for-profi t organizations run by their members to for-profi t corporations.
Most of these changes were driven by increased global trading, aggressive competition, the ease of electronic communication, improved computer technology and the increased mobility of capital. The speed of innovative computer technology and the globalization and integration of financial marketplaces are likely to increase. Some of the future trends may include:
• Exchanges taking the next step from becoming a for-profi t corporation to becoming publicly traded companies.
• Consideration of “free trade” between stock exchanges to improve the fl ow of capital across borders. This proposal would allow institutional investors and brokerage fi rms to trade directly on each other’s stock markets.
• Despite the number of exchange mergers in recent years, new exchanges are emerging to focus on niche markets. In the summer of 2003, the TMX Group launched a second board of the TSX Venture Exchange called NEX, which provides a trading forum for listed companies that have fallen below TSX Venture’s listing standards.

CANADIAN SECURITIES COURSE • VOLUME 11•22
© CSI GLOBAL EDUCATION INC. (2010)
SUMMARY
After reading this chapter, you should be able to:
1. Defi ne investment capital and describe its role in the economy.
• Investment capital is available and investable wealth (e.g., real estate, stocks, bonds and money) that is used to enhance the economic growth prospects of an economy.
• In direct investment, an individual or company invests directly in an item (e.g., house, new plant or new road); indirect investment occurs when an individual buys a security and the issuer invests the proceeds.
• Capital has three characteristics: it is mobile, it is sensitive, and it is in short supply.
2. Describe how individuals, businesses, governments and foreign agencies supply and use capital in the economy.
• Individuals generate investment capital through savings and use capital to fi nance major purchases or for consumption.
• Retail investors are individuals who buy and sell securities for their personal accounts; institutional investors are companies and other organizations.
• Businesses use capital to fi nance day-to-day operations, to renew and maintain plant and equipment, and to expand and diversify activities.
• Governments use capital when expenditures exceed revenue and to fi nance large projects.
• Foreign investors invest in Canada to access returns on investment not perceived to be available in other countries. Foreign investors will use Canadian capital if they can borrow at a more advantageous rate in Canada than elsewhere.
3. Differentiate between the types of fi nancial instruments used in capital transactions.
• Debt (bonds or debentures): the issuer promises to repay a loan at maturity, and in the interim makes payments of interest or interest and principal at predetermined times. The term to maturity of a debt instrument can be either short (less than fi ve years) or long (more than ten years).
• Equity (stocks): the investor buys a share that represents a stake in the company.
• Investment funds (mutual funds, segregated funds): a company or trust that manages investments for its clients.
• Derivatives (options, futures, rights): products derived from an underlying instrument such as a stock, fi nancial instrument, commodity or index.
• Other investment products (income trusts, exchange-traded funds): investments that are relatively new and do not fi t into any of the standard categories.
SUMMARY

ONE • THE CAPITAL MARKET 1•23
© CSI GLOBAL EDUCATION INC. (2010)
4. Explain the role of fi nancial markets in the Canadian fi nancial services industry, distinguish among the types of fi nancial markets, and describe how auction markets and dealer markets work.
• The fi nancial markets facilitate the transfer of capital between investors and users through the exchange of securities.
• The exchanges do not deal in physical movement of securities; they are simply the venue for agreeing to transfer ownership.
• The primary market is the initial sale of securities to an investor.
• The secondary market is the transfer of already issued securities among investors.
• Dealer markets are network of dealers that trade with each other directly on a negotiated market with market makers. Most bonds and debentures trade on these markets.
• In an auction market, clients’ bids and offers for a stock are channelled to a single central market (stock exchanges) and compete against each other.
5. Explain what private equity is, how it has grown and the different ways of investing in this market.
• Private equity is the fi nancing of fi rms unwilling or unable to fi nd capital using public means – for example, via the stock or bond markets.
• It complements publicly traded equity by allowing businesses to obtain fi nancing when issuing equity in the public markets may prove diffi cult or impossible.
• The growth of private equity has been remarkable over the last 25 years.
• Public and private pension plans, endowments, foundations, and wealthy individuals are the main investors in the private equity market.
Now that you’ve completed this
chapter and the on-line activities,
complete this post-test.


© CSI GLOBAL EDUCATION INC. (2010) 2•1
Chapter 2
The Canadian Securities Industry

© CSI GLOBAL EDUCATION INC. (2010)2•2
2
The Canadian Securities Industry
CHAPTER OUTLINE
Overview of the Canadian Securities Industry
The Role of Financial Intermediaries• Types of Firms• Organization within Firms• How Securities Firms are Financed• Dealer, Principal and Agency Functions• The Clearing System• Trends in the Securities Industry
Banks as Financial Intermediaries• Schedule I Chartered Banks• Schedule II and Schedule III Banks• Trends in the Role of Banks
Trust Companies, Credit Unions and Life Insurance Companies• Trust and Loan Companies• Credit Unions and Caisses Populaires• Insurance Companies• Trends in Insurance

© CSI GLOBAL EDUCATION INC. (2010) 2•3
Investment Funds, Savings Banks, Pension Plans, Sales Finance and Consumer Loan Companies
• Investment Funds• Savings Banks• Pension Plans• Sales Finance and Consumer Loan Companies
Summary
LEARNING OBJECTIVES
By the end of this chapter, you should be able to:
1. Summarize the state of the Canadian securities industry today.
2. Distinguish among the three categories of securities fi rms, explain how they are organized, and compare and contrast dealer, principal and agency transactions.
3. Describe the roles of the chartered banks in the capital market.
4. Describe the roles of trust companies, credit unions and insurance companies in the capital market.
5. Describe the roles of investment, savings, loan companies and pension plans in the capital market.
PARTICIPANTS IN THE SECURITIES INDUSTRY
What do the following individuals have in common? A couple needs to borrow money to finance the purchase of a home. An entrepreneur needs to raise funds to help with financing the development of a new product. An investor would like to set up a regular savings program to save for her children’s education. The common strand is that all of these individuals require some form of intermediary to help meet their goals.
Simply described, savers (lenders) give funds to a financial intermediary (such as a bank) that in turn gives those funds to spenders (borrowers) in the form of loans or mortgages, among other products. Alternatively, the intermediary can play a direct role in bringing a new issue of securities to financial markets.

© CSI GLOBAL EDUCATION INC. (2010)2•4
In the on-line Learning Guide for this module,
complete the Getting Started
activity.
More specifically for our purposes, a typical example occurs when a company needs money to operate or expand its business. One way to generate the necessary capital is by issuing securities, such as stocks and bonds. A financial intermediary, or investment dealer, can help the company issue the securities and sell them to investors. By buying the securities, the investors temporarily transfer their money to the company and, in return, receive securities representing claims on the company’s real assets.
If the firm does well, it earns a profit. Its securities may rise in value, yielding a profit for the investor when the security is sold in the marketplace. But investors are not the only ones to profit. Part of the money earned by the company may be reinvested in the firm, spurring further economic development.
In the previous chapter, we learned about the various financial markets and instruments that have evolved to meet the expanding needs of financial consumers. The focus here is the role played by the financial intermediaries, the last piece of the capital transfer puzzle. Their role is important because they have established efficient and reliable methods of channelling funds between lenders and borrowers.
KEY TERMS
Agent Principal
Closed-end funds Segregated funds
Demutualization Self-Regulatory Organizations (SROs)
Primary distribution Underwriting

TWO • THE CANADIAN SECURITIES INDUSTRY 2•5
© CSI GLOBAL EDUCATION INC. (2010)
OVERVIEW OF THE CANADIAN SECURITIES INDUSTRY
The Canadian securities industry is a regulated industry. Provinces have the power to create and to enforce their own laws and regulations through securities commissions (also called securities administrators in some provinces). Securities commissions delegate some of their powers to self-regulatory organizations (SROs), which establish and enforce industry regulations to protect investors and to maintain fair, equitable, and ethical practices. In that capacity, SROs are responsible for setting rules governing many aspects of investment dealers’ operations, including sales, finance, and trading.
The major participants in the industry and their relationships are illustrated in Chart 2.1. The chart highlights the workings of the industry by showing the major participants and their relationships with one another. Investors and users of capital trade financial instruments through the various financial markets (stock exchanges, money markets, etc.). Brokers and investment dealers act as intermediaries by matching investors with the users of capital and each side of a transaction will have their own broker or dealer who match the trades through the markets. Trades and other transactions are settled through organizations like CDS Clearing and Depository Services Inc. and banks. The SROs monitor the markets to ensure fairness and transparency, and they set and enforce rules that govern market activity. Organizations like the Canadian Investor Protection Fund (CIPF) provide insurance against insolvency while provincial regulators oversee the markets and the SROs. Organizations like CSI provide education for industry participants.
OVERVIEW OF THE CANADIAN SECURITIES INDUSTRY

CANADIAN SECURITIES COURSE • VOLUME 12•6
© CSI GLOBAL EDUCATION INC. (2010)
CHART 2.1 SECURITIES INDUSTRY FLOWCHART
Brokers &kkInvestment
DealersInvestors
Users of Capital
Clearing &SettlementMarketskk
Self-RegulatoryOrganizations
Investment Industry Regulatory Organization of Canada
Mutual Funds Dealers Association
CSIGlobal
Education Inc.(Industry Educator)
CanadianInvestor
Protection Fundrr(Industry Insurance Fund)
ProvincialooRegulator(Securities
Commission)
Market Flowkk Ancillary Services
Table 2.1 shows indicators for the securities industry over the three-year period 2007 to 2009. The table shows that there were 200 firms at the end of 2009 in the securities industry that were members of the Investment Industry Regulatory Organization of Canada (IIROC). Total employment dropped over the three-year period, but continues to surpass levels above those recorded in 2000, which represented a peak year in employment levels for the industry.
TABLE 2.1 SECURITIES INDUSTRY INDICATORS
Characteristic 2009 2008 2007
Number of Employees 39,894 40,386 42,329
Number of Firms 200 202 203
Source: Investment Industry Association of Canada website, July 2010.

TWO • THE CANADIAN SECURITIES INDUSTRY 2•7
© CSI GLOBAL EDUCATION INC. (2010)
Still, the industry is small compared to other segments of the financial services sector or even to some companies operating within competing segments. For instance, Canada’s largest bank, Royal Bank of Canada, employed over 70,000 people in 2009 and had total assets of $654 billion. The entire Canadian securities industry is likewise eclipsed in size by several individual U.S. and Japanese securities houses.
In spite of its comparatively small size, the industry has provided Canada with a capital market that is one of the most sophisticated and efficient in the world. These qualities are measured in terms of the variety and size of new issues brought to the market and the depth and liquidity of secondary market trading.
Table 2.2 shows that new issues brought to the Canadian market dropped in 2008 but increased significantly in 2009; while Table 2.3 illustrates that money market, bond and listed stock secondary trading reached $35,313 billion in 2009.
TABLE 2.2 SUMMARY OF NEW FINANCING THROUGH CANADIAN SECURITIES MARKETS (EXCLUDING TREASURY BILLS, SHORT-TERM PAPER AND CANADA SAVINGS BONDS)
($ Millions) 2009 2008 2007
Government
Federal 135,631 64,286 64,761
Provincial 45,561 32,222 37,111
Municipal 5,359 3,688 4,058
Total Government 186,551 100,196 105,930
Common Share IPOs 2,670 1,404 5,734
Preferred Shares 9,680 6,751 5,157
Non IPOs 40,135 28,827 34,307
Total Equity 52,485 36,982 45,198
Debt Securities
Conventional 12,649 6,627 10,695
Convertible 369 263 599
Asset-Backed 1,208 5,349 4,077
Medium-Term Notes 49,740 48,964 80,379
Mortgage-Backed 545 60 3,497
Total Debt 64,511 61,263 99,247
Grand Total 303,547 198,441 250,375
Source: Investment Industry Association of Canada website, August 2010.
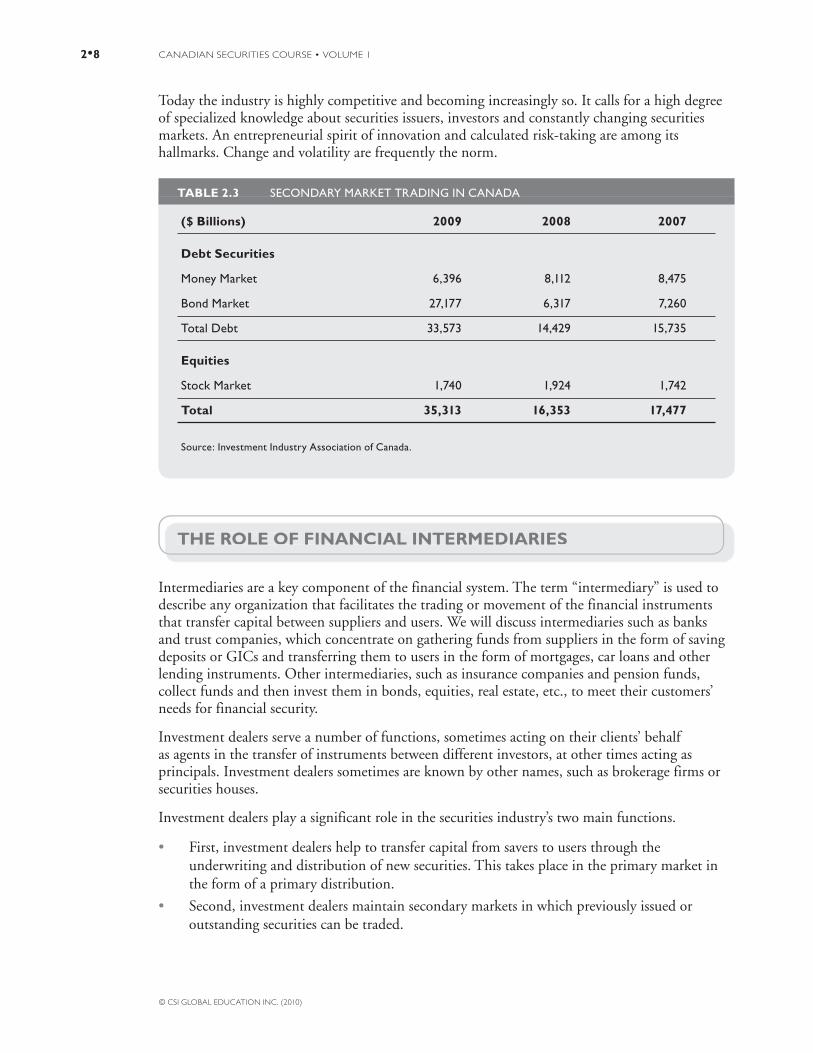
CANADIAN SECURITIES COURSE • VOLUME 12•8
© CSI GLOBAL EDUCATION INC. (2010)
Today the industry is highly competitive and becoming increasingly so. It calls for a high degree of specialized knowledge about securities issuers, investors and constantly changing securities markets. An entrepreneurial spirit of innovation and calculated risk-taking are among its hallmarks. Change and volatility are frequently the norm.
TABLE 2.3 SECONDARY MARKET TRADING IN CANADA
($ Billions) 2009 2008 2007
Debt Securities
Money Market 6,396 8,112 8,475
Bond Market 27,177 6,317 7,260
Total Debt 33,573 14,429 15,735
Equities
Stock Market 1,740 1,924 1,742
Total 35,313 16,353 17,477
Source: Investment Industry Association of Canada.
THE ROLE OF FINANCIAL INTERMEDIARIES
Intermediaries are a key component of the financial system. The term “intermediary” is used to describe any organization that facilitates the trading or movement of the financial instruments that transfer capital between suppliers and users. We will discuss intermediaries such as banks and trust companies, which concentrate on gathering funds from suppliers in the form of saving deposits or GICs and transferring them to users in the form of mortgages, car loans and other lending instruments. Other intermediaries, such as insurance companies and pension funds, collect funds and then invest them in bonds, equities, real estate, etc., to meet their customers’ needs for financial security.
Investment dealers serve a number of functions, sometimes acting on their clients’ behalf as agents in the transfer of instruments between different investors, at other times acting as principals. Investment dealers sometimes are known by other names, such as brokerage firms or securities houses.
Investment dealers play a significant role in the securities industry’s two main functions.
• First, investment dealers help to transfer capital from savers to users through the underwriting and distribution of new securities. This takes place in the primary market in the form of a primary distribution.
• Second, investment dealers maintain secondary markets in which previously issued or outstanding securities can be traded.
THE ROLE OF FINANCIAL INTERMEDIARIES

TWO • THE CANADIAN SECURITIES INDUSTRY 2•9
© CSI GLOBAL EDUCATION INC. (2010)
Investors’ confidence in Canadian financial institutions is high. It is based upon a long record of integrity and financial soundness reinforced by a legislative framework that provides close supervision of their basic activities. It is not surprising that deposit-taking and savings institutions have experienced strong growth.
In today’s financial environment, most banks own a number of other corporations, such as investment dealers and trust companies, as well as operating in the insurance market through subsidiaries. These activities are becoming more and more integrated. An investor, for example, can walk into a bank today and receive advice on purchasing mutual funds and other securities. In the same visit, a mortgage can be arranged, and life insurance can be offered.
Overall, the expansion of chartered bank assets has been facilitated by several factors. These include:
• much greater international activity
• changes in the Bank Act permitting the banks to compete vigorously in new sectors of the fi nancial services industry
• the creation of more banks, notably the foreign-owned Schedule II and Schedule III banks
• the purchase of many major trust companies by banks
Types of FirmsThree categories of firms make up the Canadian securities industry: integrated firms, institutional firms and retail firms.
Integrated firms offer products and services that cover all aspects of the industry, including full participation in both the institutional and the retail markets. The seven largest of these firms, including the securities dealer affiliates of the major domestic banks and one major U.S. dealer, generate about 70% of total industry revenues. Most underwrite all types of federal, provincial, municipal and corporate debt and corporate equity issues, actively trade in secondary markets including the money market, trade on all Canadian and some foreign stock exchanges, and provide many ancillary services to securities issuers and large and small investors. Such services include economic, industry, corporate and securities research and advice, portfolio evaluation and management, merger and acquisition advice, tax counselling, loans to investors with margin accounts and safekeeping of clients’ securities.
Many smaller securities dealers or “investment boutiques” specialize in such areas as stock trading, bond trading, research on particular industries, trading only with institutional clients, unlisted stock trading, arbitrage, portfolio management, underwriting of junior mines, oils and industrials, mutual funds distribution, and tax-shelter sales.
Some 50 foreign and domestic institutional firms serve institutional clients exclusively. Foreign firms account for about one-third of total institutional firms and include affiliates of many of the major U.S. and European securities dealers.
Retail firms account for the remainder of the industry. Retail firms include full-service firms and discount brokers. Full-service retail firms offer a wide variety of products and services for the retail investor. Discount brokers execute trades for clients at reduced rates but do not provide advice. Discount brokers are more popular with those investors who are willing to research individual companies themselves in exchange for lower commission rates.

CANADIAN SECURITIES COURSE • VOLUME 12•10
© CSI GLOBAL EDUCATION INC. (2010)
Organization within FirmsThe operational structure of securities firms varies widely in the industry, depending on market share, number and location of employees and branch offices, business mix and degree of specialization. Some of the bank-owned firms have integrated the functions of the banking side of their business with the securities side. A typical configuration divides the company into wealth management (which focuses on the retail client and small businesses, both from a banking perspective and a securities perspective) and global capital markets (which concentrates on the trading, investment banking and institutional sales).
MANAGEMENT
A key element in the success of any securities firm is the depth and quality of senior personnel. A firm’s success will depend on how well these key people are able to respond to change, seize new business opportunities, penetrate existing markets, maximize the use of available capital and create a responsive and enthusiastic team effort among all employees.
Senior officers usually include a chairman, a president, an executive vice-president, vice-presidents, some of whom are also directors, and other directors, including, in a few firms, directors from outside the securities industry. Most senior officers work at head office, but some may be in charge of regional branch offices in Canada or abroad.
Regardless of a firm’s size, decision and policy making usually rest with the chairman, president, executive vice-president and senior vice-presidents who comprise the Executive Committee.
While the organization structure is flexible, a larger, integrated firm might be organized into the following departments.
SALES DEPARTMENT
Although trading is the core function of investment dealers, they perform many other services. The success of a securities firm rests largely on profits generated by its sales department, which is usually the largest and most geographically dispersed unit in a firm. Typically, the sales department is divided into institutional and retail divisions.
Institutional salespeople deal mainly with traders at major financial institutions and larger nonfinancial companies. Working with their firm’s underwriting department, they help sell new securities issues to institutional accounts. In co-operation with the firm’s trading department, they help generate day-to-day trading in outstanding securities with such accounts. They are normally located at head and major branch offices and are in constant telephone communication with major accounts throughout the country and abroad.
The retail sales force serves individual investors and smaller business accounts and usually comprises the largest single group of a firm’s employees. The activities of retail Investment Advisors (IAs) are extremely diverse, reflecting the spectrum of investor types and needs.
To sell securities to the public, an IA must be registered with the provincial securities commission, be of legal age, have passed the CSC and the Conduct and Practices Handbook exam, and participate in a 90-day training program. IAs must also complete the Wealth Management Essentials Course within 30 months of their registration.
The duties of an investment advisor include developing a list of clients, meeting with them to determine their financial position and goals, providing them with investment information and advice (often based on the investment dealer’s in-house research), and processing their orders for

TWO • THE CANADIAN SECURITIES INDUSTRY 2•11
© CSI GLOBAL EDUCATION INC. (2010)
securities. In performing these tasks, the investment advisor must follow the industry’s guidelines for ensuring that clients’ investment decisions are appropriate given their characteristics and objectives.
UNDERWRITING/FINANCING DEPARTMENT
The underwriting/financing department works with individual companies or governments that are interested in raising capital or bringing new issues of securities to the marketplace. The underwriting department will negotiate with a company on the type of security, price, interest or dividend rate, special features and protective provisions that are needed to market a new issue successfully in an ever-changing market. The underwriting/financing process is described in Chapter 11.
TRADING DEPARTMENT
Traders work in close co-operation with a firm’s underwriting and sales departments. The trading department is often divided into bond, stock and specialized product divisions:
• Bond: Typically traded in and out of a fi rm’s own inventory or from the inventories at other fi rms specializing in particular issues. Traders tend to specialize in government and corporate money market instruments, medium and long-term Government of Canada bonds, provincial bonds and guarantees, municipal debentures, and corporate bonds and debentures.
• Stocks: Common and preferred shares trade on stock exchanges rather than from a fi rm’s own inventory. A separate division staffed by stock traders and phone and order clerks is maintained to link buy and sell orders fl owing in from institutional and retail sales staff with traders and market makers on the exchanges.
• Specialized instruments: Some fi rms employ mutual fund specialists and many also have trading specialists to handle exchange-traded options and commodity and fi nancial futures contracts.
RESEARCH DEPARTMENT
The research department in a larger securities firm will often consist of an economist, a technical analyst and several research analysts, each of whom covers one or more industries (e.g., mining, retail, industry, oil and gas, etc.). Each analyst is responsible for studying conditions within his or her industry and the current operations and future prospects of many Canadian and some foreign companies in that industry, and for coordinating such data with economic and market trends. Research reports with specific investment recommendations are produced, often with extensive analytical coverage for institutional investors and shorter summaries for retail clients.
Research facilities may be divided into retail and institutional sections to service each type of client better. The retail side is geared to handle questions about companies and their securities that IAs receive from their clients and to help IAs evaluate and make proposals for client portfolios. The institutional side may assist institutional salespersons and traders in making investment proposals to institutional accounts and help underwriting and corporate finance department personnel in special studies involving new issues, takeovers, mergers, etc.
CANADIAN SECURITIES COURSE • VOLUME 12•12
© CSI GLOBAL EDUCATION INC. (2010)
ADMINISTRATION DEPARTMENT
This key department enables all other departments to function smoothly. The more important administrative areas include:
• Operations: This section is primarily responsible for the recording and accounting of all trades made by the fi rm on its own behalf and for its clients.
• Credit and compliance: The focus here is on clients’ accounts. Cash accounts must be checked to see that incoming payments or securities are received by regular delivery dates or, if overdue, are debited or restricted according to industry requirements and in-house policies and controls.
• Financial: This area includes payroll, budgeting, fi nancial reports and statements, and fi nancial controls. Regulatory bodies require fi rms to maintain at all times adequate minimum levels of capital which vary according to the volume and type of business being done.
How Securities Firms are FinancedLike other businesses, securities firms are financed by capital originally subscribed by their owner shareholders, by year-to-year net earnings retained in the business and by loans.
The industry is highly leveraged. Firms depend on borrowed money to a significant extent to finance their securities inventories, underwriting activity (including bought deals), trading commitments and client margin accounts.
Commissions generated from agency transactions are the chief source of revenue for most investment houses, on average making up about 35% of the total.
The past few years has seen a shift from commission-based accounts (where the IA charges on a per-transaction basis) to fee-based accounts (where the IA charges an annual fee, typically based on assets under management). Fee revenues from products such as wrap accounts, managed accounts and fee-based accounts are becoming more significant.
Returns in the securities business tend to be high in bull markets, reflecting the risks and volatility inherent in the industry. However, with their heavy exposure to loss in trading and underwriting and their costly and extensive staff and communication networks, securities firms are especially vulnerable to:
• cyclical business swings;
• dramatic and unpredictable ebbs and surges in bond and stock trading volumes; and
• securities price and interest rate gyrations not only in Canada but also throughout the world.
Dealer, Principal and Agency FunctionsLike other intermediaries, one important role of investment dealers is to bring together those who have surplus capital to invest and governments and companies who need investment capital. This function is performed on the primary or new issue market, and these transactions are achieved through the underwriting and distribution to investors of new issues of securities. Investment dealers often function as principals in this role. When acting as a principal, the securities firm

TWO • THE CANADIAN SECURITIES INDUSTRY 2•13
© CSI GLOBAL EDUCATION INC. (2010)
owns securities as part of its own inventory at some stage in its buying and selling transactions with investors. The difference between buying and selling prices is the dealer’s gross profit or loss.
A second role of investment dealers is to facilitate active and liquid secondary markets for the transfer of existing or already outstanding securities from one owner to another. As described below, investment dealers may function as principals or as agents in this role. When acting as an agent, the broker acts for or on behalf of a buyer or a seller but does not itself own title to the securities at any time during the transactions. The broker’s profit is the agent’s commission charged for each transaction.
UNDERWRITING/FINANCING SECURITIES
In the securities business, underwriting or financing has come to mean the purchase from a government body or a company of a new issue of securities on a given date at a specified price. The dealers act as principals, using their own capital to buy the issue in anticipation of being able to make a profit when later selling it to others. The dealers also accept a risk since market prices may fall during the time the securities remain in their inventory. The issuer normally incurs no liability or responsibility in the sale of its own securities since payment is guaranteed by the underwriter regardless of its success in selling the securities to investors.
Dealers underwrite both stock and bond issues, and the range of types available, special features and protective provisions is very broad. The selection of the specific kind of security to be underwritten and its price are determined only after extensive negotiations with the issuer. In the selection process, the dealer advises the issuer on current market conditions and the type of security most likely to be well received by investors. The dealer’s expertise in this area is gained through its activities as a securities trader in secondary markets. The underwriting process is covered more fully in Chapter 11.
PRINCIPAL TRADING
Dealers also act as principals in secondary markets (i.e., after primary distribution has been completed) by maintaining an inventory of already issued, outstanding securities. Here the dealer buys securities in the open market, holds them in inventory for varying periods of time, and subsequently sells them.
Generally, most secondary trading of non-equity securities is conducted with the securities firm acting as principal, though occasional agency trades take place. For new money market issues, for instance, a dealer may sell the securities as an agent or, alternatively, take them into inventory as principal for later resale.
There is no central marketplace for most principal or dealer market activities. Instead, transactions are routinely conducted on the over-the-counter market (described earlier) by means of computer systems of inter-dealer brokers which link dealers and large institutions.
By maintaining an inventory of outstanding securities, the dealer provides several useful services. Its knowledge of current conditions in secondary markets tempers the advice it gives about terms and features that should be built into a new issue in the primary market. Yields prevailing on outstanding bonds, for example, provide a benchmark when the yield on a new bond issue is determined in a primary distribution.
The dealer may also complete a separate buy or a separate sell transaction from its own inventory. There is no need to wait for simultaneous, matching buy-sell orders from other investors to complete an order. The relative speed and ease with which purchases or sales may be made from

CANADIAN SECURITIES COURSE • VOLUME 12•14
© CSI GLOBAL EDUCATION INC. (2010)
Complete the on-line activity
associated with this section.
inventory greatly adds to the liquidity of already issued securities (i.e., the size of an order that can be quickly absorbed without undue price fluctuation). This liquidity also enhances the primary market since it helps assure buyers of new securities that they will be able to sell their holdings, if needed, at reasonable prevailing prices.
Stock exchange trades may involve the securities house only as agent, but in many cases the involvement is as principal. Trades done as principal occur when exchanges appoint some registered traders or market makers who have the responsibility of taking positions in some listed stocks for their own firm’s accounts in order to enhance market liquidity and smooth out undue price distortions. In recent years, some firms have also bought listed stocks as principals in order to accumulate blocks of shares of sufficient size to permit them to be more competitive in serving their larger institutional clients. As well, firms trade for their own account with the intent of making a profit.
BROKER OR AGENCY TRANSACTIONS
When acting as a broker, a securities firm is an agent or an intermediary in a secondary securities transaction. The broker’s clients who buy and sell securities are, in fact, the principals or owners of the securities, and the broker acts only as an agent, never actually owning them itself. Both the broker acting for the seller and the broker acting for the buyer charge their respective clients a commission for executing a trade. Commission rates were fixed by stock exchanges until the mid- 1980s, but are now negotiated between clients and their brokers.
The Clearing SystemIn Canada securities are cleared through CDS Clearing and Depository Services Inc. (CDS). Marketplaces (exchanges such as the TSX and TSX Venture) and alternative trading systems (ATSs) report trades to CDS’s clearing and settlement system, CDSX. Over-the-counter trades are also reported to CDS by participants in the system. Participants with access to the clearing and settlement system primarily include banks, investment dealers and trust companies.
During a trading day, an exchange member will be both buyer and seller of many listed stocks. Instead of each member making a separate settlement with another member, a designated central clearing system handles the daily settlement process between members.
By using a central clearing system, the number of securities and the amount of cash that has to change hands among the various members each day is substantially reduced through a process called netting. The clearing system establishes and confirms a credit or debit cash or security position balance for each member firm, compiles their clearing settlement sheets and informs each member of the securities or funds it must deliver to balance its account.
CDS is a founding member of the Canadian Capital Markets Association, which is promoting a change in settlement date for equities and other securities to one day after the date of a trade from the current three days.
Trends in the Securities IndustryThe Canadian securities industry continues to realign and reorganize to better position itself to compete globally. Future trends in the Canadian marketplace may include:

TWO • THE CANADIAN SECURITIES INDUSTRY 2•15
© CSI GLOBAL EDUCATION INC. (2010)
• Continued mergers and alliances between Canadian and global brokerage houses to improve access to capital and global trading.
• Continued debate over the harmonization of securities laws across Canada and the call for a national securities regulator.
• A continuation of the trend away from commission-based accounts to fee-based accounts. Over the last 20 years, retail investors in Canada moved from individual ownership of securities to an increase in the purchase of managed products, particularly mutual funds.
• The creation of an ever-expanding array of innovative fi nancial products to meet market demand and investor needs.
BANKS AS FINANCIAL INTERMEDIARIES
Banks operate under the Bank Act, which has been regularly updated, usually through revisions every ten years. The Act sets out specifically what a bank may do and provides operating rules enabling it to function within the regulatory framework.
At the end of 2009, Canada had 77 banks, made up of 22 domestic banks, 26 foreign bank subsidiaries and 29 foreign bank branches. The largest six domestic banks control more than 90% of the approximately $2.9 trillion in assets. The Canadian banking industry employs close to 249,000 people, making it one of Canada’s largest industries. However, as a result of international consolidation, the largest Canadian banks are becoming relatively smaller when judged against their international competitors. RBC Royal Bank, Scotiabank and TD Canada Trust are in the list of top 50 banks worldwide, when ranked by market capitalization.
Regulations on Canadian bank ownership are designed to protect the Canadian banking system from foreign competition. Recent criticisms that the current structure does not permit Canadian banks to remain competitive in the face of global industry consolidation are now being addressed with a new policy framework for Canadian financial institutions.
Banks are designated as Schedule I, Schedule II or Schedule III. Each designation has unique rules and regulations surrounding the banks’ activities. Most Canadian-owned banks are designated as Schedule I banks and the foreign-owned banks are either Schedule II or Schedule III banks.
Currently, voting shares of large Schedule I banks must be widely held, subject to rules that restrict the control of any individual or group and non-NAFTA shareholders to no more than 20 per cent. In contrast, a single shareholder, including a company, can control a medium-sized bank (shareholder equity of less than $5 billion) by owning up to 65% of the voting shares, provided that the remaining shares remain publicly traded. A small bank (shareholder equity of less than $1 billion) can be owned by one individual or organization.
Schedule I Chartered BanksSchedule I banks are the giants of Canada’s capital market. There are 22 Schedule I banks, with six (RBC Royal Bank, CIBC, BMO Bank of Montreal, Scotiabank, TD Bank Financial Group and National Bank of Canada) far out-distancing the asset size of other Canadian-owned banks and most other non-bank financial institutions.
BANKS AS FINANCIAL INTERMEDIARIES
CANADIAN SECURITIES COURSE • VOLUME 12•16
© CSI GLOBAL EDUCATION INC. (2010)
The major banks have achieved their present asset size largely by establishing a network of more than 9,000 retail branches throughout Canada, augmented in recent years with over 50,000 automated banking machines (ABMs), thus attracting and centralizing the savings of Canadians. They have also become major participants in the international banking scene. Most Schedule I banks are expanding their international operations through acquisitions of, or investments in, U.S. and other international financial institutions.
Banking has undergone tremendous change in the past decade. While traditional banking such as retail, commercial and corporate banking services still exist, banks today provide a variety of services through investment dealer, insurance, mortgage, trust, mutual fund and international subsidiaries. In addition, banks have expanded their core services to respond to the increasing demand for wealth management services.
Canadian banks offer consumer and commercial banking products and services, including mortgages and loans, bank accounts and investments. Banks also offer financial planning, cash management and wealth management services, some directly and some through subsidiaries.
Wealth management products and services, including mutual funds and financial planning services, have been a growing part of banking business in recent years, as demographics in Canada provide record numbers of investors as potential clients. Banks have become more dominant players in this field.
Services such as investment dealer activities, discount brokerage accounts, and the sale of insurance products are handled by subsidiaries within the banking group. While banks are permitted under current legislation to take part in diverse sectors of the financial services industry, there are controls on how they do so and on the sharing of customer information between subsidiaries. The controls that inhibit information sharing between various businesses and business units are commonly known as “Chinese walls.”
Example: A bank may offer chequing accounts and mortgages through a local branch. If a customer wants a discount brokerage account, the customer would be directed to deal with the investment dealer subsidiary and would receive all further related correspondence from that subsidiary. The bank branch would not have access to information about the customer’s brokerage account or trades, and the investment dealer subsidiary would not have access to the customer’s bank account or loan balances. In this way, the operations of different businesses within the same banking group are kept quite separate.
A major activity of the banks is to loan funds to businesses and consumers at interest rates higher than the rates they must pay in interest on deposits and other borrowings. The spread between the two sets of interest rates covers the banks’ operating costs (rent, salaries, administration, appropriations for loan losses, etc.), as well as providing a margin for the banks’ profits.
Schedule II and Schedule III BanksSchedule II banks are incorporated and operate in Canada as federally regulated foreign bank subsidiaries. These banks may accept deposits, which may be eligible for deposit insurance provided by the Canada Deposit and Insurance Corporation (CDIC). Examples of Schedule II banks in Canada include the AMEX Bank of Canada, Citibank Canada, and BNP Paribas. Schedule II banks have been able to open branches in Canada with restricted deposit taking since 1999.

TWO • THE CANADIAN SECURITIES INDUSTRY 2•17
© CSI GLOBAL EDUCATION INC. (2010)
Schedule III banks are federally regulated foreign bank branches of foreign institutions that have been authorized under the Bank Act to do banking business in Canada. Examples of Schedule III banks in Canada include HSBC Bank USA, Comerica Bank and The Bank of New York Mellon.
A Schedule II bank may engage in all types of business permitted to a Schedule I bank. In practice, most derive their greatest share of revenue from retail banking and electronic financial services. Schedule III banks, in contrast, tend to focus on corporate and institutional finance and investment banking.
By allowing foreign banks to operate in Canada, the government has facilitated the expansion in the operations of Canadian-owned Schedule I banks abroad. The presence of foreign-owned banks in Canada also provides a conduit for investment of foreign capital in Canada as well as providing Canadian corporate borrowers with alternative sources of borrowed funds.
Trends in the Role of BanksAs mentioned, one of the most significant developments in Canada has been the move by the major Canadian banks into the securities business. Bank-owned investment dealers are an important part of the securities industry. More recently, they have begun to acquire U.S. investment dealers, primarily discount brokers, as well as investments in international banks.
Another significant development is the expansion of powers given to the banks under revisions to the Bank Act. Banks now may hold a range of other types of corporations, including information services, e-commerce, real property holding and brokerage, and specialized financing corporations. Banks may also offer investment counselling and portfolio management services “in-house” rather than only through a subsidiary.
Many of the outstanding proposals for change that will allow banks to become more internationally competitive have been addressed. These are being accomplished through changes to bank ownership rules, the continued possibility of mergers and joint ventures, and by enabling the establishment of bank holding companies. Doing so will allow a bank to structure itself so that the more highly regulated banking services, such as deposit-taking, can be separated from the more lightly regulated services, such as credit card services.
This flexibility became necessary as the Bank Act now permits non-deposit-taking institutions, such as life insurance companies, securities dealers and money market mutual funds access to the payment system. (Access to the payments system was previously the exclusive domain of the chartered banks.) These institutions will now be able to offer their customers bank-like payment services such as chequing accounts and debit cards.
As the wealth management sector grows, and in response to Canadian demographic trends, banks are actively developing products and services traditionally reserved for sophisticated and high-net worth individuals. Most banks now make available non-proprietary investment products, such as the mutual funds of competitors, in recognition of the importance of customer retention. Such broadening of the investment products offered by banks has resulted in the need for upgrading bank employee investment knowledge so that they can fulfill their fiduciary obligations to their clients.
CANADIAN SECURITIES COURSE • VOLUME 12•18
© CSI GLOBAL EDUCATION INC. (2010)
TRUST COMPANIES, CREDIT UNIONS AND LIFE INSURANCE COMPANIES
Trust and Loan CompaniesFederally and provincially incorporated trust companies offer a broad range of financial services, which in many cases overlap services provided by the chartered banks. For example, trust companies accept savings, issue term deposits, make personal and mortgage loans, and sell RRSPs and other tax-deferred plans. However, trust companies are the only corporations in Canada authorized to engage in a trust business (i.e., to act as a trustee in charge of corporate or individual assets such as property, stocks and bonds). They also offer estate planning and asset management.
Most of the larger trust companies are now subsidiaries of the major banks. These institutions are regulated under the federal Trust and Loan Companies Act. These institutions are regulated by the Office of the Superintendent of Financial Institutions.
Credit Unions and Caisses PopulairesEarly in the 1900s, many individual savers and borrowers felt that chartered banks were too profit oriented. This led to the establishment of many co-operative, member-owned credit unions in English-speaking communities in Canada (predominantly in Ontario, Saskatchewan and British Columbia), and the parallel caisses populaires (people’s banks) in Quebec. Frequently, credit unions seek member-savers from common interest groups such as those in the same neighbourhood, those with similar ethnic backgrounds and those from the same business or social group.
Credit unions and caisses populaires offer diverse services such as business and consumer deposit taking and lending, mortgages, mutual funds, insurance, trust services, investment dealer services, and debit and credit cards. Local credit unions and caisses populaires belong to central provincial societies to further common interests. These societies provide broader services such as investment of surplus funds from member locals, lending them funds when required, and cheque clearing. Many are as small as one branch. Services and stability are provided by these provincial central credit unions and federations.
The federal legislation governing credit unions is the Cooperative Credit Associations Act. The act generally limits activities of credit unions to providing financial services to their members, entities in which they have a substantial investment and certain types of co-operative institutions, and to providing administrative, educational and other services to cooperative credit societies. The act also contains a number of specific restrictions, such as those on in-house trust services and the retailing of insurance.
The act requires associations to adhere to investment rules based on a “prudent portfolio approach” and prohibits associations from acquiring substantial investments in entities other than a list of authorized financial and quasi-financial entities. It also sets out a number of limits designed to restrict the exposure of associations to real property and equity securities.
TRUST COMPANIES, CREDIT UNIONS AND LIFEINSURANCE COMPANIES

TWO • THE CANADIAN SECURITIES INDUSTRY 2•19
© CSI GLOBAL EDUCATION INC. (2010)
Insurance CompaniesThe Canadian insurance industry, including agents, appraisers and adjusters, employs more than 200,000 people, divided more or less evenly between the life insurance industry and the property and casualty insurance industry. Between the two industries, more than $400 billion in assets, either directly or indirectly, is managed on behalf of policyholders.
PRODUCTS AND SERVICES
The insurance industry has two main businesses: life insurance and property and casualty insurance. Life insurance and related products include insurance against loss of life, livelihood or health, such as health and disability insurance, term and whole life insurance, pension plans, registered retirement savings plans and annuities.
The chief sources of a life insurance company’s funds are premiums on whole life, term and group insurance policies; premiums being paid for annuities, pensions, group medical and dental care programs; interest on policy loans and mortgages; and interest and dividends on securities and mortgages already owned. Life insurance products may be offered through either private or group insurance plans, often those sponsored by employers.
Property and casualty insurance encompasses protection against loss of property, including home, auto and commercial business insurance. The largest aggregate premiums are generated by automobile insurance, followed by property insurance and liability insurance.
Life insurance companies act as trustees for the funds entrusted to them by policyholders and, therefore, they must exercise extreme caution in selecting their investments. Safety of principal is most important. Contractual obligations will have to be met in the future and certainty of principal repayment is their first investment aim. Historically, life insurance companies have also tried, as far as market conditions permit, to invest as much as possible of their funds in high yielding, longer-term securities, since many of their contracts are long-term in nature, running for the lifetime of the insured. Life insurance companies, therefore, tend to be active in both mortgage and long-term bond markets.
Underwriting operations are the most important aspect of the insurance business in Canada. Underwriting is the business of evaluating the risk an insurance company is willing to take from a client in exchange for insurance premiums, followed by the acceptance of the associated responsibility for fulfilling the terms of the insurance contract.
The other significant aspect of the insurance business is acting as agent or broker for other underwriters. Such companies sell insurance policies underwritten by other firms. Reinsurance, the business of exchanging risk between insurance companies to facilitate better risk management, is a relatively small part of the Canadian insurance market, although it is an increasingly important business globally.

CANADIAN SECURITIES COURSE • VOLUME 12•20
© CSI GLOBAL EDUCATION INC. (2010)
INSURANCE REGULATION
The key federal legislation governing insurance companies is the Insurance Companies Act. The bill establishing the Act was proclaimed June 1, 1992.
The legislation permits life insurance companies to explicitly own trust and loan companies, and thus enter new financial businesses through subsidiaries. Similarly, widely held institutions such as mutual insurance companies would be permitted to own Schedule I banks. Insurance companies are also allowed to hold a range of other types of corporations. While companies will have enhanced powers to make consumer and corporate loans, the Act contains a number of restrictions on activities such as in-house trust services and deposit-taking. It also continues the practice of allowing only life companies to offer annuities and segregated funds.
The Act also requires insurance companies to adhere to investment rules based on a “prudent portfolio approach” which replaces the “legal for life” rules. Companies are prohibited from acquiring substantial investments in entities other than a list of authorized financial and quasi financial entities. The Act also sets out a number of portfolio limits designed to limit exposure to real property and equity securities.
A number of insurance companies are wholly owned by the Canadian Schedule I banks. Although these large domestic banks have established their own insurance subsidiaries, the Bank Act does not permit the selling of insurance through their branch networks.
Trends in InsuranceChange is underway in the ownership structure of several large Canadian insurers as they continue to demutualize. Insurance companies in Canada are organized either as mutual companies, owned by policyholders, or as joint stock companies, owned by shareholders. Demutualization is a process by which insurance companies, owned by policyholders, reorganize into companies owned by shareholders. Policyholders, in effect, become shareholders in an insurance corporation. The significance of demutualization is that it provides insurance companies with access to capital markets, allowing them to acquire other companies with equity, rather than cash, making them better able to compete with other financial institutions such as banks.
Demutualization will likely lead to consolidation among insurance companies and the emergence of fewer, larger companies. Already the number of insurance companies in Canada is declining, while the size of the industry increases.
Added to this environment of consolidation is an increased atmosphere of competitiveness due to new sources of competition, such as that from insurance subsidiaries of Canadian banks. The entrance of large banks into the insurance business reinforces trends found elsewhere in the financial services sector. These are trends primarily to increase competition and the potential rationalization of intermediaries such as agents and independent brokers. While Canadian banks are permitted to own insurance companies, they are still restricted as to the distribution of insurance products.
Current financial reforms affect insurance companies as well as banks. Insurance companies will have access to the Payments System, allowing them to offer products such as chequing accounts and debit cards. The new flexibility with respect to creating holding companies will allow them to compete on an equal level with banks.

TWO • THE CANADIAN SECURITIES INDUSTRY 2•21
© CSI GLOBAL EDUCATION INC. (2010)
INVESTMENT FUNDS, SAVINGS BANKS, PENSION PLANS, SALES FINANCE AND CONSUMER LOAN COMPANIES
The institutions discussed in the above sections are among the major participants in Canada’s capital market.
Banks, insurance companies, investment dealers and mutual fund companies are not the only distributors of financial products and services in Canada. Other distributors include credit unions, caisses populaires, non-bank-aligned trust companies, insurance brokers and financial planners. Some of these firms distribute their own products and services, while others distribute the products and services of other firms. Although these firms are often characterized by the products that they offer as distributors, they command a significant portion of the competitive Canadian financial services industry. These other financial intermediaries are described below.
Investment FundsInvestment funds are companies or trusts that sell their shares to the public and invest the proceeds in a diverse securities portfolio. There are two types of investment funds:
• Closed-End Funds: normally issue shares only at start-up or at other infrequent periods and reinvest the proceeds and borrowings in a portfolio of securities to produce income and capital gain.
• Open-End Funds (or mutual funds): continually issue shares to investors and redeem these shares on demand at their net asset or “break-up” value per share of the fund’s investment portfolio. Mutual funds range from those primarily seeking safety of principal and income through the purchase of mortgages, bonds and blue-chip preferred and common shares, to much more aggressive funds primarily seeking capital gain through trading common shares in growth industries.
Of the two types of funds, mutual funds are much larger, accounting for close to 95% of aggregate funds invested.
Savings BanksThe Alberta Treasury Branches were formed in 1938 when chartered banks pulled out their branches from many smaller towns. Funds on deposit are 100% guaranteed by the respective province. In some places, they are the only financial service provider in town.
INVESTMENT FUNDS, SAVINGS BANKS, PENSION PLANS,SALES FINANCE AND CONSUMER LOAN COMPANIES

CANADIAN SECURITIES COURSE • VOLUME 12•22
© CSI GLOBAL EDUCATION INC. (2010)
Pension PlansThere has been a remarkable growth in the institutionalization of savings through pension plans during the past 55 years. This growth is partly the result of longer life expectancy, earlier retirement and the desire for financial independence during the now-longer period of retirement. Canada’s changing demographic landscape has also focused public attention on the future viability of the Canada Pension Plan (CPP) and Québec Pension Plans (QPP).
One or other of these plans is compulsory for virtually all employed persons and, in addition to minimum retirement benefits, both plans provide certain disability, death, widows’ and orphans’ benefits. Based on employee earnings with set maximums, both employee and employer contribute and both have cost-of-living adjustments on contributions and payouts.
Sales Finance and Consumer Loan CompaniesSuch companies make direct cash loans to consumers who usually repay principal and interest in instalments. They also purchase, at a discount, instalment sales contracts from retailers and dealers when such items as new automobiles, appliances or home improvements are bought on instalment plans
TWO • THE CANADIAN SECURITIES INDUSTRY 2•23
© CSI GLOBAL EDUCATION INC. (2010)
SUMMARY
After reading this chapter, you should be able to:
1. Summarize the state of the Canadian securities industry today.
• Canadian capital markets are among the most sophisticated and effi cient in the world. These qualities are measured in terms of the variety and size of new issues brought to the markets and the depth and liquidity of secondary market trading.
• New issues brought to Canadian markets have increased considerably over the past fi ve years, while money market, bond and listed equity secondary trading has also risen signifi cantly over this same period.
2. Distinguish among the three categories of securities fi rms, explain how they are organized, and compare and contrast dealer, principal and agency transactions.
• Firms in the Canadian securities industry are categorized as integrated, institutional and retail. Integrated fi rms account for about 70% of total industry revenue because they offer products and services that cover all aspects of the industry. Institutional fi rms primarily handle the trading activity of large clients such as pension funds and mutual funds. At the retail level, there are full-service fi rms that offer a wide variety of products and services, and discount brokers that provide reduced trading rates but do not provide advice.
• One main role of an investment dealer is to bring new issues of securities to the primary markets and facilitate trading in the secondary markets. The dealer can act as a principal or as an agent in either market.
• When acting as a principal, the dealer owns securities as part of its inventory when conducting transactions with clients and investors. Profi t is made on the spread between the original cost of the securities and what they eventually sell for.
• When acting as an agent, the dealer acts on behalf of a buyer or seller but does not itself own title to the securities at any time during the transaction. Profi t is realized on the commission charged for each transaction.
SUMMARY
CANADIAN SECURITIES COURSE • VOLUME 12•24
© CSI GLOBAL EDUCATION INC. (2010)
3. Describe the role of the chartered banks in the capital markets.
• The Canadian chartered banks are the largest fi nancial intermediaries in the country. They are designated as Schedule I, Schedule II or Schedule III banks. Each designation has different rules and regulations regarding ownership levels and the types of services that can be offered.
• Most Canadian-owned banks are designated as Schedule I banks. They are the dominant competitors in the industry both in terms of the wide-ranging services offered and their overall asset base.
• Schedule II banks are incorporated and operate in Canada as federally regulated foreign bank subsidiaries. These banks can engage in all the types of business that are permitted to Schedule I banks.
• Schedule III banks are federally regulated foreign bank branches of foreign institutions. Most operate as full-service branches able to accept deposits, though some are merely lending branches.
4. Describe the roles of trust companies, credit unions and insurance companies in the capital markets.
• These fi nancial intermediaries offer a broad range of fi nancial services that in many cases overlap with the services provided by chartered banks, including deposit-taking and lending, debit and credit cards, mortgages, and mutual funds.
5. Describe the roles of investment funds, savings banks, loan companies and pension plans in the capital markets.
• Investment funds sell their shares to the public, most often in the form of closed- or openend funds, and invest the proceeds in a diverse portfolio of securities.
• Loan companies make direct cash loans to consumers who typically use them to repay principal and interest on instalment loans. These intermediaries also purchase instalment sales contracts from retailers on such items as new automobiles, appliances, or home improvements that are purchased on instalment.
• Pension plans represent a type of institutionalized savings. Trusteed plans are offered to the employees of many companies, institutions and other organizations. One or the other of the government-related plans (the Canada Pension Plan and the parallel Québec Pension Plan) is compulsory for virtually all employed persons and, in addition to minimum retirement benefits, both plans provide certain disability, widows’ and orphans’ and death benefits.
Now that you’ve completed this
chapter and the on-line activities,
complete this post-test.

© CSI GLOBAL EDUCATION INC. (2010) 3•1
Chapter 3
The Canadian Regulatory Environment

© CSI GLOBAL EDUCATION INC. (2010)3•2
3
The Canadian Regulatory Environment
CHAPTER OUTLINE
Who are the Regulators?• The Offi ce of the Superintendent of Financial Institutions • Canada Deposit Insurance Corporation• Credit Union Deposit Insurance Corporations• The Provincial Regulators• The Self-Regulatory Organizations• Canadian Investor Protection Fund• Mutual Fund Dealers Association Investor Protection Corporation• Role of Arbitration• Ombudsman for Banking Services and Investments
What are the Principles of Securities Legislation?• Full, True and Plain Disclosure• Registration• The National Registration Database (NRD)• Know Your Client Rule• Fiduciary Duty
What are the Ethics of Trading?• Examples of Unethical Practices• Prohibited Sales Practices
© CSI GLOBAL EDUCATION INC. (2010) 3•3
What are Public Company Disclosures and Investor Rights?• Continuous Disclosure• Statutory Rights for Investors• Proxies and Proxy Solicitation
Takeover Bids and Insider Trading• Takeover Bids• Insider Trading
Summary
LEARNING OBJECTIVES
By the end of this chapter, you should be able to:
1. Identify and describe the agencies and legal entities through which the Canadian securities industry is regulated.
2. Evaluate the role the self-regulatory organizations (SROs) play in the regulatory process.
3. Discuss the principles that underlie securities legislation.
4. Identify unethical practices and conduct in securities trading.
5. Describe the rules for public company disclosure and the statutory rights of investors.
6. Explain how takeover bids and insider trading are regulated.
GOALS OF REGULATION
So far we have learned that fi nancial markets and fi nancial intermediaries developed over time to meet the ever-evolving needs of investors. While true, what we also need to consider are the ways in which industry regulation have evolved to protect investors and the industry itself.
Although investor protection is the primary goal of securities regulation, it is not the only goal. The various Canadian regulatory bodies play a key role in fostering market integrity.

© CSI GLOBAL EDUCATION INC. (2010)3•4
What do we mean by market integrity? We have learned that productive investing takes place when savings are funnelled through the capital markets to the various products, for example, stocks and bonds, so that they are channelled into investments and projects that will yield the greatest benefi t. For this to happen effi ciently, investors must feel confi dent that they will be treated fairly and equally when participating in the capital markets. Ultimately, what this means is that individuals and institutions can invest with confi dence in open and fair capital markets.
How does the industry achieve this lofty goal? There are a variety of ways. The industry has developed high professional standards and educational programs to ensure the competence of industry employees. Investor protection funds are in place to protect individual investors in the unlikely event that a fi rm goes bankrupt. The regulatory bodies have the authority to prosecute individuals and fi rms that are suspected of wrongdoing. Also, they can impose penalties in the form of reprimands, fi nes, suspensions, and expulsion where fault has been proven.
The focus of this chapter is an overview of the regulatory environment in Canada. We look at the role of the various regulatory bodies, the principles of regulation, and the rights of investors.
KEY TERMS
Arbitration National policies
Autorité des marchés fi nanciers (AMF) National Registration Database (NRD)
Benefi cial owner New Account Application Form
Canada Deposit Insurance Corporation (CDIC) Nominee
Canadian Investor Protection Fund (CIPF) Office of the Superintendent of Financial
Canadian Securities Administrators (CSA) Institutions (OSFI)
Director’s circular Ombudsman for Banking Services and
Fiduciary obligation Investments (OBSI)
Insiders Proxy
Investment Advisors (IAs) Reporting issuer
Investment Representatives (IRs) Right of action for damages
Mutual Fund Dealer Association Investor Right of rescission
Protection Corporation (MFDA IPC) Right of withdrawal
Material change Self-Regulatory Organizations (SROs)
National Do Not Call List (DNCL) Takeover bid
Universal Market Integrity Rules (UMIR)
In the on-line Learning Guide for this module,
complete the Getting Started
activity.

THREE • THE CANADIAN REGULATORY ENVIRONMENT 3•5
© CSI GLOBAL EDUCATION INC. (2010)
WHO ARE THE REGULATORS?
In Chapters 1 and 2, you learned about the role financial instruments, markets and intermediaries play in helping to create efficient capital markets. In this chapter, we examine the regulatory role played by federal regulators, the provincial securities regulators, the self-regulatory organizations (the SROs), and the various investor protection funds.
The Office of the Superintendent of Financial InstitutionsThe Office of the Superintendent of Financial Institutions (OSFI) was established in 1987 to provide a simple regulatory body for all federally regulated financial institutions. OSFI is responsible for regulating and supervising 153 deposit-taking institutions including banks, trust and loan companies, and cooperative credit associations, 284 insurance companies, including life insurance companies, fraternal benefit societies and property & casualty insurance companies and 29 foreign bank representative offices that are chartered, licensed or registered by the federal government. The Office also supervises over 1,200 federally regulated pension plans. It does not regulate the Canadian securities industry.
OSFI also provides actuarial advice to the Government of Canada and conducts reviews of certain provincially chartered financial institutions by virtue of federal-provincial arrangements or through agency agreements with the Canada Deposit Insurance Corporation (CDIC).
Canada Deposit Insurance CorporationThe Canada Deposit Insurance Corporation (CDIC) is a federal Crown Corporation. It was created in 1967 to provide deposit insurance and contribute to the stability of Canada’s financial system. CDIC insures eligible deposits up to $100,000 per depositor in each member institution (banks, trust companies and loan companies), and reimburses depositors for the amount of any insured deposits if a member institution fails.
To be eligible for insurance, deposits must be in Canadian currency and payable in Canada. Term deposits must be repayable no later than five years from the date of deposit. The $100,000 maximum includes all insurable types of deposits you have with the same CDIC member. Deposits at different branches of the same member institution are not insured separately.
Accounts and products insured by CDIC include:
• Savings and chequing accounts
• Guaranteed investment certifi cates (GICs) and other term deposits that mature in fi ve years or less
• Money orders, certifi ed cheques, traveller’s cheques and bank drafts
• Accounts that hold realty taxes on mortgaged properties
These accounts and products must be held at a CDIC member and in Canadian dollars to be eligible for deposit insurance.
WHO ARE THE REGULATORS?

CANADIAN SECURITIES COURSE • VOLUME 13•6
© CSI GLOBAL EDUCATION INC. (2010)
CDIC does not insure:
• Mutual funds and stocks
• GICs and other term deposits that mature in more than fi ve years
• Bonds and Treasury bills
• Debentures issued by governments, corporations, or chartered banks
As well, CDIC does not insure accounts or products held in U.S. dollars, other foreign currencies or held in banks or other institutions that are not CDIC members.
It is possible to have more than $100,000 in deposits eligible for CDIC coverage, provided the deposits are held in more than one of CDIC’s six deposit insurance categories. These categories include deposits held:
• in one name
• jointly in more than one name
• in a trust account
• in a registered retirement savings plan (RRSP)
• in a registered retirement income fund (RRIF)
• in a mortgage tax account
To date, CDIC has provided protection to depositors in 43 member institution failures. As of March 2009, the CDIC insured more than $500 billion in deposits.
Credit Union Deposit Insurance CorporationIn each province, one or more organizations exist to protect the deposits of credit union members. This organization may be called a deposit insurance or deposit guarantee corporation or stabilization fund, corporation, board or central credit union. Terms and maximum coverages may vary by province.
In British Columbia, for example, the Credit Union Deposit Insurance Corporation (CUDIC), a government corporation, was established in 1958 to protect credit union members against the loss of deposits held by British Columbia credit unions. Since 2008, CUDIC provides unlimited deposit insurance protection on all money on deposit and money invested in non-equity shares with a British Columbia credit union. Accrued interest and declared and unpaid dividends are included in this coverage. All credit unions in the province have deposit insurance coverage with CUDIC.
In Ontario, each depositor in any one credit union or caisse populaire is insured to a maximum of $100,000 for the combined principal, interest, and dividends relating to that member’s total deposits. RRSP, RRIF or OHOSP contracts and unique trust or joint accounts are separately insured up to $100,000 per contract or account. This insurance is provided by the Deposit Insurance Corporation of Ontario.
The Provincial RegulatorsIn Canada, the regulation of the securities business is a provincial responsibility. Each province and the three territories is responsible for creating the legislation and regulation under which the

THREE • THE CANADIAN REGULATORY ENVIRONMENT 3•7
© CSI GLOBAL EDUCATION INC. (2010)
industry must operate. In several provinces, much of the day-to-day regulation is delegated to Securities Commissions. In other provinces, securities administrators, who are appointed by the province, take on the regulatory function.
In Québec, the regulatory body is neither a securities commission nor a securities administrator and its power is not limited to the securities industry only. The Autorité des marchés financiers (AMF) is responsible for administering the regulatory framework for Québec’s financial sector, notably in the areas of insurance, deposit insurance institutions, the distribution of financial products, financial services, and securities.
The provincial regulators recognize that their task is a complicated one, particularly for industry participants who operate in more than one province. To lessen the regulatory burden, the regulators work closely with each other for the purpose of harmonizing regulations and to maintain the highest industry standards
The 13 securities regulators of Canada’s provinces and territories joined together to form the Canadian Securities Administrators (CSA), a forum to co-ordinate and harmonize regulation of the Canadian capital markets. The mission of the CSA is to give Canada a securities regulatory system that protects investors from unfair, improper or fraudulent practices and that fosters fair, efficient and vibrant capital markets. All Administrators can suspend, cancel or revoke registration, levy fines, order trading in a security to cease, and deny the right to trade securities in a province.
The Self-Regulatory OrganizationsSelf-Regulatory Organizations (SROs) are private industry organizations that have been granted the privilege of regulating their own members by the provincial regulatory bodies. SROs are responsible for enforcement of their members’ conformity with securities legislation and have the power to prescribe their own rules of conduct and financial requirements for their members.
SROs are delegated regulatory functions by the provincial regulatory bodies, and SRO by-laws and rules are designed to uphold the principles of securities legislation. The provincial securities commissions monitor the conduct of the SROs. They also review the rules of the SROs in the province to ensure that the SRO rules do not conflict with securities legislation and are in the public’s interest. SRO regulations apply in addition to provincial regulations. If an SRO rule differs than a provincial rule, the most stringent rule of the two applies.
Canadian SROs include the Investment Industry Regulatory Organization of Canada (IIROC) and the Mutual Fund Dealers Association (MFDA).
THE INVESTMENT INDUSTRY REGULATORY ORGANIZATION OF CANADA
The Investment Industry Regulatory Organization of Canada (IIROC) was created through the consolidation of the Investment Dealers Association of Canada (IDA) and Market Regulation Services Inc. (RS). The new organization was approved by the CSA and officially launched on June 1, 2008 with a mandate to oversee all investment dealers and trading activity on debt and equity marketplaces in Canada. IIROC carries out its regulatory responsibilities through setting and enforcing rules regarding the proficiency, business and financial conduct of dealer member firms and their registered employees and through setting and enforcing market integrity rules regarding trading activity on Canadian equity marketplaces.

CANADIAN SECURITIES COURSE • VOLUME 13•8
© CSI GLOBAL EDUCATION INC. (2010)
IIROC’s mandate is “to set high quality regulatory and investment industry standards, protect investors and strengthen market integrity while maintaining efficient and competitive capital markets.”
IIROC plays the following roles:
• Financial Compliance: Includes monitoring dealer members to ensure they have enough capital to carry out their operations.
• Business Conduct Compliance: Includes monitoring dealer members to ensure policies and procedures are in place to properly supervise the handling of client accounts.
• Registration: Responsibility for overseeing professional standards and educational programs designed to maintain the competence of industry employees.
• Enforcement: Includes responsibility for enforcing the rules and regulations that cover sales, business, and fi nancial practices and trading activities of individuals and fi rms that are under IIROC’s jurisdiction.
IIROC also conducts market surveillance by regulating securities trading and market-related activities of participants on Canadian equity marketplaces—stock exchanges and alternative trading systems. Market surveillance includes:
• Real time monitoring of trading activity on the following marketplaces:
– Toronto Stock Exchange (TSX);
– TSX Venture Exchange (TSX V);
– Canadian National Stock Exchange (CNSX);
– Natural Gas Exchange Inc. (NGX);
– Bloomberg Tradebook Canada;
– Alpha ATS;
– Chi-X Canada;
– Liquidnet Canada;
– MATCH NOW;
– OMEGA ATS; and
– Pure Trading (facilitated by CNSX)
• Ensuring dealer members comply with the timely disclosure of information by publicly-traded companies in Canada.
• Carrying out trading analysis and compliance with the Universal Market Integrity Rules (UMIR).
THE INVESTMENT INDUSTRY ASSOCIATION OF CANADA
The former IDA’s mission was twofold: to act as the self-regulatory organization of the industry to protect investors and to act as a professional association for its members. On April 1, 2006, the professional association was separated from the SRO function and a new association was created, the Investment Industry Association of Canada (IIAC).
THREE • THE CANADIAN REGULATORY ENVIRONMENT 3•9
© CSI GLOBAL EDUCATION INC. (2010)
The IIAC is a member-based professional association that represents the interests of market participants. The membership base consists of a broad cross-section of the securities industry, including full service securities firms, institutional and retail boutique firms, and discount brokerages. The IIAC provides support and services that contribute to the success of their members. It also represents the investment industry’s views and interests to federal and provincial governments and their agencies, and to other SROs in such areas as securities and capital markets legislation and regulation and fiscal and monetary policy.
THE MUTUAL FUND DEALERS ASSOCIATION
The Mutual Fund Dealers Association (MFDA) is the mutual fund industry’s self-regulatory organization responsible for regulating the distribution and sales of mutual funds by its members in Canada. The MFDA does not regulate the mutual funds themselves, as this responsibility has remained with provincial securities commissions. As of July 2010, the MFDA has been recognized as an SRO by Alberta, British Columbia, Nova Scotia, Ontario, Saskatchewan, New Brunswick and Manitoba. The MFDA has the ability to admit members, to audit, to enforce rules and apply penalties, and established an investor protection fund in July 2005.
Canadian Investor Protection FundThe securities industry offers the investing public protection against loss due to the financial failure of any firm in the self-regulatory system. To foster continuing confidence in the firm-customer relationship, the industry created the Canadian Investor Protection Fund (CIPF) in 1969 and the Mutual Fund Dealer Association Investor Protection Corporation (MFDA IPC) in 2005.
The primary role of CIPF is investor protection and its secondary role is overseeing the self-regulatory system. The secondary role provides a mechanism to help CIPF contain the risk associated with its primary role.
The Fund protects eligible customers in the event of the insolvency of an IIROC dealer member. The CIPF maintains on its website, at www.cipf.ca, a list of members whose eligible customers are entitled to protection. The CIPF does not cover customers’ losses that result from changing market values, and accounts held at mutual fund companies, banks and other firms that are not members of IIROC.
The CIPF is sponsored solely by IIROC and funded by quarterly assessments on dealer members. As of December 2009 the CIPF had $559 million of resources to pay customers’ claims. Since its inception, the CIPF has paid claims totalling $36 million to eligible customers of 17 insolvent members.
GENERAL ACCOUNT AND SEPARATE ACCOUNTS
All accounts of a customer are covered either as part of the customer’s general account or as a separate account. Accounts of a customer such as cash, margin, short sale, options, futures and foreign currency are combined and treated as one general account entitled to the maximum coverage.
Joint accounts are presumed to be equally divided in value among each owner of the account.
Separate accounts are accounts (or groups of similar accounts) disclosed in the records that are treated as if they belonged to a separate customer, and they are each entitled to the maximum

CANADIAN SECURITIES COURSE • VOLUME 13•10
© CSI GLOBAL EDUCATION INC. (2010)
coverage. For example, registered retirement accounts are combined into one separate account. Examples of separate accounts include:
• Registered retirement plans such as RRSPs and registered retirement income funds (RRIFs), life income funds (LIFs), locked-in retirement accounts or plans (LIRAs or LIRSPs) and locked-in retirement income funds (LRIFs).
• Registered education savings plans (RESPs).
• Partnerships.
COVERAGE
The CIPF covers customers’ losses of securities and cash balances that result from the insolvency (the inability to pay debts as they come due; also referred to as bankruptcy) of an IIROC dealer member, within the limits described below. Under the policies, certain persons are excluded as customers and are not entitled to CIPF protection. Persons who deal with CIPF members through accounts used for business financing purposes, such as for securities lending, are not eligible for CIPF protection.
Coverage provided for a customer’s general account is limited to $1,000,000 for losses related to securities and cash balances. Separate accounts of customers are each entitled to the maximum coverage of $1,000,000 unless they are combined with other separate accounts.
The maximum amount of financial loss that CIPF may pay to a customer is the shortfall between any available securities and cash that the customer is entitled at the date of insolvency and the distribution of any assets of the insolvent dealer member, less any amounts owed by the client to the member.
Example: Judy has $2 million invested in securities and cash with ABC Investment Inc. when ABC declares bankruptcy. She did not owe any amount to ABC. At the time of bankruptcy, the market value of all accounts held by ABC was $100 million, but the amount available for distribution to clients after the bankruptcy was $80 million. Here’s how CIPF determines their involvement:
• ABC has a shortfall of $20 million to cover client accounts.
• ABC can cover only 80% of Judy’s account, or $1.6 million ($80 million divided by $100 million is 80% and 80% of $2 million is $1.6 million).
• The CIPF will step in to cover this shortfall up to the $1 million maximum per account.
• Judy will receive $1.6 million from ABC and $400,000 from the CIPF; no loss to her.
Customers have 180 days to file a claim with the CIPF. The 180-day period commences on the date of bankruptcy, if applicable, or the date of insolvency as determined and communicated by the CIPF.
In the event of the insolvency of a dealer member, CIPF would normally expect to petition the court under the Bankruptcy and Insolvency Act (BIA) to appoint a trustee liquidate the firm and protect its customers. The trustee and CIPF will usually arrange to have customer accounts transferred in whole or in part to another CIPF dealer member. Customers whose accounts are transferred are notified promptly to deal with the new firm or subsequently transfer their
Example: Judy has $2 million invested in securities and cash with ABC Investment Inc. when ABCdeclares bankruptcy. She did not owe any amount to ABC. At the time of bankruptcy, the market valueof all accounts held by ABC was $100 million, but the amount available for distribution to clients after the bankruptcy was $80 million. Here’s how CIPF determines their involvement:
• ABC has a shortfall of $20 million to cover client accounts.
• ABC can cover only 80% of Judy’s account, or $1.6 million ($80 million divided by $100 million is80% and 80% of $2 million is $1.6 million).
• The CIPF will step in to cover this shortfall up to the $1 million maximum per account.
• Judy will receive $1.6 million from ABC and $400,000 from the CIPF; no loss to her.
THREE • THE CANADIAN REGULATORY ENVIRONMENT 3•11
© CSI GLOBAL EDUCATION INC. (2010)
accounts to firms of their own choosing. This procedure minimizes disruption in customers’ trading activities and access to their assets.
In the unlikely event that the resources of the Fund are depleted, quarterly assessments within the prescribed limits will be made against dealer members and the proceeds will be distributed from time to time until all legal obligations of the Fund have been discharged.
REGULATORY OVERSIGHT
As well as protecting investors through the actual fund, CIPF provides regulatory oversight by working with the financial examiners and senior regulatory officials. Their role is to anticipate and to solve financial difficulties of dealer members, and, to the extent possible, bring about an orderly wind-down or transfer of business if required. The CIPF conducts an annual review and evaluation of the SRO’s examination activities to ensure that there is compliance with CIPF Minimum Standards and it conducts financial examinations of dealer members to ensure that they are in compliance with the CIPF Minimum Standards.
The CIPF and the SRO, under the direct supervision of the Administrators, establish and continuously review national standards for capital adequacy and liquidity, financial reporting, accounting records, segregation of clients’ fully and partly paid securities, insurance and other matters relating to the financial condition of dealer members. They also co-ordinate the surveillance and enforcement efforts of the examination staff and have close liaison with the panel of public accounting firms approved to audit and report annually on the financial condition of dealer members.
Mutual Fund Dealers Association Investor Protection CorporationThe MFDA Investor Protection Corporation (MFDA IPC) provides protection for eligible customers of insolvent MFDA member firms. Each claim is considered according to the policies adopted by the Board of Directors of the MFDA IPC. The IPC does not cover customers’ losses that result from changing market values, unsuitable investments, or the default of an issuer of a mutual fund.
The coverage provided is limited to $1,000,000 per customer account for losses related to securities, cash balances, segregated funds, and certain other property held in the account of a MFDA member firm.
Following the structure of the CIPF, customer accounts are covered either as part of a general account or as a separate account. Each account is eligible for up to $1,000,000 in coverage. Separate accounts include registered retirement accounts, such as Registered Retirement Savings Plans (RRSPs) or Registered Retirement Income Funds (RRIFs). These accounts are combined into one separate account for coverage purposes. General and separate accounts held with one MFDA member firm are not combined with accounts customers might hold at another member firm.
The MFDA is not recognized as a self-regulatory organization in the province of Québec. Consequently, the MFDA IPC coverage is not currently available to customers with accounts held in Québec MFDA member firms.

CANADIAN SECURITIES COURSE • VOLUME 13•12
© CSI GLOBAL EDUCATION INC. (2010)
Role of ArbitrationThere are times when clients feel that they have been treated unfairly by a firm that is a member of an SRO. If, after discussing the problem with the firm, they still feel mistreated, clients have the option of suing the firm or requesting arbitration. Arbitration is a method of dispute resolution in which an independent arbitrator is chosen to:
• Listen to the facts and arguments of the parties to a dispute;
• Decide how the dispute should be resolved; and
• Decide what remedy, if any, should be imposed.
SROs can only discipline member registrants and cannot order restitution to be made to clients. The SROs therefore offer dissatisfied investors the option of pursuing damages through arbitration rather than in court. The arbitration process may assist clients in reaching a settlement due to registrant wrongdoing. Arbitration may also be cheaper and faster than a court action, particularly where smaller amounts of money are concerned.
A client must receive an arbitration brochure when opening an account. If a written complaint has been received, a current brochure must be sent to the client.
If a client requests arbitration from an SRO, the dealer member must accept both the process and the arbitrator’s decision. To be eligible for arbitration, the dispute must meet the following criteria:
• Attempts must have been made to resolve the dispute with the investment dealer.
• The claim cannot exceed $100,000.
• The events in dispute must have originated after January 1, 1992 in British Columbia, after January 1, 1996 in Québec, after June 30, 1998 in Ontario, after July 1, 1999 in Alberta, Saskatchewan and Manitoba, and after June 30, 1999 in Newfoundland, Prince Edward Island, New Brunswick and Nova Scotia.
Claims that do not fit within the dollar amounts mentioned above may still be arbitrated if both parties agree to the process.
The decision of the arbitrator is binding, and at the beginning of the arbitration process both parties must sign an agreement to give up the right to pursue the matter further in the courts.
Ombudsman for Banking Services and InvestmentsAnother avenue for investors who feel that they have been treated unfairly is the Ombudsman for Banking Services and Investments (OBSI). OBSI is an independent organization that investigates customer complaints against financial services providers, including banks and other deposit-taking organizations, investment dealers, mutual fund dealers and mutual fund companies.
It provides prompt and impartial resolution of complaints that customers have been unable to resolve satisfactorily with their financial services provider. The OBSI is independent of the financial services industry. After investigation, the final decision on the fair resolution of complaints rests solely with the Ombudsman. The process is not binding for either the investor or the financial services provider. However, member companies who do not agree to a
Complete the on-line activity associated with
this section.

THREE • THE CANADIAN REGULATORY ENVIRONMENT 3•13
© CSI GLOBAL EDUCATION INC. (2010)
recommendation by the Ombudsman will be publicly reported. To date no member has failed to follow the Ombudsman’s recommendation.
WHAT ARE THE PRINCIPLES OF SECURITIES LEGISLATION?
The securities industry has extensive legislation and regulation to protect the investor and to ensure high ethical standards. This protection flows from self-regulatory organizations (SROs) as well as the provincial securities regulators and administrators. Regulation is covered in much greater detail in CSI’s The Conduct and Practices Handbook (CPH) course. Some of the basic concepts are covered here.
Provincial securities acts are designed to regulate the underwriting, distribution and sale of securities, and to protect buyers and sellers of securities. The term act is used here to refer to the securities act or the securities-related legislation of a province. The term administrator is used to describe the securities regulatory authority of a province, whether it is a commission, registrar or other government official.
No federal regulatory body for the securities industry exists in Canada, in contrast to the United States where the national Securities and Exchange Commission (SEC) has considerable regulatory authority. With increasing involvement in the investment business by federally regulated financial institutions such as banks, trusts and insurance companies, the number of National Policies issued by the CSA has increased. These National Policies attempt to create a regulatory environment that is harmonized throughout each and every provincial jurisdiction.
Formal conferences of provincial administrators are held regularly and informal consultation and co-operation is continuous.
Full, True and Plain DisclosureThe general principle underlying Canadian securities legislation is not approval or disapproval of the investment merits of a particular issue of securities by the provincial administrator, but rather that of full, true and plain disclosure of all pertinent facts by those offering the securities for sale to the public. Until disclosure is made to the satisfaction of the administrator concerned, it is illegal to offer such securities for public sale. As discussed earlier, such disclosure is normally made in a prospectus issued by the company and accepted for filing by the administrator concerned.
Even the most determined public official and the most exhaustive legislation cannot guarantee that the gullible or the greedy will not suffer financial loss, nor that those intent on dishonest behaviour will be stopped. It is very difficult to restrict completely the activities of unscrupulous promoters without impeding the efforts of legitimate entrepreneurs. The laws are designed to prevent, as far as possible, fraud and deceit and to protect the investor from his or her own naiveté due to a lack of information or undue selling pressure from investment service providers. Nevertheless, no legislation supplants the rule that one must investigate before one invests or recommends an investment.
Generally, the acts use three basic methods to protect investors: registration of securities dealers and advisors, disclosure of facts necessary to make reasoned investment decisions and enforcement of the laws and policies. The industry also relies on the SROs for their members’ compliance to legislation.
WHAT ARE THE PRINCIPLES OF SECURITIES LEGISLATION?

CANADIAN SECURITIES COURSE • VOLUME 13•14
© CSI GLOBAL EDUCATION INC. (2010)
RegistrationGenerally, every firm and all investment advisors (IAs) employed by such firms must be registered. As well as granting registrations, administrators have the power to suspend or cancel registration or otherwise discipline registrants.
All employees of IIROC dealer members who deal with the investing public must register with IIROC as well as with the applicable administrator. Such employees must meet IIROC’s requirements for approval which include, as a minimum, completion of the Canadian Securities Course (CSC) and an examination based on the Conduct and Practices Handbook (CPH) course.
New investment advisors must also complete a 90-day training program before they are permitted to deal with the public. After licensing, the registrant is subject to a six-month period of supervision by his or her supervisor. New registrants must also complete CSI’s Wealth Management Essentials Course (WME) within 30 months of becoming licensed as an IA. Participation in the industry’s Continuing Education program is also a condition of maintaining a licence.
Applicants not giving any advice to clients may choose to be registered as investment representatives (IRs). The proficiency requirements for IRs are similar to those for IAs, with the exception of the length of the training period (30 days as opposed to 90 days) and the 30-month requirement.
In order to become a Sales Manager, the candidate must successfully complete the Branch Managers Course (BMC). Within 18 months they must also complete the Effective Management Seminar (EMS). Both courses are offered by CSI.
Employees of securities firms who are not primarily engaged in sales, such as trading desk and certain administrative personnel, may occasionally accept orders from the public. In most provinces, such employees may be designated as Non-Trading Employees and may be exempt from registration by the administrator. If exempt status is not given, however, such employees are required to register with the applicable administrator.
Firms may have full registration, allowing employees a fair amount of latitude in their dealings with the public. Some firms, such as mutual fund dealers, are restricted as to their permitted activities. IAs should be aware of any restrictions that apply to their firms.
REGISTRATION CATEGORIES
Dealer members have several job positions where individuals must be registered. National Instrument (NI) 31-103, Registration Requirements, lists nine registration categories within a dealer member, all of which are distinguished by their functions:
1) Investment Representative: approved to take unsolicited orders.
2) Registered Representative: approved to give investment advice (also referred to as an Investment Advisor).
3) Trader: approved to enter orders into the trading systems of specifi c exchanges.
4) Supervisor: approved to supervise the business activities of other approved persons.
5) Executive: approved to participate in the executive management of a dealer member.
THREE • THE CANADIAN REGULATORY ENVIRONMENT 3•15
© CSI GLOBAL EDUCATION INC. (2010)
6) Director: app roved to sit on the Board of Directors of a dealer member or occupy a similar position in a dealer member not organized as a corporation.
7) Ultimate Designated Person: The Chief Executive Offi cer of a dealer member or person in a similar position, approved to have overall responsibility for the dealer member’s compliance with laws and regulations, including IIROC Rules, governing its securities related activities.
8) Chief Financial Offi cer: approved to be responsible for ensuring that the dealer member complies with the fi nancial adequacy requirements of IIROC Rules.
9) Chief Compliance Offi cer: approved to be responsible for ensuring that the dealer member has systems and controls reasonably designed to ensure its compliance with laws and regulations, including IIROC Rules, governing its business conduct.
The National Registration Database (NRD)The National Registration Database (NRD) is a web-based system used by investment dealers and employees to file registration forms electronically when applying for approval by any one or more of the stock exchanges, the CSA or IIROC. The NRD is designed to enable a single electronic submission to satisfy all jurisdictions in Canada.
The significance of the NRD means that instead of requiring registrants who want to be licensed in more than one province or territory to file separate registration forms in each jurisdiction, the NRD is designed to enable a single electronic submission to satisfy all jurisdictions in Canada. The NRD also eliminates the burden of providing proof of registration in other jurisdictions because the regulators can use the NRD to verify registration status in other jurisdictions.
Both the IA and the dealer member are required to notify the applicable SROs immediately in writing of any material changes in the original answers to the questions on the NRD application. This includes a change of address. Also, each dealer member is required to immediately report to the administrators and SROs to which it belongs, the termination of an IA. If the IA is dismissed for cause, a statement of the reasons for the dismissal must be reported.
Know Your Client RuleThe SROs require that dealer members and their investment advisors:
• Learn the essential facts relative to every client and to every order or account accepted – the “know your client” rule.
• Ensure that the acceptance of any order for any account is within the bounds of good business practice.
• Ensure that recommendations made for any account are appropriate for the client and in keeping with his or her investment objectives, personal circumstances and tolerance to bearing risk – the suitability principle.
The first step in complying with this regulation is completion of a New Account Application Form (NAAF) prior to the acceptance of any order. A partner, director, officer or branch manager of the advisor’s firm must approve the application prior to or promptly after the completion of the first transaction.

CANADIAN SECURITIES COURSE • VOLUME 13•16
© CSI GLOBAL EDUCATION INC. (2010)
Fiduciary DutyEvery director of a public corporation has a fiduciary obligation not to reveal privileged or inside information to anyone not authorized to receive it. A director is not released from this obligation until there is a full public disclosure of such data, particularly when the information might have a bearing on the market price of the corporation’s securities.
The rules of most stock exchanges deal with the potential conflicts of interest that may arise when a director of a public corporation is also a director, partner, officer or employee of a securities firm, and prescribe what is acceptable conduct by and for the director. The same obligations apply to an advisor or other employee of a dealer member who is assisting in an underwriting or acting in an advisory capacity to a corporation and as a result is discussing confidential matters. Should the matter require consultation with other personnel of the dealer member, adequate measures should be taken to guard the confidential nature of the information to prevent its misuse within or outside the dealer member.
Fiduciary obligations may also arise when an advisor is providing investment advice. Where an advisor undertakes to advise a client, the advisor owes a duty to the client to advise fully, honestly and in good faith. An advisor must ensure that all conflicts are disclosed and all representations made with respect to an investment are honest. In addition, an advisor acts as agent for the client in executing the client’s investment transaction (“best execution”). In doing so, the advisor is bound to do the best for the client and to follow the client’s instructions or intentions. An advisor must advise a client if instructions cannot be carried out, in order to allow the client to make alternate arrangements. A breach of these obligations can result in civil liability being imposed directly upon the advisor and upon the dealer member responsible for supervising the advisor.
NATIONAL DO NOT CALL LIST
Advisors often use the telephone as a tool to solicit new clients. By doing so, they are considered as telemarketers by the Canadian Radio-television and Telecommunications Commission (CRTC). The CRTC has established Rules that telemarketers and organizations that hire telemarketers must follow. They include requiring the telemarketer to subscribe to the National Do Not Call List (DNCL). The DNCL Rules prohibit telemarketers and clients of telemarketers from calling telephone numbers that have been registered on the DNCL for more than 31 days. All telemarketers and clients of telemarketers must follow these Rules unless they are making calls that are specifically exempted. Telemarketing is broadly defined and includes sales or prospecting calls. Telemarketing firms must remove or “scrub” their calling lists of persons included in the DNCL. Detailed information about the DNCL can be found on the CRTC’s website: https://www.lnnte-dncl.gc.ca/ind/faqs-eng.
WHAT ARE THE ETHICS OF TRADING?
Ethical trading is of paramount importance to both the investing public and the users of the capital markets, the listing corporations. If trading on an exchange were considered unethical it would be impossible for corporations to raise the money they require for expansion and growth because the investing public would simply not participate. This could cripple new financings by both initial and experienced issuers of securities.
WHAT ARE THE ETHICS OF TRADING?

THREE • THE CANADIAN REGULATORY ENVIRONMENT 3•17
© CSI GLOBAL EDUCATION INC. (2010)
The exchanges and the SROs have developed extensive rules and regulations in conjunction with the securities regulators to govern trading. Infractions are punishable by fines, suspensions and expulsion. If required, criminal charges can be laid against those found to have violated regulations.Unethical conduct may be defined as any omission, conduct, manner of doing business or negotiation, which in the opinion of the disciplinary body is not in the public interest nor in the interest of the exchange. Decisions made by the SROs can be appealed to the governing body.
Examples of Unethical PracticesThe following are examples of practices which are considered unethical:
• Any conduct which has the effect of deceiving the public, the purchaser or the vendor of any security as to the nature of any transaction price or value of such security;
• Creating or attempting to create a false or misleading appearance of active public trading in a security, e.g., fi ctitious orders for the same security placed with a variety of securities fi rms or a series of orders for one security in an attempt to create a false impression of market interest;
• Entering or attempting to enter into any scheme or arrangement to sell and repurchase a security in an effort to manipulate the market;
• Deliberately causing the last sale for the day in a security to be higher than warranted by the prevailing market conditions (window dressing);
• Making a fi ctitious trade or giving or accepting an order which involves no change in the benefi cial ownership of a security for the purposes of misleading the public;
• Misleading or attempting to mislead any board of governors or any committee on any material point;
• Confi rming a transaction where no trade has been executed (bucketing);
• Improper solicitation of orders either by telephone or otherwise;
• High pressure or other selling techniques of a nature considered undesirable;
• Violation of any statute applicable to the sale of securities;
• Selling or attempting to sell a prospective dividend on a stock;
• Leading a client to believe that there is no risk or chance of loss through opening an account or trading in this account or purchasing a specifi c security;
• Making a practice, directly or indirectly, of taking the opposite side of the market to clients, or effecting a trade for the advisor’s own account prior to effecting a trade for a client (front running); or
• Conduct that would bring the securities business, the exchanges, or IIROC into disrepute.

CANADIAN SECURITIES COURSE • VOLUME 13•18
© CSI GLOBAL EDUCATION INC. (2010)
A dealer member is responsible for the acts or omissions of all its employees. Conduct by an advisor considered unethical may be dealt with, in matters of discipline, as though it were the conduct of the dealer member itself, as well as that of the advisor.
Prohibited Sales PracticesSecurities legislation prohibiting certain types of selling activities exists for very good reasons. Any competent and honest advisor may earn a substantial income while performing a valuable service and will not be materially impeded by these provisions. Unethical, dishonest, high-pressure operators will find that such regulations are designed to curb their style of selling.
It is extremely important that all advisors study the rules applicable in their province and conform carefully to all the requirements. All changes in the law should be carefully noted, and the advisor should immediately conform to such changes.
WHAT ARE PUBLIC COMPANY DISCLOSURES AND INVESTOR RIGHTS?
Securities legislation in each of the provinces requires the continuous disclosure of certain prescribed information concerning the business and affairs of public companies. This disclosure usually consists of periodic financial statements (including management discussion and analysis), insider trading reports, information circulars required in proxy solicitation, an annual information form (AIF), press releases and material change reports.
The principle of disclosure is seen also in the requirements of the acts, regulations and policy statements of most provinces covering a distribution of securities. Generally, every person or corporation that sells or offers to sell to the public securities which have not previously been distributed to the public, or which come from a control position, is required to file with, and obtain the approval of, the administrator in the province. They must deliver to the purchaser a prospectus containing full, true and plain disclosure of all material facts related to the issue.
Continuous DisclosureOnce a reporting issuer has distributed securities, the company must comply with the timely and continuous public disclosure requirements of the acts. The primary disclosure requirements include issuing a press release and filing a material change report with the administrators if a material change occurs in the affairs of the issuer.
Any change in a company that would reasonably be expected to have a significant effect on the market price or value of its securities is called a material change. Exhibit 3.1 lists some of the items that constitute a material change in the affairs of a listed company.
WHAT ARE PUBLIC COMPANY DISCLOSURES AND INVESTOR RIGHTS?

THREE • THE CANADIAN REGULATORY ENVIRONMENT 3•19
© CSI GLOBAL EDUCATION INC. (2010)
EXHIBIT 3.1 MATERIAL CHANGES
• A change in the nature of the business.
• A change in the Board of Directors or the principal offi cers.
• A change in the benefi cial or registered share ownership of the company which, to the knowledge of the company, or its offi cers, directors or major shareholders, or in the opinion of the exchange, is suffi cient to materially affect control.
• The acquisition or disposition by the company, in one transaction or in a series of similar transactions, of any mining or oil property or interest, or of shares or other securities in another company.
• The entering by the company into any management contract.
• In instances of a takeover of one company by another, shareholders who do not tender their shares in acceptance of the offer may, by law, be required to tender their shareholdings at the request of the purchaser if a signifi cantly large percentage of outstanding shares are voluntarily tendered. This force out provision helps eliminate tag-ends of outstanding issued shares not tendered under the offer.
• In some cases, the sale of shares of certain companies to persons who are not Canadian citizens or not residents of Canada is restricted. These companies, known as constrained share companies, include banks, trust and insurance companies, broadcasting and communications companies.
Companies also must file with the administrators annual and interim financial statements meeting prescribed standards of disclosure. Companies are required to ensure that no selective disclosure of confidential material information occurs to third parties, such as during meetings with financial analysts or restricted conference calls with institutional investors. By taping all such discussions and reviewing the tapes immediately after all meetings or conference calls, a company can determine whether any previously undisclosed confidential material information was inadvertently disclosed. If it was, an immediate press release by one of its responsible officers should be released, and the appropriate regulators should be notified of the inadvertent disclosure.
While some securities legislation does not specifically require that the financial statements be sent directly to shareholders, provincial corporations legislation and stock exchange by-laws do make this a requirement. Most companies usually provide financial statements in the required form to all shareholders and send additional copies to the appropriate administrators.
The financial disclosure provisions also require that the following information be sent to shareholders and administrators:
• Comparative audited annual fi nancial statements including a statement of profi t and loss, a statement of surplus (i.e., retained earnings), a balance sheet and a statement of changes in fi nancial position within 120 days of the fi nancial year-end for companies listed on the TSX Venture Exchange and 90 days for senior issuers on the TSX;
• Comparative unaudited quarterly interim fi nancial statements including an income statement and usually a statement of changes in fi nancial position within 60 days of the end of each of the fi rst three quarters of the fi nancial year for companies listed on the TSX Venture Exchange and 45 days for senior issuers on the TSX.

CANADIAN SECURITIES COURSE • VOLUME 13•20
© CSI GLOBAL EDUCATION INC. (2010)
Some administrators require additional financial disclosure and analysis beyond the financial statements in order to provide an adequate basis for assessment of the issuer’s recent history and outlook for the future. Such additional disclosure consists of the AIF and the Management Discussion and Analysis of financial condition and results of operations (MD&A).
Statutory Rights for InvestorsCanadian legislation provides three statutory rights for the purchaser of securities issued in Canada under prospectus requirements.
RIGHT OF WITHDRAWAL
The relevant securities legislation usually provides purchasers during a distribution by prospectus with a right of withdrawal from an agreement to purchase securities within two business days after receipt or deemed receipt of a prospectus and any amendment, by giving notice to the vendor or its agent. If a distribution that requires a prospectus is done without a prospectus, the purchaser in most provinces can revoke the transaction, subject to applicable time limits.
RIGHT OF RESCISSION
Most provinces give purchasers during a distribution by prospectus a right of rescission to rescind or cancel a contract for the purchase of securities, if the prospectus or amended prospectus offering the security contains a misrepresentation (e.g., an untrue statement of a material fact or an omission of a material fact). The right of rescission must be brought within 180 days of the date of the transaction. In most provinces, a purchaser alleging misrepresentation must choose between the remedy of rescission and damages. In Québec, rescission or revision of the price may be sought without affecting a purchaser’s claim for damages.
RIGHT OF ACTION FOR DAMAGES
The acts of most provinces provide that the issuer, the directors of an issuer, the seller of a security, the underwriter who signs a certificate for a prospectus, and any other person who signs a prospectus, may be liable for damages if the prospectus contains a misrepresentation. The same right of action for damages applies to an expert (such as an auditor, lawyer, geologist or appraiser) whose report or opinion, or a summary thereof, containing a misrepresentation appears with his or her consent in a prospectus. Experts are not liable if the misrepresentation did not appear in their report or opinion. For example, liability will not arise against the underwriter or the directors if they act with due diligence by conducting an investigation sufficient to provide reasonable grounds for a belief that there has been no misrepresentation. If the person or company can prove that the purchaser of the securities had knowledge of the misrepresentation, the claim may be considered invalid. The acts also provide certain limitations with respect to maximum liability that may be imposed and time limits during which an action may be brought.
A misrepresentation in a prospectus may also be a criminal offence for both the issuer and any of its directors or officers who authorized, permitted or acquiesced in the making of the misrepresentation.

THREE • THE CANADIAN REGULATORY ENVIRONMENT 3•21
© CSI GLOBAL EDUCATION INC. (2010)
Proxies and Proxy SolicitationEvery shareholder who is registered on a company’s books as owning shares is entitled to vote at the company’s annual general meeting. Shareholders receive proxy resolution and voting materials and an information circular to inform them of issues for consideration at the annual meeting. The proxy form or information circular must contain, among other items, information on directors to be elected, management compensation, and any other matters of interest to management.
However, it is not always possible for a shareholder to attend the annual meeting. In this case, shareholders have the option of completing a proxy form prior to the meeting. A proxy is a power of attorney given by a shareholder that gives a designated person the authority to vote the shareholder’s stock. A proxy must be in writing and signed by the shareholder granting the proxy. If a shareholder does not vote or leaves the items on the proxy form unmarked, the ballot is automatically cast with management’s viewpoint. It is therefore important for shareholders to read the resolutions and vote their proxy ballots. Proxy forms are available for viewing on SEDAR’s (the System for Electronic Document Analysis and Retrieval) website at www.sedar.com.
Most provinces require the management of a reporting issuer to solicit proxies from holders of its voting securities whenever it calls a shareholders’ meeting. These regulations were prompted by the realization that effective control of many companies is achieved through the use of proxies and that management could abuse its position in this area by soliciting proxies without proper disclosure.
Shares are most often registered in street form; that is, in the name of someone or some entity other than the true beneficial owner of the shares – referred to as a nominee (e.g., a bank, investment dealer or the Canadian Depository for Securities). To ensure that all shareholders receive or could receive corporate information, the administrators introduced a policy requiring the nominees to mail out to all beneficial holders of corporate securities materials relating to meetings as well as certain shareholder information and voting instruction forms. This policy was designed to ensure that non-registered holders have the same access to corporate information and the same voting privileges as registered holders.
TAKEOVER BIDS AND INSIDER TRADING
The securities legislation of most provinces contains provisions regulating takeover bids. A takeover is considered a change in the controlling interests of a company and could be a friendly acquisition or an unfriendly bid for control of the target company. Takeover bid legislation is basically designed to safeguard the position of shareholders of a company that is the target of a takeover by ensuring that each shareholder has a reasonable opportunity and adequate information to consider the bid.
TAKEOVER BIDS AND INSIDER TRADING

CANADIAN SECURITIES COURSE • VOLUME 13•22
© CSI GLOBAL EDUCATION INC. (2010)
Takeover BidsA takeover bid is an offer to the shareholders of a company to purchase the shares of the company that, with the offeror’s already owned securities, will in total exceed 20% of the outstanding voting securities of the company. In a takeover situation, the company (or individual) making the offer, if successful, will obtain enough shares to control the targeted company. The definition includes an offer to purchase, an acceptance of an offer to sell, and a combination of the two.
A takeover bid that is not exempted under the relevant act must comply with a number of requirements including the following:
• The takeover bid must be sent to all holders in the province of the class of securities sought, including securities that are convertible into securities of that class prior to the expiry of the bid.
• The offeror shall deliver with or as part of the bid, a takeover bid circular setting out certain prescribed information. This includes details about the bid, the offeror’s holdings in the target company and its relation to management of the target company.
• A directors’ circular must be sent to the security holders of the target company within 15 days of the date of the bid. The board of directors of the target company is required to provide certain information and to include either a recommendation to accept or reject the takeover bid and the reason for their recommendation. If that is not done, then the board is required to issue a statement that they are unable to make or are not making a recommendation. If no recommendation is made, they must specify the reasons for not making a recommendation.
• Any securities taken up by the offeror under the bid must be paid for within three business days.
A takeover bid is exempt from the above requirements in any of the following cases:
• It is made through the facilities of the exchange in accordance with the by-laws, regulations and policies of such exchange.
• It involves acquisitions which do not aggregate more than 5% of the securities of a class within a 12-month period and the price paid for any of the securities does not exceed the market price at the date of acquisition.
• It is an offer by way of private agreement with fi ve or fewer security holders at a price not exceeding 115% of the market price of the securities.
• It is an offer to purchase shares in a private company.
• In Ontario only, it is an offer where the number of holders of securities subject to the bid does not exceed 50 and the securities held constitute in aggregate less than two per cent of the outstanding securities of that class.
THREE • THE CANADIAN REGULATORY ENVIRONMENT 3•23
© CSI GLOBAL EDUCATION INC. (2010)
Under the acts, if a takeover bid circular is found to contain a misrepresentation and a security holder of the target company is deemed to have relied on this information to make an investment decision, that holder may elect to exercise a right to rescind the transaction. The investor also has a right of action for damages against the offeror, every director of the offeror, every expert (but only with respect to reports, opinions or statements made by such expert) and each other person who signed a certificate in the circular. Similarly if a directors’ circular contains a misrepresentation and a security holder of the target company is deemed to have relied on this information, that holder has a right of action for damages against every director or officer who has signed the circular. It is also an offence for a person or company to make a statement in a takeover bid circular or directors’ circular that contains a misrepresentation.
EARLY WARNING DISCLOSURE
Most of the acts state that every person or company accumulating 10% or more of the outstanding voting securities of any class of a reporting issuer, or securities convertible into such securities, is required to issue a press release immediately. The purchaser must file the press release with the administrator and file a report within two business days with the administrator. The press release and report are to contain certain details of the acquisition including a statement of the purpose of the acquisition and any future intentions to increase ownership or control.
After a formal bid is made for voting securities of a reporting issuer and before the expiry of the bid, every person or company, other than the offeror under the bid, acquiring five per cent or more of the securities of the class subject to the bid is required to issue a press release reporting this information. This press release must be issued no later than the opening of trading on the next business day, and a copy must be filed with the administrator.
Insider TradingMost provinces and the federal act require insiders of a reporting issuer to file reports of their trading in its securities. This is based on the principle that shareholders and other interested persons should be regularly informed of the market activity of insiders. In addition, insiders who make use of undisclosed information must give an accounting of their profits and may be liable for damages. The general principles of the law relating to insiders are described below. However, when a practical problem arises, great care must be taken to determine which of the various corporations acts, federal or provincial, apply to the situation. Their provisions differ slightly.
WHO ARE INSIDERS
For the purposes of disclosure provisions of the acts, insiders are generally defined to include any of the following:
• A director or senior offi cer of the company, or a subsidiary;
• A person or company (excluding underwriters in the course of public distribution) benefi cially owning, directly or indirectly, or controlling or directing more than 10% of the voting shares of the company;
• A director or senior offi cer of a company which is itself an insider of the company due to ownership, control or direction over more than 10% of the voting shares of the company involved; or

CANADIAN SECURITIES COURSE • VOLUME 13•24
© CSI GLOBAL EDUCATION INC. (2010)
• A reporting issuer where it has purchased, redeemed or otherwise acquired any of its securities, for so long as it holds any of its securities.
In some circumstances, insiders of Corporation A that has itself become an insider of Corporation B, may be deemed to be insiders of Corporation B. When dealing with trades relating to securities of a company that has been involved in such transactions, care should be taken to ascertain whether the persons involved are deemed under the relevant legislation to be insiders.
INSIDER REPORTING
Reports must state the extent of the insider’s direct or indirect beneficial ownership of, or control or direction over, securities of the company. Thereafter, the insider must report to the administrators details of any change from the previous report within ten days of the change, or any trade. Securities firms should be aware that most acts require an insider who transfers (except for giving collateral for a debt) securities of a reporting issuer into the name of an agent, nominee or custodian to file a report with the administrator.
All reports filed with the administrator are open for public inspection, and in some cases summaries are published in the administrator’s regular publication. Failing to file an insider report or giving false or misleading information are offences under the acts and are usually punishable by a fine.

THREE • THE CANADIAN REGULATORY ENVIRONMENT 3•25
© CSI GLOBAL EDUCATION INC. (2010)
SUMMARY
After reading this chapter, you should be able to:
1. Identify and describe the agencies and legal entities through which the Canadian securities industry is regulated.
• Each province is responsible for creating the legislation and regulation under which the securities industry must operate. This regulatory authority is usually delegated by the province to its own provincial securities commission or administrator.
• The Offi ce of the Superintendent of Financial Institutions (OSFI) provides regulatory oversight for all federally regulated fi nancial institutions, including banks and insurance, trust, loan and investment companies licensed or regulated by the federal government.
• The Canada Deposit Insurance Corporation (CDIC) is a federal Crown Corporation that protects eligible deposits from the fi nancial failure of a member institution. Eligible deposits are insured for up to $100,000 per depositor in each member institution.
2. Evaluate the role self-regulatory organizations (SROs) play in the regulatory process.
• SROs are responsible for enforcing member conformity with securities legislation and they have the power to prescribe their own rules of conduct and fi nancial requirements for their members.
• Canadian SROs include the Investment Industry Regulatory Organization of Canada (IIROC) and the Mutual Fund Dealers Association (MFDA).
• SRO regulation is divided between securities markets and the mutual funds distribution side. IIROC deals with all investment dealers and trading activity regulation on debt and equity marketplaces in Canada while MFDA deal with the distribution side of the mutual fund industry.
• CIPF protects clients of IIROC dealer members against losses caused by the insolvency of an IIROC dealer member and the MFDA IPC protects clients of MFDA member fi rms against losses caused by the insolvency of an MFDA member fi rm.
3. Discuss the principles that underlie securities legislation.
• The general principle underlying securities legislation is that of full, true, and plain disclosure of all pertinent facts by those offering securities for sale to the public.
• Securities legislation is designed to protect investors through the registration of securities dealers and advisors, the disclosure of facts necessary to make reasoned investment decisions, and the enforcement of laws and policies.
SUMMARY

CANADIAN SECURITIES COURSE • VOLUME 13•26
© CSI GLOBAL EDUCATION INC. (2010)
4. Identify unethical practices and conduct in securities trading.
• Unethical conduct is defi ned as any omission, conduct, and manner of doing business or negotiation that in the opinion of the disciplinary body is not in the public interest or in the interest of the exchange.
5. Describe the rules for public company disclosure and the statutory rights of investors.
• After distributing securities to the public, a reporting issuer must comply with the timely and continuous public disclosure of information. Disclosure can include issuing a press release or fi ling a material change report when signifi cant changes to the company’s operations occur.
• Continuous disclosure also requires reporting issuers to regularly fi le annual and interim fi nancial statements with provincial administrators.
• There are three statutory rights available to the purchaser of securities issued in Canada under prospectus requirements.
– The right of withdrawal gives the purchaser the right to withdraw from an agreement to purchase securities within two business days after the deemed receipt of the company’s prospectus.
– The right of rescission gives the purchaser the right to cancel the purchase of securities if the prospectus contains a misrepresentation. The purchaser has 180 days after the purchase to take advantage of this right.
– If it is deemed that a prospectus contains a misrepresentation, the issuer, the directors of the issuer, the seller of the security, the underwriter, and any other person who signs off on the prospectus may be liable for damages under the right of action for damages.
6. Explain how takeover bids and insider trading are regulated.
• A takeover is considered a change in the controlling interest of a company. It is an offer to purchase the shares of the company that will in total exceed 20% of the outstanding voting securities of the company. Takeover bids are subject to a number of disclosure requirements.
• The reporting of trading activity by insiders of a reporting issuer is based on the principle that shareholders and other interested persons should be regularly informed of the market activity of insiders.
Now that you’ve completed this
chapter and the on-line activities,
complete this post-test.

© CSI GLOBAL EDUCATION INC. (2010)
SECTION II
The Economy

© CSI GLOBAL EDUCATION INC. (2010) 4•1
Chapter 4
Economic Principles

© CSI GLOBAL EDUCATION INC. (2010)4•2
4
Economic Principles
CHAPTER OUTLINE
Foundations of Economics • Microeconomics and Macroeconomics• The Decision Makers• Demand and Supply
Economic Growth • Measuring Gross Domestic Product• Productivity and Determinants of Economic Growth
The Business Cycle• Phases of the Business Cycle• Using Economic Indicators• Identifying Recessions
The Canadian Labour Market• Labour Market Indicators• Types of Unemployment
Interest Rates• Determinants of Interest Rates• How Interest Rates Affect the Economy• Expectations and Interest Rates

© CSI GLOBAL EDUCATION INC. (2010) 4•3
Money and Infl ation• The Nature of Money• Inflation• Disinflation• Deflation
International Economics• The Balance of Payments• The Exchange Rate
Summary
LEARNING OBJECTIVES
By the end of this chapter, you should be able to:
1. Defi ne economics, identify the decision makers in an economy, and describe the process for achieving market equilibrium.
2. Defi ne gross domestic product (GDP), explain how GDP is measured, and list the factors that lead to growth in GDP.
3. Describe the phases of the business cycle, distinguish among the economic indicators used to analyze business conditions, and identify the determinants of long-term economic growth.
4. Compare and contrast the two key indicators of the labour market in Canada and the three main types of unemployment.
5. Describe the determinants of interest rates and discuss how interest rates affect the performance of the economy.
6. Defi ne infl ation, calculate the infl ation rate using the Consumer Price Index (CPI), and analyze the causes and impacts of infl ation, disinfl ation and defl ation on an economy.
7. Defi ne the accounts included in a country’s balance of payments, describe the determinants of the exchange rate, and explain the impact the balance of payments and the exchange rate have on the economy.

© CSI GLOBAL EDUCATION INC. (2010)4•4
ANALYZING ECONOMIC PERFORMANCE
Economic news and events are announced daily. There are monetary policy reports from the Bank of Canada, quarterly gross domestic product estimates, regular changes in the Canadian exchange rate relative to the U.S. dollar, and data on monthly unemployment and housing starts to consider. For an investor or advisor, being able to recognize the impact these events could have on markets and individual investments helps make wise investment decisions.
Economics is fundamentally about understanding the choices individuals make and how the sum of those choices affects our market economy. Whether it is the purchase of groceries, a home, or stocks and bonds, the interaction between consumer choices and the economy takes place in an organized market and at a price determined by demand and supply for goods and services by consumers, investors and governments.
An example of an organized market is the Toronto Stock Exchange. Investors come together to buy and sell securities anonymously. Millions of transactions are carried out each day, and this anonymous interaction creates a market and an equilibrium price for a variety of securities. The buyer and seller of a security clearly have different views about the security (generally, the buyer believes it will go up in value and the seller believes it will go down), and it is likely that some type of economic analysis went into the decision to buy or sell.
In this first chapter on economics, we start with some of the building blocks, such as economic growth, interest rates, the labour markets, the causes of inflation and the determinants of the exchange rate. These first principles are important because they are the basis of your understanding of how economics and the economy tie into the process of making an investment decision.
In the on-line Learning Guide for this module,
complete the Getting Started
activity.
© CSI GLOBAL EDUCATION INC. (2010) 4•5
KEY TERMS
Balance of payments
Business cycle
Capital account
Coincident indicators
Composite leading indicator
Consumer Price Index (CPI)
Cost-push infl ation
Current account
Cyclical unemployment
Defl ation
Demand
Demand-pull infl ation
Discouraged workers
Disinfl ation
Economic indicators
Equilibrium price
Exchange rate
Factors of production
Final good
Fixed exchange rate
Floating exchange rate
Frictional unemployment
Full employment
Gross Domestic Product
Interest rates
Labour force
Lagging indicators
Leading indicators
Macroeconomics
Market
Microeconomics
Monetary aggregates
Natural unemployment rate
Nominal GDP
Nominal interest rate
Non-Accelerating Infl ation Rate of Unemployment (NAIRU)
Output gap
Participation rate
Phillips curve
Potential GDP
Real GDP
Real interest rate
Sacrifi ce ratio
Soft landing
Structural unemployment
Supply
Terms of trade
Unemployment rate

CANADIAN SECURITIES COURSE • VOLUME 14•6
© CSI GLOBAL EDUCATION INC. (2010)
FOUNDATIONS OF ECONOMICS
Economics is fundamentally about understanding the choices individuals make and how the sum of those choices determines what happens in our market economy. A market economy describes all of the activities related to producing and consuming goods and services, and how the decisions made by individuals, firms and governments determine the proper allocation of resources.
Most of us would like to have more of what we have, or at least be able to buy or consume as much as we can. In reality, this is not possible because our spending habits are restrained by the amount of income we earn and by the fact that there is a limit to what an economy can produce during a given period. Because scarcity prevents us from having as much as we would like of certain goods, the performance of the economy hinges on the collective decisions made by millions of individuals. Ultimately, the interaction between these market participants determines what we pay for a good or service, or a stock or mutual fund, for example.
Microeconomics and MacroeconomicsEconomics is divided into two main topic areas: microeconomics and macroeconomics.
Microeconomics analyzes the market behaviour of individual consumers and firms, how prices are determined, and how prices determine the production, distribution, and use of goods and services. For example, consumers decide how much of various goods to purchase, workers decide what jobs to take, and firms decide how many workers to hire and how much output to produce.
Microeconomics looks to answer such questions as:
• How do minimum wage laws affect the supply of labour and company profi t margins?
• How would a tax on softwood lumber imports affect the growth prospects in the forestry industry?
• If a government placed a tax on the purchase of mutual funds, will consumers stop buying them?
Macroeconomics focuses on the performance of the economy as a whole. It looks at the broader picture and to the challenges facing society as a result of the limited amounts of natural resources, human effort and skills, and technology. Whereas microeconomics looks at how the individual is impacted by changes in prices or income levels, macroeconomics focuses on such important issues as unemployment, inflation, recessions, government spending and taxation, poverty and inequality, budget deficits and national debts.
Macroeconomics looks to answer such questions as:
• Why did total output shrink last quarter?
• Why have the number of jobs fallen in the last year?
• Will a decrease in interest rates stimulate economic growth?
• How can a nation improve its standard of living?
Macroeconomics is our focus for the remainder of this chapter.
FOUNDATIONS OF ECONOMICS
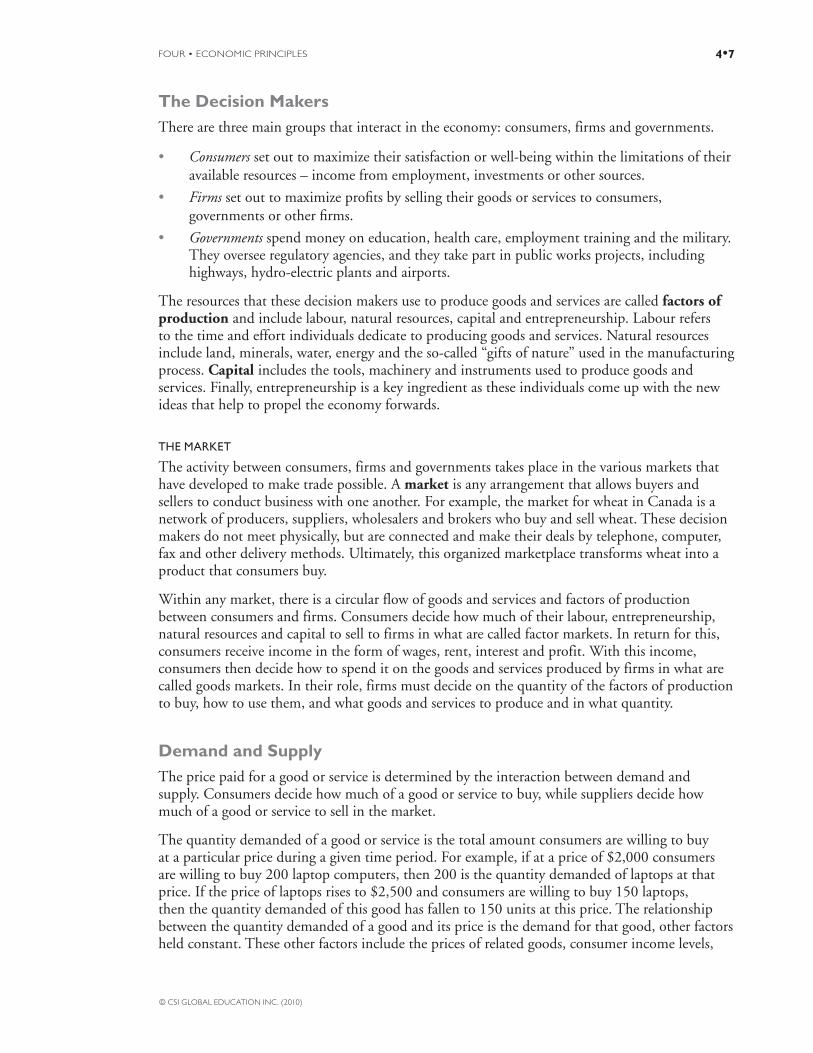
FOUR • ECONOMIC PRINCIPLES 4•7
© CSI GLOBAL EDUCATION INC. (2010)
The Decision MakersThere are three main groups that interact in the economy: consumers, firms and governments.
• Consumers set out to maximize their satisfaction or well-being within the limitations of their available resources – income from employment, investments or other sources.
• Firms set out to maximize profi ts by selling their goods or services to consumers, governments or other fi rms.
• Governments spend money on education, health care, employment training and the military.They oversee regulatory agencies, and they take part in public works projects, including highways, hydro-electric plants and airports.
The resources that these decision makers use to produce goods and services are called factors of production and include labour, natural resources, capital and entrepreneurship. Labour refers to the time and effort individuals dedicate to producing goods and services. Natural resources include land, minerals, water, energy and the so-called “gifts of nature” used in the manufacturing process. Capital includes the tools, machinery and instruments used to produce goods and services. Finally, entrepreneurship is a key ingredient as these individuals come up with the new ideas that help to propel the economy forwards.
THE MARKET
The activity between consumers, firms and governments takes place in the various markets that have developed to make trade possible. A market is any arrangement that allows buyers and sellers to conduct business with one another. For example, the market for wheat in Canada is a network of producers, suppliers, wholesalers and brokers who buy and sell wheat. These decision makers do not meet physically, but are connected and make their deals by telephone, computer, fax and other delivery methods. Ultimately, this organized marketplace transforms wheat into a product that consumers buy.
Within any market, there is a circular flow of goods and services and factors of production between consumers and firms. Consumers decide how much of their labour, entrepreneurship, natural resources and capital to sell to firms in what are called factor markets. In return for this, consumers receive income in the form of wages, rent, interest and profit. With this income, consumers then decide how to spend it on the goods and services produced by firms in what are called goods markets. In their role, firms must decide on the quantity of the factors of production to buy, how to use them, and what goods and services to produce and in what quantity.
Demand and SupplyThe price paid for a good or service is determined by the interaction between demand and supply. Consumers decide how much of a good or service to buy, while suppliers decide how much of a good or service to sell in the market.
The quantity demanded of a good or service is the total amount consumers are willing to buy at a particular price during a given time period. For example, if at a price of $2,000 consumers are willing to buy 200 laptop computers, then 200 is the quantity demanded of laptops at that price. If the price of laptops rises to $2,500 and consumers are willing to buy 150 laptops, then the quantity demanded of this good has fallen to 150 units at this price. The relationship between the quantity demanded of a good and its price is the demand for that good, other factors held constant. These other factors include the prices of related goods, consumer income levels,

CANADIAN SECURITIES COURSE • VOLUME 14•8
© CSI GLOBAL EDUCATION INC. (2010)
consumer tastes and preferences, and the population. According to the Law of Demand, the higher the price of a good or service the lower its demand, while the lower the price the higher its demand, other factors held constant.
The quantity supplied of a good or service is the total amount that producers are willing to supply at a particular price during a given time period. For example, if a company that manufactures laptops is willing to supply 100 laptops to the market at a price of $1,500, then 100 is the quantity supplied of laptops at that price. The relationship between the quantity supplied of a good and its price is the supply for that good, other factors held constant. These other factors include the prices of inputs used in the production process (labour, natural resources, capital, etc.), the prices of related goods, technology, and the number of suppliers in the market. According to the Law of Supply, the higher the price of a good, the greater the quantity supplied.
MARKET EQUILIBRIUM
Market equilibrium occurs when the buying decisions of consumers and the selling decisions of producers balance themselves out. In other words, equilibrium occurs when the price consumers are willing to pay for a good matches the price at which producers are willing to supply it. For example, we can find the market equilibrium of our fictitious laptop market using the information from Table 4.1.
TABLE 4.1 MARKET FOR LAPTOPS
Price
QuantityDemanded
(units)
QuantitySupplied(units)
$1,000 500 0
$1,500 350 100
$2,000 200 200
$2,500 150 300
$3,000 10 450

FOUR • ECONOMIC PRINCIPLES 4•9
© CSI GLOBAL EDUCATION INC. (2010)
Figure 4.1 shows the market for laptops.
FIGURE 4.1 SHOWS THE MARKET FOR LAPTOPS.
$1,000
$2,000
$3,000
2000 500
Supply
Equilibrium Point
Quantity
Demand
Pri
ce
Table 4.1 lists the quantities demanded and the quantities supplied at each price level. At each price above $2,000, there is an excess supply or surplus of laptops in the market because consumers are willing to buy less than producers are willing to sell at prices above $2,000. At each price below $2,000, there is an excess demand or shortage of laptops in the market as producers are unwilling to supply the market with adequate product at prices below $2,000. The one price that ensures a balance between the quantity demanded and the quantity supplied is $2,000. This intersection yields an equilibrium price of $2,000 and an equilibrium supply of 200 units.
Prices play an important role in regulating the quantity demanded and the quantity supplied of any good or service. When the price of a good is too high, consumers will spend less on it so that the quantity demanded falls below the quantity supplied. When there is too much supply in the market, this places downward pressure on the price of that particular good. Conversely, when the price of a good is too low, the demand for that good will rise so that the quantity demanded exceeds the quantity supplied. Heavy demand not matched by an increase in supply places upward pressure on the price of that good. As Figure 4.1 shows, there is only one price at which the quantity demanded equals the quantity supplied, and this is our market equilibrium.
ECONOMIC GROWTH
There are different ways of valuing a nation’s total production of goods and services – i.e., its output. Economic growth is an economy’s ability to produce greater levels of output over time and is expressed as the percentage change in a nation’s gross domestic product (GDP) over a given period. By measuring growth, we can better gauge the performance and overall health of the entire economy.
ECONOMIC GROWTH

CANADIAN SECURITIES COURSE • VOLUME 14•10
© CSI GLOBAL EDUCATION INC. (2010)
Measuring Gross Domestic ProductGross domestic product (GDP) is the market value of all final goods and services produced within a country in a given time period, usually a year or a quarter. GDP estimates in Canada are prepared on a quarterly and annual basis by Statistics Canada. The quarterly reports are used to keep track of the short-term activity within the market, while the annual reports are used to examine trends and changes in production and the standard of living.
Goods and services go through many stages of production before they end up in the hands of their final users. The calculation of GDP looks at the total amount of final goods produced over the period. A final good is a finished product, one that is purchased by the ultimate end user. For example, a Dell computer is a final good, but the Intel Pentium chip inside it is not since the Pentium chip was used to manufacture the computer. If the market value of all the Pentium chips were added together with the market value of all the Dell computers, GDP would be overstated. Only the market value of the Dell computer, a final good, is included in GDP.
THE EXPENDITURE APPROACH AND THE INCOME APPROACH
There are two ways of measuring GDP: the expenditure approach, which looks at total spending on final goods and services produced in the economy, or by the income approach, which looks at the total income earned producing those goods and services.
The expenditure approach measures GDP as the sum of four components: personal consumption (C), investment (I), government spending on goods and services (G), and net exports of goods and services (exports less imports, or X – M).
• Personal consumption measures the spending by households on goods and services produced in Canada and the rest of the world. It is the largest component of GDP and represented approximately 57% of the total in 2009.
• Investment measures spending by businesses on capital goods, such as plant and equipment, or by consumers on the purchases of new homes. It also measures the change in business inventories during the year.
• Government spending on goods and services records the purchases by all levels of governments on such items as national defence, highway construction and public health, among others.
• Net exports of goods and services records the market value of exports, what Canadian fi rms sell to the rest of the world, minus the market value of imports, what Canadians buy from the rest of the world.
The expenditure approach measures GDP as:
GDP = C + I + G + (X – M)
The income approach measures GDP by summing the incomes that firms pay households for the factors of production they hire – wages for labour, rent for land, interest for capital goods, and profits for entrepreneurs. Since spending on goods and services is a source of income for someone else, the income approach looks at how the output produced in the economy during a period generates income.

FOUR • ECONOMIC PRINCIPLES 4•11
© CSI GLOBAL EDUCATION INC. (2010)
These two measures of GDP show that all production results in income earned by workers, firms or investors, and all production is eventually consumed (or stored as inventory). Thus, GDP is obtained by adding up either all income earned in the economy, or all spending in the economy. In theory, GDP measured by the income approach and by the expenditure approach should be the same.
REAL AND NOMINAL GDP
Producing more goods and services represents an improvement in a nation’s standard of living. However, if the increase in GDP was simply the result of higher prices, then the cost of buying those goods and services has increased, which reflects an increase in our cost of living but not an improvement in living standards.
Nominal GDP is the dollar value of all goods and services produced in a given year at prices that prevailed in that same year, and is typically the amount reported in the financial press. Changes in nominal GDP from year to year reflect both changes in the prices of goods and services and changes in the amount of output produced in a year.
Table 4.2 illustrates the relationship between the income and expenditure approaches and distinguishes between nominal GDP and the growth or percentage change in GDP on an annual basis. The table shows that nominal GDP was $1.599 trillion in 2008 and dropped to $1.527 trillion in 2009. Since GDP was higher in 2008 than it was in 2009, one or both of the following things happened during the year:
1. The economy contracted and produced less goods and services in 2009 than in 2008.
2. Prices dropped and consumers had to pay less for goods and services in 2009 compared with 2008.
Statistics Canada calculates a measure of GDP that isolates the change in production from changes in prices that prevailed during the year. Real GDP, or constant dollar GDP, is the dollar value of all goods and services produced in a given year valued at prices that prevailed in some base year. Holding prices constant to this base year establishes a better measure of the change in GDP that is the result of changes in the amount of output produced during the year. A doubling of GDP during the year tells us nothing about what is happening to the rate of real production unless we also know how prices or inflation also changed over the year. Therefore, differences between real and nominal GDP are entirely the result of changes in prices. Real GDP tells us what would have happened to spending on goods and services if quantities had changed but prices had not changed.
For example, Table 4.2 shows that nominal GDP declined by 4.52% between 2008 and 2009, while the decline in real GDP was somewhat lower at 2.64%. The difference between the nominal and real GDP of 1.89% is due to price changes. Real GDP is therefore the amount of output adjusted for the effects of inflation (or deflation) because it eliminates the impact of changes in the prices of goods and services on the amount of output produced during the year.

CANADIAN SECURITIES COURSE • VOLUME 14•12
© CSI GLOBAL EDUCATION INC. (2010)
TABLE 4.2 GROSS DOMESTIC PRODUCT AT MARKET PRICES
$ Millions
2009 2008 % Change
Income-Based, Nominal GDP
Labour income 819,066 818,613
Corporation profi ts before taxes 146,897 216,970
Government enterprise profi ts 12,975 16,355
Interest & investment income 63,947 83,998
Accrued net farm income 880 3,228
Unincorporated business income 98,999 91,331
Inventory valuation adjustment 2,541 -6,214
Indirect taxes less subsidies 163,634 165,934
Capital consumption allowances 218,785 209,383
Statistical discrepancy -466 10
Gross Domestic Product 1,527,258 1,599,608 -4.52%
Expenditure-Based, Nominal GDP
Personal expenditures 898,728 890,351
Government expenditures 393,017 365,313
Investment expenditures 261,217 319,017
Exports of goods and services 438,553 563,948
Deduct: Imports of goods and services 464,722 539,012
Statistical discrepancy 465 -9
Gross Domestic Product 1,527,258 1,599,608 -4.52%
Expenditure-Based, Real GDP*
Personal expenditures 812,204 810,723
Government expenditures 272,170 264,142
Investment expenditures 282,479 338,310
Exports of goods and services 418,176 486,255
Deduct: Imports of goods and services 499,782 576,905
Statistical discrepancy 1,184 -1,165
Gross Domestic Product 1,286,431 1,321,360 -2.64%
Source: Statistics Canada, National Accounts tables.
* Real GDP is measured by Statistics Canada using 2002 prices.

FOUR • ECONOMIC PRINCIPLES 4•13
© CSI GLOBAL EDUCATION INC. (2010)
Productivity and Determinants of Economic GrowthSince the industrial revolution, the GDP of industrialized economies has tended to grow over time.
For example, Canada’s real GDP is six times higher than it was 50 years ago.
Growth in GDP results from a variety of factors; among the more important are:
• Increases in population over time. Even if the output of every worker remained constant, GDP would rise due to the growing work force.
• Increases in the capital stock. As more workers are provided with additional equipment and as their skills have been improved with better training and education, individual productivity rises.
• Improvements in technology. Technological innovation helps fi rms and workers to recombine existing resources of land, capital and labour in new and increasingly productive ways. Generally, this has involved the substitution of capital (i.e., improved machinery) for labour in the production of goods and services. A recent example is the continuing replacement of bank tellers by ATM machines.
Canadian labour productivity, or output per hour worked, has more than doubled since 1961. Gains in individual prosperity are ultimately related to increases in productivity. If productivity growth exceeds increases in the unit costs of production, firms are able to lower the prices of the goods and services they sell.
GROWTH IN THE INDUSTRIALIZED WORLD
Table 4.3 reports real GDP growth rates for several countries. The table shows that real GDP growth was fairly uneven for these countries over the last 20 years. Of the industrialized and newly industrialized countries, China reported the strongest growth over the entire period.
TABLE 4.3 GDP GROWTH PERFORMANCE, SELECTED COUNTRIES, 1990 – 2009
Average Annual Percent Change
Real GDP Growth1990-99 2000-2009
Canada 2.4 2.1
France 1.9 1.5
Germany 2.3 0.8
Italy 1.4 0.5
Japan 1.5 0.7
United Kingdom 2.1 1.7
United States 3.1 1.9
China 9.9 10.0
India 5.6 7.0
Source: International Monetary Fund, World Economic Outlook, July 2010.
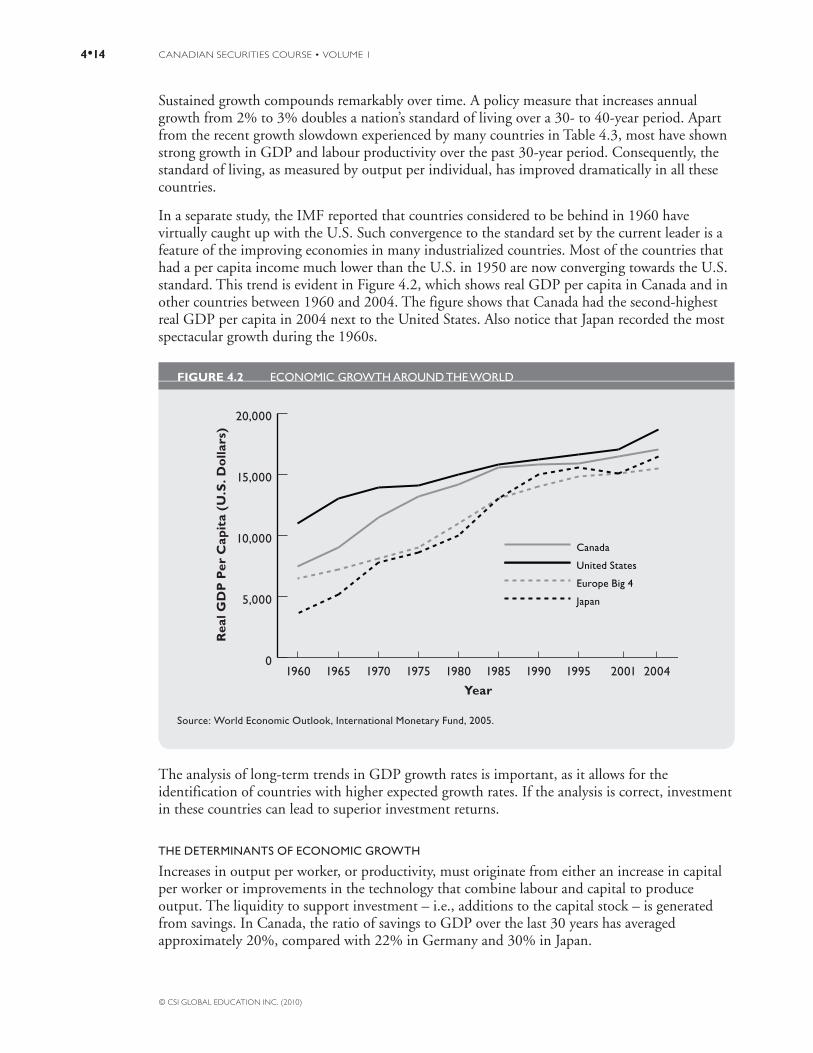
CANADIAN SECURITIES COURSE • VOLUME 14•14
© CSI GLOBAL EDUCATION INC. (2010)
Sustained growth compounds remarkably over time. A policy measure that increases annual growth from 2% to 3% doubles a nation’s standard of living over a 30- to 40-year period. Apart from the recent growth slowdown experienced by many countries in Table 4.3, most have shown strong growth in GDP and labour productivity over the past 30-year period. Consequently, the standard of living, as measured by output per individual, has improved dramatically in all these countries.
In a separate study, the IMF reported that countries considered to be behind in 1960 have virtually caught up with the U.S. Such convergence to the standard set by the current leader is a feature of the improving economies in many industrialized countries. Most of the countries that had a per capita income much lower than the U.S. in 1950 are now converging towards the U.S. standard. This trend is evident in Figure 4.2, which shows real GDP per capita in Canada and in other countries between 1960 and 2004. The figure shows that Canada had the second-highest real GDP per capita in 2004 next to the United States. Also notice that Japan recorded the most spectacular growth during the 1960s.
FIGURE 4.2 ECONOMIC GROWTH AROUND THE WORLD
0
5,000
10,000
15,000
20,000
2004200119951990198519801975197019651960
Canada
United States
Europe Big 4
Japan
Year
Rea
l GD
P P
er C
apit
a (U
.S. D
olla
rs)
Source: World Economic Outlook, International Monetary Fund, 2005.
The analysis of long-term trends in GDP growth rates is important, as it allows for the identification of countries with higher expected growth rates. If the analysis is correct, investment in these countries can lead to superior investment returns.
THE DETERMINANTS OF ECONOMIC GROWTH
Increases in output per worker, or productivity, must originate from either an increase in capital per worker or improvements in the technology that combine labour and capital to produce output. The liquidity to support investment – i.e., additions to the capital stock – is generated from savings. In Canada, the ratio of savings to GDP over the last 30 years has averaged approximately 20%, compared with 22% in Germany and 30% in Japan.

FOUR • ECONOMIC PRINCIPLES 4•15
© CSI GLOBAL EDUCATION INC. (2010)
Current research on the determinants of economic growth (which are reflected in higher investment values) suggests the following conclusions:
• Capital accumulation alone cannot sustain growth. Eventually, increased capital leads to smaller and smaller gains in output. So a higher savings rate is not responsible for a sustained higher growth rate over long periods of time. Nonetheless, a higher savings rate can ultimately support a higher level of output per individual.
• Sustained growth requires technological progress which is associated with a complex pattern of basic research, applied research and product development situated in a supportive entrepreneurial context.
Growth accounting is a technique that was developed to differentiate between real GDP growth per worker due to capital, versus real GDP growth per worker due to technological progress. According to this approach, the period of high growth in the industrialized economies from 1950 to 1973 was largely due to rapid technological growth. Between 1973 and 1996, a slowdown in productivity growth occurred as technological progress and the rate of capital growth slowed over the period. Although productivity growth improved a great deal during the period 1996 to 2009, largely due to gains in technology, the rate of growth was slower than what was experienced in the 1960s and 1970s.
THE BUSINESS CYCLE
Real GDP in Canada has grown on average by about 3.35% since the 1960s. Figure 4.3 shows that this growth has not been uniform throughout the period. In fact, growth was the most rapid in the 1960s and slowest during the 1980s. Economic fluctuations present a recurring problem for policy makers as downturns in economic growth are directly related to rising unemployment. Such fluctuations in output and employment are called the business cycle, and directly affect the value of investments over time.
THE BUSINESS CYCLE
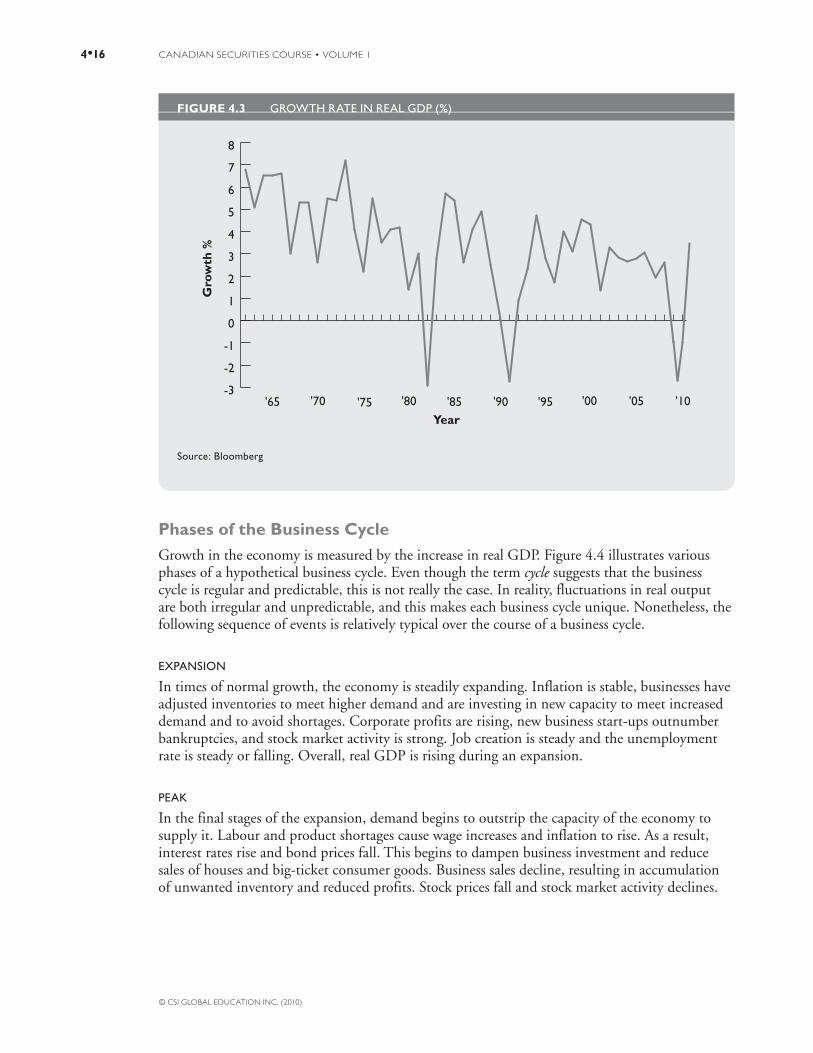
CANADIAN SECURITIES COURSE • VOLUME 14•16
© CSI GLOBAL EDUCATION INC. (2010)
FIGURE 4.3 GROWTH RATE IN REAL GDP (%)
-3
-2
-1
0
1
2
3
4
5
6
7
8
'05 '00 '10'95 '90 '85 '80 '75 '70 '65
Gro
wth
%
Year
Source: Bloomberg
Phases of the Business CycleGrowth in the economy is measured by the increase in real GDP. Figure 4.4 illustrates various phases of a hypothetical business cycle. Even though the term cycle suggests that the business cycle is regular and predictable, this is not really the case. In reality, fluctuations in real output are both irregular and unpredictable, and this makes each business cycle unique. Nonetheless, the following sequence of events is relatively typical over the course of a business cycle.
EXPANSION
In times of normal growth, the economy is steadily expanding. Inflation is stable, businesses have adjusted inventories to meet higher demand and are investing in new capacity to meet increased demand and to avoid shortages. Corporate profits are rising, new business start-ups outnumber bankruptcies, and stock market activity is strong. Job creation is steady and the unemployment rate is steady or falling. Overall, real GDP is rising during an expansion.
PEAK
In the final stages of the expansion, demand begins to outstrip the capacity of the economy to supply it. Labour and product shortages cause wage increases and inflation to rise. As a result, interest rates rise and bond prices fall. This begins to dampen business investment and reduce sales of houses and big-ticket consumer goods. Business sales decline, resulting in accumulation of unwanted inventory and reduced profits. Stock prices fall and stock market activity declines.

FOUR • ECONOMIC PRINCIPLES 4•17
© CSI GLOBAL EDUCATION INC. (2010)
CONTRACTION
The economy contracts, or is in recession, when the level of economic activity actually begins to decline – i.e., real GDP decreases. Firms faced with unwanted inventories and declining profits reduce production, postpone investment, curtail hiring and may lay off employees. Business failures outnumber start-ups. Falling employment erodes household income and confidence. Consumers react by spending less and saving more, which further cuts into sales, fuelling the recession.
As business conditions worsen, economic activity slows in most sectors. If other countries are also experiencing a recession – especially the United States – the magnitude and duration of the recession in Canada is significantly increased by the reduction in the sale of goods to those outside Canada; in short, by the reduction in our exports. In turn, the rate of default and the probability of default by corporate borrowers increase, and are reflected in a higher default premium on corporate borrowings.
TROUGH
As the recession continues, falling demand and excess capacity curtail the ability of firms to raise prices and of workers to demand higher salaries, and inflation falls. Interest rates follow, triggering a bond rally. The trough is reached when consumers who postponed purchases during the recession are spurred by lower interest rates to begin satisfying some of their pent-up demand. Stock prices rally.
RECOVERY
During the recovery, GDP returns to its previous peak. The recovery typically begins with renewed buying of interest rate–sensitive items like houses and cars. Firms that reduced inventories during the recession must increase production to meet the new demand. They are typically still too cautious to hire back significant numbers of workers, but the period of widespread layoffs is over. Capacity utilization, or the degree to which businesses are making use of their production power, remains low, so firms are not yet ready to make significant new investment. Since unemployment remains high, wage pressures are restrained and inflation may decline further. When the economy rises above its previous peak, at point A in Figure 4.4, another expansion has begun.
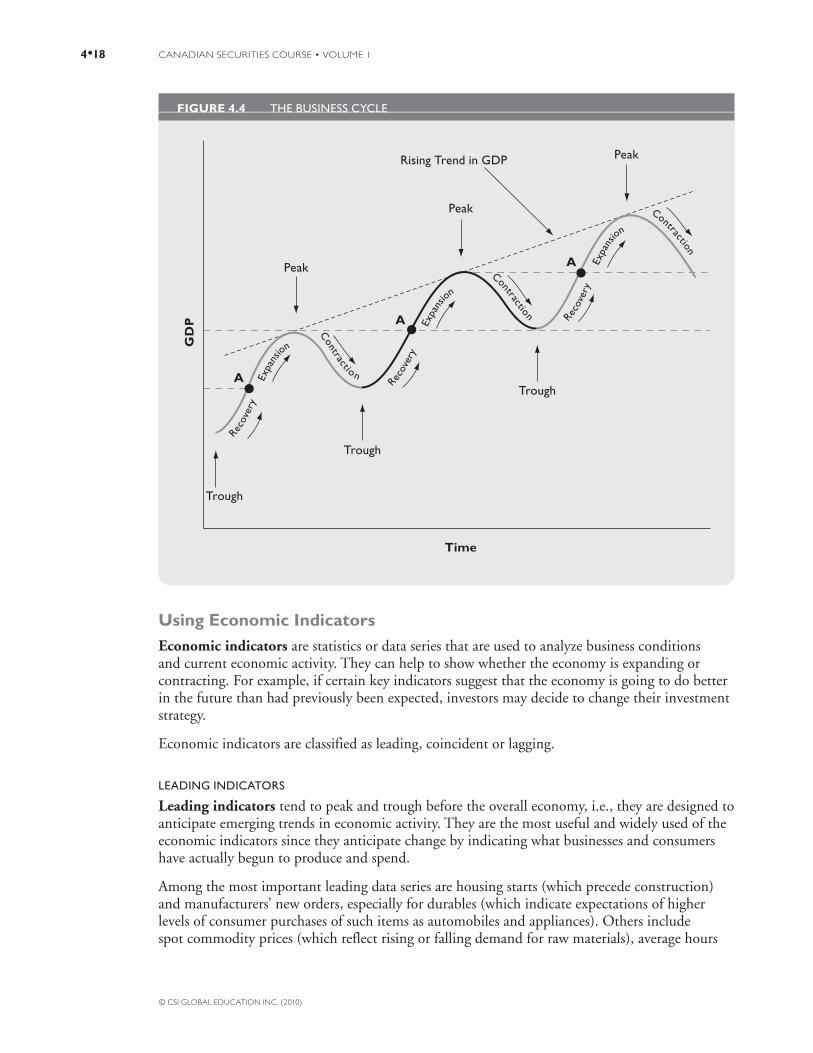
CANADIAN SECURITIES COURSE • VOLUME 14•18
© CSI GLOBAL EDUCATION INC. (2010)
FIGURE 4.4 THE BUSINESS CYCLE
Recov
ery
Expa
nsion
Recov
ery
Exp
ansio
n
Recov
ery
Expa
nsion
Contractio n
Contraction
Contraction
GD
P
Time
Trough
Trough
Trough
Peak
Peak
PeakRising Trend in GDP
A
A
A
Using Economic IndicatorsEconomic indicators are statistics or data series that are used to analyze business conditions and current economic activity. They can help to show whether the economy is expanding or contracting. For example, if certain key indicators suggest that the economy is going to do better in the future than had previously been expected, investors may decide to change their investment strategy.
Economic indicators are classified as leading, coincident or lagging.
LEADING INDICATORS
Leading indicators tend to peak and trough before the overall economy, i.e., they are designed to anticipate emerging trends in economic activity. They are the most useful and widely used of the economic indicators since they anticipate change by indicating what businesses and consumers have actually begun to produce and spend.
Among the most important leading data series are housing starts (which precede construction) and manufacturers’ new orders, especially for durables (which indicate expectations of higher levels of consumer purchases of such items as automobiles and appliances). Others include spot commodity prices (which reflect rising or falling demand for raw materials), average hours

FOUR • ECONOMIC PRINCIPLES 4•19
© CSI GLOBAL EDUCATION INC. (2010)
worked per week (which rise or fall depending on the level of output and therefore anticipate changes in employment), stock prices (which suggest changing levels of profits) and the money supply (which indicates available liquidity and thus has an impact on interest rates).
Statistics Canada combines 10 leading indicators into a single index of leading indicators, called the Composite Leading Indicator. Its components are listed in Table 4.4. In addition to Statistics Canada, most financial institutions prepare studies based on similar data to identify changing business cycle trends.
TABLE 4.4 COMPONENTS OF STATISTICS CANADA’S COMPOSITE LEADING INDICATOR
1. S&P/TSX Composite Index
2. Real Money Supply (M1)
3. United States Composite Leading Index (which attempts to anticipate American demand for Canadian exports)
4. New Orders for Durable Goods
5. Shipments to Inventory Ratio – Finished Goods
6. Average Work Week
7. Employment in Business and Services
8. Furniture and Appliance Sales
9. Sales of Other Retail Durable Goods
10. Housing Index (includes housing starts and house sales)
To predict stock market price movements, investment strategists use leading indicators that precede changes in the business cycle by a longer time period than the stock market does.
There are problems implicit in relying on composite leading indicators to predict changes in the business cycle. On occasion, a trend in published statistics is observable only after the economy has already moved into the stage of cycle the trend predicts. Sometimes a false signal is given. In any case, the magnitude of the anticipated new trend is not signalled (i.e., it may be a pause, an economic slowdown or a recession). However, if all indices are signaling the same trend for a similar period of time, the probability of accuracy is higher.
COINCIDENT INDICATORS
Coincident indicators are those which change at approximately the same time and in the same direction as the whole economy, thereby providing information about the current state of the economy.
Personal income is a good example because if it is rising, economic growth will typically follow. Other coincident indicators include GDP, industrial production and retail sales. A coincident index may be used to identify, after the fact, the dates of peaks and troughs in the business cycle.

CANADIAN SECURITIES COURSE • VOLUME 14•20
© CSI GLOBAL EDUCATION INC. (2010)
LAGGING INDICATORS
Lagging indicators are those which change after the economy as a whole changes. These indicators are important because they can confirm that a business cycle pattern is occurring.
Unemployment is one of the more popular lagging indicators because a rising unemployment rate is an indication that the economy is doing poorly or that companies are anticipating a downturn in the economy. Other examples of lagging indicators include private sector plant and equipment spending, business loans and interest on such borrowing, labour costs, the level of inventories and the inflation rate.
Identifying RecessionsA popular definition of a recession is at least two consecutive quarters of declining growth in real GDP. However, Statistics Canada and the U.S. National Bureau of Economic Research describe a recession differently.
Statistics Canada judges a recession by the depth, duration and diffusion of the decline in business activity. The decline must be of substantial depth, since marginal declines in output may be merely statistical error. The duration must be more than a couple of months, since bad weather alone can cause a temporary decline in output. The decline must be a feature of the whole economy. While a strike in a major industry can cause GDP to decline, that does not constitute a recession. The behaviour of employment and per capita income may also be taken into account.
The recession that began in April 1990 (see Table 4.5) posed particular dating problems. After four quarters of unambiguous decline and one quarter of unambiguous growth, the economy neither grew nor shrank meaningfully for six quarters, although employment continued to fall. We have dated the end of that recession to the second quarter of 1992, when employment reached its trough. The recession that began in April 2001 was viewed by many as a mini-recession as the economy never actually produced two successive quarters of declining growth. The latest recession in Canada began in July 2008.
In recent years, the term soft landing has been used to describe a business cycle phase when economic growth slows sharply but does not turn negative, while inflation falls or remains low. Soft landings are considered the “Holy Grail” of policy makers, who want sustained growth without the cost of recurring recessions.

FOUR • ECONOMIC PRINCIPLES 4•21
© CSI GLOBAL EDUCATION INC. (2010)
TABLE 4.5 POST-WAR PERIODS OF ECONOMIC SLOWDOWN AND RECESSION IN CANADA
Dates Duration
Highest Unemployment
Rate (%)
Peak-to-TroughDecline inGDP (%)
* June ’51 – Dec. ’51 7 months 3.6 0.7
* June ’53 – June ’54 13 months 5.2 3.1
* Feb. ’57 – Jan. ’58 12 months 6.5 0.5
* Apr. ’60 – Jan. ’61 10 months 7.7 1.7
Feb. ’70 – Sept. ’70 8 months 6.7 0.5
* June ’74 – Mar. ’75 10 months 7.2 0.6
* Nov. ’79 – June ’80 8 months 7.8 1.9
* July ’81 – Dec. ’82 18 months 12.7 6.5
Apr. ’90 – Mar. ’92 23 months 11.5 3.6
** Apr. ’01 – Sept. ’01 5 months 7.9 4.3
July ’08 – July ’09 12 months 8.6 3.3
* Recession as determined by Statistics Canada.
** Technically a growth slowdown or downturn and not a recession.
Some economists feel that the February–September, 1970 period should be regarded as a recession, breaking the expansion period from January, 1961 to June, 1974 into two segments.
Source: Adapted from Statistics Canada, www.statscan.gc.ca
THE CANADIAN LABOUR MARKET
For most Canadians, the performance of the economy affects them most personally in the labour market. When the economy is strong, so is the demand for labour. Employment rises, the unemployment rate falls, and workers win bigger wage raises and/or non-wage benefits. Conversely, when the economy weakens, so does the demand for labour, and wage demands are restrained.
Statistics Canada divides the population into two groups: the working-age population (those individuals aged 15 years and older) and those too young to work. Statistics Canada also defines the labour force as the sum of the working-age population who are either employed or unemployed.
Table 4.6 shows the Canadian labour market for 2010. Of the 27.6 million Canadians included as part of the working-age population, 18.6 million were part of the labour force. Within the labour force, 17.1 million were employed in either full-time or part-time work and 1.5 million were unemployed and did not have jobs. The difference between the working age population and the labour force likely consisted of full-time students and those retired from working.
THE CANADIAN LABOUR MARKET
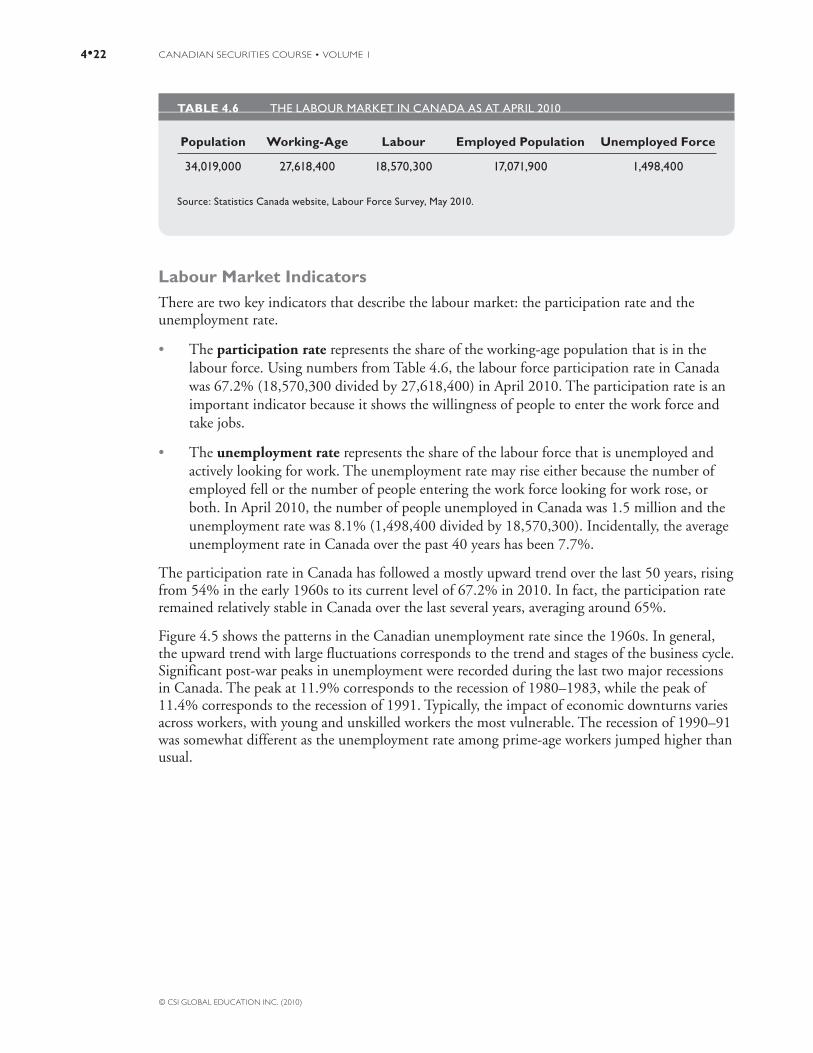
CANADIAN SECURITIES COURSE • VOLUME 14•22
© CSI GLOBAL EDUCATION INC. (2010)
TABLE 4.6 THE LABOUR MARKET IN CANADA AS AT APRIL 2010
Population Working-Age Labour Employed Population Unemployed Force
34,019,000 27,618,400 18,570,300 17,071,900 1,498,400
Source: Statistics Canada website, Labour Force Survey, May 2010.
Labour Market IndicatorsThere are two key indicators that describe the labour market: the participation rate and the unemployment rate.
• The participation rate represents the share of the working-age population that is in the labour force. Using numbers from Table 4.6, the labour force participation rate in Canada was 67.2% (18,570,300 divided by 27,618,400) in April 2010. The participation rate is an important indicator because it shows the willingness of people to enter the work force and take jobs.
• The unemployment rate represents the share of the labour force that is unemployed and actively looking for work. The unemployment rate may rise either because the number of employed fell or the number of people entering the work force looking for work rose, or both. In April 2010, the number of people unemployed in Canada was 1.5 million and the unemployment rate was 8.1% (1,498,400 divided by 18,570,300). Incidentally, the average unemployment rate in Canada over the past 40 years has been 7.7%.
The participation rate in Canada has followed a mostly upward trend over the last 50 years, rising from 54% in the early 1960s to its current level of 67.2% in 2010. In fact, the participation rate remained relatively stable in Canada over the last several years, averaging around 65%.
Figure 4.5 shows the patterns in the Canadian unemployment rate since the 1960s. In general, the upward trend with large fluctuations corresponds to the trend and stages of the business cycle. Significant post-war peaks in unemployment were recorded during the last two major recessions in Canada. The peak at 11.9% corresponds to the recession of 1980–1983, while the peak of 11.4% corresponds to the recession of 1991. Typically, the impact of economic downturns varies across workers, with young and unskilled workers the most vulnerable. The recession of 1990–91 was somewhat different as the unemployment rate among prime-age workers jumped higher than usual.

FOUR • ECONOMIC PRINCIPLES 4•23
© CSI GLOBAL EDUCATION INC. (2010)
FIGURE 4.5 UNEMPLOYMENT RATE IN CANADA (%) 1976 - 2010
Un
emp
loym
ent
Rat
e (%
)
Year
2
4
6
8
10
12
'10'05'00'95'90'85'80'75
Source: Bloomberg
Some people are unemployed for a short time, while others are unemployed for longer periods. The average duration of unemployment varies over the business cycle and is typically shorter during an expansion and longer during a recession. At times, job prospects are so poor that some of the unemployed simply drop out of the labour force and become discouraged workers. Discouraged workers are those individuals that are available and willing to work but cannot find jobs and have not made specific efforts to find a job within the previous month, and so are not included as part of the labour force. The disappearance of these “discouraged unemployed workers” can produce an artificially low unemployment rate.
Types of UnemploymentThere are three general types of unemployment: cyclical, frictional and structural.
Cyclical unemployment is tied directly to fluctuations in the business cycle. It rises when the economy weakens and firms lay off workers in response to lower sales. It drops when the economy strengthens again.
Frictional unemployment is the result of normal labour turnover, from people entering and leaving the work force and from the ongoing creation and destruction of jobs. Even in the best of economic times, people are looking for work because they have finished school, quit, been laid off or been fired from their most recent job. This is a normal part of a healthy economy.
Structural unemployment occurs when workers are unable to find work or fill available jobs because they lack the necessary skills, do not live where jobs are available, or decide not to work at the wage rate offered by the market. This type of unemployment is closely tied to changes in technology, international competition and government policy. Structural unemployment typically
CANADIAN SECURITIES COURSE • VOLUME 14•24
© CSI GLOBAL EDUCATION INC. (2010)
lasts longer than frictional unemployment because workers must retrain or possibly relocate to find a job.
The distinction between frictional and structural unemployment is sometimes difficult to determine. There are always job openings and potential workers to fill those jobs. With frictional unemployment, unemployed workers have the required skill levels to fill a job vacancy. With structural unemployment, however, unemployed workers looking for work do not possess the needed skills to find a job.
A pressing problem in Canada’s economy is the apparent rising trend in unemployment, both frictional and structural, since the mid-1960s as shown in Figure 4.5. Some explanations advanced for this increase:
• Labour market regulations may discourage hiring. Minimum wages may be set too high, thereby reducing the incentive for businesses to hire low-skilled workers and offer on-the-job training.
• Labour market rigidities, such as the strength of unions to maintain wages in the face of economic downturns, may prompt fi rms to reduce costs by laying off workers. Payroll taxes and other indirect labour costs also make it more expensive to create jobs.
• Welfare and employment insurance benefi ts can make it more attractive for workers to remain unemployed or at least encourage longer periods of searching for work instead of taking low paying jobs. Although the generosity of these programs in Canada has decreased signifi cantly over the past 20 years, they have contributed to the rising trend in the unemployment rate.
• The severity of recent recessions means workers spend more time unemployed. As a result, their skills may become rusty or even obsolete, especially in a context where technological change is rapidly altering what employers demand of workers. These workers may become unemployable even in strong economic times due to their lack of marketable skills.
The existence of frictional and structural factors in the economy prevents unemployment from falling to zero. This means that even in times of healthy economic growth, there is a level below which unemployment will not drop without causing other negative economic effects. This minimal level of unemployment is called the natural unemployment rate, the full employment unemployment rate, or the non-accelerating inflation rate of unemployment (NAIRU). At this level of unemployment, the economy is thought to be operating at close to its full potential or capacity such that all resources, including labour, are fully employed. Further employment growth is achieved either through increased wages to attract people into the labour force which fuels inflation, or by more fundamental changes to the labour market that removes impediments to job creation.
The Bank of Canada and the Department of Finance estimate Canada’s natural unemployment rate at somewhere between 6.5% and 7%. The Bank of Canada pays close attention to the actual unemployment rate and the natural unemployment rate as the gap between the two has an important influence on wage inflation.
• When the actual unemployment rate is above the natural rate, an excess supply of workers in the market weakens labour bargaining power, which discourages wage gains and helps to keep infl ation in check.
FOUR • ECONOMIC PRINCIPLES 4•25
© CSI GLOBAL EDUCATION INC. (2010)
• When the actual unemployment rate is below the natural rate, a shortage of workers contributes to an increase in wage gains and higher infl ation.
Thus, the natural unemployment rate is often viewed as the level of unemployment that is consistent with stable inflation, which is why it is an important number with respect to monetary and fiscal policy decisions.
Over time, workers’ wages are determined by their productivity. If the value of what each worker in a firm produces rises by 5% in a year, each worker’s wage can also rise 5% without reducing profits. Occasionally, when unemployment is low, wage increases may outstrip productivity growth. Firms try to recover the increased cost by raising prices, which may contribute to a wage-price spiral. Thus, wage settlements by both unionized and non-unionized workers are considered an important indicator of inflation, firm profitability and international competitiveness.
INTEREST RATES
Interest rates are an important link between current and future economic activity. For consumers, interest rates represent the gain from deferring consumption from today to tomorrow via saving. For businesses, interest rates represent one component of the cost of capital – i.e., the cost of borrowing money. Thus, the rate of growth of the capital stock, which determines future output, is related to the current level of interest rates.
Interest rates are one of the most important financial variables affecting securities markets. Since they are essentially the price of credit, changes in interest rates reflect, and affect, the demand and supply for credit and debt, and this has direct implications for the bond and money markets. Changes in interest rates made by the Bank of Canada also signal changes in the direction of monetary policy, and this has broader implications for the entire economy.
Determinants of Interest RatesA broad range of factors influences interest rates:
• Demand and supply of capital: A large government defi cit or a boom in business investment raises the demand for capital and forces up the price of credit (interest rates), unless there is an equivalent increase in the supply of capital. In turn, the higher interest rate may encourage people to save more. An increase in the savings of government, companies or households may reduce their demand for borrowing. This, in turn, may reduce interest rates.
• Default risk: The greater the risk that borrowers may default, the higher the interest rate demanded by lenders. If the central government is at risk of defaulting on its debt, interest rates rise for everybody. This additional interest rate is referred to as a default premium.
• Central bank operations: The Bank of Canada exercises its infl uence on the economy by raising and lowering short-term interest rates. However, it has much less impact on longer-term rates, especially bond yields. Its infl uence on bond yields results more from the credibility of its longterm commitment to low infl ation rather than any direct infl uence over long-term bond yields.
INTEREST RATES
Complete the on-line activity associated with
this section.

CANADIAN SECURITIES COURSE • VOLUME 14•26
© CSI GLOBAL EDUCATION INC. (2010)
• Foreign interest rates and the exchange rate: Since Canada has an open economy and investors are free to move their money between Canada and other countries, foreign interest rates and fi nancial conditions infl uence Canadian interest rates.
Example: A rise in interest rates in the U.S. increases investors’ returns on money invested there. Investors holding Canadian dollars and who would like to invest in the U.S. will need to sell their Canadian dollars to purchase U.S. dollar-denominated securities. This increases the supply of Canadian dollars on the foreign exchange market and places downward pressure on the value of the Canadian dollar. If the Bank of Canada would like to slow or reduce the fall in the value of the Canadian dollar, they can intervene and raise short-term interest rates, even if underlying conditions in Canada are unchanged. This will encourage investors to continue holding Canadian investments rather than switch to U.S. dollar-denominated securities.
• Central bank credibility: One of the main responsibilities of a central bank is to keep infl ation low and stable. The more credible and long-established a commitment to low infl ation has been, the lower interest rates will be to compensate for the risk of rising infl ation.
• Infl ation: The higher the expected infl ation rate, the higher the interest rate that must be charged by lenders to compensate for the erosion of the purchasing power of money over the duration of the loan.
How Interest Rates Affect the EconomyHigher interest rates affect the economy in the following ways:
• They may raise the cost of capital for business investments. An investment should earn a greater return than the cost of the funds used to make the investment. Higher interest rates reduce the possibility of profi table investments. In turn, this reduces business investment.
• By increasing the cost of borrowing, higher interest rates discourage consumers from spending, especially to buy houses and major durable goods like cars and furniture on credit. This encourages consumers to save more.
• By increasing the portion of household income needed to service debt, such as mortgage payments, they reduce the income available to be spent on other items. This effect may be offset somewhat by the higher interest income earned by savers.
Thus, higher interest rates have a negative effect on growth prospects. The effect of lower interest rates is the opposite in each case and can provide a positive environment for economic growth.
Expectations and Interest RatesInvestment decisions are forward-looking. Any decision to purchase a security is based on an expectation about the future return from the security. Increased optimism in the market can generate a rise in stock prices. Consumer pessimism can stall economic growth, and decrease share prices. Moreover, government economic policies may work only through their impact on people’s expectations. For example, the Bank of Canada makes considerable effort to maintain the credibility of its commitment to low inflation.
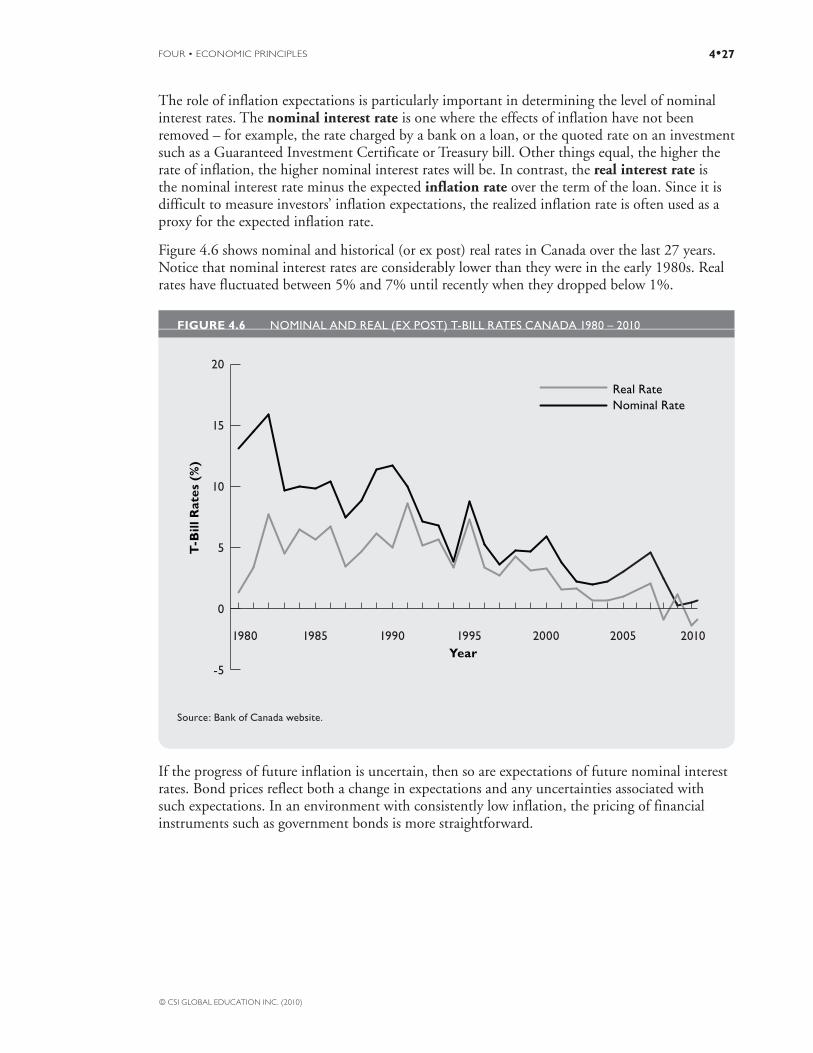
FOUR • ECONOMIC PRINCIPLES 4•27
© CSI GLOBAL EDUCATION INC. (2010)
The role of inflation expectations is particularly important in determining the level of nominal interest rates. The nominal interest rate is one where the effects of inflation have not been removed – for example, the rate charged by a bank on a loan, or the quoted rate on an investment such as a Guaranteed Investment Certificate or Treasury bill. Other things equal, the higher the rate of inflation, the higher nominal interest rates will be. In contrast, the real interest rate is the nominal interest rate minus the expected inflation rate over the term of the loan. Since it is difficult to measure investors’ inflation expectations, the realized inflation rate is often used as a proxy for the expected inflation rate.
Figure 4.6 shows nominal and historical (or ex post) real rates in Canada over the last 27 years. Notice that nominal interest rates are considerably lower than they were in the early 1980s. Real rates have fluctuated between 5% and 7% until recently when they dropped below 1%.
FIGURE 4.6 NOMINAL AND REAL (EX POST) T-BILL RATES CANADA 1980 – 2010
0
5
10
-5
15
20
20052000 20101995199019851980
Real RateNominal Rate
T-B
ill R
ates
(%
)
Year
Source: Bank of Canada website.
If the progress of future inflation is uncertain, then so are expectations of future nominal interest rates. Bond prices reflect both a change in expectations and any uncertainties associated with such expectations. In an environment with consistently low inflation, the pricing of financial instruments such as government bonds is more straightforward.
CANADIAN SECURITIES COURSE • VOLUME 14•28
© CSI GLOBAL EDUCATION INC. (2010)
MONEY AND INFLATION
Money makes the market go around. It is used to purchase goods and services, real assets like land and capital goods, and financial assets such as bonds, stocks and other investments. Money is the essential ingredient that makes the economy function. As we discuss below, changes in the amount of money in circulation impacts the economy in different ways.
Inflation occurs when prices are rising. This is problematic because as prices rise money begins to lose its value – that is, more and more money is needed to buy the same amount of goods and services, and this has a negative effect on living standards. Inflation is an important economic indicator for securities markets because it is the rate at which the real value of an investment is eroded.
The Nature of MoneyMoney can be any object that is accepted as payment for goods and services, and that can be used to settle debts. Its function as a medium of exchange is essential. Without money, goods and services would need to be exchanged with other goods and services in some form of barter system. Money also acts as a unit of account so that we know exactly the price of a good or service. Finally, money represents a store of value since it does not have an expiration date if a consumer decides to save it for a later use. The more stable the value of money, the better it can act as a store of value.
The amount of money in circulation can be measured in a variety of ways. Some of these different measures, known as monetary aggregates, are described in Table 4.7. As one way of monitoring economic activity, the Bank of Canada looks primarily at changes in the growth rate of M1 and M2+ when conducting monetary policy because these aggregates provide information about changes that are occurring in the economy. M1 gives information on the future level of production in the economy, while the broader aggregates, M2 and M2+, provide a useful leading indicator of the rate of inflation. By monitoring these aggregates, the Bank strives to keep the rate of money growth consistent with low inflation and long-term growth.
TABLE 4.7 BANK OF CANADA MONETARY AGGREGATES – For information purposes only
M1:
Currency (Bank of Canada notes and coin) held outside banks
Personal chequing accounts
Demand deposits at chartered banks held by individuals and businesses
M2 = M1 plus the following:
Personal savings deposits at chartered banks
Non-personal notice deposits at chartered banks
MONEY AND INFLATION
FOUR • ECONOMIC PRINCIPLES 4•29
© CSI GLOBAL EDUCATION INC. (2010)
TABLE 4.7 BANK OF CANADA MONETARY AGGREGATES – For information purposes only – Cont’d
M2+ = M2 plus the following:
Deposits at trust and mortgage and loan companies
Deposits at credit unions and caisses populaires
Life insurance company individual annuities
Money market mutual funds
M2++ = M2+ plus the following:
Canada Savings Bonds (CSBs)
Non-money market mutual funds
M3 = M2 plus the following:
Non-personal term deposits at chartered banks
Foreign currency deposits at chartered banks
InflationInflation in an economy-wide sense is defined as a generalized, sustained trend of rising prices. A one-time jump in prices caused by an increase in the price of oil or the introduction of a new sales tax is not true inflation, unless it feeds into wages and other costs and initiates a wage-price spiral. Likewise, a rise in the price of one product is not in itself inflation, but may just be a relative price change reflecting the increased scarcity of that product. Inflation is ultimately about money growth. It is a reflection of “too much money chasing too few products.”
The Canadian Consumer Price Index (CPI) is one of the most widely used indicators of inflation and is considered a measure of the cost of living in Canada. Statistics Canada tracks the retail price of a shopping basket comprised of 600 different goods and services, each weighted to reflect typical consumer spending. In this way, the CPI represents a measure of the average of the prices paid for this basket of goods and services.
Statistics Canada has a difficult task creating a basket of goods and services that is representative of the typical Canadian household. They try to make the relative importance of the items included in the CPI basket the same as that of an average Canadian household. However, it is almost impossible to construct a “basket of goods” that would be representative of all consumers. For example, the spending patterns of a family with young children would not be the same as the spending patterns of a retired couple.
When calculating CPI, prices are measured against a base year, which at the moment is 2002, and this base year is given a value of 100. The total CPI was 114.8 at the end of 2009, which indicates that the basket of goods costs 14.8% more than it did in 2002. The CPI is an important economic indicator because it is used in the calculation of the inflation rate, which is the percentage change in the price level from one year to the next. The inflation rate is calculated by comparing the current period CPI with a previous period:
Inflation Rate CPI CPI
CPI Current Period Pr evious Pe riod =
-
P Pr evious Period100×
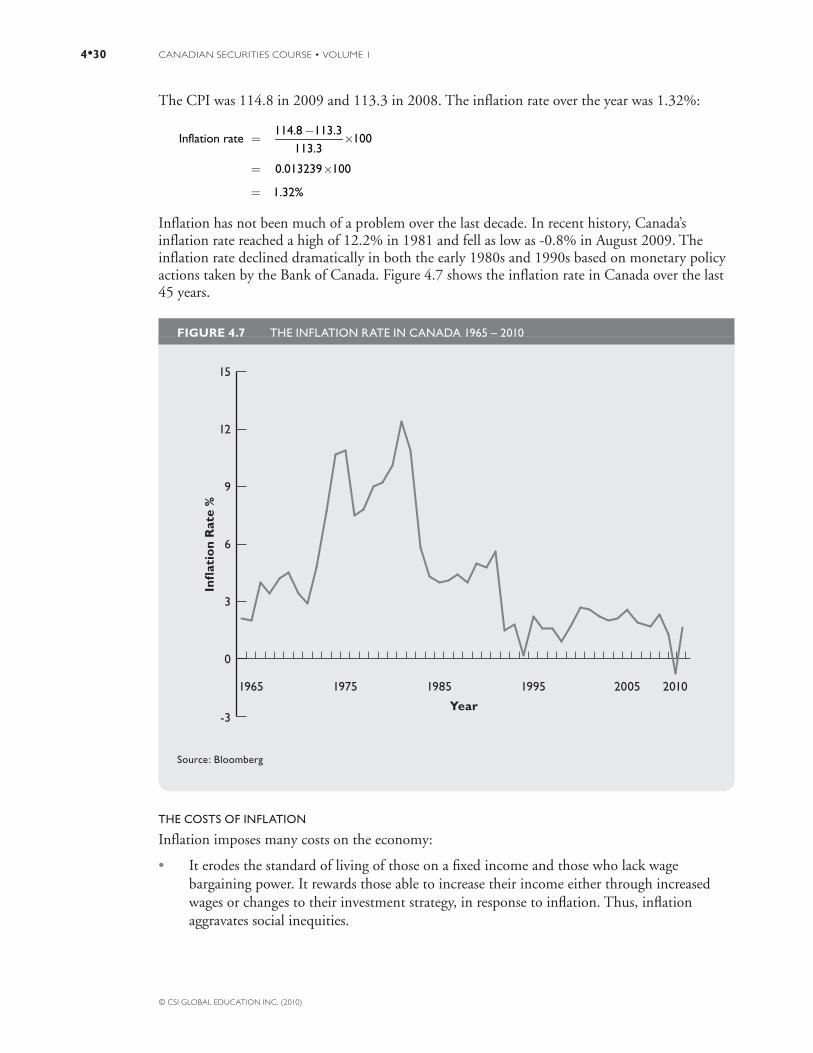
CANADIAN SECURITIES COURSE • VOLUME 14•30
© CSI GLOBAL EDUCATION INC. (2010)
The CPI was 114.8 in 2009 and 113.3 in 2008. The inflation rate over the year was 1.32%:
114.8 113.3Inflation rate 100
113.3
0.013239 100
1.32%
Inflation has not been much of a problem over the last decade. In recent history, Canada’s inflation rate reached a high of 12.2% in 1981 and fell as low as -0.8% in August 2009. The inflation rate declined dramatically in both the early 1980s and 1990s based on monetary policy actions taken by the Bank of Canada. Figure 4.7 shows the inflation rate in Canada over the last 45 years.
FIGURE 4.7 THE INFLATION RATE IN CANADA 1965 – 2010
0
3
-3
6
9
12
15
200519951985 201019751965
Infl
atio
n R
ate
%
Year
Source: Bloomberg
THE COSTS OF INFLATION
Inflation imposes many costs on the economy:
• It erodes the standard of living of those on a fi xed income and those who lack wage bargaining power. It rewards those able to increase their income either through increased wages or changes to their investment strategy, in response to infl ation. Thus, infl ation aggravates social inequities.

FOUR • ECONOMIC PRINCIPLES 4•31
© CSI GLOBAL EDUCATION INC. (2010)
• Infl ation reduces the real value of investments such as fi xed-rate loans, since the loans are paid back in dollars that buy less. This can be good for the borrower if his or her income rises with infl ation. But, more likely, infl ation results in lenders demanding a higher interest rate on the money they lend.
• Infl ation distorts the signals prices send to participants in market economies, where prices are critical for balancing supply with demand. Rising prices draw resources into areas of scarcity, and falling prices move funds away from glutted areas. When infl ation is high, it is diffi cult to determine if a price increase is simply infl ationary, or a genuine relative price change.
• Accelerating infl ation usually brings about rising interest rates and a recession. Thus, high-infl ation economies usually experience more severe booms and busts than low-infl ation economies.
In recent years, central banks throughout the world have become more acutely concerned with these costs and have increased their commitment to price stability.
THE CAUSES OF INFLATION
The relationships among the growth rate of money, inflation and the rate of unemployment are a subject of considerable controversy. Areas of agreement on the causes of inflation include:
• In the long run, money is neutral; that is, changes in money growth are refl ected fully in changes in infl ation. The extra money in the economy is a monetary phenomenon that serves only to bid up prices.
• Higher money growth may lower interest rates in the short run and lead to increased economic activity through increased investment and lower unemployment. In the long run, nominal interest rates adjust to the new level of money growth and there is no impact on real economic variables such as output and unemployment. Only the infl ation rate changes.
• Some evidence supports a short-run inverse relationship between infl ation and the level of unemployment. This relationship is called the Phillips curve.
• An important determinant of infl ation is the balance between supply and demand conditions in the economy. Economists use an indicator called the output gap to measure infl ation pressures in the economy by looking at the difference between real GDP, what the economy actually produces, and potential GDP, what the economy is capable of producing when its existing inputs of labour, capital, and technology are fully employed at their normal levels of use. Think of potential output as the maximum level of real GDP that the economy can maintain without infl ation increasing.
A negative output gap occurs when actual output is below potential output. In this case, economists would say there is spare capacity in the economy – the economy can produce more output because its resources are not being used to their full capacity. Unemployed workers and unused plant and equipment resources can be called into service without impacting wages or prices. Thus, infl ation will fall or remain steady.

CANADIAN SECURITIES COURSE • VOLUME 14•32
© CSI GLOBAL EDUCATION INC. (2010)
A positive output gap occurs when actual output is above potential output. In this case, economists would say the economy is operating above capacity – the economy is trying to produce more than it can with existing resources. Scarce labour fuels wage increases, and other strains on productive resources place upward pressure on infl ation. In general, a positive output gap occurs as the economy moves through an expansion towards the peak. Output continues to expand, consumer income is rising, and this leads to strong consumer demand for goods and services. However, this creates a situation whereby if companies can continue to operate well above normal capacity, they can raise prices in response to this strong demand. In this way, higher and continued consumer demand pushes infl ation higher. This state of affairs is called a situation of demand-pull infl ation.
• Infl ation can also rise or fall due to shocks from the supply side of the economy – when the cost of producing output changes. For example, the rise of world energy prices in the 1970s caused infl ation to rise. At a given price level, when faced with higher costs of production from higher wages or increases in the price of raw materials, fi rms respond by raising prices and producing a smaller amount of their product. In this way, the higher costs push infl ation higher. This is an example of cost-push infl ation.
Since determining the output gap and its impact on inflation is so difficult, a number of indicators are monitored for signs of changes in inflation. Commodity and wholesale prices often react to shortages or gluts before consumer prices. Wage settlements may give a signal on wage inflation and inflation expectations. Bank credit reflects households’ demand for major purchases. Movements in the exchange rate often affect inflation through their impact on the price of imports.
DisinflationJust as there are costs associated with rising inflation, a falling rate of inflation can also have a negative impact on the economy. Disinflation is a decline in the rate at which prices rise – i.e., a decrease in the rate of inflation. Prices are still rising, but at a slower rate.
The potential cost of disinflation is captured by the Phillips curve, which says that when unemployment is low, inflation tends to be high, and when unemployment is high, inflation tends to be low. According to this theory:
• Lower unemployment is achieved in the short run by increasing infl ation at a faster rate.
• Lower infl ation is achieved at the cost of possibly increased unemployment and slower economic growth.
To gauge the cost of disinflation, the sacrifice ratio is used to describe the extent to which GDP must be reduced with increased unemployment to achieve a 1% decrease in the inflation rate. Recent studies by the Bank of Canada suggest that the sacrifice ratio is as high as 5; that is, 5% of output must be sacrificed to bring down inflation 1%. So there may be a considerable cost in lost output in pursuing the goal of lower inflation. This cost could involve a significant period of relatively high unemployment.
The costs of disinflation were evident in Canada in the early 1990s. In 1988, the inflation rate in Canada was 4% and the unemployment rate was 7.8%. Six years later in 1994, the inflation rate had dropped dramatically to 0.2% while the unemployment rate had risen to 10.4%. As Table 4.8 shows, real GDP also dropped considerably during this period before it began to

FOUR • ECONOMIC PRINCIPLES 4•33
© CSI GLOBAL EDUCATION INC. (2010)
recover in 1992. More recently, the Canadian economy in 2008 experienced a drop in the inflation rate that was accompanied by an increase in the unemployment rate and a drop in the growth rate of real GDP. However, it is interesting to note that the duration of these events was less severe than those that occurred in the early 1990s.
TABLE 4.8 THE COSTS OF DISINFLATION IN CANADA
Year Bank Rate (%) Unemployment (%) Infl ation (%) Real GDP (%)
1988 9.69 7.8 4.0 5.0
1989 12.29 7.5 5.0 2.6
1990 13.05 8.1 4.8 0.2
1991 9.03 10.3 5.6 -2.1
1992 6.78 11.2 1.5 0.9
1993 5.09 11.4 1.8 2.3
1994 5.77 10.4 0.2 4.8
Source: Bloomberg and Bank of Canada website.
DeflationDeflation is a sustained fall in prices where the annual change in the CPI is negative year after year. In fact, deflation is just the opposite of inflation. Falling prices are generally preferred over rising prices. Goods and services become cheaper, and our income seems to go a little farther than it used to. Although true in the short term, there are negative consequences of deflation.
One view holds that the impact of sustained falling prices eventually leads to a decline in corporate profits. As prices continue to fall, businesses must sell their products at lower and lower prices. Businesses cut back on productions costs and wage rates, and if conditions worsen, lay off workers. For the economy as a whole, unemployment rises, economic growth slows and consumers shift their focus from spending to saving. Ultimately, declining company profits will negatively impact stock prices.
As the economy slows and enters a recession, the central bank can use lower short-term interest rates to stimulate consumer and business spending. However, there is a limit to how low interest rates can fall – rates cannot fall to a negative level or below zero. The economy of Japan in the 1990s provides a good example of the impact of deflation. At the time, the Bank of Japan and the government tried to eliminate deflation by reducing interest rates. However, despite having rates near zero for a sustained period, their economy is still in the process of recovery.
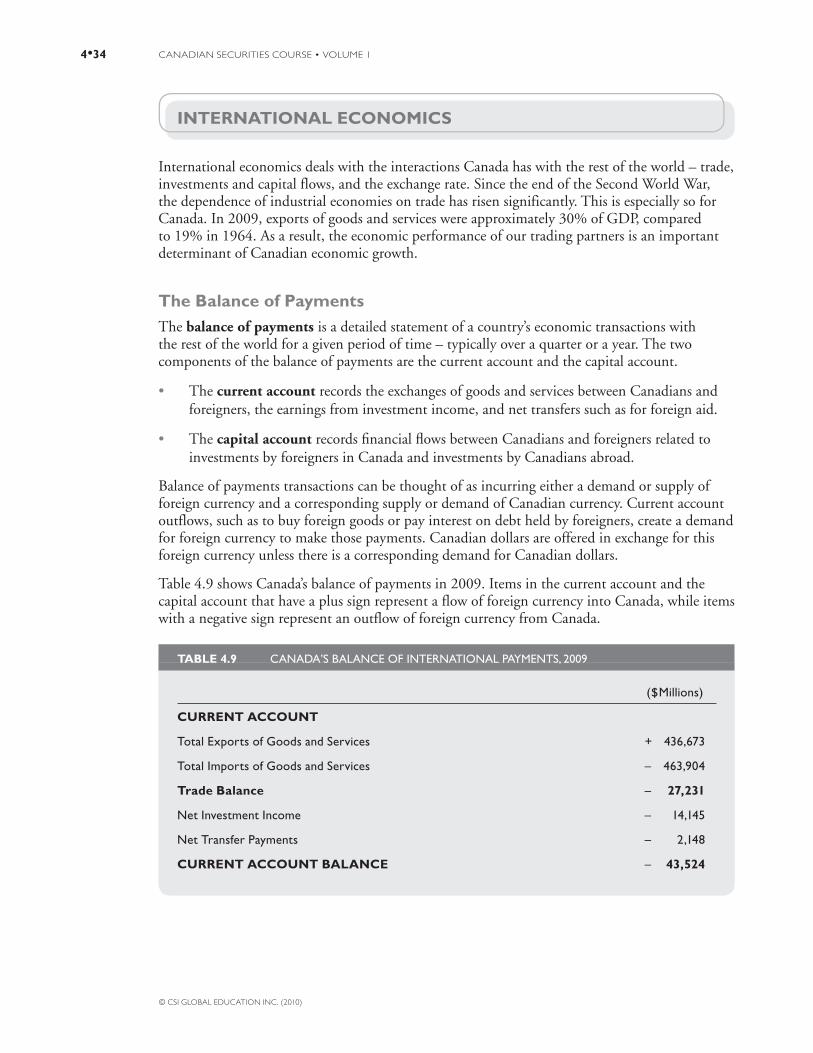
CANADIAN SECURITIES COURSE • VOLUME 14•34
© CSI GLOBAL EDUCATION INC. (2010)
INTERNATIONAL ECONOMICS
International economics deals with the interactions Canada has with the rest of the world – trade, investments and capital flows, and the exchange rate. Since the end of the Second World War, the dependence of industrial economies on trade has risen significantly. This is especially so for Canada. In 2009, exports of goods and services were approximately 30% of GDP, compared to 19% in 1964. As a result, the economic performance of our trading partners is an important determinant of Canadian economic growth.
The Balance of PaymentsThe balance of payments is a detailed statement of a country’s economic transactions with the rest of the world for a given period of time – typically over a quarter or a year. The two components of the balance of payments are the current account and the capital account.
• The current account records the exchanges of goods and services between Canadians and foreigners, the earnings from investment income, and net transfers such as for foreign aid.
• The capital account records fi nancial fl ows between Canadians and foreigners related to investments by foreigners in Canada and investments by Canadians abroad.
Balance of payments transactions can be thought of as incurring either a demand or supply of foreign currency and a corresponding supply or demand of Canadian currency. Current account outflows, such as to buy foreign goods or pay interest on debt held by foreigners, create a demand for foreign currency to make those payments. Canadian dollars are offered in exchange for this foreign currency unless there is a corresponding demand for Canadian dollars.
Table 4.9 shows Canada’s balance of payments in 2009. Items in the current account and the capital account that have a plus sign represent a flow of foreign currency into Canada, while items with a negative sign represent an outflow of foreign currency from Canada.
TABLE 4.9 CANADA’S BALANCE OF INTERNATIONAL PAYMENTS, 2009
($Millions)
CURRENT ACCOUNT
Total Exports of Goods and Services + 436,673
Total Imports of Goods and Services – 463,904
Trade Balance – 27,231
Net Investment Income – 14,145
Net Transfer Payments – 2,148
CURRENT ACCOUNT BALANCE – 43,524
INTERNATIONAL ECONOMICS

FOUR • ECONOMIC PRINCIPLES 4•35
© CSI GLOBAL EDUCATION INC. (2010)
($Millions)
CAPITAL ACCOUNT
Total Foreign Investment in Canada + 143,821
Total Canadian Investment Abroad – 103,861
Net Capital Transfers and Non-Financial Assets + 3,969
CAPITAL ACCOUNT BALANCE + 43,929
Statistical Discrepancy(Between Current and Capital Account) – 405
Source: Statistics Canada website, Balance of International Payments, May 2010.
In theory, the current account balance should equal the capital account balance. Think of the current account as what we spend on things and the capital account as what we use to finance this spending.
During a given year, if Canada buys more goods and services from abroad than it sells, it will run a current account deficit for the year. It will need to sell more assets to finance the spending, which means running a capital account surplus, or go into debt. As an analogy, when an individual spends more than he/she earns, the difference is made up by either borrowing money or selling something of value and using the proceeds to pay off the debt. In this way, a country experiencing a current account surplus is saving more than it is spending and can lend out this surplus amount to foreigners.
THE CURRENT ACCOUNT
The most important component of the current account is merchandise trade. Table 4.9 shows that Canada exported $436.7 billion of goods and services abroad and imported $463.9 billion worth of goods and services in 2009. The vast majority of this trade involved the U.S. – Canada exported 73% of its goods to U.S. markets and imported 63% of its goods from the U.S. Overall, Canada recorded a current account deficit of $43.5 billion in 2009.
A number of factors influence the performance of Canada’s trade. The most important is the relative pace of demand in foreign and Canadian economies. Strong growth in U.S. demand for automobiles, raw materials and other products made in Canada boosts exports. Likewise, strong demand in Canada for foreign products boosts imports.
The competitive position of Canadian firms in foreign markets and foreign firms in Canada also influences trade. A falling Canadian dollar, for example, lowers the price of Canadian exports in foreign markets and raises the price of imports in Canada. This boosts exports and depresses imports. Those benefits are lost, however, if the price of Canada’s goods rises in response to the lower dollar. A rising Canadian dollar has the opposite effect.
Since many companies in Canada are closely integrated with affiliates and suppliers in other countries, imports are closely linked to exports. Automobile components may be imported and the subsequently assembled autos exported. That is one reason Canada’s exports and imports tend to move in the same direction.
TABLE 4.9 CANADA’S BALANCE OF INTERNATIONAL PAYMENTS, 2009 – Cont’d

CANADIAN SECURITIES COURSE • VOLUME 14•36
© CSI GLOBAL EDUCATION INC. (2010)
Although trade is the largest component of the current account, others are also important:
• Investment income: Canadians pay interest on debt borrowed from foreigners and dividends to owners or investors in Canadian companies. Likewise, foreigners pay interest and dividends to Canadian investors. These payments are investment income. Because Canada has a large net foreign debt, it makes large payments to foreigners in the form of interest on that debt. This substantial defi cit on investment income represents the largest contributor to the total current account defi cit.
• Services: Canada usually runs a defi cit on services trade, refl ecting, among other things, the large contingent of Canadians living part of the year in the southern U.S. Examples of items that fall into the services category are:
– Some services trade is directly linked to merchandise trade, such as freight charges.
– Canadian companies such as engineering and accounting firms may sell their services in foreign markets.
– Tourism and travel represent an important part of services trade.
• Transfers: This category refers to unilateral transfers of money between Canada and foreign countries. Canada’s offi cial development assistance to poor countries is the most important transfer outward. Immigrants bringing their savings to Canada is the most important transfer inward.
THE CAPITAL ACCOUNT
Table 4.9 shows that Canada ran a capital account surplus of $43.9 billion in 2009. This means that more capital flowed into Canada in the form of investments than Canada paid to foreigners in the form of investments.
The key difference between current and capital account transactions is that the latter result in an acquisition of an asset and the right to any income it earns. Thus, the purchase of a computer made in Canada is a current account transaction, whereas the purchase of the company that made the computer is a capital account transaction.
Over time, a succession of current account deficits results in growing foreign claims on a country, and thus a large foreign debt. Likewise, a country with successive current account surpluses eventually becomes a large creditor nation.
The borrowing and lending of these amounts are recorded in the capital account. The major capital account components are:
• Direct investment: Since Confederation, foreign investors have put money into Canada for the purpose of starting new businesses, acquiring existing ones, or buying land and other income producing assets. More recently, Canadians have become active investors in corporate assets abroad, especially in the U.S. If the foreign investor owns 10% or more of a Canadian company, the investment is classifi ed as direct; anything less is categorized as “portfolio investment.”
• Portfolio investment: The two main types of portfolio investment are debt and equity. This type of investment involves issuing bonds and treasury bills to foreign investors. This takes place usually through foreign purchases of a newly issued or outstanding bond or Treasury bill, or purchases of equity for investment rather than control.

FOUR • ECONOMIC PRINCIPLES 4•37
© CSI GLOBAL EDUCATION INC. (2010)
• International reserve transactions: The Bank of Canada, on behalf of the federal government, buys or sells Canadian dollars in currency markets in exchange for foreign currency to smooth its movements. The acquisition or sale of these reserves is recorded as a capital account transaction.
The Exchange RateBuying foreign goods or investing in a foreign country requires the use of another currency to complete the transactions. Conversely, when foreigners buy Canadian goods or invest in Canadian assets, they need Canadian dollars. The foreign exchange market includes all the places in which one nation’s currency is exchanged for another at a specific exchange rate – the price of one currency in terms of another. For example, a Canadian dollar exchange rate of US$0.90 means that it costs 90 U.S. cents to buy one Canadian dollar.
THE EXCHANGE RATE AND THE CANADIAN DOLLAR
Although the United States dollar (US$) exchange rate is the most important rate for Canada because so much of our business is carried on with the U.S., an official exchange rate exists between the Canadian dollar and every other convertible currency in the world. For example, the impact of a rise in the Canadian dollar against the US$ might be offset by a fall against the euro.
In an economy as dependent on trade and open to international capital flows as Canada’s, the behaviour of the exchange rate is vitally important. The value of the Canadian dollar relative to other currencies influences the economy in a number of ways. The most important influence is through trade. A higher dollar makes Canadian exports more expensive in foreign markets and imports cheaper in Canada. When the Canadian dollar rises in value relative to a foreign currency, the dollar is said to have appreciated in value against that currency; conversely, when the Canadian dollar falls in value relative to a foreign currency, the dollar has depreciated in value against that currency.
Example: Suppose a machine made in Canada sells for $1,000. With the Canadian dollar at US$0.90, it sells for US$900 in the U.S. If a similar product sells for $950 in the U.S., the Canadian manufacturer benefi ts at this exchange rate as the machine will sell for a lower price in the U.S. market. If the exchange rate appreciates in value to US$0.95, the machine would now sell for US$950, making its manufacturer less competitive in the U.S. market and decreasing sales and probably corporate profi tability. Likewise, a U.S. company that sold a similar machine for US$900 in the U.S. would sell it for $1,000 in Canada with the exchange rate at US$0.90, but for only $947.37 with the exchange rate at US$0.95, taking sales away from the Canadian company.
Since many Canadian exporters price their products in U.S. dollars, they will often elect to keep its US$ price unchanged as the dollar appreciates in value, even though that results in less revenue in Canadian dollars. Such a decision would force the exporter either to accept lower profits, or find a way to reduce the costs of making the product. A lower exchange rate would have the opposite effects, making Canada’s exports cheaper and imports more expensive. An exporter that kept its US$ price unchanged would pocket higher profits, or allow costs to rise.
Figure 4.8 shows the exchange rate between Canada and the U.S. between 1975 and 2007. The figure shows that the Canadian dollar depreciated steadily against the U.S. dollar for most of this period, other than for a brief rise in the currency in the late 1980s. This downward trend reversed beginning in early 2003, as the currency rose steadily against the U.S. In fact, the Canadian dollar traded above par (US$1.00) in 2007 for the first time since the mid-1970s.

CANADIAN SECURITIES COURSE • VOLUME 14•38
© CSI GLOBAL EDUCATION INC. (2010)
FIGURE 4.8 THE EXCHANGE RATE 1975 – 2009
0.6
0.8
1.0
1.2
2005199519851975Year
US
$
1980 2000 20091990
Source: Bloomberg
DETERMINANTS OF EXCHANGE RATES
Predicting the direction of exchange rates consumes the attention of many economists and analysts. The following factors are widely accepted as influencing the exchange rate, but the weight ascribed to each is by no means agreed upon.
• Infl ation differentials: Over time, the currencies of countries with consistently lower infl ation rates rise, refl ecting their increased purchasing power relative to other currencies. Historically, Japan, Germany and Switzerland have had lower infl ation rates than other major industrial countries and this is refl ected in the long-term appreciation of their currencies. They also enjoy lower interest rates, refl ecting investors’ willingness to accept a lower return if they expect the currency to appreciate.
• Interest rate differentials: Central banks can infl uence the value of their exchange rate by raising and lowering short-term nominal interest rates. Higher domestic interest rates increase the return to lenders relative to other countries. This attracts capital and lifts the exchange rate. Lower interest rates have the opposite effect. However, the impact of higher interest rates is reduced if domestic infl ation also is much higher or if other factors are driving the currency down.
• Current account: A country with a current account defi cit is spending more than it is earning and must borrow funds to make up the difference. In effect, this means the defi cit country is constantly demanding more foreign currency than it receives through its exports, and supplying more domestic currency than the rest of the world demands for its products. This excess demand

FOUR • ECONOMIC PRINCIPLES 4•39
© CSI GLOBAL EDUCATION INC. (2010)
for foreign currency puts downward pressure on the domestic exchange rate. This occurs until domestic exports or assets are cheap enough to attract foreigners and imports, or foreign assets are too expensive to attract domestic interests.
• Economic performance: A country with a strongly growing economy may be more attractive to foreign investors because it improves investment returns and attracts investment capital.
• Public debts and defi cits: Countries with large public-sector debts and defi cits are less attractive to foreign investors for a variety of reasons. First, such debts give the government an incentive to allow infl ation to grow – higher infl ation means that the government can repay these debts with cheaper dollars. Second, governments must often turn to foreigners to fi nance those defi cits if domestic savings are insuffi cient – this involves selling government bonds or Treasury bills. This increases the supply of securities outstanding and lowers their price. Third, such debts may eventually cast doubt on the government’s ability to repay them. This raises the threat of default and reduces foreigners’ willingness to own these securities. These last two factors also apply to private-sector debt. Thus, countries with a fi nancially sound public sector but heavily indebted private sector may also see their currencies suffer. For these reasons, decisions by debt-rating agencies, such as Moody’s, Standard & Poor’s and DBRS, often have an impact on the exchange rate.
• Terms of trade: The terms of trade is the ratio of export prices to import prices. For example, if the price of Canada’s exports rises 5% but that of its imports rises only 2%, its terms of trade have risen about 3%. Rising terms of trade indicate greater demand for a country’s exports and rising revenues from exports. Both of these indicate increased demand for its currency. Since commodities represent a large part of Canada’s exports, movements in their prices heavily infl uence the terms of trade and thus the exchange rate. Strong commodity prices often result in a rising Canadian dollar.
• Political stability: Investors seldom like to invest in countries with unstable or disreputable governments, or those at risk of disintegrating politically. Thus, political turmoil in a country can cause a loss of confi dence in its currency and a “fl ight to quality” to the currencies of more politically stable countries.
TYPES OF EXCHANGE RATES
A number of different exchange rate systems or regimes exist in the world. The most common are fixed and floating. Under a fixed exchange rate, a country’s central bank maintains the domestic currency at a fixed level against another currency or a composite of other currencies.
Most advanced countries, including Canada and the U.S., have a floating exchange rate. In such a system, the central bank allows market forces to determine the value of the currency. The central bank may intervene if it thinks movements in the exchange rate are excessive or disorderly. The Bank of Canada has occasionally used interest rates to halt free-falls in the Canadian dollar because of the threat such a fall poses either to orderly markets or inflation. For example, if interest rates in Canada rise relative to rates in the U.S., Canadian dollar–denominated assets may become more attractive to investors. If this is the case, the demand for Canadian dollars increases and the exchange rate appreciates in value. Similarly, if interest rates in Canada fall relative to U.S. rates, investors transfer out of Canadian investments and into U.S. dollar–denominated investments. This has the effect of increasing the supply of Canadian dollars and leads to a depreciation in the currency.

CANADIAN SECURITIES COURSE • VOLUME 14•40
© CSI GLOBAL EDUCATION INC. (2010)
SUMMARY
After reading this chapter, you should be able to:
1. Defi ne economics, identify the decision makers in an economy, and describe the process for achieving market equilibrium.
• Economics is fundamentally about understanding the choices individuals make and how the sum of those choices affects our market economy. Whether it is the purchase of groceries, a home or stocks and bonds, this interaction ultimately takes place within organized markets.
• The three main decision makers in the economy are consumers, companies and governments. While consumers set out to maximize their well-being and firms aim to maximize profits, governments set out to maximize the public good.
• The forces of demand and supply and the interaction between buying and selling decisions by consumers ultimately leads to market equilibrium, and this is the price at which we buy and sell goods and services.
2. Defi ne gross domestic product (GDP), explain how GDP is measured, and list the factors that lead to growth in GDP.
• Economic growth is an economy’s ability to produce greater levels of output over time and is expressed as the percentage change in a nation’s GDP. GDP is the market value of all finished goods and services produced within a country in a given time period, usually a year or a quarter.
• There are two ways to measure GDP. The expenditure approach measures GDP as the sum of personal consumption, investment, government spending, and net exports of goods and services. The income approach measures GDP as the total income earned producing those goods and services.
• Growth in GDP is tied to increases in population over time, increases in the capital stock, and improvements in technology.
SUMMARY

FOUR • ECONOMIC PRINCIPLES 4•41
© CSI GLOBAL EDUCATION INC. (2010)
3. Describe the phases of the business cycle, distinguish among the economic indicators used to analyze business conditions, and identify the determinants of long-term economic growth.
• There are five phases to a typical business cycle: recovery, expansion, peak, recession and trough.
• Various leading, lagging and coincident economic indicators are used to analyze business conditions and current economic activity. They are useful to show whether the economy is expanding or contracting. For example, the combination of higher new housing starts, new orders for durable goods, and an increase in furniture and appliance sales suggests an economy that is moving from recovery to expansion.
• Improvements in long-term economic growth are attributed to improvements in productivity. Productivity growth has major implications for the overall wealth of an economy, as there is a direct relationship between the amount of output generated per worker and the standard of living of a typical family.
4. Compare and contrast the two key indicators of the labour market in Canada and the three main types of unemployment.
• The participation rate represents the share of the working-age population that is in the labour force. The unemployment rate represents the share of the labour force that is unemployed and actively looking for work.
• Cyclical unemployment is the result of fluctuations in the business cycle. Frictional unemployment is the result of normal labour turnover, for example, from people entering and leaving the work force and from the ongoing creation and destruction of jobs. Structural unemployment occurs when workers are unable to find work or fill available jobs because they lack the necessary skills, do not live where jobs are available, or decide not to work at the wage rate offered by the market.
5. Describe the determinants of interest rates and discuss how interest rates affect the performance of the economy.
• A broad range of factors influences interest rates: demand for and supply of capital, default risk, central bank operations, foreign interest rates and inflation.
• Higher interest rates raise the cost of capital for consumers and businesses. This discourages consumers from spending and borrowing money to purchase, for example, homes, cars, and other big-ticket items. Businesses forgo taking part in expansion projects or other forms of investment. Thus, higher rates lead to slower economic growth.
• In contrast, lower interest rates have an expansionary effect on the economy.
CANADIAN SECURITIES COURSE • VOLUME 14•42
© CSI GLOBAL EDUCATION INC. (2010)
6. Defi ne infl ation, calculate the infl ation rate using the Consumer Price Index (CPI), and analyze the causes and effects of infl ation, disinfl ation and defl ation on an economy.
• Inflation is a generalized, sustained trend of rising prices measured on an economy-wide basis. A one-time jump in prices caused by an increase in the price of a good or service is not inflation unless it ultimately leads to higher wages and other costs felt throughout the economy.
• The CPI is considered a measure of the cost of living in Canada. The CPI can be used to measure the inflation rate:
Current CPI Previous CPIPrevious CPI
Inflation-
100
• Inflation erodes the standard of living for those on a fixed income, it reduces the real value of investments because the loans are paid back in dollars that buy less, and it distorts the signal that prices send to participants in the market. Rising inflation typically brings about rising interest rates and slower economic growth.
• Disinflation is a decline in the rate at which prices rise, meaning a decrease in the rate of inflation. The Phillips curve can be used to gauge the potential costs of disinflation.
• Deflation is a sustained fall in prices where the annual change in the CPI is negative year after year. Although falling prices are generally good for the economy, a sustained fall in prices can have negative implications for corporate profits and the economy.
7. Defi ne the accounts included in a country’s balance of payments, describe the determinants of the exchange rate, and explain the impact the balance of payments and the exchange rate have on the economy.
• The balance of payments is a detailed statement of a country’s economic transaction with the rest of the world.
• The current account records the exchange of goods and services between Canadians and foreigners, the earnings from investment income, and net transfers.
• The capital account records financial flows between Canadians and foreigners, related investments by foreigners in Canada, and investments by Canadians abroad.
• The exchange rate is the price of one currency in terms of another. The key determinants of the exchange rate include inflation differentials, interest rate differentials, the current account, economic performance, public debt and deficits, the terms of trade and political stability.
Now that you’ve completed this
chapter and the on-line activities,
complete this post-test.

© CSI GLOBAL EDUCATION INC. (2010) 5•1
Chapter 5
Economic Policy

© CSI GLOBAL EDUCATION INC. (2010)5•2
5
Economic Policy
CHAPTER OUTLINE
Economic Theories• Rational Expectations Theory• Keynesian Theory• Monetarist Theory• Supply-Side Economics
Fiscal Policy• The Federal Budget• How Fiscal Policy Affects the Economy
The Bank of Canada• Role of the Bank of Canada• Functions of the Bank of Canada
Monetary Policy• Implementing Monetary Policy• Open Market Operations• Cash Management Operations
Government Policy Challenges• The Consequences of Failed Fiscal Policy
Summary

© CSI GLOBAL EDUCATION INC. (2010) 5•3
LEARNING OBJECTIVES
By the end of this chapter, you should be able to:
1. Compare and contrast the rational, Keynesian, monetarist and supply-side theories of the economy.
2. Analyze the mechanisms by which governments establish fi scal policy and evaluate the impacts of fi scal policy on the economy.
3. Explain the role and functions of the Bank of Canada.
4. Analyze how the Bank of Canada implements and conducts monetary policy.
5. Discuss the challenges governments face in their fi scal and monetary policies and the consequences of failed policy.
ROLE OF ECONOMIC THEORIES
In February each year, the Federal Minister of Finance announces the government’s budgetary requirements, which is its annual fi scal policy score card of spending and taxation measures. Not far from Parliament Hill, the Bank of Canada watches over the economy and uses monetary policy and its infl uence over interest rates and the exchange rate to maintain balance. Although the government and the Bank operate mostly independently of one another, both have a goal of creating conditions for long-term, sustained economic growth.
This chapter builds on information in the previous chapter about the principles of economics to explore the benefi ts and costs of fi scal and monetary policy, particularly from the standpoint of making investment decisions. For example, if you believe the economy is moving through expansion into the peak phase of the business cycle, what investments or strategies would you pursue given the policy action the Bank of Canada is likely considering? If the economy has been stalled in recession and unemployment continues to rise, what fi scal policy options is the federal government likely to consider?
Understanding what route economic policy will follow is a factor in making investment decisions. It is important, therefore, to be familiar with the fi scal and monetary policy options available to the government and how these policy actions will affect fi nancial markets.
In the on-line Learning Guide for this module,
complete the Getting Started
activity.
© CSI GLOBAL EDUCATION INC. (2010)5•4
KEY TERMS
Automatic stabilizers Large Value Transfer System (LVTS)
Bank rate Monetarist theory
Basis points Monetary policy
Budget deficit National debt
Budget surplus Overnight rate
Canadian Payments Association (CPA) Rational expectations theory
Drawdown Redeposit
Fiscal agent Sale and Repurchase Agreements (SRAs)
Fiscal policy Special Purchase and Resale Agreements (SPRAs)
Keynesian economics Supply-side economics
FIVE • ECONOMIC POLICY 5•5
© CSI GLOBAL EDUCATION INC. (2010)
ECONOMIC THEORIES
Prior to the 1930s, most economists believed that the market followed a self-correcting mechanism and would automatically adjust to temporary imbalances. Left to these built-in stabilizers, market adjustments would quickly move the economy from recession to a stable growth path. Over the years, a number of theories have been put forward to help us better understand the workings of the economy.
Rational Expectations TheoryRational expectations theory suggests that firms and workers are rational thinkers and can evaluate all the consequences of a government policy decision, thereby neutralizing the intended impact of the policy.
Example: Suppose the government decides to cut taxes temporarily in order to boost consumer spending and improve economic conditions. If consumers behave rationally, they will realize that the tax cut will create a defi cit that eventually has to be repaid with higher taxes. Instead of spending the tax cut, they save it to repay future taxes, and the government’s move has no impact.
Example: Suppose the central bank decides to let infl ation accelerate in hopes of achieving a higher level of demand and lower unemployment. Firms and workers realize infl ation is rising, immediately adjust their prices and wage demands upward, and no increase in real demand occurs. Some economists argue that since the consequences of active policy on the part of government are uncertain, it is better for the government to be less active or less interventionist. The economy is better served if the government simply adopts sets of rules to govern its activities. For example, a rule could stipulate that the money supply could only increase by a certain amount each year. On the fi scal side, a rule could restrict the government from running a defi cit over a fi xed period.
Keynesian TheoryReacting to the severity of the worldwide depression in the 1930s when double-digit unemployment persisted throughout the decade, British Economist John Maynard Keynes offered an alternative to the view that the economy worked best when left to its own devices. Keynesian economics advocates the use of direct government intervention as a means of achieving economic growth and stability.
Consider the case when the economy enters a recession. Keynesians advocate an increase in government spending or lower taxes to raise consumer income. With more money in their pockets, consumers increase their spending on goods and services. To meet the higher consumer demand for their products, businesses hire more workers to expand production and unemployment falls. Lower unemployment leads to a further increase in consumer income and spending. The increase in income and spending may continue for some time. However, once policymakers believe that spending is rising too quickly, policy will change to reflect lower government spending and higher taxes.
The analysis Keynes put forward became the rationale for the use of government spending and taxation to stabilize the business cycle. When spending was insufficient and a recession loomed, government would pursue a policy of increased spending and lower taxes. During an economic
ECONOMIC THEORIES

CANADIAN SECURITIES COURSE • VOLUME 15•6
© CSI GLOBAL EDUCATION INC. (2010)
boom and when higher spending threatened inflation, government policy would change in favour of lower spending and higher taxes.
Monetarist TheoryMonetarist theory suggests that the economy is inherently stable and, left to its own self-adjusting mechanism, will automatically move to a stable path of growth. In contrast to the Keynesian view, the Monetarist movement, led by American economist Milton Friedman in the late 1950s, held that instability in the money supply is the major cause of fluctuations in real GDP and that rapid money supply growth is the major cause of inflation. In fact, it was Friedman who coined the phrase “inflation is always and everywhere a monetary phenomenon.” Monetarists believe that instead of pursuing active monetary or fiscal policy, the central bank should simply expand the money supply at a rate equal to the economy’s long-run growth rate – somewhere in the neighbourhood of 2% to 3% per year, for example. According to this view, controlling inflation as the main policy goal creates a foundation for the economy to grow at its optimal rate.
Supply-Side EconomicsAccording to supply-side economics, to foster an environment of prosperity, the market should be left on its own and government intervention should be held to a minimum. Although there are similarities with the monetarist view, “supply-siders” suggest that government intervention should only occur through changes in tax rates. Specifically, this view advocates that changes in tax rates exert important effects over supply and spending decisions in the economy. They maintain that reducing both government spending and taxes provides the stimulus for economic expansion. By the late 1970s, some economists held the view that rising marginal tax rates had the effect of discouraging investment in the economy. Reducing taxes and the size of the government would help to fuel economic expansion. According to supply-siders, a reduction in marginal tax rates stimulates investment in the economy and ultimately leads to a higher level of output. This view provided the foundation for the substantial reduction in marginal tax rates that took place in the United States and several other countries during the 1980s.
FISCAL POLICY
Governments, through their power to tax, spend, and borrow, exercise enormous influence on the economy. Since the end of the Second World War, most Western governments have taken it for granted that one of their mandates is to smooth out the fluctuations in the business cycle. Fiscal policy is the use of the government’s spending and taxation powers to pursue such economic goals as full employment and sustained long-term growth. They do this by spending more and taxing less when the economy is weak, and by spending less and taxing more when the economy is strong.
Both the federal and provincial governments play a role in Canadian fiscal policy. Both have responsibility for certain areas of activity. The federal government is responsible for such things as employment insurance, defence, old age security, veterans’ affairs and native affairs. The provincial governments are responsible for health, education and welfare. However, the federal government shares some responsibility for those areas with the provinces. A large segment of its
FISCAL POLICY
FIVE • ECONOMIC POLICY 5•7
© CSI GLOBAL EDUCATION INC. (2010)
spending consists of transfer payments to the provincial governments to pay for health, education and welfare. At times, federal deficit reduction efforts result in cuts to these transfers, putting upward pressure on provincial deficits, since the provinces have little other revenue to compensate for the loss of transfers.
Federal and provincial governments oversee important areas of spending that do not appear on their respective budgets. These include the Canada and Quebec Pension Plans, Workplace Safety and Insurance Board, the Export Development Corp., and a wide range of other crown corporations ranging from Canada Post to Quebec’s Société générale de financement. In theory, most of these agencies are meant to be self-supporting. In practice, many accumulate large deficits or unfunded liabilities, which are the responsibility of the government that runs the agency or corporation.
The Federal BudgetEarly each year, usually in February, the federal Minister of Finance presents to the House of Commons the federal budget for the upcoming fiscal year, which runs from April 1 to March 31. The budget contains projections for the coming year, and usually for at least one subsequent year, for spending, revenue, the amount of the projected surplus or deficit, and debt. An important part of the budget is the economic assumptions that underlie projections for tax revenue, debt service costs and other parts of the budget.
The government’s budget balance is equal to its revenues less its total spending. If the revenue collected during the year exceeds spending for the year, the government has a budget surplus. If total spending for the year is higher than the revenue collected, the government has a budget deficit for the year. Accordingly, if the revenue collected for the year equals total spending, the government has a balanced budget. When the government runs a budget deficit, it must borrow to make up the difference by selling government bonds and Treasury bills into the market. The accumulation of total government borrowing over time is referred to as the government debt or the national debt. It is the sum of past deficits minus the sum of past surpluses.
The amount of the surplus or deficit is the most important number in the budget, because it tells markets the extent to which the government will be borrowing in the coming year and how it will compete with other borrowers for funds. If the government predicts a deficit, the amount projected in the budget may differ from what the government actually borrows in the debt market (called its financial requirements) for several reasons:
• Previously issued bonds that mature in the coming fi scal year must be refi nanced. Since this is not new borrowing, it is usually not included in projected fi nancial requirements.
• The government has access to several special-purpose accounts for funds. These alternatives reduce its dependence on debt markets. The most important source of such funds is the civil service pension fund. This is the main reason financial requirements are usually less than the deficit.

CANADIAN SECURITIES COURSE • VOLUME 15•8
© CSI GLOBAL EDUCATION INC. (2010)
Table 5.1 breaks down the major sources of Government revenue and spending over the previous two federal budgets. The table shows that the federal government posted a budget surplus in 2007-2008 and a deficit in 2008-2009.
TABLE 5.1 FEDERAL GOVERNMENT FISCAL TRANSACTIONS
2007-08($ Millions)
2008-09($ Millions)
BUDGETARY REVENUES
Tax Revenues
Personal Income Tax 113,063 116,024
Corporate Income Tax 40,628 29,476
Non-resident Income Tax 5,693 6,298
Goods and Services Tax 29,920 25,740
Energy Taxes 5,139 5,161
Custom Import Duties 3,903 4,036
Other Excise Taxes and Duties 5,245 4,869
Total Tax Revenues 203,591 191,604
Other Revenues
Employment Insurance Premium Revenues 16,558 16,887
Other Revenues 22,271 24,601
Total Budgetary Revenues 242,420 233,092
BUDGETARY EXPENSES
Major Transfers to Persons 58,147 61,586
Transfers to Other Levels of Government 46,152 46,515
Direct Program Expenses (Crown Corporation, National Defence and other departments and Agencies)
95,199 99,756
Public Debt Charges 33,325 30,990
Total Budgetary Expenses 232,823 238,847
Budget Balance9,597 -5,755
Source: Annual Financial Report of the Government of Canada, Fiscal Year 2008-2009
FIVE • ECONOMIC POLICY 5•9
© CSI GLOBAL EDUCATION INC. (2010)
How Fiscal Policy Affects the EconomyFiscal policy affects the economy in several ways:
• Spending: Governments can purchase goods or services themselves, such as a new highway, thereby boosting economic activity. Or they can simply transfer money to citizens to spend or save themselves, such as with social security cheques. Only the fi rst type is recorded as government spending in GDP.
• Taxes: The amount of tax collected may vary because the size of the tax base changed, i.e., the number of people or companies paying the tax expanded or contracted. Also, it can vary because the tax rate changed, so that each dollar of economic activity yields more or less tax. Raising tax rates reduces the disposable income of consumers, thereby dampening their spending. The main types of taxes are:
– Direct taxes, levied on the income of individuals and companies;
– Sales taxes (including value-added taxes, like the goods and services tax, and excise taxes, such as on liquor);
– Payroll taxes, levied as a share of wages;
– Capital taxes, levied on the size of a company’s assets or capital;
– Property taxes, levied on residential and commercial property.
All taxes tend to discourage the type of activity being taxed. Income taxes reduce the incentive to work and earn; payroll taxes reduce the incentive to hire; and sales taxes reduce the incentive to spend.
• Deficit: In the 2008-09 fiscal period, the government spent $238.847 billion but it took in $233.092 billion in revenues for a recorded deficit of $5.755 billion.
Persistent deficits emerged during the 1980s and the annual deficit grew considerably. Unfortunately, a vicious circle emerged: the deficit led to increased borrowing; this led to a larger national debt and larger interest payments to service the debt; and these larger interest payments led to a larger deficit and a larger debt. In fact, it was not until 1997 that the federal government finally managed to run a surplus.
From its dollar peak of $563 billion in 1996–1997, the federal debt has declined by $100 billion to $463 billion as of March 31, 2009. This is good news from a global perspective, as Canada’s federal debt as a percentage of GDP fell significantly over the past decade. The debt-to-GDP ratio is regarded as a sound measure of a nation’s overall debt burden because it measures the debt relative to the ability of the government and the nation’s taxpayers to finance it. As a share of GDP, federal debt dropped to 32.8 % in 2008-2009, down from its peak of 68.4% in 1995–1996. The debt-to-GDP ratio has steadily declined over the last 15 years, and is now back to the levels of early 1980s.
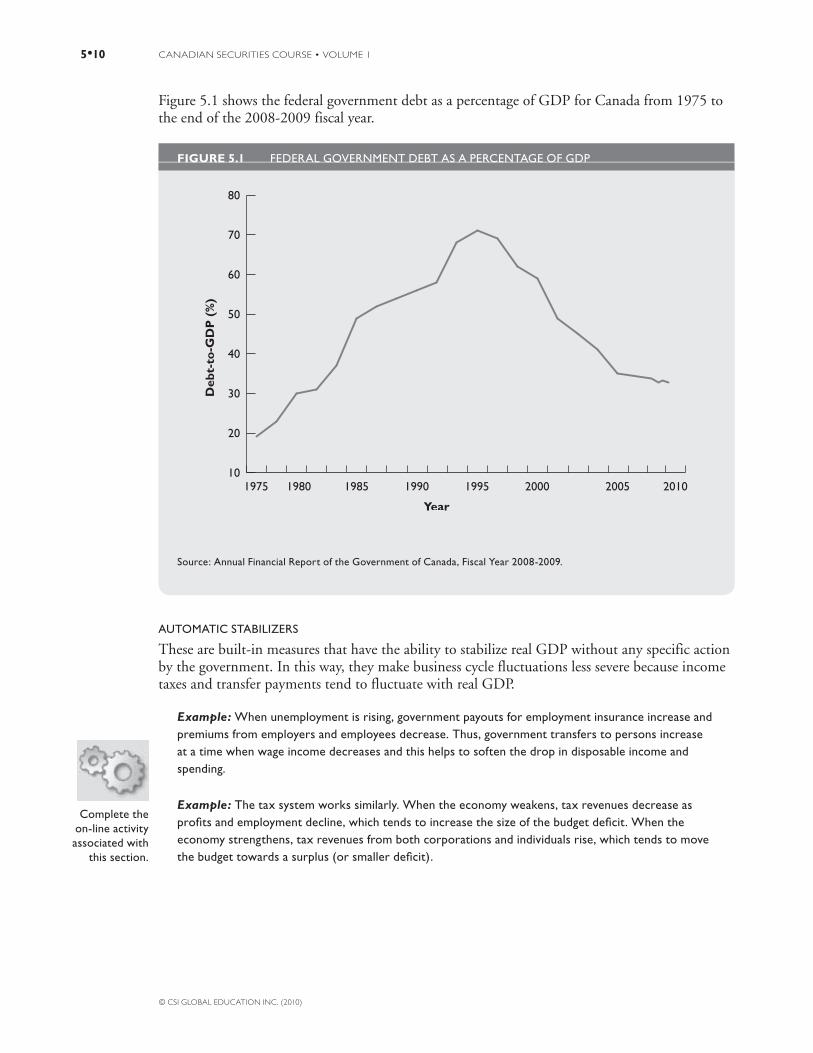
CANADIAN SECURITIES COURSE • VOLUME 15•10
© CSI GLOBAL EDUCATION INC. (2010)
Figure 5.1 shows the federal government debt as a percentage of GDP for Canada from 1975 to the end of the 2008-2009 fiscal year.
FIGURE 5.1 FEDERAL GOVERNMENT DEBT AS A PERCENTAGE OF GDP
10
20
30
40
50
60
70
80
2005 20102000 1995 1990 1985 1980 1975
Deb
t-to
-GD
P (
%)
Year
Source: Annual Financial Report of the Government of Canada, Fiscal Year 2008-2009.
AUTOMATIC STABILIZERS
These are built-in measures that have the ability to stabilize real GDP without any specific action by the government. In this way, they make business cycle fluctuations less severe because income taxes and transfer payments tend to fluctuate with real GDP.
Example: When unemployment is rising, government payouts for employment insurance increase and premiums from employers and employees decrease. Thus, government transfers to persons increase at a time when wage income decreases and this helps to soften the drop in disposable income and spending.
Example: The tax system works similarly. When the economy weakens, tax revenues decrease as profi ts and employment decline, which tends to increase the size of the budget defi cit. When the economy strengthens, tax revenues from both corporations and individuals rise, which tends to move the budget towards a surplus (or smaller defi cit).
Complete the on-line activity associated with
this section.
FIVE • ECONOMIC POLICY 5•11
© CSI GLOBAL EDUCATION INC. (2010)
THE BANK OF CANADA
The Bank of Canada (the Bank) was founded in 1934 and began operations in 1935 as a privately owned corporation. By 1938, ownership passed to the Government of Canada. Responsibility for the affairs of the Bank of Canada rests with a Board of Directors composed of the Governor, the Senior Deputy Governor and twelve Directors from outside the Bank.
Role of the Bank of CanadaThe duties and role of the Bank are stated in a general way in the preamble of the Bank of Canada Act:
• “To regulate credit and currency in the best interests of the economic life of the nation...
• To control and protect the external value of the national monetary unit...
• To mitigate by its infl uence fl uctuations in the general level of production, trade, prices and employment, as far as may be possible within the scope of monetary action and generally...
• To promote the economic and fi nancial welfare of the Dominion.”
The Act does not specify the manner in which the Bank should pursue these objectives but it (and other legislation) grants powers to the Bank which are designed to enable it to fulfill its role.
While the Bank administers policy independently without day-to-day Government intervention, the thrust of policy is the ultimate responsibility of the elected Government.
Functions of the Bank of CanadaThe major functions of the Bank of Canada are:
• To act for the Government in the issuance and removal of bank notes;
• To act as the Government’s fi scal agent (i.e., being the Government’s fi nancial advisor on debt management, foreign exchange and monetary policy and acting as its agent in fi nancial transactions); and
• To conduct monetary policy (i.e., managing the supply of the nation’s money). This is the Bank’s most important function.
ISSUANCE AND REMOVAL OF BANK NOTES
The Bank of Canada is responsible for the issuance and distribution of bank notes to eligible financial institutions (upon request), and for the removal of worn or torn notes from circulation. Coin is issued and distributed by the Royal Canadian Mint on behalf of the Minister of Finance. Each institution must estimate its Canadian note requirements based on what it expects its customers will need and must requisition the amount from the central bank. In turn, the Bank debits each bank’s deposit account maintained at the Bank.
THE BANK AS FISCAL AGENT
As fiscal agent to the Government, the Bank has a variety of functions. This includes the role of debt manager in issuing new securities, which is treated in greater detail below.
THE BANK OF CANADA

CANADIAN SECURITIES COURSE • VOLUME 15•12
© CSI GLOBAL EDUCATION INC. (2010)
The Bank administers the Government’s deposit accounts and funds. This includes (1) deposit accounts with the Bank of Canada and the chartered banks in which Government cash is held; and (2) the Exchange Fund Account, which holds the Government’s foreign exchange reserves. Almost all of the Government’s Canadian dollar receipts and expenditures flow through the account it maintains at the Bank of Canada.
The Bank manages Canada’s official international currency reserves. It operates for the Government in foreign exchange markets in keeping with its mandate “to control and protect the external value of the national monetary unit.”
The Bank of Canada Act empowers the Bank to:
• Buy and sell gold, silver and foreign exchange;
• Maintain deposits with other central banks and commercial banks inside and outside Canada; and
• Act as agent and depository for central banks and certain international institutions.
As is the case in connection with monetary policy and debt management, the Bank provides the Government with information and advice and acts as its agent in dealings in gold and foreign exchange.
The Bank acts as a depository for gold held by the Exchange Fund Account. It also buys and sells gold. This activity has diminished importance reflecting the marginal role of gold in securing the value of the Canadian dollar.
Financial advisor to the Government: The Bank advises the Government on the timing of new federal securities issues. It advises on the price, yield and other special features needed to make them marketable. The Bank also advises the Government about where such securities should be sold (i.e., domestically, in the U.S. or offshore). In order to keep abreast of market developments, the Bank conducts regular discussions with investment dealers, bankers and other investors to obtain views and suggestions.
Debt management: The Bank of Canada acts as the federal Government’s fiscal agent in its activities in debt management. The planning and arrangements necessary for a new debt issue are major undertakings. Not only must each issue be distributed and sold, arrangements for payments, transfers of funds, etc., must be made. Then there is regular record keeping, payments of interest, transfers of ownership and finally providing funds to repay the issue at maturity.
The Minister of Finance is responsible for debt management programs but relies on the Bank for advice and implementation of policy. While there is a wide range of maturities in Government debt, there are two principal categories of debt: marketable (treasury bills and marketable bonds) and non-marketable (Canada Savings Bonds and Canada RRSP Bonds). These securities are discussed in the material on fixed-income products.
In 1996, a special agency, known as Canada Investment and Savings (CI&S), was established by the Government to be responsible for that portion of the debt held by individuals (known as the Government’s retail debt). This agency handles the Canada Savings Bond (CSB) campaigns and the development of new retail products. The Bank of Canada continues to provide operations and systems support for CI&S programs.
FIVE • ECONOMIC POLICY 5•13
© CSI GLOBAL EDUCATION INC. (2010)
MONETARY POLICY
Monetary policy sets out to improve the performance of the economy by regulating the growth in money supply and credit. The goal of monetary policy is to ensure that money can play its vital role in helping the economy run smoothly. Canadian monetary policy strives to protect the value of the Canadian dollar by keeping inflation low and stable. As Canada’s central bank, the Bank of Canada achieves this through its influence over short-term interest rates.
The goal of monetary policy is to preserve the value of money by promoting sustained economic growth with price stability. In other words, growth in levels of employment, consumption and our standard of living generally should be supported by increasing liquidity in the system at a rate that is not inflationary. Over time, inflationary increases erode the value of our currency and ultimately our economic health.
Since 1991, the Bank has committed to specific inflation-control targets that establish a target range within which it aims to contain annual inflation as measured by the year-over-year rate of increase in the CPI. Currently, the target range extends from 1% to 3%. Here is how the Bank keeps inflation within this range:
• If infl ation approaches the top of the target range, this usually indicates that the demand for goods and services is rising too strongly and must be controlled through an increase in shortterm interest rates.
• If infl ation falls towards the bottom of the target range, this usually indicates that economic growth is slowing or weakening and support is needed through a decrease in interest rates.
Over the long run, the rate of inflation is linked to the rate of growth of money and credit. Through its influence over short-term interest rates, the Bank affects the demand for, and supply of, money and credit.
The influence of monetary policy on total spending is exerted indirectly and with some time lag – roughly one to two years. Monetary policy must therefore be forward looking. Thus, the Bank conducts monetary policy by consistently aiming their efforts at the midpoint of the target range. That is, by aiming for an inflation rate of 2% over the next 12-month period, the Bank believes it can achieve its inflation-control targets.
One should keep in mind, however, that complete reliance on monetary policy to achieve all economic goals cannot be expected. External economic developments often have an impact on policy objectives, especially for a country such as Canada, which is so dependent on foreign trade and investment.
Implementing Monetary PolicyThe Bank of Canada carries out monetary policy primarily through changes to what it calls the Target for the Overnight Rate. The overnight rate is the interest rate set in the overnight market – a marketplace where major Canadian financial institutions lend each other money on an overnight basis. When the Bank changes the target for the overnight rate, other short-term interest rates also usually change.
MONETARY POLICY
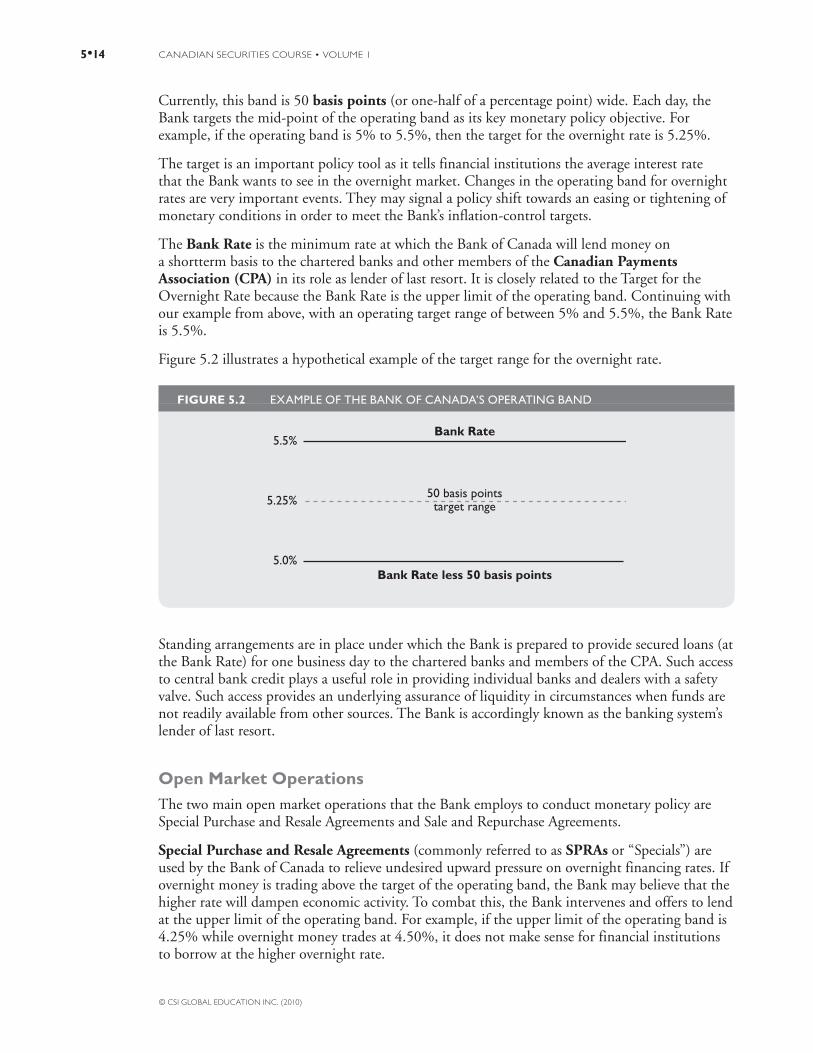
CANADIAN SECURITIES COURSE • VOLUME 15•14
© CSI GLOBAL EDUCATION INC. (2010)
Currently, this band is 50 basis points (or one-half of a percentage point) wide. Each day, the Bank targets the mid-point of the operating band as its key monetary policy objective. For example, if the operating band is 5% to 5.5%, then the target for the overnight rate is 5.25%.
The target is an important policy tool as it tells financial institutions the average interest rate that the Bank wants to see in the overnight market. Changes in the operating band for overnight rates are very important events. They may signal a policy shift towards an easing or tightening of monetary conditions in order to meet the Bank’s inflation-control targets.
The Bank Rate is the minimum rate at which the Bank of Canada will lend money on a shortterm basis to the chartered banks and other members of the Canadian Payments Association (CPA) in its role as lender of last resort. It is closely related to the Target for the Overnight Rate because the Bank Rate is the upper limit of the operating band. Continuing with our example from above, with an operating target range of between 5% and 5.5%, the Bank Rate is 5.5%.
Figure 5.2 illustrates a hypothetical example of the target range for the overnight rate.
FIGURE 5.2 EXAMPLE OF THE BANK OF CANADA’S OPERATING BAND
Bank Rate less 50 basis points
Bank Rate
50 basis pointstarget range
5.5%
5.25%
5.0%
Standing arrangements are in place under which the Bank is prepared to provide secured loans (at the Bank Rate) for one business day to the chartered banks and members of the CPA. Such access to central bank credit plays a useful role in providing individual banks and dealers with a safety valve. Such access provides an underlying assurance of liquidity in circumstances when funds are not readily available from other sources. The Bank is accordingly known as the banking system’s lender of last resort.
Open Market OperationsThe two main open market operations that the Bank employs to conduct monetary policy are Special Purchase and Resale Agreements and Sale and Repurchase Agreements.
Special Purchase and Resale Agreements (commonly referred to as SPRAs or “Specials”) are used by the Bank of Canada to relieve undesired upward pressure on overnight financing rates. If overnight money is trading above the target of the operating band, the Bank may believe that the higher rate will dampen economic activity. To combat this, the Bank intervenes and offers to lend at the upper limit of the operating band. For example, if the upper limit of the operating band is 4.25% while overnight money trades at 4.50%, it does not make sense for financial institutions to borrow at the higher overnight rate.

FIVE • ECONOMIC POLICY 5•15
© CSI GLOBAL EDUCATION INC. (2010)
SPRAs work as follows: the Bank offers to purchase government securities from a primary dealer (such as a chartered bank) with an agreement to sell them back the next day at a predetermined price. This operation is used to reinforce the upper limit or top end of the overnight target and is closely watched by market participants.
Sale and Repurchase Agreements (SRAs) are used to offset undesired downward pressure on overnight financing costs. If overnight money is trading below the target of the operating band, the Bank may believe that inflationary pressures in the economy will rise. To combat this, the Bank intervenes and offers to borrow at the lower limit of the operating band. For this example, if the lower limit of the operating band is 3.75% while overnight money trades at 3.50%, financial institutions would much prefer the Bank of Canada rate.
SRAs work as follows: the Bank offers to sell government securities to chartered banks with an agreement to repurchase them the next day at a predetermined price. This operation is used to reinforce lower the limit or floor of the operating band and is the focus of considerable market attention. On a number of occasions, the offering itself is sufficient to eliminate the downward pressure on the overnight rate. Partly as a result of this, the amounts of SRAs dealt tend to be quite small relative to SPRAs.
Figure 5.3 shows that SPRAs are conducted at the top end of the band, which is also the Bank Rate, while SRAs are conducted at the bottom end of the band.
FIGURE 5.3 THE OPERATING BAND
Bank Rate less 0.50%
Bank Rate
Operating Band = 50 basis points wide
SRA – the Bank sells securities at the lower end of the operating band
SPRA – the Bank lends overnight at the upper limit of the operating band
Instead of letting it vary from day to day depending on conditions in the market, the Bank aims to keep the overnight rate within its 50-basis-point range. Financial institutions know that the Bank will always lend money at the upper end of the band, and borrow money at the lower limit of the band. Thus it makes no sense to trade in the overnight market at rates outside this band. It repeatedly conducts similar operations to keep most of the overnight trading within the range. If the Bank is changing the range, it enters the market and conducts specials or SRAs at the new ceiling or floor. Alternatively, the Bank allows the overnight rate to move to its new range, then confirms the new target with open market operations.
CANADIAN SECURITIES COURSE • VOLUME 15•16
© CSI GLOBAL EDUCATION INC. (2010)
Changes in the overnight band (and therefore, the Bank Rate) are now accompanied by a press release explaining the Bank’s actions. The Bank’s intention is to make such changes as transparent (or clear) as possible to avoid confusion in financial markets.
Cash Management OperationsThe trend of the Bank Rate is important to both users and suppliers of credit. A rising trend, for example, signals a desire on the part of the Bank to reduce the demand for credit by raising its cost. Administered rates such as prime rates (i.e., chartered bank rates to their prime or most creditworthy borrowers) usually follow the trend of the Bank Rate.
Each day, billions of dollars flow through the financial system to settle transactions between the major financial institutions. These transactions include cheques, wire transfers, direct deposits, pre-authorized debits and bill payments.
To facilitate the transfer of these payments, the Bank established the Large Value Transfer System (LVTS) in 1991. This system allows participating financial institutions to conduct large transactions with each other through an electronic wire system. Among other things, this system permits these financial institutions to track their LVTS receipts and payments electronically throughout the day and to know the net outcome of these flows by the end of the day (same day settlement).
HOW THE LVTS WORKS
This system provides an important setting for conducting monetary policy. Throughout the day, financial institutions in the LVTS send payments back and forth to each other as part of their normal operations. At the end of each day, all of the transactions that occurred during the day are added up, and some financial institutions may end up needing to borrow funds while some may have funds left over.
For example, Bank A had $50 million in payments to other financial institutions and $40 million in receipts during the day. At the end of the day, it finds itself in a deficit position of $10 million for that day. Since participants in the LVTS are required to clear their balances with one another each day, Bank A will need to borrow $10 million in funds to cover that position. Bank A will then need to borrow the funds from another participant in the LVTS at the current overnight rate.
Overall, the LVTS helps to ensure that trading in the overnight market stays within the Bank’s 50- basis-point operating target. LVTS participants know that the Bank will always lend money at the upper limit of the band, and will borrow money at the lower limit of the band. Therefore, it does not make sense for financial institutions in the LVTS to borrow or lend outside of the target band.
DRAWDOWNS AND REDEPOSITS
The federal government maintains accounts with the Bank of Canada and the chartered banks. As the banker for the federal government, the Bank of Canada can transfer funds from the government’s account at the Bank to its account at the chartered banks or from the government’s account at the chartered banks to its account at the Bank of Canada. This strategy is used to influence short-term interest rates and is achieved using drawdowns or redeposits.
FIVE • ECONOMIC POLICY 5•17
© CSI GLOBAL EDUCATION INC. (2010)
• A drawdown refers to the transfer of deposits to the Bank from the chartered banks, effectively draining the supply of available cash balances from the banking system. This decreases deposits and reserves available to the banks to utilize in their business. Removing money from the system causes a contraction in the availability of loans to consumers and businesses, and this places upward pressure on interest rates.
• A redeposit is just the opposite, a transfer of funds from the Bank to the chartered banks. This increases deposits and reserves and the availability of funds in the banking system. Adding money to the system places downward pressure on interest and gives banks an incentive to increase loans to consumers and businesses.
GOVERNMENT POLICY CHALLENGES
Disagreements about the role and nature of government policy are often related to basic differences in analyzing how the economy reacts to changing circumstances. Two attitudes are widespread. The first emphasizes that the economy may be slow to react. As a consequence, interventionist policy may not be effective or even essential in guiding the economy in the right direction. The alternative view emphasizes that the economy makes its way quickly to its natural equilibrium, and that no need exists for policy other than to constrain policy.
This difference, for example, is at the heart of the controversy surrounding the role of money growth. Monetary policy may be seen to be effective in the short run but not in the long run. What is unknown is how long is the short run.
Two sections in Chapter 4 dealt with the evolution of the economy in this framework. The discussion of the short run emphasized the business cycle and the problems posed by downturns in the cycle. The second dealt with the determinants of long-run growth and emphasized the role of technological development in supporting continued gains in productivity. Government policy in the first context is directed towards counter-cyclical initiatives, and in the second context to the development of human capital and the enhancement of technological advances.
In recent years, the federal government has dealt successfully with reducing the deficit to the extent that there is some fiscal room to manoeuvre. Ultimately, the policy challenge for the government is to evaluate the competing claims of those who stress the need for intervention and flexible stabilization policies versus those with a more restrictive view of the role of government in guiding the economy. Each choice has both growth and uncertainty implications for the overall Canadian economy, and for the financial investments issued by both governments and corporations.
GOVERNMENT POLICY CHALLENGES

CANADIAN SECURITIES COURSE • VOLUME 15•18
© CSI GLOBAL EDUCATION INC. (2010)
The Consequences of Failed Fiscal PolicyIn the past, governments’ failure to address their budget deficits have had several consequences:
• Because governments did not eliminate the deficit when it first emerged seriously in the late 1970s and early 1980s, the cost of interest payments on the national debt began to rise rapidly and remained high through the early 1990s. They were the federal government’s single biggest expenditure throughout most of the 1990s, peaking at 27.1% of total spending in 1998–1999, compared to 10.3% in 1974–1975. In turn, the interest burden made it difficult for the government to reduce the deficit. It did so by drastically cutting total expenditures, especially transfer payments to the provinces. Successive budget surpluses in the 2000s helped to lower the federal government’s overall debt position, with the cost of interest payments falling to about 13% of total expenditures in the government’s 2008-2009 fiscal year.
• Fiscal policy is often unsynchronized with monetary policy, increasing the cost to the economy. For example, in the late 1980s when the economy was growing strongly and infl ationary pressure was building, federal and provincial governments in Canada continued to run large defi cits. This tended to increase infl ationary pressures and led the Bank of Canada to raise interest rates more than would otherwise have been necessary. In turn, the cost of servicing government debts grew and contributed to increased defi cits.
• In the end, a large national debt constrains the ability of governments to run counter-cyclical fi scal policy. When debts are large, any move to increase the defi cit upsets investors, who sell bonds, driving up interest rates. This reaction reduces the benefi cial impact on the economy of the increased defi cit. When a recession occurs, the government may cut spending and raise taxes to control its growth and, as a consequence, worsen the recession.

FIVE • ECONOMIC POLICY 5•19
© CSI GLOBAL EDUCATION INC. (2010)
SUMMARY
After reading this chapter, you should be able to:
1. Compare and contrast the rational, Keynesian, monetarist and supply-side theories of the economy.
• The rational expectations theory suggests that fi rms and workers are rational thinkers and can evaluate all the consequences of a government policy decision, thereby neutralizing its intended impact.
• Keynesian economics advocates the use of direct government intervention to achieve economic growth and stability. Keynesians believe the use of active fi scal policy, using government spending and taxation, is necessary to stabilize the business cycle.
• Monetarist theory suggests that the economy is inherently stable, with its own self-adjusting mechanism that automatically moves the economy to a stable path of growth. Monetarists argue against the use of active monetary or fi scal policy and believe the central bank should simply expand the money supply at a rate equal to the economy’s long-term growth rate.
• Supply-side economics suggests that to foster an environment of prosperity, the market should be left alone and government intervention should be minimal, only occurring through changes in tax rates. This theory maintains that lower government spending and lower taxes provide the stimulus for economic expansion.
2. Analyze the mechanisms by which governments establish fi scal policy and evaluate the impacts of fi scal policy on the economy.
• Fiscal policy is the use of government spending and taxation to pursue full employment and sustained long-term growth. In general, governments pursue this goal by spending more and taxing less when the economy is weak, and by spending less and taxing more when the economy is strong.
• In Canada, the federal budget is the key mechanism through which the government conducts fi scal policy. The budget contains projections for the coming year for spending, revenue, and the amount of the projected surplus or defi cit.
SUMMARY

CANADIAN SECURITIES COURSE • VOLUME 15•20
© CSI GLOBAL EDUCATION INC. (2010)
3. Explain the role and functions of the Bank of Canada.
• The role of the Bank of Canada is to monitor, regulate and control short-term interest rates and the external value of the Canadian dollar.
• The major functions of the Bank of Canada include the issue and removal of bank notes, acting as fi scal agent and fi nancial advisor for the Federal Government, and the implementation of monetary policy.
• The goal of monetary policy is to improve the performance of the economy by regulating growth in the money supply and credit. The Bank of Canada achieves this through its infl uence over short-term interest rates.
4. Analyze how the Bank of Canada implements and conducts monetary policy.
• In Canada, monetary policy involves following specifi c infl ation-control targets that establish a range within which to contain annual infl ation. Currently, the target range is 1% to 3%.
• The Bank uses the target for the overnight rate to implement changes in the direction of monetary policy. The overnight rate is the interest rate set in the overnight market. When the Bank changes the target for the overnight rate, other short-term interest rates also tend to change.
• Special Purchase and Resale Agreements (SPRAs) and Sale and Repurchase Agreements (SRAs) are the two main open market operations used by the Bank to conduct monetary policy.
– SPRAs are used to relieve undesired upward pressure on the overnight rate. If overnight money trades above the target of the operating band, the Bank intervenes and offers to lend at the upper limit of the band. This action effectively reinforces the upper limit of the overnight target.
– SRAs are used to offset undesired downward pressure on the overnight rate. If overnight money is trading below the target of the operating band, the Bank intervenes and offers to borrow at the lower limit of the band. This action effectively reinforces the lower limit of the overnight target.
• The Bank established the Large Value Transfer System (LVTS) in 1991 to facilitate its cash management operations. This system allows participating fi nancial institutions to conduct large transactions with each other through an electronic wire system. This system provides an important setting to conduct monetary policy.
• A drawdown is the transfer of deposits to the Bank from the chartered banks, effectively draining the supply of available cash balances from the banking system. This causes a contraction in the availability of loans to consumers and businesses, which places upward pressure on interest rates.
• A redeposit is the transfer of funds from the Bank to the chartered banks, effectively increasing deposits and reserves and the availability of funds in the banking system, which places downward pressure on interest rates.
FIVE • ECONOMIC POLICY 5•21
© CSI GLOBAL EDUCATION INC. (2010)
5. Discuss the challenges governments face in their fi scal and monetary policies and the consequences of failed policy.
• One challenge the government faces is that the economy may be slow to react to policy changes. As a consequence, interventionist policy may not be effective or even essential in guiding the economy in the right direction.
• A second challenge is the view that the economy makes its way quickly to its natural equilibrium, and that no need exists for policy other than to constrain policy.
• Interest payments on the national debt were the federal government’s single biggest expenditure throughout most of the 1990s. However, successive budget surpluses in the late 2000s helped to lower the federal government’s overall debt position.
• Fiscal and monetary policies are often unsynchronized, increasing the cost to the economy. The late 1980s saw rising provincial and federal defi cits at a time when the economy was growing strongly and infl ationary pressure was building.
• The Bank of Canada responded by raising interest rates, which resulted in higher debt servicing costs for governments.
Now that you’ve
completed this
chapter and the
on-line activities,
complete this
post-test.


© CSI GLOBAL EDUCATION INC. (2010)
SECTION III
Investment Products


© CSI GLOBAL EDUCATION INC. (2010) 6•1
Chapter 6
Fixed-Income Securities: Features and Types
© CSI GLOBAL EDUCATION INC. (2010)6•2
6
Fixed-Income Securities: Features and Types
CHAPTER OUTLINE
The Fixed-Income Marketplace• The Rationale for Issuing Fixed-Income Securities• Size of the Fixed-Income Market
Fixed-Income Terminology and Features• Interest on Bonds• Face Value and Denomination• Price and Yield• Term to Maturity• Liquid Bonds, Negotiable Bonds and Marketable Bonds• Callable Bonds• Sinking Funds and Purchase Funds• Extendible and Retractable Bonds• Convertible Bonds and Debentures• Protective Provisions of Corporate Bonds
Government of Canada Securities• Marketable Bonds• Treasury Bills• Canada Savings Bonds

© CSI GLOBAL EDUCATION INC. (2010) 6•3
Provincial and Municipal Government Securities• Guaranteed Bonds• Provincial Securities• Municipal Securities
Corporate Bonds• Mortgage Bonds• Collateral Trust Bonds• Equipment Trust Certifi cates• Subordinated Debentures• Floating-Rate Securities• Corporate Notes• Strip Bonds• Domestic, Foreign and Eurobonds• Preferred Securities
Other Fixed-Income Securities• Bankers’ Acceptances• Commercial Paper • Term Deposits• Guaranteed Investment Certifi cates
Bond Quotes and Ratings
Summary
LEARNING OBJECTIVES
By the end of this chapter, you should be able to:
1. Describe the fi xed-income market and discuss the rationale for issuing debt instruments.
2. Defi ne the terms used in transactions involving bonds, describe bond features, explain the use of a sinking fund and a purchase fund, and describe the protective provisions found in a bond indenture.
3. Compare and contrast the types of Government of Canada securities.
4. Compare and contrast the different types of provincial government securities and municipal debentures.
5. Identify the different types of corporate bonds and describe their features.
6. Describe the features of term deposits and guaranteed investment certifi cates.
7. Interpret bond quotes and summarize and evaluate bond ratings.
© CSI GLOBAL EDUCATION INC. (2010)6•4
INVESTING IN DEBT
Governments, corporations and many other entities borrow funds to finance and expand their operations. In addition to bank lending and private loans, these entities also have the option of issuing fixed-income securities in the financial markets. From the investor’s perspective, purchasing a fixed-income security essentially represents the decision to lend money to the issuer. Investors become creditors of the issuing organization and do not gain ownership rights as they would with an equity investment.
Many investors overlook the fixed-income market. Trading activity on the TSX and other international stock markets grabs most of the investing public’s attention. Trading in bonds, Treasury bills and other fixed-income securities tends to be less enticing because there are not the very public price spikes that are seen in, for example, the shares of Nortel or Microsoft.
Most investors would be surprised to learn the extent of the fixed-income market. To put it in perspective, the dollar amount traded on Canada’s bond markets consistently averages about ten times that of total equity trading in any given year. In spite of that value and because they are less visible than the equity markets, bond and fixed-income markets generally remain off the radar screens of most investors. Further, investors generally lack an understanding of the features, characteristics and terminology of the fixed-income market.
In this first chapter on fixed-income securities, we look at the terminology, describe the reasons governments and corporations issue fixed-income securities, and describe the features and characteristics of the securities available in the fixed-income markets.
In the on-line Learning Guide for this module,
complete the Getting Started
activity.

© CSI GLOBAL EDUCATION INC. (2010) 6•5
KEY TERMS
After-acquired clause
Bond
Callable bond
Canada Savings Bonds (CSBs)
Canada yield call
Collateral trust bond
Conversion price
Convertible bonds
Coupon rate
Debenture
Dominion Bond Rating Service
Election period
Equipment trust certifi cate
Eurobonds
Extendible bonds
Extension date
Face value
First mortgage bond
Fixed-income securities
Floating-rate securities
Forced conversion
Foreign bonds
Guaranteed Investment Certifi cates (GICs)
Instalment debenture
Maturity date
Moody’s Canada Inc.
Mortgage
Par value
Payback period
Principal
Purchase fund
Real return bonds
Redeemable bond
Retractable Bond
Serial bond
Sinking funds
Standard & Poor’s Bond Rating Service
Strip Bond
Subordinated debentures
Term to maturity
Treasury bills
Trust deed
Yield
Zero coupon bond

CANADIAN SECURITIES COURSE • VOLUME 16•6
© CSI GLOBAL EDUCATION INC. (2010)
THE FIXED-INCOME MARKETPLACE
Fixed-income securities represent debt of the issuing entity. The terms of a fixed-income security include a promise by the issuer to repay the maturity value or principal on the maturity date, and to pay interest either at stated intervals over the life of the security or at maturity. In most case, if the security is held to maturity, the rate of return is fairly certain.
Fixed-income securities trading in the market today come in a multitude of varieties, including bonds, debentures, money market instruments, mortgages, and even preferred shares, reflecting widely different borrowing needs as well as investor demands. Borrowers modify the terms of a basic fixed-income security to suit both their needs and costs, and to provide acceptable terms to various lenders.
Many Canadians are concerned about high government debt levels. We know that corporate debt can lead to bankruptcy and personal debt can keep individuals from getting ahead financially. It is useful to explore the rationale for borrowing money. There are two main reasons:
• To fi nance operations or growth
• To take advantage of operating leverage
If a government spends more on programs and other payments than it receives in tax revenue, it must make up the difference by borrowing money. Most governments borrow by issuing fixed-income securities. Government borrowing is an example of issuing fixed-income securities to finance operations.
The Rationale for Issuing Fixed-Income SecuritiesUnlike governments, companies have more options when they find themselves spending more on expenses than they receive in revenue; issuing fixed-income securities is only one option. They can also use cash on hand, raise cash by selling assets, borrow from the bank, or issue equity securities. The choice of financing method will depend on the costs associated with each. Companies generally prefer to raise money from the lowest-cost source possible.
In many cases, companies do not issue fixed-income securities to finance year-to-year cash shortfalls. These will usually be financed with cash on hand or bank borrowing. A company that consistently finds itself using more cash than it takes in will not be in business for too long.
Most companies issue fixed-income securities to finance growth. This usually means using the proceeds of a fixed-income issue to add to or expand the companies’ current operations, or to buy other companies. When companies announce a new bond issue, they usually say why they are issuing the bond. If it is not being issued to buy another company or other specific assets, they will usually state that the proceeds will be used for “general corporate purposes.” This usually means that the company will invest the proceeds in current operations.
Companies also borrow to take advantage of operating leverage. If companies believe they can earn a greater return on cash invested in their business than it would cost to borrow money, they can increase the return on shareholders’ equity by borrowing money. This is what is meant by financial leverage. The analysis that determines whether to use leverage is made on an after-tax basis. This increases the leverage potential of bonds because, unlike dividends on equity securities, the interest payments on bonds are a tax-deductible expense for the corporation.
SIX • FIXED-INCOME SECURITIES: FEATURES AND TYPES 6•7
© CSI GLOBAL EDUCATION INC. (2010)
Example: Suppose a company wants to open a new plant to increase production capacity. It could borrow $1 million for the plant at 10% interest, at a cost of $50,000 a year after tax. If the expanded capacity is expected to increase after-tax profi ts by more than $50,000 a year, the company will probably proceed with the project. If the after-tax profi ts are projected to be less than $50,000 a year, the company will either abandon the project or fi nd a cheaper source of funds.
Size of the Fixed-Income MarketPerhaps because it is not as highly publicized as the stock market, many people do not realize just how large the fixed-income market really is. For example, a total of $250.9 billion in new debt was issued in 2009, and this was almost 60% higher than the previous low of $157 billion raised in 2008. Furthermore, Canadian secondary market debt trading in 2009 totalled $6.1 trillion, or approximately 5 times the total equity trading of $1.2 trillion and over 4.5 times Canada’s GDP of nearly $1.34 trillion.
FIXED-INCOME TERMINOLOGY AND FEATURES
A bond is a long-term, fixed-obligation debt security that is secured by physical assets. The details of a bond issue are outlined in a trust deed and written into a bond contract. Bonds are considered fixed-income securities because they impose fixed financial obligations on issuers – the payment of regular interest payments and the return of principal on the date of maturity. If the bond goes into default, which means the issuer can no longer meet these fixed obligations, the trust deed provisions allow the bondholders to seize specified physical assets and sell them to recover their investment. These physical assets could be a building, a railway car, or any other physical property owned by the issuing company.
A debenture is a type of bond that promises the payment of regular interest and the repayment of principal at maturity but may be secured by something other than a physical asset. For this reason, debentures are also referred to as unsecured bonds. In contrast to regular bonds, debentures are typically secured by a general claim on residual assets or by the issuer’s credit rating.
In this chapter, we follow the industry practice of referring to both types as bonds, unless the difference is important. For example, government bonds are never secured by physical assets, and so technically are really debentures, but in practice they are always referred to as bonds.
Interest on BondsMany bonds pay regular interest at a rate known as the coupon rate. The coupon rate may be fixed, such as 6% a year, or may be variable and will change in reference to a benchmark interest rate. Bonds with variable coupon rates are typically referred to as floating-rate securities. The coupon indicates the income that the bond investor will receive from holding the bond, and is also referred to as interest income, bond income or coupon income.
CANADIAN SECURITIES COURSE • VOLUME 16•8
© CSI GLOBAL EDUCATION INC. (2010)
Interest payment provisions may also take other forms:
• Coupon rates can change over time, according to a specifi c schedule (e.g., step-up bonds, most savings bonds).
• There may be no periodic coupon interest – interest can be compounded over time, and paid at maturity (e.g., zero-coupon bonds, strip coupons and residuals).
• A rate of interest does not have to be applied – the loan can be compensated in the form of a return based on future factors, such as the change in the level of an equity index. These securities are known as index-linked notes.
In North America the majority of bonds pay interest twice a year at six-month intervals. Other bonds may pay interest monthly or annually. In all cases, the amount of interest at each payment date is equal to the coupon rate divided by the number of payments per year.
Example: A $1,000, 6%, semi-annual coupon bond due May 1, 2024 will pay $30 to the bondholder on May 1 and on November 1 of each year until maturity. The semi-annual payment of $30 represents the fi xed obligation the issuer is required to make for the life of the bond.
Face Value and DenominationThe amount the bond issuer contracts to pay at maturity (the maturity value) is known as the face or par value. These terms are also used to describe the maturity value of each bond holder’s position.
Bonds can be purchased only in specific denominations. The most commonly used denominations are $1,000 or $10,000. Larger denominations may be issued to suit the preference of investing institutions such as banks and life insurance companies. Normally, an issue designed for a broad retail market is issued in small denominations. An issue for institutional investors may be made available in denominations of millions of dollars.
To accommodate smaller investors, Canada Savings Bonds are issued in denominations as small as $100. The smallest corporate bond denomination is usually $1,000.
Price and YieldAfter being issued, bonds are bought and sold between investors in the secondary market at a stated price and a quoted yield.
Bond prices are quoted using an index with a base value of 100. A bond trading at 100 is said to be trading at face value, or par. A bond trading below par, say at a price of 98, is said to be trading at a discount (the 98, based on the index of 100, indicates the bond is trading at 98% of par). A bond trading above par, say at a price of 104, is said to be trading at a premium.
Example: If you buy a bond with a $10,000 face value at a price of 95, it will cost you $9,500. This is equal to the face value ($10,000) multiplied by the price divided by 100 (95/100 = 0.95). If you paid 105 for the bond, it would cost you $10,500, or $10,000 multiplied by (105/100).
Given the price of a bond, it is possible to calculate a yield for the bond. For most bonds, the yield is an approximate measure of the annual return on the bond if it is held to maturity.

SIX • FIXED-INCOME SECURITIES: FEATURES AND TYPES 6•9
© CSI GLOBAL EDUCATION INC. (2010)
For example, if you bought a bond with a yield of 5% and held it to maturity, your annual return would be approximately 5%.
The yield of a bond should not be confused with the coupon rate; they are two different things. Given the yield and the coupon rate, the following relationships hold:
• If the yield is greater than the coupon rate, the bond is trading at a discount.
• If the yield is equal to the coupon rate, the bond is trading at par.
• If the yield is less than the coupon rate, the bond is trading at a premium.
Term to MaturityThe maturity date is the date at which the bond matures, or expires, and the principal is paid back to the investor holding the bond at maturity. The remaining life of a bond is called its term to maturity.
Example: if a bond was issued three years ago with a term of ten years, it is no longer referred to as a ten-year bond. Because three years have passed and only seven remain in the life of the bond, it is referred to as a seven-year bond.
Bonds can be grouped into three categories according to their term to maturity. Short-term bonds have less than five years remaining in their term. Bonds with terms of five to ten years are called medium-term bonds, and long-term bonds have a term to maturity greater than ten years. Table 6.1 shows these categories.
TABLE 6.1 CATEGORIZATION OF BONDS BY TERM TO MATURITY
Money Market Short-Term Bonds Medium-Term Bonds Long-Term Bonds
Up to one year From one to 5 years From 5 to 10 years Greater than 10 years
term to maturity remaining to maturity remaining to maturity remaining to maturity
Money market securities are a special type of short-term fixed-income security, generally with terms of one year or less. Certain high-grade short-term bonds may trade as money market securities when their term is reduced to a year or less, but for the most part, money market securities include Treasury bills, bankers’ acceptances and commercial paper.
Liquid Bonds, Negotiable Bonds and Marketable BondsLiquid bonds are bonds that trade in significant volumes and for which it is possible to make medium and large trades quickly without making a significant sacrifice on the price.
Negotiable bonds are bonds that can be transferred because they are in deliverable form (in “good delivery” means the certificates are not torn, a power of attorney has been signed, and so on). That a bond be negotiable is not much of an issue anymore, as most bonds are book-based now and certificates are not issued.

CANADIAN SECURITIES COURSE • VOLUME 16•10
© CSI GLOBAL EDUCATION INC. (2010)
Marketable bonds are bonds for which there is a ready market. For example, a private placement or other new issue may be marketable (clients will buy it) because its price and features are attractive. It would not necessarily be liquid, however, since most private placements do not have an active secondary market.
Callable BondsBond issuers often reserve the right, but not the obligation, to pay off the bond before maturity, either to take advantage of lower interest rates, or simply to reduce their debt when they have the excess cash to do so. This privilege is known as a call or redemption feature. A bond bearing this clause is known as a callable bond or a redeemable bond. As a rule, the issuer agrees to give 10 to 30 days’ notice that the bond is being called or redeemed.
In Canada, most corporate and provincial bond issues are callable. Government of Canada bonds and municipal debentures are usually non-callable.
STANDARD CALL FEATURES
A standard call feature allows the issuer to call bonds for redemption at a specified price on specific dates or during specific intervals over the life of the bond. The call price is usually set higher than the par value of the bond. This provides a premium payment for the holder, as it is somewhat unfair to take away from the investor an investment from which he or she expected to receive a stated income for a certain number of years. The closer the bond is to its maturity date before it is redeemed, the less the hardship for the investor. In recognition of this principle, the redemption price is often set on a graduated scale and the premium payment becomes lower as the bond approaches the maturity date.
Provincial bonds are usually callable at 100 plus accrued interest. Accrued interest refers to the interest that has accumulated since the last interest payment date. Accrued interest belongs to the holder of the bond.
Example: CHC Helicopter’s call feature (for other than sinking fund purposes) is shown in Table 6.2. In this example, if you owned a $1,000 debenture of this issue and your debenture was called:
• after May 1, 2009, and before or on April 30, 2010, you would receive $1,036.88 plus accrued interest;
• after May 1, 2010 and before or on April 30, 2011, you would receive $1,024.58 plus accrued interest; and
• so on, with the premium gradually reduced according to Table 6.2.

SIX • FIXED-INCOME SECURITIES: FEATURES AND TYPES 6•11
© CSI GLOBAL EDUCATION INC. (2010)
TABLE 6.2 EXAMPLE OF A CORPORATE DEBT CALL FEATURE
CHC Helicopter 7.375% debentures due May 1, 2014. Not redeemable before May 1, 2009. Thereafter, redeemable on 30 days’ notice up to the 12 months ending May 1 of each year, as follows:
2009 103.68
2010 102.46
2011 101.23
2012 100.00
Thereafter redeemable at par to maturity.
For callable bonds, the period before the first possible call date (during which the bonds cannot be called) is known as the call protection period.
CANADA YIELD CALLS
Most corporate bonds are issued with a call feature known as a Canada yield call. These allow the issuer to call the bond at a price based on the greater of (a) par or (b) the price based on the yield of an equivalent-term Government of Canada bond plus a yield spread. A yield spread is simply an additional amount of yield. Generally, this spread is less than what the spread was when the bond was issued, and remains constant throughout the term of the issue.
Example: A 10-year corporate bond is issued at par with a coupon and yield of 7%, which represents a yield spread of 200 basis points above the current 5% yield on 10-year Canada bonds. (A basis point equals one one-hundredth of a percentage point.) The corporate bond contains a Canada yield call of +50, meaning that the bond can be called at a price based on a yield of 50 basis points over Canada bonds, with a minimum call price of par.
The following year, with 9-year Canada bonds yielding 4.75%, the company decides to call the bonds. Given the Canada yield call of +50, the company must call the bonds at a price based on a yield of 5.25% (which is 4.75% + 0.50%), regardless of where the bonds have been trading in the market before the call. At 5.25%, the price of this 9-year, 7% coupon bond would be $112.42 per $100 par value (This calculation is explained in Chapter 7, Calculating the Fair Price of a Bond).
Sinking Funds and Purchase FundsSome issuers must repay portions of their bonds for redemption before maturity, either by calling them on a fixed schedule of dates (via a sinking fund obligation) or by buying them in the secondary market when the trading price is at or below a specified price (through a purchase fund).
Some corporate bonds have a mandatory call feature for sinking fund purposes. Sinking funds are sums of money that are set aside out of earnings each year to provide for the repayment of all or part of a debt issue by maturity. Sinking fund provisions are as binding on the issuer as any mortgage provision.
CANADIAN SECURITIES COURSE • VOLUME 16•12
© CSI GLOBAL EDUCATION INC. (2010)
Example: ABC 6.89% debentures, due June 17, 2015, have a mandatory sinking fund. The company must retire $1,000,000 of the principal amount on June 17 every year, from 2011 to 2015 inclusive. Any debentures purchased or redeemed by the company other than through the sinking fund can be paid to the trustee as part of the sinking fund obligation. The debentures are redeemable for sinking fund purposes at the principal amount plus accrued interest to the date specifi ed.
Some companies have a purchase fund instead of a sinking fund. Under such an arrangement, a fund is set up to retire a specified amount of the outstanding bonds or debentures through purchases in the market, if these purchases can be made at or below a stipulated price. Occasionally, a bond will have both a sinking fund and a purchase fund.
Example: DEF Inc. 5.5% debentures, due April 15, 2031, have a purchase fund. Beginning on July 1, 2011, the company must make all reasonable efforts to purchase at or below par 1.125% of the aggregate principal amount during each quarter. The purchase fund normally retires less of an issue than a sinking fund.
Extendible and Retractable BondsSome corporate bonds are issued with extendible or retractable features.
Extendible bonds and debentures are usually issued with a short maturity term (usually five years), but with an option for the investor to exchange the debt for an identical amount of longer-term debt (usually ten years) at the same or a slightly higher rate of interest by the extension date. In effect, the maturity date of the bond can be extended so that the bond changes from a short-term bond to a long-term bond.
Example: GHI International Inc. 7% Extendible Junior Bonds, Series B2.1, due July 26, 2015, are extendible to July 26, 2035 from July 26, 2015 at a rate of 7.125%.
Retractable bonds are the opposite of extendible bonds. These bonds are issued with a long maturity term (usually at least ten years), but give investors the right to turn in the bond for redemption at par several years sooner (usually five years) by the retraction date.
Example: JKL Inc. 4% bonds due June 30, 2025, are retractable at par on June 30, 2015.
With both extendible and retractable bonds, the decision to exercise the maturity option must be made during a time period called the election period. In the case of an extendible bond, the election period may last from a few days to six months or more, before the short maturity date. During the election period, the holder must notify the appropriate trustee or agent of the debt issuer either to extend the term of the bond or to allow it to mature on the earlier date. If the holder takes no action, the bond automatically matures on the earlier date and interest payments cease.
In the case of a retractable bond, if the holder does not notify the trustee or agent before the retraction date of his or her decision to shorten the term of the bond, the debt remains a longer term issue.

SIX • FIXED-INCOME SECURITIES: FEATURES AND TYPES 6•13
© CSI GLOBAL EDUCATION INC. (2010)
Convertible Bonds and DebenturesConvertible bonds and debentures combine certain advantages of a bond with the option of exchanging the bond for common shares. In effect, a convertible security allows an investor to lock in a specific price (the conversion price) for the common shares of the company. The right to exchange a bond for common shares on specifically determined terms is called the conversion privilege.
Convertibles have the characteristics of regular bonds, in that they have a fixed interest rate and there is a definite date upon which the principal must be repaid. They offer the possibility of capital appreciation through the right to convert the bonds into common shares at the holder’s option at stated prices over stated periods.
WHY CONVERTIBLES ARE ISSUED
The addition of a conversion privilege makes a bond more saleable or attractive to investors. It tends to lower the cost of the money borrowed and may enable a company to raise equity capital indirectly on terms more favourable than those possible through the sale of common shares.
Convertibles can also be used to interest investors in providing capital for companies if investors would not otherwise be interested in buying relatively low-yielding or non-dividend paying common shares.
The convertible bond permits the holding of a two-way security. In other words, it combines much of the safety and certainty of the income earned on a bond with the option to convert it into common shares and benefit from any increase in their value. The convertible has a special appeal for the investor who:
• Wants to share in the company’s growth while avoiding any substantial risk; and
• Is willing to accept the lower yield of the convertible in order to have a call on the common shares.
CHARACTERISTICS OF CONVERTIBLES
For most convertible bonds, the conversion price is gradually raised over time to encourage early conversion. A properly drawn trust deed provides that, if the common shares of the company are split, the conversion privilege will be adjusted accordingly. This is known as protection against dilution.
Convertible bonds may normally be converted into stock at any time before the conversion privilege expires. However, some convertible debenture issues have a clause in their trust deeds that stipulates “no adjustment for interest or dividends.” This clause excuses the issuing company from having to pay any accrued interest on the convertible bond that has built up since the last designated interest payment date. Similarly, any common stock received by the bond holder from the conversion will normally entitle the holder only to dividends declared and paid after the conversion takes place.
Convertibles are normally callable, usually at a small premium and after reasonable notice.

CANADIAN SECURITIES COURSE • VOLUME 16•14
© CSI GLOBAL EDUCATION INC. (2010)
FORCED CONVERSION
Forced conversion is an innovation built into certain convertible debt issues to give the issuing company more scope in calling in the debt for redemption. This redemption provision usually states that once the market price of the common stock involved in the conversion rises above a specified level and trades at or above this level for a specific number of consecutive trading days, the company can call the bonds for redemption at a stipulated price. The price is much lower than the level at which the convertible debt would otherwise be trading, because of the rise in the price of the common stock.
This provision is an advantage to the issuing company rather than to the debt holder, because forced conversion can improve the company’s debt-equity ratio and make new debt financing possible. However, it is not so disadvantageous to the debt holder that it detracts from an issue when it is first sold. Once the price of the convertible debt rises above par, subsequent prospective buyers should check the spread between the prevailing purchase price and the possible forced conversion level.
Example: The 7% convertible bonds of RFC Inc. that are due February 28, 2015, have a forced conversion clause. Before February 28, 2015, the bonds are convertible into 44.033 common shares for each $1,000 of face value. This gives them a conversion price of $22.71 a common share ($1,000/44.033). The bonds are not redeemable before March 1, 2011. The company has the option to pay the principal amount on redemption or maturity, or to pay the investor in common shares. The number of common shares will be obtained by dividing $1,000 by 95% of the weighted average trading price for 20 consecutive trading days on the TSX, ending fi ve days before maturity or the date fi xed for redemption.
This is considered to be a forced conversion clause, because the client must choose whether to convert the bond into common shares at $22.71 a share or accept the company’s redemption offer, which could force the investor to pay a considerably higher price per share. For example, if the weighted average price was $27, the company would divide $1,000 by $25.64 (95% of $27) to arrive at 39 shares. The investor would receive 39 shares, compared to 44.033 shares if they had chosen to convert before the forced conversion was imposed by the issuer.
MARKET BEHAVIOUR OF CONVERTIBLES
The market price of convertible bonds is influenced by their investment value as a fixed-income security and by the price of the common shares into which they can be converted. When the stock price of the issuing company is below the conversion price, the convertible behaves like any other fixed-income security with the same credit rating, term to maturity, yield, etc. However, because these debentures can be converted into common shares, their price behaves differently than comparable fixed-income securities when the price of the underlying stock rises above the conversion price. The conversion price is the bond price divided by the number of shares the debenture can be converted in to.
Let’s take an ABC 6% convertible bond that trades at $980 and can be converted into 40 ABC common shares that currently trade at $22 a share. Even if interest rates rise sharply and comparable bond prices fall, the ABC bond will have a conversion value of $880 because it can be converted into 40 common shares that trade at $22 (40 × $22 = $880).
The same holds true if the price of the ABC common shares starts to rise. If the common shares now trade at $27, the price of the bond will rise accordingly to $1,080, even if comparable bonds still trade at $980. The reason is simple: the investor holds a security that can be sold today for $1,080 (40 × $27) if converted.

SIX • FIXED-INCOME SECURITIES: FEATURES AND TYPES 6•15
© CSI GLOBAL EDUCATION INC. (2010)
The conversion price is the bond price divided by the number of shares the debenture can be converted in to. In this example, the conversion price of the ABC convertible is $24.50 ($980/40). The price of the bond will follow comparable bonds if the ABC common shares trade below the conversion price and will follow the underlying stock if the price of the stock rises above the conversion price.
Protective Provisions of Corporate BondsIn addition to principal repayment features, corporate bonds may also have general covenants that secure the bond and make it more likely that the investor will receive all that he or she is due. These clauses are called protective provisions or covenants, and are essentially safeguards in the bond contract to guard against any weakening in the security holder’s position. The object is to create a strong instrument that does not force the company into a financial straitjacket
Some of the more common protective covenants found in Canadian corporate bonds are listed below:
• Security: In the case of a mortgage, or asset-backed or secured debt, this clause includes details of the assets that support the debt.
• Negative Pledge: This clause provides that the borrower will not pledge any assets if the pledge results in less security for the debt holder.
• Limitation on Sale and Leaseback Transactions: This clause protects the debt holder against the fi rm selling and leasing back assets that provide security for the debt.
• Sale of Assets or Merger: This clause protects the debt holder in the event that all of the fi rm’s assets are sold or that the company is merged with another company, forcing either the retiring of the debt or its assumption by the new merged company.
• Dividend Test: This provision establishes the rules for the payment of dividends by the fi rm and ensures equity will not be drained by excessive dividend payments.
• Debt Test: This provision limits the amount of additional debt that a fi rm may issue by establishing a maximum debt-to-asset ratio.
• Additional Bond Provisions: This clause states which fi nancial tests and other circumstances allow the fi rm to issue additional debt.
• Sinking or Purchase Fund and Call Provisions: This clause outlines the provisions of the sinking or purchase fund, and the specifi c dates and price at which the fi rm can call the debt.
Complete the on-line activity associated with
this section.

CANADIAN SECURITIES COURSE • VOLUME 16•16
© CSI GLOBAL EDUCATION INC. (2010)
GOVERNMENT OF CANADA SECURITIES
The Government of Canada issues marketable bonds in its own name. It also allows Crown Corporations to issue debt that has a direct call on the Government of Canada.
Example: The Farm Credit Corporation, a Crown Agency, issues medium- and long-term notes that are “direct obligations of Farm Credit and as such will constitute direct obligations of Her Majesty in right of Canada. Payment of principal and interest on the Notes will be a charge on and payable out of the Consolidated Revenue Fund.”
These issues are called marketable bonds because, as well as having a specific maturity date and a specified interest rate, they are transferable, which means that they may be traded in the market. This is in contrast to instruments such as Canada Savings Bonds (CSBs), which are not transferable and not marketable.
Marketable BondsThe federal government is the largest single issuer of marketable bonds in the Canadian bond market, having direct marketable debt of about $382 billion outstanding as of July 31, 2010, excluding Treasury bills (Source: Bank of Canada). All Government of Canada bonds are non-callable, that is, the government cannot call them for redemption before maturity.
When comparing the bonds issued by Canadian issuers (corporations, federal, provincial and municipal governments), investors assign the highest quality rating to federal government bonds. However, foreign investors compare the quality of Canadian issues to the issues of other governments. The relative risk of investing in each country is reflected in the yields of their bonds and the yields fluctuate in response to political and economic events. In the past, Canadian bonds have had higher yields than those of the U.S. Between 1995 and 2000, Canada had lower yields with respect to the U.S. At all maturities, Canadian yields are currently higher than U.S. yields.
Treasury BillsTreasury bills are short-term government obligations. They are offered in denominations from $1,000 up to $1 million and have traditionally appealed to large institutional investors such as banks, insurance companies, and trust and loan companies, and to some wealthy individual investors. When the government started offering them in denominations as low as $1,000, their appeal broadened to retail investors with smaller amounts of money to invest. Treasury bills are particularly popular when their yields exceed the yield on Canada Savings Bonds and other retail instruments, such as commercial paper. As of July 31, 2010, the Government of Canada had Treasury Bills outstanding of $166.5 billion.
Treasury bills do not pay interest. Instead, they are sold at a discount (below par) and mature at 100. The difference between the issue price and par at maturity represents the return on the investment, instead of interest. Under the Income Tax Act, this return is taxable as income, not as a capital gain.
Every two weeks, Treasury bills are sold at auction by the Minister of Finance through the Bank of Canada. These bills have original terms to maturity of approximately three months, six months and one year.
GOVERNMENT OF CANADA SECURITIES

SIX • FIXED-INCOME SECURITIES: FEATURES AND TYPES 6•17
© CSI GLOBAL EDUCATION INC. (2010)
Canada Savings BondsUnlike other bonds, Canada Savings Bonds (CSBs) can be purchased only between October and April of each year, but can be cashed by the owner at any bank in Canada at any time. Since they are not transferable and hence have no secondary market, CSBs do not rise and fall in price and may always be cashed at their full par value plus any accrued interest. Thus, although they are not marketable, they are liquid.
CSBs are not sold in bearer form but must be registered in the name of:
• An individual (adult or minor)
• The estate of a deceased person
• A trust for an individual
Registration provides proof of purchase, but it also ensures that an individual does not hold more than the maximum amount that he or she is allowed to purchase. (For each series, individual purchases are limited to a certain maximum; the amount varies from series to series.) Purchasers must be bona fide Canadian residents with a Canadian address for registration purposes.
Although the ownership of a CSB cannot be transferred or assigned, chartered banks may accept assignments of CSBs as collateral for loans. Individuals, estates of deceased persons and trusts governed by certain types of deferred savings and income plans are allowed to acquire CSBs.
REGULAR INTEREST CSBS
Since 1977, CSBs have been available in two forms: a regular interest bond and a compound interest bond. The regular interest bond pays annual interest, either by cheque or by direct deposit into the holder’s bank account on November 1 each year. It is issued in denominations of $300, $500, $1,000, $5,000 and $10,000. Registered owners may hold only five each of the $300 and $500 bonds. Regular interest bonds may be exchanged for compound interest bonds of the same series only during a specified period after the original purchase.
If the holder of a new CSB issue cashes the bonds in the first three months after the issue date, he or she normally receives their face value without interest. Interest payments on regular interest CSBs is taxable as regular income at the investor’s marginal tax rate.
COMPOUND INTEREST CSBS
Compound interest CSBs has been a standard feature since the 1977 series. It allows the holder to forgo receiving interest each year so that the unpaid interest can compound. The holder earns interest on the accumulated interest. The minimum denomination of this type of bond is $100. The compound interest is calculated each November 1, and is accrued in equal monthly amounts over the next twelve months. At redemption, the holder receives the face value plus the total of the earned interest. CSBs should be redeemed early in the month to ensure that the holder receives the maximum amount of interest accrued. For example, an investor redeeming a bond on October 2 will receive the interest owed as of September 30. Another investor waiting until October 29 will also receive the interest owed as of September 30, effectively missing out on a month’s interest.
For income tax purposes, holders of compound interest CSBs must report compound interest as taxable income in the year in which it is earned rather than the year in which they receive it. This is a disadvantage for the holder, as the holder must pay tax on the income without actually receiving the cash.

CANADIAN SECURITIES COURSE • VOLUME 16•18
© CSI GLOBAL EDUCATION INC. (2010)
CANADA PREMIUM BOND (CPBS)
Canada Premium Bonds (CPBs) are very similar to CSBs, but offer a higher interest rate than other CSBs on sale at the same time. They can be redeemed only once a year without penalty, on the anniversary of the date of issue and for 30 days thereafter and are available with regular or compound interest options.
PAYROLL SAVINGS PLAN
The Bank of Canada sells Canada Savings Bonds on a payroll savings plan through more than 12,000 organizations in all parts of Canada. These organizations include all levels of government, universities, school boards, hospitals, crown corporations and private companies. Close to a million Canadians purchase CSBs through payroll deduction each year.
REAL RETURN BONDS
The Government of Canada also issues real return bonds (RRB). A RRB resembles a conventional bond because it pays interest throughout the life of the bond and repays the original principal amount on maturity. Unlike conventional bonds, however, the coupon payments and principal repayment are adjusted for inflation. RRBs have a fixed real coupon rate. At each interest payment date, the real coupon rate is applied to a principal balance that has been adjusted for the cumulative level of inflation since the date the bond was issued. The cumulative level of inflation is known as the bond’s inflation compensation.
Example: The Government bonds carry a 4.25% coupon, were priced at 100 at issue date, and provide a real yield of about 4.25% to maturity on December 1, 2021. Both the semiannual interest payments and the fi nal redemption value of each bond are calculated by including an infl ation compensation component.
If inflation (as measured by changes in the CPI) had been 1.5% over the first six-month period after issue, the value of a $1,000 RRB at the end of the six months would have been $1,015. The interest payment for the half-year would be based on this amount ($1,015) rather than the original bond value of $1,000. At maturity, the maturity amount would be calculated by multiplying the original face value of the bond by the total amount of inflation since the issue date.
RRBs have risen in popularity since they were first issued, as understanding of their structure has become more widespread and the net benefit of government-guaranteed inflation protection is better recognized as a valuable component in constructing a portfolio of securities.
PROVINCIAL AND MUNICIPAL GOVERNMENT SECURITIES
A typical provincial bond or debenture issue is used to provide funds for program spending and to fund deficits. These expenditures may be charged over a period of years against the tax revenues of those years, since the province has undertaken the project to provide a continuing benefit over those years. Provinces also issue bonds to finance current social welfare expenditures. All provinces have statutes governing the use of funds obtained through the issue of bonds.
PROVINCIAL AND MUNICIPAL GOVERNMENT SECURITIES

SIX • FIXED-INCOME SECURITIES: FEATURES AND TYPES 6•19
© CSI GLOBAL EDUCATION INC. (2010)
Provincial “bonds,” like Government of Canada “bonds,” are actually debentures. They are simply promises to pay and their value depends upon the province’s ability to pay interest and repay principal. No provincial assets are pledged as security.
Provincial bonds are second in quality only to Government of Canada direct and guaranteed bonds because most provinces have taxation powers second only to the federal government. Different provinces’ direct and guaranteed bonds trade at differing prices and yields, however.
Bond quality is determined by two factors, credit and market conditions. The credit of a province – the degree of certainty that interest will be paid and the principal repaid when due – depends on such factors as:
• The amount of debt the province owes on a per capita basis compared with that of other provinces. Obviously, Province A with half the debt per capita of Province B commands a higher credit rating than that of B.
• The level of federal transfer payments.
• The philosophy and stability of the government.
• The wealth of the province in terms of natural resources, industrial development and agricultural production. A province rich in natural resources and with well-diversifi ed industries, balanced by good farming communities, should be better able to meet its obligations, particularly during recessions, than a province which depends on limited natural resources, small industrial production or almost totally on agricultural production.
Guaranteed BondsMany provinces also guarantee the bond issues of provincially appointed authorities and commissions.
Example: The Ontario Electricity Financial Corporation’s 8.5% notes, due May 26, 2025, are “Irrevocably and Unconditionally Guaranteed by the Province of Ontario.” Provincial guarantees may also be extended to cover municipal loans and school board issues. In some instances, provinces extend a guarantee to industrial concerns, usually as an inducement to a corporation to locate (or remain) in that province. Most provinces (and some of their enterprises) also issue Treasury bills. Investment dealers and banks purchase them, both at tender and by negotiation, usually for resale.
The bonds of nearly all the provinces are available in a wide range of denominations, from $500 to hundreds of thousands of dollars. The most popular denominations are $500, $1,000, $5,000, $10,000 and $25,000.
The term of a provincial bond issue will vary, depending on the use to which the proceeds will be put and the availability of investment funds at various terms.
In addition to issuing bonds in Canada, the provinces (and their enterprises) also borrow extensively in international markets. Unlike the federal government, whose policy is to borrow abroad largely to maintain exchange reserves, the provinces resort to foreign markets to take advantage of lower borrowing costs, based on the foreign exchange rate and financial market conditions. Provinces may also decide to borrow through issues denominated in, for example, U.S. funds, if the proceeds from the loan will be spent in the U.S. The interest cost (in U.S. funds) is offset by the revenues.

CANADIAN SECURITIES COURSE • VOLUME 16•20
© CSI GLOBAL EDUCATION INC. (2010)
Issues sold abroad are underwritten by syndicates of dealers and banks similar to those that handle foreign financing for federal government Crown Corporations. In recent years, issues have been sold, for example, payable in Canadian dollars, U.S. dollars, euros, Swiss francs and Japanese yen.
Since 1990, provincial guaranteed issues have been offered in a global bond offering. Global bond offerings are distributed simultaneously in domestic and foreign markets, and settle in different clearing agencies (such as EuroClear or Cedel). These offerings are expected to become an increasingly popular financing mechanism for Canadian governments and corporations.
Provincial SecuritiesMost provinces offer their own savings bonds. As with CSBs, there are certain characteristics that distinguish these instruments from other provincial bonds and make them suitable as savings vehicles:
• They can be purchased only by residents of the province.
• They can be purchased only at a certain time of the year.
• They are redeemable every six months (in Quebec, they can be redeemed at any time).
Some provinces issue different types of savings bonds. For instance, there are three types of Ontario Savings Bonds (OSBs): a step-up bond (interest paid increases over time), a variable-rate bond, and a fixed-rate bond. In British Columbia, investors can buy BC Savings Bonds in redeemable or nonredeemable (fixed-rate) forms.
As with CSBs, these bonds are RRSP-eligible and they can be purchased in very small amounts, starting as low as $100 ($250 in Quebec).
Municipal SecuritiesToday, the instrument that most municipalities use to raise capital from market sources is the instalment debenture or serial bond. Part of the bond matures in each year during the term of the bond.
Example: A debenture of $1 million may be issued so that $100,000 becomes due each year over a 10-year period. The municipality is actually issuing 10 separate debentures, each with a different maturity. At the end of 10 years, the entire issue will have been paid off.
Some municipalities issue term debentures with only one maturity date, but these are generally confined to very large cities such as Montreal, Toronto and Vancouver. At present, the usual practice is to pattern issues according to market preference as to term and repayment scheduling.
Installment debentures are usually non-callable: the investor who purchases them knows beforehand how long he or she may expect to keep funds invested. Also, if the money is needed at future specific dates, it can be invested in an instalment debenture so that it will be available when it is needed.
Municipalities are in the third rank of public borrowers, following the federal and provincial authorities. However, not all municipal credit ratings rank below those of each province. It is not unusual for debenture issues of some large metropolitan areas to be favoured by investors over the securities issued by one or more of the provinces.

SIX • FIXED-INCOME SECURITIES: FEATURES AND TYPES 6•21
© CSI GLOBAL EDUCATION INC. (2010)
Broadly speaking, a municipality’s credit rating depends upon its taxation resources. All else being equal, the municipality with many different types of industries is a better investment risk than a municipality built around one major industry. Similarly, the municipality with good transportation facilities is preferable to one that lacks them. Older municipalities with good repayment records are able to borrow money on more favourable terms than less mature municipalities in newly opened areas. Population and industrial growth, the condition of the town’s services, the experience of officials in municipal office, the level of tax collections and debt per capita are also key factors in determining a municipality’s credit rating.
CORPORATE BONDS
Corporations have more choices than governments to raise capital. They can sell ownership of the company by selling stocks to investors or by borrowing money from investors. Generally speaking, corporate bonds have a higher risk of default than government bonds. This risk depends upon a number of factors: the market conditions prevailing at the time of issue, the credit rating of the corporation issuing the bond, and the government to which the bond issuer is being compared to, among other things.
There are many types of corporate bonds with different features and characteristics to choose from. The most common types of corporate bonds are discussed below.
Mortgage BondsA mortgage is a legal document containing an agreement to pledge land, buildings or equipment as security for a loan and entitling the lender to take over ownership of these properties if the borrower fails to pay interest or repay the principal when it is due. The lender holds the mortgage until the loan is repaid, at which point the agreement is cancelled or destroyed. The lender cannot take ownership of the properties unless the borrower fails to satisfy the terms of the loan.
There is no fundamental difference between a mortgage and a mortgage bond except in form. Both are issued to allow the lender to secure property if the borrower fails to repay the loan.
The mortgage bond was created when the capital requirements of corporations became too large to be financed by the resources of any one individual lender. However, since it is impractical for a corporation to issue separate mortgages securing different portions of its properties to different lenders, a corporation can achieve the same result by issuing one mortgage on its properties to many lenders.
The mortgage is then deposited with a trustee, usually a trust company, which acts for all investors in safeguarding their interests under the terms of the loan contract described in the mortgage. The amount of the loan is divided into convenient portions, usually $1,000 or multiples of $1,000. Each investor receives a bond that represents the proportion of his or her participation in the full loan to the company and his or her claim under the terms of the mortgage. This instrument is a mortgage bond.
First mortgage bonds are the senior securities of a company, because they constitute a first charge on the company’s assets, earnings and undertakings before unsecured current liabilities are paid. It is necessary to study each first mortgage issue to determine exactly what properties are covered by the mortgage.
CORPORATE BONDS

CANADIAN SECURITIES COURSE • VOLUME 16•22
© CSI GLOBAL EDUCATION INC. (2010)
Most Canadian first mortgage bonds carry a first and specific charge against the company’s fixed assets and a floating charge on all other assets. They are generally regarded as the best security a company can issue, particularly if the mortgage applies to “all fixed assets of the company now and hereafter acquired.” This last phrase, known as the “after acquired clause,” means that all assets can be used to secure the loan, even those acquired after the bonds were issued.
Collateral Trust BondsA collateral trust bond is one that is secured, not by a pledge of real property, as in a mortgage bond, but by a pledge of securities, or collateral. Collateral trust bonds are issued by companies such as holding companies, which do not own much in the way of fixed assets on which they can offer a mortgage, but do own securities of subsidiaries. This method of securing bonds with other securities is similar to the common practice of pledging securities with a bank to secure a personal loan.
Equipment Trust CertificatesA variation on mortgage and collateral trust bonds is the equipment trust certificate. These certificates pledge equipment as security instead of real property. CP Locomotives, for example, issues these kinds of bonds, using its locomotives and train cars as security. The investor owns the rolling stock under a lease agreement with the railway, until all of the stock has been paid off. These certificates are usually issued in serial form, with a set amount that matures each year.
Subordinated DebenturesSubordinated debentures are junior to other securities issued by the company or other debts assumed by the company. The exact status of an issue of subordinated debentures is described in the prospectus.
Floating-Rate SecuritiesSince 1979, floating-rate securities (also known as variable-rate securities) have been a popular underwriting device because of the volatility of interest rates. Since these bonds automatically adjust to changing interest rates, they can be issued with longer terms than more conventional issues.
Floating-rate securities have proved popular because they offer protection to investors during periods of very volatile interest rates. For example, when interest rates are rising, the interest paid on floating-rate debentures is adjusted upwards at regular intervals of six months, which improves the price and yield of the debentures. The disadvantage of these bonds is that when interest rates fall, the interest payable on them is adjusted downwards at six-month intervals, so their yield tends to fall faster than that of most bonds. A minimum rate on the bonds can provide some protection to this process, although the minimum rate is normally relatively low.
In a portfolio, floating-rate securities behave like money market securities because, if the rate changes every three months, it is similar to holding a three-month instrument and rolling it over.

SIX • FIXED-INCOME SECURITIES: FEATURES AND TYPES 6•23
© CSI GLOBAL EDUCATION INC. (2010)
Corporate NotesA corporate note is an unsecured promise made by a borrower to pay interest and repay the funds borrowed at a specific date or dates. Corporate notes rank behind all other fixed-interest securities of the borrower.
Finance companies frequently use a type of note called a secured note or a collateral trust note. When an automobile is sold on credit, the buyer makes a cash down payment and signs a series of notes by which he or she agrees to make additional payments on specified dates. The automobile dealer takes these notes to a finance company, which discounts them and pays the dealer in cash. Finance companies pledge notes like these as security for collateral trust notes. These notes mature at different times and are sold to financial institutions or to individual investors who have substantial portfolios.
Another kind of secured note is the secured term note, which is backed by a written promise to pay. These notes are signed by people who buy automobiles or appliances on an instalment plan. These notes trade on the money market.
Strip BondsA strip bond or zero coupon bond is created when a dealer acquires a block of high-quality bonds and separates the individual future-dated interest coupons from the rest of the bond (known as the underlying bond residue). The dealer then sells each coupon as well as the residue separately at significant discounts to their face value. Holders of strip bonds receive no interest payments. Instead, the strips are purchased at a discount at a price that provides a certain compounded rate of return, when they mature at par. Similar to Treasury bills, the income is considered interest rather than a capital gain. This can cause a problem for the investor as tax must be paid annually on the income, even though the interest income on the bond is not received until the instrument matures. For this reason, it is often recommended that strip bonds be held in a tax-deferred plan such as an RRSP.
Example: An investment dealer might buy $10 million face value of a fi ve-year, semi-annual pay Government of Canada bond with a coupon of 5.50%, intending to strip the bond for sale to clients. With this bond, the dealer can create 10 different strip coupons, each with a face value of $275,000 ($10 million × 0.055 × 1/2) and each with a different maturity date, as each coupon will have its own maturity date. The face value of each strip coupon is equal to the dollar value of each interest payment on the regular bond. The bond’s principal repayment can be sold as a residual with a face value of $10 million.
The strip coupons are then sold at a discount to the $275,000 face value. For this example, let’s assume that it sells today for $204,626 (bond price calculations are covered in Chapter 7). An investor buying this strip bond today and holding it until maturity receives $275,000 in five years time. The strip bond does not generate any other regular income flow during this five-year period for the investor.
Domestic, Foreign and EurobondsDomestic bonds are issued in the currency and country of the issuer. If a Canadian corporation or government issued bonds in Canadian dollars in the Canadian market, these would be domestic bonds. This is the most common type of bond.

CANADIAN SECURITIES COURSE • VOLUME 16•24
© CSI GLOBAL EDUCATION INC. (2010)
Foreign bonds are issued outside of the issuer’s country and denominated in the currency of the foreign country where issued. This allows issuers access to sources of capital in many other countries. For example, Rogers Cable Inc., a Canadian company, has issued U.S. dollar-denominated bonds in the U.S. market; these bonds are considered foreign bonds in the U.S. market. (Bonds denominated in yen and issued in Japan by non-Japanese issuers are known as Samurais, just as bonds denominated in U.S. dollars and placed in the U.S. market by non-U.S. issuers are called Yankee bonds.) Some bonds offer the investor a choice of interest payments in either of two currencies; others pay interest in one currency and the principal in another. These foreign-pay bonds offer investors increased opportunity for portfolio diversification while providing the issuer with cost-effective access to capital in other countries.
Eurobonds are issued in a foreign market and are denominated in a currency other than that of the market where the bonds are issued. They are issued in the Eurobond market or the international bond market and can be issued in any number of different currencies. The Eurobond market is a large international market with issues in many currencies, including Canadian dollars, and attracts both international and domestic investors looking for alternative investments. For example, the Province of Ontario has issued Australian-dollar-denominated bonds in the Eurobond market, attracting investors around the globe, including Canadian investors seeking foreign currency exposure.
If a Canadian corporation or government issued Eurobonds denominated in Canadian dollars, they would be called EuroCanadian bonds. If they were denominated in U.S. dollars, they would be Eurodollar bonds. Other examples are shown in Table 6.3
TABLE 6.3 TYPES OF BONDS BY CURRENCY AND LOCATION
Issuer Issued In Currency of Issue Called
Canadian Canada Cdn$ Domestic bond
Canadian Mexico Pesos Foreign bond
Canadian France U.S.$ Eurobond (Eurodollar)
Canadian European Market Cdn$ Eurobond (EuroCdn bond)
Canadian U.S. U.S.$ Foreign (Yankee) bond
Preferred SecuritiesPreferred securities are very long-term subordinated debentures, and are sometimes called preferred debentures. The characteristics of these securities fall between standard debentures and preferred shares:
• They are very long-term instruments with terms in the range of 25–99 years.
• They are subordinated to all other debentures, but rank ahead of preferred shares.
• Interest can often be deferred at management’s discretion for up to fi ve years.
• They often trade on an exchange.

SIX • FIXED-INCOME SECURITIES: FEATURES AND TYPES 6•25
© CSI GLOBAL EDUCATION INC. (2010)
Preferred securities pay interest, have better yields than standard debentures, and offer better protection of principal than preferred shares. However, there is some risk involved, since if the issuer defaults, preferred securities have a lower priority than other debentures. Issuers may also defer interest payments for a number of years, while the security holder will be taxed on this accrued unpaid interest yearly.
OTHER FIXED-INCOME SECURITIES
Bankers’ AcceptancesA banker’s acceptance (BA) is a commercial draft (i.e., a written instruction to make payment) drawn by a borrower for payment on a specified date. A BA is guaranteed at maturity by the borrower’s bank. As with T-bills, BAs are sold at a discount and mature at their face value, with the difference representing the return to the investor. They trade in $1,000 multiples, with a minimum initial investment of $25,000, and generally have a term to maturity of 30 to 90 days, although some may have a maturity of up to 365 days. BAs may be sold before maturity at prevailing market rates, generally offering a higher yield than Canada T-bills.
Commercial PaperCommercial paper is an unsecured promissory note issued by a corporation or an asset-backed security backed by a pool of underlying financial assets. Issue terms range from less than three months to one year. Most corporate paper trades in $1,000 multiples, with a minimum initial investment of $25,000. Like T-bills and BAs, commercial paper is sold at a discount and matures at face value. Commercial paper is issued by large firms with an established financial history. Rating agencies rank commercial paper according to the issuer’s ability to meet short-term debt obligations. Commercial paper may be bought and sold in a secondary market before maturity at prevailing market rates and generally offers a higher yield than Canada T-bills.
Term DepositsTerm deposits offer a guaranteed rate for a short-term deposit (usually up to one year). Usually there are penalties for withdrawing funds before a certain period (for example, the first 30 days after purchase).
Guaranteed Investment CertificatesGuaranteed Investment Certificates (GICs) offer fixed rates of interest for a specific term (longer than with a term deposit). Both principal and interest payments are guaranteed. They can be redeemable or non-redeemable. Non-redeemable GICs cannot be cashed before maturity, except in the event of the depositor’s death or extreme financial hardship. Interest rates on redeemable GICs are lower than standard GICs of the same term, since they can be cashed before maturity.
Recently, banks have been customizing their GICs to provide investors with more choice. For instance, investors can choose a term of up to ten years, depending upon the amount invested
OTHER FIXED-INCOME SECURITIES
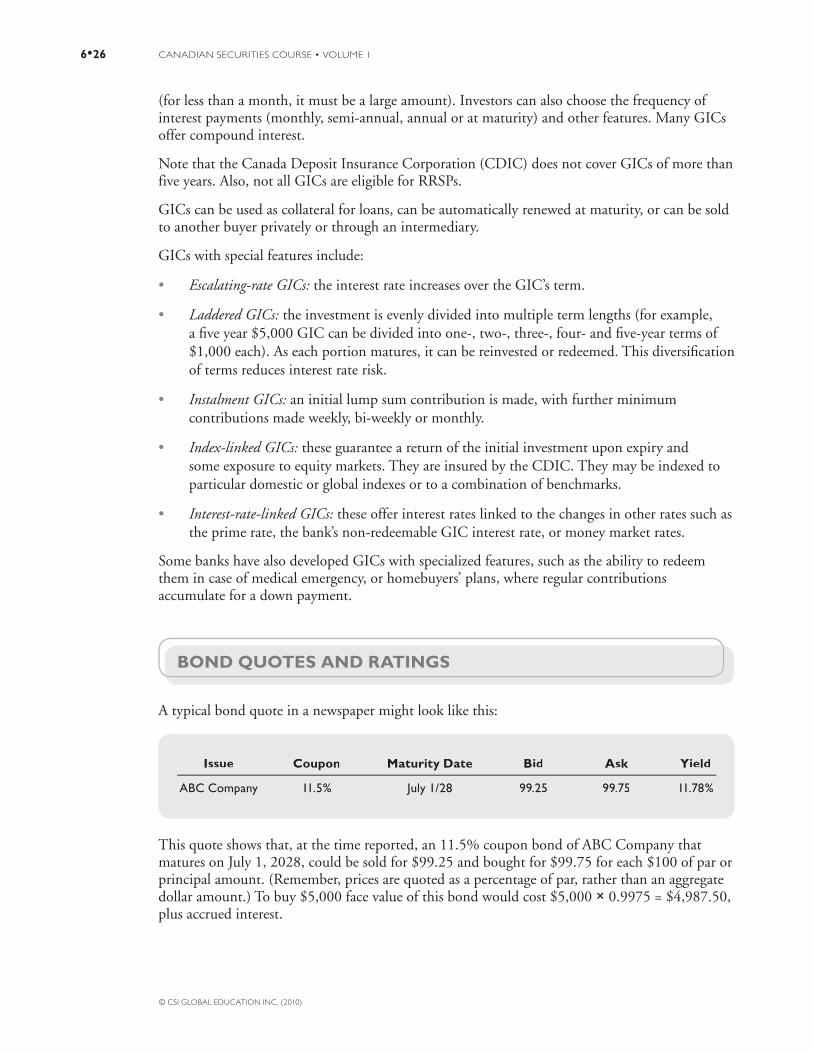
CANADIAN SECURITIES COURSE • VOLUME 16•26
© CSI GLOBAL EDUCATION INC. (2010)
(for less than a month, it must be a large amount). Investors can also choose the frequency of interest payments (monthly, semi-annual, annual or at maturity) and other features. Many GICs offer compound interest.
Note that the Canada Deposit Insurance Corporation (CDIC) does not cover GICs of more than five years. Also, not all GICs are eligible for RRSPs.
GICs can be used as collateral for loans, can be automatically renewed at maturity, or can be sold to another buyer privately or through an intermediary.
GICs with special features include:
• Escalating-rate GICs: the interest rate increases over the GIC’s term.
• Laddered GICs: the investment is evenly divided into multiple term lengths (for example, a fi ve year $5,000 GIC can be divided into one-, two-, three-, four- and fi ve-year terms of $1,000 each). As each portion matures, it can be reinvested or redeemed. This diversifi cation of terms reduces interest rate risk.
• Instalment GICs: an initial lump sum contribution is made, with further minimum contributions made weekly, bi-weekly or monthly.
• Index-linked GICs: these guarantee a return of the initial investment upon expiry and some exposure to equity markets. They are insured by the CDIC. They may be indexed to particular domestic or global indexes or to a combination of benchmarks.
• Interest-rate-linked GICs: these offer interest rates linked to the changes in other rates such as the prime rate, the bank’s non-redeemable GIC interest rate, or money market rates.
Some banks have also developed GICs with specialized features, such as the ability to redeem them in case of medical emergency, or homebuyers’ plans, where regular contributions accumulate for a down payment.
BOND QUOTES AND RATINGS
A typical bond quote in a newspaper might look like this:
Issue Coupon Maturity Date Bid Ask Yield
ABC Company 11.5% July 1/28 99.25 99.75 11.78%
This quote shows that, at the time reported, an 11.5% coupon bond of ABC Company that matures on July 1, 2028, could be sold for $99.25 and bought for $99.75 for each $100 of par or principal amount. (Remember, prices are quoted as a percentage of par, rather than an aggregate dollar amount.) To buy $5,000 face value of this bond would cost $5,000 × 0.9975 = $4,987.50, plus accrued interest.
BOND QUOTES AND RATINGS
Issue Coupon Maturity Date Bid Ask Yield
ABC Company 11.5% July 1/28 99.25 99.75 11.78%

SIX • FIXED-INCOME SECURITIES: FEATURES AND TYPES 6•27
© CSI GLOBAL EDUCATION INC. (2010)
Some financial newspapers publish a single price for the bond. This may be the bid price, the midpoint between the final bid and ask quote for the day, or an estimate based on current interest rate levels. Convertible issues are usually grouped together in a separate listing.
In Canada, the Dominion Bond Rating Service, Moody’s Canada Inc. and the Standard & Poor’s Bond Rating Service provide independent rating services for many debt securities. These ratings can help investors assess the quality of their debt holdings and confirm or challenge conclusions based on their own research and experience. Table 6.4 provides a brief overview of the rating scale of Standard and Poor’s. The definitions indicate the general attributes of debt bearing any of these ratings. They do not constitute a comprehensive description of all the characteristics of each category.
Similar services in the U.S. have provided ratings on a ranked scale for many years. Investors closely watch these ratings. Any change in rating, particularly a downgrading, can have a direct impact on the price of the securities involved. From a company’s point of view, a high rating provides benefits, such as the ability to set lower coupon rates on issues of new securities.
The Canadian rating services carry out credit analysis and provide an independent and objective assessment of the investment grade of securities. The ratings indicate whether an investment is a high or low risk, that is, the likelihood that interest payments will continue without interruption and that the principal will be repaid on time and in full.
Ratings classify securities from investment grade through to speculative and can be used to compare one company’s ability to meet its debt obligations with those of other companies. The rating services do not manage funds for investors, buy and sell securities, or recommend securities for purchase or sale.
TABLE 6.4 STANDARD AND POOR’S BOND RATING SERVICE
Rating Description
AAA(Highest Credit Quality)
This category is used to denote bonds of outstanding quality with the highest degree of protection of principal and interest. Companies with debt rated AAA are generally large national or multinational corporations that offer products or services essential to the Canadian economy. These companies usually have had a long and creditable history of superior debt protection, in which the quality of their assets and earnings has been constantly maintained or improved, with strong evidence that this performance will continue.
AA (Very Good Quality)
Bonds rated AA are very similar to those rated AAA and can also be considered superior in quality. These bonds are generally rated lower in quality than AAA because the margin of asset or earnings protection may not be as large or as stable as it is for those rated AAA.

CANADIAN SECURITIES COURSE • VOLUME 16•28
© CSI GLOBAL EDUCATION INC. (2010)
Rating Description
A (Good Quality)
Bonds rated A are considered to be good-quality securities with favourable long-term investment characteristics. The main feature that distinguishes them from the higher-rated securities is that these companies are more susceptible to adverse trade or economic conditions. The protection is consequently lower than for AAA and AA.
BBB (Medium Quality)
Issues rated BBB are classifi ed as medium- or average-grade investments. These companies are generally more susceptible than any of the A-rated companies to swings in economic or trade conditions.
Some internal or external factors may adversely affect the long-term protection of BBB debt. These companies bear close scrutiny, but in all cases both interest and principal are adequately protected at present.
BB (Lower Medium Quality)
Bonds rated BB are considered to be lower-medium-grade securities and have limited long-term protective investment characteristics. Asset and earnings coverage may be modest or unstable.
Interest and principal protection may deteriorate signifi cantly during adverse economic or trade conditions.
B (Poor Quality)
Securities rated B lack most qualities necessary for long-term fi xed- income investment. Companies in this category generally have a history of volatile operating conditions that have left in doubt the company’s ability to adequately protect the principal and interest. Current coverages may be below industry standards and there is little assurance that the level of debt protection will improve signifi cantly.
CCC (Speculative Quality)
Securities in this category are currently vulnerable to nonpayment, and are dependent upon favourable business, fi nancial and economic conditions for the company to meet its fi nancial commitment on the obligation. In the event of adverse business, fi nancial, or economic conditions, the company is not likely to have the capacity to meet its fi nancial commitment on the debt.
CC (Very Speculative Quality)
The company is highly vulnerable to nonpayment of debt.
C (Highly Speculative Quality)
A subordinated debt is highly vulnerable to nonpayment. This rating is used to cover a situation where a bankruptcy petition has been fi led or similar action taken, but payments on this obligation are being continued.
TABLE 6.4 STANDARD AND POOR’S BOND RATING SERVICE – Cont’d

SIX • FIXED-INCOME SECURITIES: FEATURES AND TYPES 6•29
© CSI GLOBAL EDUCATION INC. (2010)
Rating Description
D (Default)
Bonds in this category are in default of some provisions in their trust deed. The company may be in the process of liquidation.
Suspended(Rating Suspended)
A company that has its rating suspended is experiencing severe fi nancial or operating problems of which the outcome is uncertain. The company may or may not be in default, but there is uncertainty as to the company’s ability to pay off its debt.
TABLE 6.4 STANDARD AND POOR’S BOND RATING SERVICE – Cont’d

CANADIAN SECURITIES COURSE • VOLUME 16•30
© CSI GLOBAL EDUCATION INC. (2010)
SUMMARY
After reading this chapter, you should be able to:
1. Describe the fi xed-income market and discuss the rationale for issuing debt instruments.
• The dollar value of trading in the Canadian secondary debt market is considerably larger than the dollar value of equity trading.
• Companies use fi xed-income securities to fi nance and expand their operations or to take advantage of operating leverage.
2. Defi ne the terms used in transactions involving bonds, describe bond features, explain the use of a sinking fund and a purchase fund, and describe the protective provisions found in a bond indenture.
• There is a great deal of terminology to remember:
– Face or par value is the amount the bond issuer contracts to pay at maturity.
– The coupon is the regular interest income that the bond pays.
– Bonds that trade in the secondary market have a price and a quoted yield.
– The remaining life of a bond is called its term to maturity.
– The maturity date is the date at which the bond matures and the principal is repaid.
– A bond is secured by physical assets in a trust deed written into the bond contract.
– A debenture is secured by something other than a physical asset. The asset secured may be a general claim on residual assets or the issuer’s credit rating.
• A callable bond gives the issuer the right, but not the obligation, to pay off the bond before maturity, either to take advantage of lower interest rates or to reduce debt when excess cash is available.
• Most corporate bonds are issued with a Canada yield call that allows the issuer to call the bond at a price based on the greater of par or the price based on the yield of an equivalent term Government of Canada bond plus a yield spread.
• Sinking funds are sums of money taken out of earnings each year to provide for the repayment of all or part of a debt issue by maturity. Sinking fund provisions are as binding on the issuer as any mortgage provision.
• A purchase fund arrangement establishes a fund to retire a specifi ed amount of the outstanding bonds or debentures through purchases in the market if these purchases can be made at or below a stipulated price.
SUMMARY
SIX • FIXED-INCOME SECURITIES: FEATURES AND TYPES 6•31
© CSI GLOBAL EDUCATION INC. (2010)
• A convertible bond gives the holder the option to exchange the bond for common shares of the issuing company. A convertible bond allows an investor to lock in a specifi c price (the conversion price) for the common shares of the company.
• Corporate bonds typically include protective covenants that secure the bond and make it more likely that investors receive their principal at maturity. These protective provisions are essentially safeguards in the bond contract to guard against any weakening in the security holder’s position.
3. Compare and contrast the types of Government of Canada securities.
• Marketable bonds have a specifi c maturity date and a specifi ed interest rate, and are transferable, which means they can be traded in the market. The Government of Canada issues marketable bonds in its own name.
• Treasury bills are short-term government obligations with original terms to maturity of three months, six months and one year. They are offered in denominations from $1,000 up to $1 million.
• Canada Savings Bonds (CSBs) can be purchased only between October and April of each year but are cashable at their full par value plus any accrued interest by the owner at any bank in Canada at any time.
• Canada Premium Bonds (CPBs) are very similar to CSBs but offer a higher interest rate when they are issued. They can be redeemed only once a year without penalty, on the anniversary of the date of issue and for 30 days thereafter.
4. Compare and contrast the different types of provincial government securities and municipal debentures.
• Provincial bonds are actually debentures because they are promises to pay and no provincial assets are pledged as security. The value of the bonds depends on the province’s ability to pay interest and repay principal.
• Provincial bonds are second in quality only to Government of Canada bonds because most provinces have taxation powers second only to the federal government.
• Municipalities typically raise capital from market sources through instalment debentures or serial bonds. Part of the bond matures in each year during the term of the bond.
• Broadly speaking, a municipality’s credit rating depends on its taxation resources. All else being equal, a municipality with many different types of industry is a better investment risk than a municipality built around one major industry.
CANADIAN SECURITIES COURSE • VOLUME 16•32
© CSI GLOBAL EDUCATION INC. (2010)
5. Identify the different types of corporate bonds and describe their features.
• A banker’s acceptance is a short term debt guaranteed by the borrower’s bank that is sold at a discount and that mature at face value.
• Commercial paper is a one-year or less unsecured promissory note issued by a corporation and backed by fi nancial assets, sold at a discount and that mature at face value.
• First mortgage bonds are the senior securities of a company because they constitute a fi rst charge on the company’s assets, earnings and undertakings before unsecured current liabilities are paid.
• A collateral trust bond is secured, not by a pledge of real property, as in a mortgage bond, but by a pledge of securities or collateral.
• An equipment trust certifi cate pledges equipment as security instead of real property. These certifi cates are usually issued in serial form, with a set amount that matures each year.
• Subordinated debentures are junior to other securities issued by the company and other debts assumed by the company.
• Floating-rate bonds automatically adjust to changing interest rates. They can be issued with longer terms than more conventional issues.
• A corporate note is an unsecured promise made by a borrower to pay interest and repay the funds borrowed at a specifi c date or dates. Corporate notes rank behind all other fi xed interest securities of the borrower.
• A strip bond is created when a dealer acquires a block of high-quality bonds and separates the individual future-dated interest coupons from the rest of the bond. The bonds are then sold at signifi cant discounts to their face value. Holders of strip bonds receive no interest payments; instead, the income earned is considered interest rather than a capital gain.
• Foreign bonds are issued in a currency and country other than the issuer’s, which allows the issuer access to sources of capital in many other countries.
• Eurobonds are issued in a foreign market and are denominated in a currency other than that of the market in which the bonds are issued.
SIX • FIXED-INCOME SECURITIES: FEATURES AND TYPES 6•33
© CSI GLOBAL EDUCATION INC. (2010)
Now that you’ve completed this
chapter and the on-line activities,
complete this post-test.
6. Describe the features of term deposits and guaranteed investment certifi cates.
• Term deposits offer a guaranteed rate for a short-term deposit (usually up to one year). There are generally penalties for withdrawing funds before a certain period (for example, the fi rst 30 days after purchase).
• Guaranteed investment certifi cates (GICs) offer fi xed rates of interest for a specifi c term (longer than with a term deposit). Both principal and interest payments are guaranteed, and they can be redeemable or non-redeemable. Non-redeemable GICs cannot be cashed before maturity except in the event of the depositor’s death or extreme fi nancial hardship.
7. Interpret bond quotes and summarize and evaluate bond ratings.
• A typical bond quote includes the issuing company, the coupon rate, the maturity date, the bid and ask price, and the yield on the bond.
• In Canada, the Dominion Bond Rating Service, Moody’s Canada Inc. and the Standard & Poor’s Bond Rating Service provide independent rating services for many debt securities. These ratings can help investors assess the quality of their debt holdings and confi rm or challenge conclusions based on their own research and experience.


© CSI GLOBAL EDUCATION INC. (2010) 7•1
Chapter 7
Fixed-Income Securities: Pricing and Trading

© CSI GLOBAL EDUCATION INC. (2010)7•2
7
Fixed-Income Securities: Pricing and Trading
CHAPTER OUTLINE
Bond Pricing Principles• Calculating the Fair Price of a Bond• Calculating the Yield on a Treasury Bill• Calculating the Current Yield on a Bond• Calculating the Yield to Maturity on a Bond
Term Structure of Interest Rates• The Real Rate of Return• The Yield Curve
Bond Pricing Properties• The Relationship Between Bond Prices and Interest Rates• The Impact of Maturity• The Impact of the Coupon• The Impact of Yield Changes• Duration as a Measure of Bond Price Volatility
Bond-Switching Strategies
Bond Market Trading• Clearing and Settlement• Calculating Accrued Interest

© CSI GLOBAL EDUCATION INC. (2010) 7•3
Bond Indexes • Canadian Bond Market Indexes• Global Indexes
Summary
LEARNING OBJECTIVES
By the end of this chapter, you should be able to:
1. Defi ne present value and the discount rate, and perform calculations relating to the time value of money, bond pricing and yield.
2. Defi ne a real rate of return and a yield curve, and evaluate three theories of interest rate determination.
3. Analyze the impact of fi xed-income pricing properties on bond prices.
4. Explain the rationale for bond switching and describe bond-switching strategies.
5. Summarize the rules and regulations of bond delivery and settlement.
6. Assess the role of bond indexes in the securities industry.
THE FIXED-INCOME MARKET IN ACTION
Before they invest in or recommend fi xed-income securities, investors and advisors must understand the potential risks and rewards. An important part of this process requires knowledge of how bond yields and prices are determined. One of the most important factors to keep in mind is the strong relationship that exists between prevailing interest rates and the prices of various fi xed-income securities.
Most people have invested, at one time or another, in Canada Savings Bonds. You buy the bond at one price, receive a regular stream of interest payments, hold the bond to maturity, and cash it in at face value. In fact, it is most common that investors buy a bond or other fi xed-income security when they are fi rst issued and hold them to maturity.
Fixed-income securities can, however, be bought in the secondary markets. The price in the markets is affected by a number of factors, including economic conditions and changes in interest rates. Fixed-income securities generally react differently to economic factors than do equities, and it is important to understand the impact of various events that affect markets.

© CSI GLOBAL EDUCATION INC. (2010)7•4
How much should an investor pay for a particular security? This question applies as much to bonds as to equities, especially for investors seeking capital gains in the bond market. This chapter looks at how to determine the fair price for a fi xed-income security and then at fi xed-income pricing properties and bond trading strategies.
KEY TERMS
Accrued interest Liquidity preference theory
Bearer bonds Market segmentation theory
Bond switches Nominal rate
Canadian Depository for Securities Limited (CDS) Present value
Current yield Registered bonds
Delivery Reinvestment risk
Discount rate Yield curve
Duration Yield to maturity (YTM)
Expectations Theory
In the on-line Learning Guide for this module,
complete the Getting Started
activity.

SEVEN • FIXED-INCOME SECURITIES: PRICING AND TRADING 7•5
© CSI GLOBAL EDUCATION INC. (2010)
BOND PRICING PRINCIPLES
The most accurate method of determining the value of a bond is by calculating its present value—a technique for determining the value today of an amount of money to be received in the future. The present value method sets out to answer the question—what would you pay today to invest in a security that offered you a guaranteed sum of $1,000 in five years? In other words, what is the present value of this investment?
Consider the following scenario.
Suppose you had the choice of receiving $1,000 today or one year from today—which would you prefer? When you think about it, you know that if you had the $1,000 today you could invest it and earn interest so that you would have more than $1,000 a year from today. We can then say that an amount to be received in the future is not worth as much today; or the present value of an amount is worth less than its future value because of the opportunity of investing the proceeds today at a rate of interest.
The question then is how much needs to be invested today at 5% to achieve that future value of $1,000? Here is a simplified way to determine the present value of this future amount.
Present Value × (1 + Interest or Discount Rate) = Future Value
Present Value × 1.05 = $1,000
Present Value = $1,000 ÷ 1.05
Present Value = $952.38
What this tells us: the present value of $952.38 invested today for one year at a 5% rate of interest would grow to a future value of $1,000.
There are four steps in calculating a bond’s present value:
1. Choose the appropriate discount rate (r).
3. Calculate the present value of the bond’s income stream (the coupon payments, C).
2. Calculate the present value of the bond’s principal to be received at maturity.
4. Add these present values together to determine its worth today.
The cash flow from a typical bond is made up of regular coupon payments and the return of the principal at maturity. Since a bond represents a series of cash flows to be received in the future, the sum of the present values of these future cash flows is what it is worth today.
BOND PRICING PRINCIPLES

CANADIAN SECURITIES COURSE • VOLUME 17•6
© CSI GLOBAL EDUCATION INC. (2010)
The general formula for calculating the present value of a bond is:
PV =C1 +
C2 + +Cn + P
(1 + r)1 (1 + r)2 (1 + r)n
Where:
PV = the present value of the bond
C = the coupon payment
r = the discount rate per period
n = the number of compounding periods to maturity
P = Principal received at maturity (i.e., the future value)
The math behind these calculations is not intended to be cumbersome; the next few sections will explain how to carry out and interpret the results.
In the examples that follow, we will use a 4-year semi-annual 9% coupon bond and a discount rate of 10%. Remember that bond prices are often quoted using a base value of $100. We will use $100 as the principal of our 4-year semi-annual bond.
THE DISCOUNT RATE
The appropriate discount rate is chosen based on the risk of the particular bond. It is important to note that discount rate, interest rate, yield and yield to maturity are often used to refer to the same thing. The discount rate can be estimated by the yields currently applicable to bonds with similar coupon, term and credit quality. These yields are determined by the marketplace and change as market conditions change.
Yields are often quoted as being equal to a Government of Canada bond with a similar term, plus a spread in basis points that reflects credit risk, liquidity and other factors.
The discount rate should not be confused with the coupon rate on the bond. The coupon rate determines the income to be paid to the holder of the bond, and is set when the bond is issued and generally does not change.
If the bond pays interest more than once a year, the coupon payments must be adjusted for the number of times interest is paid each year. Because most bonds pay interest twice a year, or semi-annually, we need to make the following adjustments to our bond:
Coupon = (9% ÷ 2) × $100 = 4.5% × $100 = $4.50 per period
Compounding periods = 4 years × 2 = 8 compounding periods

SEVEN • FIXED-INCOME SECURITIES: PRICING AND TRADING 7•7
© CSI GLOBAL EDUCATION INC. (2010)
Calculating the Fair Price of a BondThe fair price of a bond is the present value of the bond’s principal and the present value of all coupon payments to be received over the life of the bond.
We can use the following timeline to show the timing of the cash flows on our 4-year, 9% semi-annual bond.
Future Value
C8($4.50) + $100
Principal
C1($4.50) C2($4.50) C3($4.50) C4($4.50) C5($4.50) C6($4.50) C7($4.50)
Year 1 Year 2 Year 3 Year 4
Present
Value
The timeline shows that each coupon payment is received twice per year and that at maturity, the bondholder receives both a coupon payment and the return of the principal or the par value of the bond. By discounting these cash flows back to the present we can solve for the present value of a bond.
PRESENT VALUE OF A BOND
Let’s take a more detailed look at the formula for the present value of a bond.
PV =C1 +
C2 + +Cn + P
(1 + r)1 (1 + r)2 (1 + r)n
The present value of a future amount to be received is calculated by dividing that future amount by (1 + interest rate) raised to the power of the number of compounding periods in the future that amount will be paid. This method is called discounting the cash flows—we are discounting those future cash flows so that we can place a present value on them.
We can carry out the calculation either by hand or by using a financial calculator, however we arrive at a more precise answer much quicker using a financial calculator. We have included the step-by-step calculations in Exhibit 7.1 so that you gain an appreciation of what is involved with each calculation.
Future Value
C8($4.50) + $100
Principal
C1($4.50) C2($4.50) C3($4.50) C4($4.50) C5($4.50) C6($4.50) C7($4.50)
Year 1 Year 2 Year 3 Year 4
Present
Value

CANADIAN SECURITIES COURSE • VOLUME 17•8
© CSI GLOBAL EDUCATION INC. (2010)
For our 4-year, semi-annual 9% bond, we can set up the formula as:
PV =4.50
+4.50
+ +4.50
+4.50 + 100
(1 + .05)1 (1 + .05)2 (1 + .05)7 (1 + .05)8
Calculation Note
You may be wondering how to approach calculations that involve (1 + r)n. The bracketed information is read as being to the power of ‘n’. So if we have (1.05)8, the 1.05 is raised to the power of 8. Using a calculator simplifi es the calculation as most are equipped with a yx or yexp key. Simply key in 1.05 press the yx or yexp key, enter 8 as the power and you have the answer of 1.4775.
1. PV of the income stream: The present value of a bond’s income stream is the sum of the present values of each coupon payment. For our 9% four-year bond with a par value of $100, there would be eight remaining semi-annual coupon payments of $4.50 each. The present value of each of these coupons, added together, is the present value of the bond’s income stream.
Using a fi nancial calculator:
Number of compounding periods = 8
Discount rate = 5%
Coupon payment = $4.50
Solve for PV = $29.0845
This tells us that the value of the stream of eight coupon payments is worth $29.08 today.
2. Present value of the principal: Because the bond’s principal represents a single cash fl ow to be received in the future, we can calculate the present value of the principal of our 4-year semi-annual bond with a par value of $100 as:
Number of compounding periods = 8
Discount rate = 5%
Future value (Principal) = $100
Solve for PV = $67.6839
The present value of the principal is approximately $67.68. This tells us that if you were to invest $67.68 at a semi-annual rate of 5% today, you will receive $100 in four years.
3. Present value of the bond: The fair price for a bond is the sum of its two sources of value: the present value of its principal and the present value of its coupons.
In the example above, the coupons are worth $29.08 and the principal is worth $67.68. Therefore, at a discount rate of 10%, this bond has a present value of $96.77 ($29.0844 + $67.6839) today.
Calculation Note
You may be wondering how to approach calculations that involve (1 + r)n. The bracketed information is read as being to the power of ‘n’. So if we have (1.05)8, the 1.05 is raised to the power of 8. Using acalculator simplifi es the calculation as most are equipped with a yx or yexp key. Simply key in 1.05 pressthe yx or yexp key, enter 8 as the power and you have the answer of 1.4775.

SEVEN • FIXED-INCOME SECURITIES: PRICING AND TRADING 7•9
© CSI GLOBAL EDUCATION INC. (2010)
We can also carry out the calculation for the present value of the bond in one easy step using a fi nancial calculator:
Number of compounding periods = 8
Discount rate = 5%
Coupon payments = $4.50
Future value (Principal) = $100
Solve for PV = $96.7684 or $96.77
What does the present value of $96.77 tell us? It is the price at which the bond will be quoted for trading in the secondary market; its fair value given current market conditions. Simply put, this is what an investor should pay for the bond today, no more or no less.
Thus, the value of a bond is the sum of what its coupons are worth today, plus what its principal is worth today, based on an appropriate discount rate that reflects the risks of that particular bond. The appropriate discount rate changes with changing economic conditions and reflects the yield investors expect.
EXHIBIT 7.1 CALCULATING THE PRESENT VALUE OF A BOND
Although a fi nancial calculator simplifi es the present value calculations, it is also important to have an understanding of how the calculations are carried out manually.
1. PV of the Principal
The formula to calculate the present value of a single cash fl ow to be received in the future is:
n
FVPV
(1 r)
Because the bond’s principal represents a single cash fl ow to be received in the future, we can calculate the present value of the principal of our 4-year semi-annual bond with a par value of $100 as:
8
$100PV
(1 0.05)
$1001.47746$67.6839
2. Present value of the Income Stream
We can calculate the present value of a coupon payment using the same formula as above:
1
$4.50PV
(1 0.05)
$4.501.05
$4.2857

CANADIAN SECURITIES COURSE • VOLUME 17•10
© CSI GLOBAL EDUCATION INC. (2010)
EXHIBIT 7.1 CALCULATING THE PRESENT VALUE OF A BOND – Cont’d
The present value of the coupon to be received six months from now is approximately $4.29. In the same example, the present value of the second coupon is:
2
$4.50PV
(1 0.05)
$4.501.1025$4.0816
The present value of the coupon to be received two six-month periods from now is approximately $4.08. Repeat this process for each of the coupon payments to be received, and add the present values together to obtain the present value of the income stream. In this example, it would be $29.08 (or $4.29 + $4.08 + $3.89 + $3.70 + $3.53 + $3.36 + $3.20 + $3.05).
There is a faster way to calculate the present value of a series of time payments, using a calculation called the present value of an annuity. With this formula, the sum of the present value of all coupons is found all at once. The formula is:
n
11
(1 r)APV = C
r
Where:
APV = present value of the series of coupon paymentsC = payment (the value of one coupon payment)r = the discount rate per periodn = the number of compounding periods
Applying the formula to our previous bond calculation problem, we get:
8
11
(1 0.05)APV = $4.50
0.05
1 0.676839$4.50
0.05
0.323161$4.50
0.05
$4.50 6.4632
$29.0844
Present value of the Bond
The fair price for a bond is the sum of its two sources of value: the present value of its principal and the present value of its coupons. Therefore, at a discount rate of 10%, this bond has a value of $96.77 ($29.0844 + $67.6839) today.
Complete the on-line activity associated with
this section.

SEVEN • FIXED-INCOME SECURITIES: PRICING AND TRADING 7•11
© CSI GLOBAL EDUCATION INC. (2010)
Calculating the Yield on a Treasury BillTreasury bills are very short-term securities that trade at a discount and mature at par. No interest is paid in the interim, so the return is generated from the difference between the purchase price and the sale (or maturity) price. A simple formula for calculating this yield is:
100 price 365Yield 100
price term
Example: If you bought an 89-day T-bill for a price of 98, the yield would be:
100 98 365Yield 100
98 89
2 365100
98 89
8.3696%
Calculating the Current Yield on a BondWe can calculate the current yield of any investment, whether it is a bond or a stock, using the following formula:
Annual Cash FlowCurrent Yield 100
Current Market Price
Current yield looks only at cash flows and the current market price of the investment, not at the amount that was originally invested.
Example: The 4-year, 9% bond, trading at a price of 96.77 from the examples above, would have a current yield of:
$9/96.77 × 100 = 9.30%
Calculating the Yield to Maturity on a BondThe most popular measure of yield in the bond market is yield to maturity (YTM). YTM shows the total return you would expect to earn over the life of a bond starting today, assuming you are able to reinvest the coupons you receive at the YTM. The yield to maturity takes into account the current market price, its maturity, the par value to be received at maturity and the coupon rate. This calculation involves finding the implied interest rate (r) in the bond present value formula from the previous section:
PV =C1 +
C2 + +Cn + P
(1 + r)1 (1 + r)2 (1 + r)n
In a YTM calculation, you know PV but you do not know r.

CANADIAN SECURITIES COURSE • VOLUME 17•12
© CSI GLOBAL EDUCATION INC. (2010)
Unlike a current yield, where the yield is calculated as the coupon income divided by current price, the YTM calculation makes the assumption that the investor will be repaid the par value of the investment at maturity.
Therefore, YTM not only reflects the investor’s return in the form of coupon income, but includes any capital gain from purchasing the bond at a discount and receiving par at maturity, or any capital loss from purchasing the bond at a premium and receiving par at maturity.
The easy way to solve for YTM is to use a financial calculator.
Example: Continuing with the 4-year, semi-annual 9% bond, trading at a price of 96.77, we can fi nd the semi-annual YTM in the following way:
Number of compounding periods = 8
Present value = 96.77
Coupon payment = $4.50
Future value (Principal) = $100
Solve for YTM = 4.9997% or 5.0%
The semi-annual YTM on this bond is 5.0%. The annual YTM is 10% (5% x 2), which makes sense because the bond is trading at a discount to par. If you buy this bond today at the price of $96.77 and hold it to maturity you would receive 8 payments of $4.50 plus $100 at maturity. The YTM calculation factors in the $3.23 gain on this bond ($100 - $96.77), the coupon income, plus the reinvestment of the coupon income at this YTM.
A financial calculator makes the YTM calculation quite easy. Exhibit 7.2 shows how to carry out the calculation manually using the approximate yield to maturity method.
EXHIBIT 7.2 APPROXIMATE YIELD TO MATURITY—MANUAL CALCULATION
The formula for the approximate yield to maturity is:
Interest income / Annual price change100
(Purchase price 100) 2
We use +/- in the formula to show that you can buy a bond at a price above or below par. Let’s say you buy a bond at a discount to par, say at a price of 92, and hold it to maturity. At maturity, the bond matures at par and you realize a gain on the investment. In the formula, you would add this price appreciation to the interest income. The opposite holds if you buy a bond at a premium, say at 105, and hold it to maturity. In our formula, you would subtract the price decrease from the interest income.

SEVEN • FIXED-INCOME SECURITIES: PRICING AND TRADING 7•13
© CSI GLOBAL EDUCATION INC. (2010)
EXHIBIT 7.2 APPROXIMATE YIELD TO MATURITY—MANUAL CALCULATION – Cont’d
For example, let’s calculate the yield on the 4-year, semi-annual 9% bond, trading at a price of 96.77 that matures at 100.
• The semi-annual interest or coupon income on this bond is $4.50.
• What is the annual price change on this bond (based on $100 par)? The present value of the bond is 96.77 and will mature at 100. Therefore, it will increase in value over the remaining life of the bond by $3.23. Since there are eight compounding periods remaining in this bond’s term, the bond generates a gain in price of $0.4038 per period over the remaining eight compounding periods ($3.23 ÷ 8).
• What is the average price on this bond (based on $100 par)? The purchase price is $96.77. The redemption or maturity value is $100. The average price is 98.385, or (96.77 + 100) ÷ 2.
The approximate semi-annual YTM on this bond is:
=$4.50 + $0.4038
× 100(96.77 + 100) ÷ 2
=$4.9038
× 10098.385
= 4.9842%
The annual YTM is 9.9684% (4.9842% x 2).
You will notice that this result is very close to the YTM found using the calculator method. For accuracy, a fi nancial calculator provides a more precise amount.
WHAT DOES THE YTM TELLS US AND WHY IS IT IMPORTANT?
When you buy a bond, the bond quote includes the price, the maturity date, the coupon rate, the bond’s current yield and the yield to maturity. This is all important information: the coupon rate tells you how much income you will receive each year and the current yield tells you how much interest income you receive in relation to the price being paid for the bond.
The yield to maturity is the more important measure. In general, the YTM is an estimate of the average rate of return earned on a bond if it is bought today and held to maturity. To earn this rate of return, however, it is assumed that all coupon payments are reinvested at a rate equal to the YTM. In our example above, we can say that the bondholder will realize a return of 10.0% over the term of the bond if held to maturity and if the coupon payments are reinvested at this YTM.
The yield to maturity provides us with a good estimate of the return on a bond. However, you should keep in mind that depending on the future trend in market rates, the true return on the bond could differ from the YTM calculation. This is referred to as reinvestment risk.

CANADIAN SECURITIES COURSE • VOLUME 17•14
© CSI GLOBAL EDUCATION INC. (2010)
REINVESTMENT RISK
Since interest rates fluctuate, the interest rate prevailing at the time of purchase is unlikely to be the same as the interest rate prevailing at the time the investor reinvests cash flows from each coupon payment. The longer the term to maturity, the less likely it is that interest rates will remain constant over the term. The risk that the coupons cannot be reinvested at the same interest rate that prevailed at the time the bond was purchased is called reinvestment risk.
If all coupon payments are reinvested, on average, at a rate higher than the bond’s YTM at the time of purchase, the overall return on the bond will be higher than the YTM quoted at the time the bond was purchased. In this case, the YTM at the time of purchase will be understated.
If, on the other hand, coupon payments are reinvested, on average, at a rate lower than the bond’s YTM at the time of purchase, the overall return on the bond will be lower than the YTM quoted at the time the bond was purchased. In this case, the YTM at the time of purchase will be overstated.
Only a zero coupon bond has no reinvestment risk, since there are no coupon cash flows to reinvest before maturity. Instead, these bonds are purchased at a discount from their face value. The price paid takes into account the compounded rate of return that would have been received had there been coupons.
TERM STRUCTURE OF INTEREST RATES
To have a successful trading strategy, the investor needs some expertise in determining the future direction of interest rates. It is important to understand the factors that determine:
• the general level of interest rates at any particular time
• the level of interest rates at different terms to maturity
There is not just one interest rate in the economy, but many rates. These rates vary, depending on the term to maturity of various debt instruments. This is referred to as the term structure of interest rates. A graph depicting this term structure is known as a yield curve (see Figure 7.1 for an example of a Government of Canada yield curve).
Interest rates can rise or fall faster than each other, or even move in opposite directions. The following section offers several explanations that have been proposed to explain why interest rates for various terms vary, creating different term structures or yield curves.
The Real Rate of ReturnIn a general sense, interest rates are simply the result of the interaction between those who want to borrow funds and those who want to lend funds. There is at least one major theory behind the determination of interest rates: the inflation rate/real rate theory.
The rate of return that a bond (or any investment) offers is made up of two components:
• The real rate of return
• The infl ation rate
TERM STRUCTURE OF INTEREST RATES
SEVEN • FIXED-INCOME SECURITIES: PRICING AND TRADING 7•15
© CSI GLOBAL EDUCATION INC. (2010)
Because inflation reduces the value of a dollar, the return that is received, known as the nominal rate, must be reduced by the inflation rate to arrive at the actual or real rate of return.
The real rate of return is determined by the supply of funds (supplied by investors) and the demand for loans (created by business). Businesses are more inclined to borrow to invest in, for example, new plant and equipment, when they believe that this investment will earn returns that are higher than the costs of borrowing.
Thus, when real interest rates are low, the demand for funds will rise. The supply of funds tends to rise when real rates are high, as investors are more likely to lend funds. The nominal rate for loans will be made up of the real rate, as established by supply and demand, plus the expected inflation rate.
Nominal Rate = Real Rate + Infl ation Rate
Two factors affect forecasts for the real rate:
• The real rate rises and falls throughout the business cycle, becoming lower during recessions as demand for funds falls, and rising during the expansion phase as demand for funds increases.
• An unexpected change in the infl ation rate also affects the real rate. An investor lending money will demand an interest rate that includes his or her expectations for infl ation, thereby assuring a satisfactory real rate. If the infl ation rate is higher than expected, the investor’s real rate of return will be lower than expected.
The Yield CurveNot only do bond prices and yields fluctuate, but the relationship between short-term and long-term bond yields also tends to fluctuate. This relationship is easily plotted on a graph for similar long-term and short-term bonds and results in a line called a yield curve, which continually changes.

CANADIAN SECURITIES COURSE • VOLUME 17•16
© CSI GLOBAL EDUCATION INC. (2010)
FIGURE 7.1 SHORT- AND LONG-TERM GOVERNMENT OF CANADA SECURITY YIELDS
4
5
6
7
8
9
Long
10 years7 years5 years3 years2 years12 months6 months3 months1 month
Time to Maturity
Yiel
d %
Three theories proposed to describe the shape of the yield curve are the expectations theory, the liquidity theory and the market segmentation theory.
EXPECTATIONS THEORY
An investor who wants to invest money in the fixed-income market for a certain time period has a number of choices of terms. For example, if the investment is for two years, the investor could purchase a two-year bond, or invest in a one-year bond and then buy another one-year bond when the first one matures, or even buy a six-month bond and roll it over three more times during the two years.
Since an efficient market (and arbitrage) ensures that each route will be equally attractive, the two-year interest rate must be an average of two successive and consecutive one-year rates, and the one-year rate must be an average of two consecutive six-month rates, and so forth. Therefore, an upward sloping yield curve indicates an expectation of higher rates in the future, while a downward sloping curve indicates an expectation that rates will fall in the future. A humped curve indicates that rates are expected to rise and then fall in the future. Therefore, the yield curve is said to reflect a market consensus of expected future interest rates.
LIQUIDITY PREFERENCE THEORY
According to this theory, investors prefer short-term bonds because they are more liquid and less volatile in price. An investor who prefers liquidity will venture into longer-term bonds only if there is sufficient additional compensation for assuming the additional risks of lower liquidity and increased price volatility.
According to this theory, an upward sloping yield curve (see Figure 7.1) reflects additional return for assuming additional (term) risk. Although the simplicity of this theory makes it appealing, it does not explain a downward sloping yield curve.
SEVEN • FIXED-INCOME SECURITIES: PRICING AND TRADING 7•17
© CSI GLOBAL EDUCATION INC. (2010)
MARKET SEGMENTATION THEORY
The various institutions that are major players in the fixed-income arena each concentrate their efforts in a specific term sector. For example, the major chartered banks tend to invest in the short-term market, while life insurance companies, because of their long investment horizon, mainly operate in the long-term bond sector.
This theory postulates that the yield curve represents the supply of and demand for bonds of various terms, primarily influenced by the bigger players in each sector. This theory can explain all types of yield curves, from normal (i.e., upward sloping curve) to inverted (i.e., downward sloping curve) to humped.
BOND PRICING PROPERTIES
In the section on calculating present value, we saw how to determine the appropriate price to pay for a bond or other fixed-income security. However, it is also important to know where that price is headed. The previous section on general interest rate levels and term structure may help you forecast generally where bond prices may be headed, but you should understand the specific features of an individual bond that determine how that particular bond will react to rate changes.
There are some conventional rules regarding the price changes of fixed-income securities. Each rule is explained below. Then we will look at the specific features that may be attached to a bond, with a focus on the way they affect price changes. These rules and features will help you assess the price volatility, and therefore risk, of any fixed-income security.
The yields in the following tables are calculated using precise present value techniques, including annual compounding and full reinvestment of all coupons at the prevailing yield.
The Relationship Between Bond Prices and Interest RatesThe most important bond pricing relationship to understand is the inverse relationship between bond prices and interest rates (or bond yields)—as interest rates rise, bond prices fall and as interest rates fall, bond prices rise.
It is also important to recognize that interest rates and bond yields are often used interchangeably. Each represents a rate of return on an investment. Therefore, as interest rates rise, the yields on competing investments must also rise, and vice versa. As we saw in the section on yield calculations, bond prices fall when bond yields rise.
Table 7.1 shows a 7% five-year annual coupon bond. When yields on this type of bond are 7%, this bond will be priced at par, or 100 (line 3). Suppose that yields on bonds of this type increase to 8%. This bond will drop in price to 96.01 (line 2). If yields instead drop to 6%, the price of this bond will rise above par to 104.21 (line 4). Bond prices and bond yields, then, are inversely related.
BOND PRICING PROPERTIES

CANADIAN SECURITIES COURSE • VOLUME 17•18
© CSI GLOBAL EDUCATION INC. (2010)
TABLE 7.1 INTEREST RATE CHANGES AND BOND PRICES
7% Five-Year Bond
Line % Yield% Change
Yield PricePrice
Change% Price Change
1 9 +28.57 92.22 -7.78 -7.78
2 8 +14.29 96.01 -3.99 -3.99
3 7 0 100.00 0 0
4 6 -14.29 104.21 +4.21 +4.21
5 5 -28.57 108.66 +8.66 +8.66
The Impact of MaturityThe next important relationship to recognize is that longer-term bonds are more volatile in price than shorter-term bonds. Table 7.2 compares a 7% five-year annual coupon bond with a 7% ten-year annual coupon bond. Note that if interest rates are 7%, both bonds will be priced at par to yield 7%.
TABLE 7.2 INTEREST RATE CHANGES AND TERM
7% Five-Year Bond
% Yield% Change
Yield PricePrice
Change% PriceChange
9 +28.57 92.22 -7.78 -7.78
8 +14.29 96.01 -3.99 -3.99
7 0 100.00 0 0
6 -14.29 104.21 +4.21 +4.21
5 -28.57 108.66 +8.66 +8.66
7% Ten-Year Bond
% Yield% Change
Yield PricePrice
Change% PriceChange
9 +28.57 87.16 -12.84 -12.84
8 +14.29 93.29 -6.71 -6.71
7 0 100.00 0 0
6 -14.29 107.36 +7.36 +7.36
5 -28.57 115.44 +15.44 +15.44

SEVEN • FIXED-INCOME SECURITIES: PRICING AND TRADING 7•19
© CSI GLOBAL EDUCATION INC. (2010)
If interest rates rise to the point at which each bond yields 8%, both the five-year and the ten-year bond will drop in price. However, the five-year bond drops 3.99%, and the ten-year bond drops 6.71%. A similar pattern occurs when interest rates, and therefore yields, drop. Because there is greater uncertainty about the markets and interest rates the farther out into the future we go, the longer the term of the bond, the more volatile its price. The longer-term bond will rise more sharply (7.36% if yields drop to 6%) than the shorter-term bond (which rises only 4.21%).
As a bond approaches its maturity over the years, it will become less volatile. For example, a bond originally issued with a ten-year maturity will, seven years later, have a three-year term, and will be priced as and trade as a three-year bond at that time.
The Impact of the CouponOur next pricing relationship states that lower-coupon bonds are more volatile in price than high-coupon bonds. Table 7.3 compares a 7% five-year annual coupon bond with a 6% five-year annual coupon bond. All other factors are assumed to be constant, such as credit quality and liquidity, therefore the only difference between the two bonds is the coupon rate. Market rates start at 7%.
TABLE 7.3 INTEREST RATE CHANGES AND COUPON
7% Five-Year Bond
% Yield% Change
Yield PricePrice
Change% PriceChange
9 +28.57 92.22 -7.78 -7.78
8 +14.29 96.01 -3.99 -3.99
7 0 100.00 0 0
6 -14.29 104.21 +4.21 +4.21
5 -28.57 108.66 +8.66 +8.66
6% Five-Year Bond
% Yield% Change
Yield PricePrice
Change% PriceChange
9 +28.57 88.33 -7.57 -7.89
8 +14.29 92.01 -3.89 -4.06
7 0 95.90 0 0
6 -14.29 100.00 +4.10 +4.28
5 -28.57 104.33 +8.43 +8.79
When yields rise, for example, from 7% to 8%, both bonds drop in price, but the lower coupon bond drops more (4.06%) than the higher-coupon bond (which drops 3.99%). This difference is significant when there is a considerable difference between coupons, or when large sums of

CANADIAN SECURITIES COURSE • VOLUME 17•20
© CSI GLOBAL EDUCATION INC. (2010)
money are invested. Even in this case of relatively similar coupons and a small change in yields, the difference in price change is $0.10 ($3.89 versus $3.99).
The Impact of Yield ChangesOur last bond pricing relationship states that the relative yield change is more important than the absolute yield change. For example, a drop in yield from 12% to 10% will have a smaller impact on a bond’s price than a drop in yield from 4% to 2%. Although both represent a drop of 200 basis points, the former is a 17% change in yield, and the latter is a 50% change in yield. Thus, bond prices are more volatile when interest rates are low.
This principle applies even when the change in yield is small. Returning to the sample 7% five year annual coupon bond and a yield of 7% (the bond is priced at par). Table 7.4 demonstrates that a 1% drop in yield leads to a different (and greater) change in price than a 1% rise in yield. The price rises by $4.21 in the first scenario, and falls by $3.99 in the second.
TABLE 7.4 RELATIVE INTEREST RATE CHANGES
7% Five-Year Bond
% Yield% Change
Yield PricePrice
Change% PriceChange
9 +28.57 92.22 -7.78 -7.78
8 +14.29 96.01 -3.99 -3.99
7 0 100.00 0 0
6 -14.29 104.21 +4.21 +4.21
5 -28.57 108.66 +8.66 +8.66
Duration as a Measure of Bond Price VolatilityChanges in interest rates represent one of the main risks faced by investors when holding fixed-income securities. We discussed the following relationships:
• The value of a bond changes in the opposite direction to changes in interest rates—i.e., as interest rates rise, bond prices fall and as interest rates fall, bond prices rise.
• For two bonds with the same term to maturity and the same yield, the bond with the higher coupon is usually less volatile in price than the bond with the lower coupon.
• For two bonds with the same coupon rate and same yield, the bond with the longer term to maturity is usually more volatile in price than the bond with the shorter term to maturity.
As we have seen, it is fairly easy to compare bonds with the same term to maturity or the same coupon, but how do we compare bonds with different coupon rates and different terms to maturity? For example, how can we determine whether a bond with a high coupon and a long term will be more or less volatile than a bond with a lower coupon and a shorter term?

SEVEN • FIXED-INCOME SECURITIES: PRICING AND TRADING 7•21
© CSI GLOBAL EDUCATION INC. (2010)
A given change in interest rates will impact the price of bonds with different features, coupons, maturities, protective covenants, etc. differently. For bondholders, being able to determine the impact of interest rate changes on bond prices will lead to better investment decisions.
Fortunately, a calculation exists called duration, which combines both the impact of the coupon rate and the term to maturity into one calculation.
Duration is a measure of the sensitivity of a bond’s price to changes in interest rates. It is defined as the approximate percentage change in the price or value of a bond for a 1% change in interest rates. The higher the duration of the bond, the more it will react to a change in interest rates. Duration is simply an investment tool that helps investors determine the volatility or riskiness of a bond or a bond fund – i.e., how much the price of the bond will move up or down with changes in interest rates. In this way, a single duration figure for each bond can be compared directly with the duration of every other bond.
Consider a bond with a duration of 10. According to our definition, the price of this bond will change by approximately 10% for each 1% change in interest rates. Let’s assume that the bond is currently priced at 105. If interest rates rise by 1% then the price of the bond will fall by approximately 10% to 94.50. This is calculated as 105 – (10% × 105).
Since a higher duration translates into a higher percentage price change for a given change in yield, an investor will realize the greatest return from an expected decline in interest rates by investing in bonds with a higher duration. If he does this and interest rates do fall, he will earn a greater return than if he had invested in bonds with lower duration. The same is true when interest rates are expected to rise. To protect a bond portfolio from a dramatic decline due to an interest rate increase, investors should invest in bonds with low duration.
We are not constrained to 1% interest rate changes. As long as the duration of the bond is known, the effect of any range of interest rate changes can be determined. For example, for a 50-basis-point or 0.5% change in interest rates, the approximate price change on our bond with a duration of 10 is 5% (10 × 0.5%); for a 0.25% change in interest rates, the approximate price change on the bond is 2.5% (10 × 0.25%) etc.
Table 7.5 shows the impact interest rate changes have on bonds with different durations. As the table shows, the same interest change of 1% has a greater impact on the price of Bond A compared with the price change on Bond B.

CANADIAN SECURITIES COURSE • VOLUME 17•22
© CSI GLOBAL EDUCATION INC. (2010)
TABLE 7.5 IMPACT OF AN INTEREST RATE CHANGE ON BONDS WITH DIFFERENT DURATIONS
Bond ADuration = 10
Bond BDuration = 5
Both Bond A and Bond B are priced at $1,000 $1,000
Interest rates rise by 1%
• the price of Bond A falls by 10%
• the price of Bond B falls by 5% $900 $950
Interest rates fall by 1%
• the price of Bond A rises by 10%
• the price of Bond B rises by 5% $1,100 $1,050
Calculation of a bond’s duration is complicated. Moreover, a bond’s duration can change over longer holding periods and larger interest rate swings. Therefore, we have not shown its calculation here. Duration is explained more fully in CSI’s Investment Management Techniques (IMT), Portfolio Management Techniques (PMT), and Wealth Management Essentials (WME) courses.
BOND-SWITCHING STRATEGIES
Because of changing prices and yields as well as changing yield curves, there are often many bond switching opportunities in bond portfolios. At times, an investor may sell one bond and replace it with another, to capture some advantage. These types of trades are called bond switches. A summary of the possible benefits from bond switches follows.
Net yield improvement: Bond switching may offer opportunities to improve after-tax yield without adversely affecting quality. For example, a high-tax-bracket investor will be better off in deep discount bonds than in high-coupon bonds, even if the gross yield is the same, because the tax rate on the discount portion of the yield will be based on the capital gains rate and therefore lower. On the other hand, a low-tax-bracket investor would be better off in a high-coupon bond.
BOND-SWITCHING STRATEGIES

SEVEN • FIXED-INCOME SECURITIES: PRICING AND TRADING 7•23
© CSI GLOBAL EDUCATION INC. (2010)
Example: In Year 0, John Smith, an investment advisor, met with Mary Chan, an investor in a 50% income tax bracket, to discuss Mary’s inherited portfolio. In the bond section of her portfolio, John noticed $40,000 OneProvince 10% bonds due in Year 18, priced at 98. John suggested that Mary sell these bonds and use the proceeds to buy TwoProvince 7.5% bonds due in Year 12, at 79.25. John explained that because Mary was in a high tax bracket, the switch would improve her after-tax yield. More of the return would be provided by the capital gain on the deep discount bonds, on which a lower rate of tax applies (capital gains tax versus tax on interest income). Using the approximate yield to maturity method, the after-tax yields on the two issues, using a 50% capital gains rate, are:
• TwoProvince 7.5% bonds due in Year 12, bought at 79.25 = 5.63%
• OneProvince 10% bonds due in Year 18, sold at 98 = 5.13%
• Therefore, the gain in net yield on the securities = 0.49%
For information purposes only:
After-tax yield calculation for the Two Province bond:
Coupon income $7.50
Tax payable on coupon income: $7.50 x 50% (marginal tax rate) $3.75
Net coupon income: $3.75
Annual amount of capital gain: (100 – 79.25) ÷ 12 $1.73
Taxable amount of capital gain: $1.73 x 50% (capital gains exemption) x 50% $0.43
Net capital gain: $1.73 – $0.43 $1.30
Net interest Net capital gainAverage bond price
$3.75 $1.30(100 79.25) 2
After-tax yield 5.63%
* The same calculation can be applied to the OneProvince bond.
Term extension or reduction: Bond switching offers profitable opportunities in this area because of changing yield curves and changing requirements.
Example: A sale of $25,000 ABC Corp. 6% bonds, due March 1, 2015, at 98 and a subsequent purchase of XYZ Corp. 6.25% bonds, due September 1, 2020, at 98.5 would result in an extension of the term by fi ve and a half years at little cost. The proceeds from the sale are more or less equal to the cost of the purchased bonds, while the yield is also relatively unchanged. The only question is whether XYZ Corp. has the same credit standing as ABC Corp. This would have to be checked carefully in advance.
Credit improvement: Bond switching can improve the yield for corporate bonds, where the prospects for entire industries or particular companies can change radically and quickly.
Example: In Year 0, John Smith, an investment advisor, met with Mary Chan, an investor in a 50%income tax bracket, to discuss Mary’s inherited portfolio. In the bond section of her portfolio, Johnnoticed $40,000 OneProvince 10% bonds due in Year 18, priced at 98. John suggested that Mary sellthese bonds and use the proceeds to buy TwoProvince 7.5% bonds due in Year 12, at 79.25. Johnexplained that because Mary was in a high tax bracket, the switch would improve her after-tax yield.More of the return would be provided by the capital gain on the deep discount bonds, on which alower rate of tax applies (capital gains tax versus tax on interest income). Using the approximate yieldto maturity method, the after-tax yields on the two issues, using a 50% capital gains rate, are:
• TwoProvince 7.5% bonds due in Year 12, bought at 79.25 = 5.63%
• OneProvince 10% bonds due in Year 18, sold at 98 = 5.13%
• Therefore, the gain in net yield on the securities = 0.49%
For information purposes only:
After-tax yield calculation for the Two Province bond:
Coupon income $7.50
Tax payable on coupon income: $7.50 x 50% (marginal tax rate) $3.75
Net coupon income: $3.75
Annual amount of capital gain: (100 – 79.25) ÷ 12 $1.73
Taxable amount of capital gain: $1.73 x 50% (capital gains exemption) x 50% $0.43
Net capital gain: $1.73 – $0.43 $1.30
Net interest Net capital gainAverage bond price
$3.75 $1.30(100 79.25) 279.25)79.25)
After-tax yield 5.63%
* The same calculation can be applied to the OneProvince bond.

CANADIAN SECURITIES COURSE • VOLUME 17•24
© CSI GLOBAL EDUCATION INC. (2010)
Portfolio diversification: Price changes in a portfolio, or the impact of new cash income or cash requirements, may make it necessary to review the diversification of the portfolio to ensure that risks are spread out.
Example: A small mutual fund with $10 million in assets divided equally between Government of Canada bonds and equities would have to be careful to keep a balanced portfolio, if new sales of units suddenly brought an additional $4 million into the fund. To retain the same balance as before, no more than $2 million of the new amount should be invested in bonds. Preferably this would be in types of bonds that are not already held in the fund, to retain adequate diversifi cation.
Cash take-outs: Cash take-outs are possible when the proceeds from the sale of a bond are greater than the cost of the bond bought with the proceeds. Sometimes it is possible to do this without adversely affecting yield or quality.
Example: A sale of $40,000 of the OneProvince bonds (described above) at 98 would produce pre-tax proceeds of $39,200, excluding accrued interest. If Mary then reinvested in $40,000 of the TwoProvince bonds at 81.25, the cost would be $32,500, not counting accrued interest. Consequently Mary could have a pre-tax cash take-out of about $6,700.
BOND MARKET TRADING
When a securities transaction has been confirmed, the change in legal ownership is effective immediately. However, payment for purchased securities does not have to be made until sometime later, and the securities do not have to be delivered until the end of this time period, called the settlement period. The length of the settlement period varies depending on the type of security.
Table 7.6 presents a summary of settlement periods for various Government of Canada (GoC) and other fixed-income securities.
TABLE 7.6 BOND SETTLEMENT PERIODS
Security Settlement
GoC Treasury Bills Same day
GoC bonds with a term of three years or less to maturity (or to the earliest call date, where a transaction is completed at a premium).
Second clearing day after the transaction takes place
GoC bonds with a term to maturity of more than three years (or to the earliest call date where a transaction is completed at a premium) and all other bonds, debentures, or other certifi cates of indebtedness.
Third clearing day after the transaction takes place
BOND MARKET TRADING

SEVEN • FIXED-INCOME SECURITIES: PRICING AND TRADING 7•25
© CSI GLOBAL EDUCATION INC. (2010)
Clearing and SettlementIn the past, debt securities were issued in coupon-bearing form—an actual certificate was produced, and detachable coupons were attached to the residual principal payment. On each coupon payment date, investors would “clip” the coupon and submit it to a bank or other financial institution for payment from the issuer. At maturity, the same would be done with the residual principal. These types of bonds were known as bearer bonds, and some (though not many) still exist today.
However, the risk of losing certificates was a concern, because bearer bonds could be sold or transferred by the holder, whether or not he or she was the rightful owner. Eventually, as an added layer of protection from theft, the registration of certificates was required. These so-called registered bonds bore the name of the rightful owner and could be sold or transferred only when the owner signed the back of the certificate. In addition, coupon payments were mailed to the registered owner of the bond.
However, the evolution of bond markets has led to greater investor demand for greater liquidity, and issuers have also looked for cheaper and faster ways of bringing issues to market. Today, rather than physical certificates, most bond issues around the globe are issued in a book-based format only, with depository, trade clearing and settlement services provided by participating clearing providers. In Canada, the national provider of these services is CDS Clearing and Depository Services Inc.
Calculating Accrued InterestMost bonds pay interest twice a year, on the same month and day as the maturity date and exactly six months later. For example, if a bond’s maturity date is February 15, 2019, interest will be paid every February 15 and every August 15 until maturity. Some Eurobonds pay annually and some provincial and corporate bonds pay monthly.
It is possible, however, to purchase bonds on almost any day. An investor could purchase the above bond on August 1 of any year, hold it for two weeks, and receive a full six months’ worth of interest. This is not equitable to the previous bondholder, who may have held the bond for five and a half months and received no interest. Accrued interest is the amount of interest built up during the previous holding period. It is paid at the time of purchase from the buyer to the previous holder.
Interest accrues from the day after the previous interest payment date up to and including the day of settlement. The client who buys a bond pays the purchase price plus the interest that has accrued or accumulated since the last interest date. This interest is regained if the bond is held until the next interest payment date, or if the bond is sold in the meantime, resulting in accrued interest being paid to the seller.
The amount of accrued interest is found by using three numbers:
• The principal amount
• The coupon rate
• The time period
The amount is based on the par amount purchased or sold. Even though the bond may have been purchased at a premium or a discount, interest is always based on par value. Also, the rate at which interest accrues is the coupon rate of the bond, not its yield.
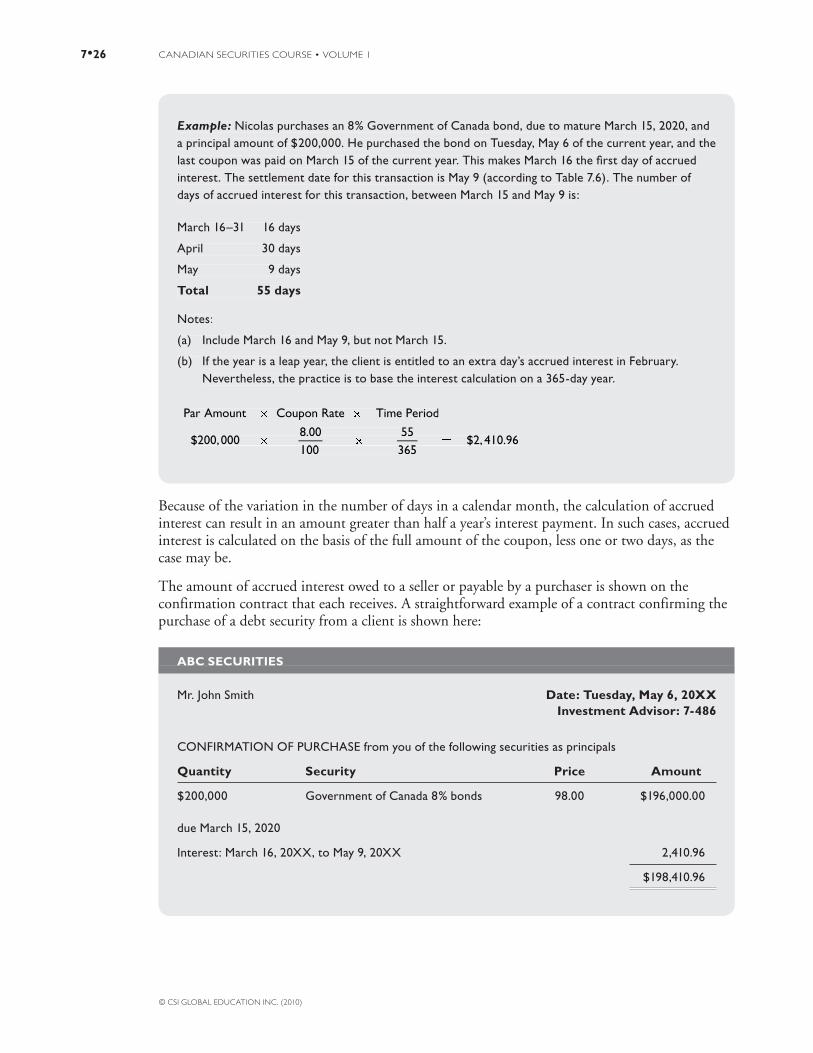
CANADIAN SECURITIES COURSE • VOLUME 17•26
© CSI GLOBAL EDUCATION INC. (2010)
Example: Nicolas purchases an 8% Government of Canada bond, due to mature March 15, 2020, and a principal amount of $200,000. He purchased the bond on Tuesday, May 6 of the current year, and the last coupon was paid on March 15 of the current year. This makes March 16 the fi rst day of accrued interest. The settlement date for this transaction is May 9 (according to Table 7.6). The number of days of accrued interest for this transaction, between March 15 and May 9 is:
March 16–31 16 days
April 30 days
May 9 days
Total 55 days
Notes:
(a) Include March 16 and May 9, but not March 15.
(b) If the year is a leap year, the client is entitled to an extra day’s accrued interest in February. Nevertheless, the practice is to base the interest calculation on a 365-day year.
Par Amount Coupon Rate Time Period
8.00 55$200,000 $2, 410.96
100 365
Because of the variation in the number of days in a calendar month, the calculation of accrued interest can result in an amount greater than half a year’s interest payment. In such cases, accrued interest is calculated on the basis of the full amount of the coupon, less one or two days, as the case may be.
The amount of accrued interest owed to a seller or payable by a purchaser is shown on the confirmation contract that each receives. A straightforward example of a contract confirming the purchase of a debt security from a client is shown here:
ABC SECURITIES
Mr. John Smith Date: Tuesday, May 6, 20XXInvestment Advisor: 7-486
CONFIRMATION OF PURCHASE from you of the following securities as principals
Quantity Security Price Amount
$200,000 Government of Canada 8% bonds 98.00 $196,000.00
due March 15, 2020
Interest: March 16, 20XX, to May 9, 20XX 2,410.96
$198,410.96
Example: Nicolas purchases an 8% Government of Canada bond, due to mature March 15, 2020, anda principal amount of $200,000. He purchased the bond on Tuesday, May 6 of the current year, and the last coupon was paid on March 15 of the current year. This makes March 16 the fi rst day of accrued interest. The settlement date for this transaction is May 9 (according to Table 7.6). The number of days of accrued interest for this transaction, between March 15 and May 9 is:
March 16–31 16 days
April 30 days
May 9 days
Total 55 days
Notes:
(a) Include March 16 and May 9, but not March 15.
(b) If the year is a leap year, the client is entitled to an extra day’s accrued interest in February. Nevertheless, the practice is to base the interest calculation on a 365-day year.
Par Amount Coupon Rate Time Period
8.00 55$200,000 $2, 410.96
8.00 55100 365
Coupon RateCoupon Rate
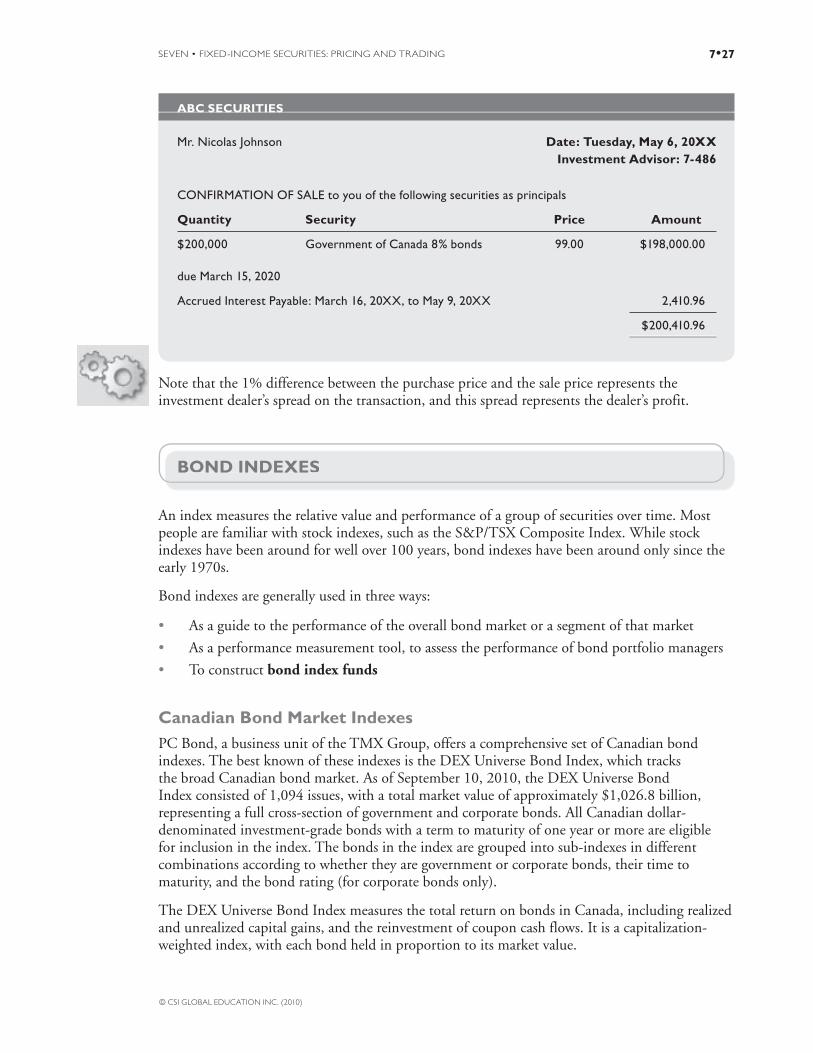
SEVEN • FIXED-INCOME SECURITIES: PRICING AND TRADING 7•27
© CSI GLOBAL EDUCATION INC. (2010)
ABC SECURITIES
Mr. Nicolas Johnson Date: Tuesday, May 6, 20XXInvestment Advisor: 7-486
CONFIRMATION OF SALE to you of the following securities as principals
Quantity Security Price Amount
$200,000 Government of Canada 8% bonds 99.00 $198,000.00
due March 15, 2020
Accrued Interest Payable: March 16, 20XX, to May 9, 20XX 2,410.96
$200,410.96
Note that the 1% difference between the purchase price and the sale price represents the investment dealer’s spread on the transaction, and this spread represents the dealer’s profit.
BOND INDEXES
An index measures the relative value and performance of a group of securities over time. Most people are familiar with stock indexes, such as the S&P/TSX Composite Index. While stock indexes have been around for well over 100 years, bond indexes have been around only since the early 1970s.
Bond indexes are generally used in three ways:
• As a guide to the performance of the overall bond market or a segment of that market
• As a performance measurement tool, to assess the performance of bond portfolio managers
• To construct bond index funds
Canadian Bond Market IndexesPC Bond, a business unit of the TMX Group, offers a comprehensive set of Canadian bond indexes. The best known of these indexes is the DEX Universe Bond Index, which tracks the broad Canadian bond market. As of September 10, 2010, the DEX Universe Bond Index consisted of 1,094 issues, with a total market value of approximately $1,026.8 billion, representing a full cross-section of government and corporate bonds. All Canadian dollar-denominated investment-grade bonds with a term to maturity of one year or more are eligible for inclusion in the index. The bonds in the index are grouped into sub-indexes in different combinations according to whether they are government or corporate bonds, their time to maturity, and the bond rating (for corporate bonds only).
The DEX Universe Bond Index measures the total return on bonds in Canada, including realized and unrealized capital gains, and the reinvestment of coupon cash flows. It is a capitalization-weighted index, with each bond held in proportion to its market value.
BOND INDEXES

CANADIAN SECURITIES COURSE • VOLUME 17•28
© CSI GLOBAL EDUCATION INC. (2010)
Figure 7.2 illustrates the Universe Bond Index returns since 1980.
FIGURE 7.2 DEX UNIVERSE BOND INDEX RETURNS 1980 TO 2009
-5
0
5
10
15
20
25
30
35
40
200520001995 2010199019851980
No
min
al R
etur
n (%
)
Year
Source: Bloomberg
Global IndexesU.S. investment bank Merrill Lynch also maintains a comprehensive set of bond market indexes. Not only does Merrill Lynch track the different segments of the U.S. bond market with many indexes and sub-indexes, but it also monitors the performance of the bond markets for several other countries and regions, including Canada, Europe, Japan, Australia and emerging markets. Each of these markets is also broken down into many market segments.
In Canada, RBC Dominion Securities, CIBC Wood Gundy and Standard & Poor’s also maintain a comprehensive set of Canadian bond market indexes, as do U.S. investment banks Salomon Smith Barney and JP Morgan for both U.S. and international bond markets. Morgan Stanley Capital International (MSCI), a well-known provider of global equity market indexes, also maintains several global bond market indexes.

SEVEN • FIXED-INCOME SECURITIES: PRICING AND TRADING 7•29
© CSI GLOBAL EDUCATION INC. (2010)
SUMMARY
After reading this chapter, you should be able to:
1. Defi ne present value and the discount rate, and perform calculations relating to the present value of a future cash fl ows, bond pricing and yield.
• Present value is the value today of an amount of money to be received in the future and is the most accurate method of determining an appropriate price for a bond.
• The discount rate is the interest rate used to calculate present value. In general it represents the minimum interest rate an investment should provide after factoring in risk.
• The fair price for a bond is the sum of the present value of its coupons and the present value of its principal.
• Treasury bills are purchased at a discount and mature at their full par value. The difference between the purchase price and the maturity value represents the return on the security. The yield on a Treasury bill is calculated as:
100 price 365100
price term
• The current yield of any investment, whether it is a bond or a stock, is the income yield on that security relative to its current market price. The current yield is calculated as follows:
Annual cash flow100
Current market price
• A bond’s yield to maturity incorporates both interest income and any capital gain or loss resulting from holding the bond to maturity. A fi nancial calculator simplifi es the YTM calculation.The approximate yield to maturity on a bond is calculated as:
Interest income Annual price change100
(Purchase price 100) 2
• The yield to maturity (YTM) is calculated based on the assumption that all interest received from coupon bonds is reinvested (or compounded) at the YTM prevailing at the time the bond was purchased. The risk that the coupons cannot be reinvested at that rate is called reinvestment risk.
SUMMARY
CANADIAN SECURITIES COURSE • VOLUME 17•30
© CSI GLOBAL EDUCATION INC. (2010)
2. Defi ne a real rate of return and a yield curve, and evaluate three theories of interest rate determination.
• The real rate of return is the return on an investment adjusted for the effects of infl ation. Because infl ation reduces the value of a dollar, the quoted or nominal return must be reduced by the infl ation rate to arrive at the actual or real rate of return.
• The yield curve is a graphical depiction of interest rates by term to maturity and shows how interest rates on debt securities differ depending on the term to maturity.
• The expectations theory states that the shape of the yield curve is a refl ection of market consensus expectations for future interest rates. For example, an upward sloping curve refl ects the expectation that interest rates will rise in the future.
• According to the liquidity preference theory, investors must be compensated for assuming the risk of holding longer-term debt securities, and this compensation is in the form of a yield or liquidity premium.
• According to the market segmentation theory, investors concentrate their debt holdings in a particular term to maturity. For example, an institutional investor may focus its holdings on bonds with terms of two to fi ve years, while another investor may have a preference for long-term bonds.
3. Analyze the impact of fi xed-income pricing properties on bond prices.
• The value of a bond changes in the opposite direction to interest rates: as interest rates rise, bond prices fall; as interest rates fall, bond prices rise.
• For two bonds with the same term to maturity and the same yield, the price of the bond with the higher coupon rate is usually less volatile than the price of the bond with the lower coupon rate.
• For two bonds with the same coupon rate and same yield, the price of the bond with the longer term to maturity is usually more volatile than the price of the bond with the shorter term to maturity.
• Duration is a measure of the sensitivity of a bond’s price to changes in interest rates. It is defi ned as the approximate percentage change in the price or value of a bond for a 1% change in interest rates. The higher the duration of the bond, the more it will react to a change in interest rates.
4. Explain the rationale for bond switching and describe bond-switching strategies.
• Investors use bond-switching strategies by selling and buying bonds to capture certain advantages, such as yield, term, risk reduction and diversifi cation, among others.
• A net yield improvement is the enhancement of after-tax yield without adversely affecting quality. A term-extension strategy is designed to reduce portfolio risk by extending the term of bond holdings as the yield curve changes. Cash take-outs are possible when the proceeds from the sale of a bond are greater than the cost of the bond bought with the proceeds.

SEVEN • FIXED-INCOME SECURITIES: PRICING AND TRADING 7•31
© CSI GLOBAL EDUCATION INC. (2010)
Now that you’ve completed this
chapter and the on-line activities,
complete this post-test.
5. Summarize the rules and regulations of bond delivery and settlement.
• Trading in Government of Canada Treasury bills is settled on the same day as the transaction.
• Government of Canada bonds with a term to maturity of three years or less settle on the second clearing day after the transaction takes place.
• Government of Canada bonds with a term to maturity of more than three years and all other bonds, debentures, or other certificates of indebtedness settle on the third clearing day after the transaction takes place.
• Interest on a bond accrues from the day after the previous interest payment date up to and including the day of settlement. The client that buys a bond pays the previous holder the purchase price plus the interest that has accrued since the last interest date.
6. Assess the role of bond indexes in the securities industry.
• An index measures the relative value and performance of a group of securities over time.
• Bond indexes are generally used as a guide to the performance of the overall bond market or a segment of that market, and as a performance measurement tool to assess bond portfolio managers. Bond indexes are also used to construct bond index funds.

© CSI GLOBAL EDUCATION INC. (2010) 8•1
Chapter 8
Equity Securities:Common and Preferred
Shares
© CSI GLOBAL EDUCATION INC. (2010)8•2
8
Equity Securities:Common and Preferred Shares
CHAPTER OUTLINE
Common Shares• Benefi ts of Common Share Ownership• Capital Appreciation• Dividends• Voting Privileges• Tax Treatment• Stock Splits and Consolidations• Reading Stock Quotations
Preferred Shares• The Preferred’s Position• Why Companies Issue Preferred Shares• Why Investors Buy Preferred Shares• Preferred Share Features• Straight Preferreds• Convertible Preferreds• Retractable Preferreds• Floating-Rate Preferreds• Foreign-Pay Preferreds• Other Types of Preferreds

© CSI GLOBAL EDUCATION INC. (2010) 8•3
Stock Indexes and Averages• Canadian Market Indexes• U.S. Stock Market Indexes• International Market Indexes and Averages
Summary
LEARNING OBJECTIVES
By the end of this chapter, you should be able to:
1. Discuss the benefi ts of common share ownership, describe how dividends are taxed, declared and claimed, and describe the impact of stock splits and consolidations on shareholders.
2. Discuss the position, advantages, disadvantages and special provisions of preferred shares, differentiate among the types of preferred shares, describe their features, and perform related calculations.
3. Differentiate between a stock market index and an average, and summarize the important stock market indexes and averages.
INVESTING IN EQUITIES
Equity securities, particularly common stocks, are an important part of most investors’ portfolios. History has shown that the return on stocks has exceeded the return on bonds over the long term. In addition, long-term common stock returns have consistently outpaced infl ation, providing long-term protection from a loss of purchasing power.
At the close of trading each day, investors and advisors want to know how the markets performed. To measure performance, market participants look to the various stock market indexes that have developed over time. For the most part, these indexes track the performance of a basket of common shares that represents the most visible and easily accessible of investments. Common shares form the backbone of many investment portfolios and are a major component of pension funds, mutual funds and hedge funds. Unlike many other types of investments, there are a number of inherent rights, advantages and disadvantages of common share ownership with which investors must be familiar.
© CSI GLOBAL EDUCATION INC. (2010)8•4
Closely related, but with some key differences, are preferred shares. Preferred shares are a staple investment in the Canadian market largely because of the fi xed-income stream that the investment generates. With an investment in common shares, what you see is mostly what you get – an ownership position in a company. Preferred shares are a little different in that there is a variety of features and structures, characteristics that make them appeal to different investors for various reasons. You will fi nd that you are familiar with many of the preferred share features discussed in this chapter because they are very similar to the different features available in bonds.
In this fi rst chapter on equity securities, we look at some of the basic features, advantages and disadvantages of investing in common and preferred shares before introducing the important role played by Canadian, U.S. and global stock market indexes.
KEY TERMS
Arrears Floating-rate preferreds
Callable preferreds Foreign-pay preferreds
Canadian Depository for Securities Limited (CDS) Non-callable preferreds
Capital gain Odd lot
Consolidations Open order
Convertible preferreds Participating preferred
Cum dividend Retained earnings
Deferred preferred Restricted shares
Delayed floaters Retractable preferred
Dividend record date S&P/TSX Composite Index
Dividend reinvestment plan Soft retractable preferred
Dividend tax credit Standard Trading Unit
Dividends Stock dividends
Dollar cost averaging Stock split
Dow Jones Industrial Average (DJIA) Street certificates
Ex-dividend Variable rate preferreds
Ex-dividend date Voting rights
In the on-line Learning Guide for this module,
complete the Getting Started
activity.

EIGHT • EQUITY SECURITIES: COMMON AND PREFERRED SHARES 8•5
© CSI GLOBAL EDUCATION INC. (2010)
COMMON SHARES
Common shareholders are the owners of a company and initially provide the equity capital to start the business.
If the venture prospers, the shareholders benefit from the growth in value of their original investment and the flow of dividend income. The prospect of a small investment growing to many times its original value attracts investors to common shares.
On the other hand, if the business fails, the common shareholders may lose their entire investment. This possibility of total loss explains why common share capital is sometimes referred to as venture or risk capital.
Although part owner of the business, the common shareholder is in a relatively weak position, as senior creditors (such as banks), bond and debenture holders and preferred shareholders all have prior claims on the earnings and assets of the company. Unlike debt interest, dividends are payable at the discretion of the Board of Directors. In many companies, dividend payments are a routine matter and can be regularly anticipated by shareholders. For companies in cyclical industries, there is less certainty. Some companies reinvest all earnings in the business; others lack sufficient earnings to pay dividends.
For many years, a purchaser of common shares was given a certificate with the company name and number of shares engraved on it. Some of these certificates were quite elaborately done, with an illustration relating to the company’s business. For the most part, the securities industry has moved away from a paper-based system of ownership. Instead, street certificates are registered in the name of a securities firm rather than the owner of the shares. This procedure is often followed because, like a bond in bearer form, a share certificate in street name is negotiable, that is, readily transferable to a new owner.
CDS Clearing and Depository Services Inc (CDS) offers computer-based systems to replace certificates as evidence of ownership in securities transactions. This system almost eliminates the need to handle securities physically.
Stocks trade in uniform lot sizes on stock exchanges. A standard trading unit is a regular trading unit which has uniformly been decided upon by the stock exchanges. The usual unit of trading for most stock is 100 shares. A group of shares that are traded in less than a standard trading unit is called an odd lot.
Benefits of Common Share OwnershipThe right to buy or sell common shares in the open market at any time is an attractive feature and a relatively simple matter with few legal formalities.
When a company first sells its shares to investors, the proceeds from the sale go to the company. When these outstanding shares are subsequently sold by their holders, the selling price is paid to the seller of the shares and not to the corporation. Shares, therefore, may be transferred from one owner to another without affecting the operations of the company or its finances. From the company’s point of view, the effect of a sale is simply that a new name appears on its list of shareholders.
COMMON SHARES

CANADIAN SECURITIES COURSE • VOLUME 18•6
© CSI GLOBAL EDUCATION INC. (2010)
The following are some of the benefits of common share ownership:
• Potential for capital appreciation
• The right to receive any common share dividends paid by the company
• Voting privileges, including the right to elect directors, to approve fi nancial statements and auditor’s reports, and vote on other important issues
• Favourable tax treatment in Canada of dividend income and capital gains
• Marketability – shareholdings can easily be increased, decreased or sold, for most public companies
• The right to receive copies of the annual and quarterly reports, and other mandatory information pertaining to the company’s affairs
• The right to examine certain company documents such as the by-laws and register of shareholders at specifi ed times
• The right to question management at shareholders’ meetings
• Limited liability
Capital AppreciationFor many investors, the prospect of capital appreciation is the main attraction of common shares. Stocks have proven over time that such an attraction is justified, although not all common shares fulfil this expectation, and even those that do will not necessarily increase in value every year.
As companies earn profits year after year, whatever money is not paid out to shareholders in the form of dividends will remain in the company as retained earnings. Since retained earnings form part of common equity, a growth in retained earnings will add to the value of shareholders’ equity. Assuming a fairly constant number of shares outstanding, the amount of equity that belongs to each share will increase. Since investors relate the price they are willing to pay to a share’s equity or book value, a higher equity per share value will lead to a willingness on the part of investors to pay more to acquire these shares.
Annual growth in the size of a company’s profits also makes its shares attractive to investors. Anticipation that this growth will continue will increase the earnings multiple (i.e., the price earnings ratio) that investors will be willing to pay for the stock. Increased earnings can also lead to an increase in the dividend rate. Since yield is another factor that investors take into account when evaluating stocks, dividend growth can lead to stock price increases.
There are many other factors, both within the company and externally, that can affect a company’s stock price, and careful analysis and selection are required to ensure a profitable investment. Analysis of these factors is the subject of Chapter 13.
DividendsA company’s net earnings are available:
• For distribution as common or preferred share dividends
• As funds to be kept by the company as retained earnings and reinvested in the business
• As a combination of the preceding
EIGHT • EQUITY SECURITIES: COMMON AND PREFERRED SHARES 8•7
© CSI GLOBAL EDUCATION INC. (2010)
Companies vary widely in the percentage of earnings they pay to common shareholders. Payout ratios vary greatly from one industry to another. Mature companies, such as banks, may pay out a substantial percentage of their earnings as dividends to shareholders, while growing companies such as those in the technology field may need to keep a high proportion of earnings within the company to fund the large amount of research and development that are crucial to their success. Dividend policy is determined by the Board of Directors, who are guided primarily by the goals set for the company.
To maintain its operations and finance future growth opportunities, most companies will retain a portion of earnings each year. In the long run, this policy may work to the benefit of shareholders if it results in increased earnings.
Reductions or omissions of dividends do occur, particularly in poor economic times, and although they may be temporary, they do emphasize the risks of common share investment.
REGULAR AND EXTRA DIVIDENDS
Some companies paying common share dividends designate a specified amount that will be paid each year as a regular dividend. The term regular indicates to investors that payments will be maintained, barring a major collapse in earnings.
Some companies may also pay an extra dividend on the common shares, usually at the end of the company’s fiscal year. The extra is a bonus paid in addition to the regular payout – but the term extra cautions investors not to assume that the payment will be repeated the following year. If the company’s earnings are maintained, the extra may be repeated. However, directors can omit the extra at their discretion just as they can with regular dividends.
In calculating an indicated annual yield for a common stock, it is accepted practice to include extra dividends if there is strong evidence that the extra dividend will be paid again.
DECLARING AND CLAIMING DIVIDENDS
Unlike interest on debt, dividends on common shares are not a contractual obligation. The Board of Directors decides whether to pay a dividend, the amount and the payment date. An announcement is made in advance of the payment date. Companies may pay dividends quarterly, semi-annually or annually.
If the shares are registered in the name of the owner, dividend payment cheques are mailed directly to the owner. For shares registered in street certificate form, dividend payments are made to the securities firm whose name appears on the certificate. The dividends are then credited to the accounts of the firm’s clients who own the shares.
EX-DIVIDEND AND CUM DIVIDEND
Many companies place advertisements in financial newspapers announcing the declaration of a dividend. Following is an example of a typical dividend announcement.
EXAMPLE NOTICE OF DIVIDEND
The Board of Directors of ABC Inc. voted to pay on July 2, 20XX to shareholders of record at the close of business on June 13, 20XX a dividend of $0.75 per each share of common stock. The transfer books will not be closed. Payment will be made in Canadian funds.

CANADIAN SECURITIES COURSE • VOLUME 18•8
© CSI GLOBAL EDUCATION INC. (2010)
The purpose of the interval between June 13 and July 2 is to give the company time to prepare the dividend cheques for mailing to recorded shareholders. During this interval, a purchaser of these shares will not receive the dividend that has just been declared and the stock is said to be ex-dividend.
When a stock is actively traded, the record of shareholders is continually changing. For convenience, the company names a date known as the dividend record date. All shareholders recorded as of this date will be entitled to the dividend. The dividend record date is usually two to four weeks in advance of the payment date in order to allow time for cheque preparation.
To determine whether the seller or the buyer is entitled to the dividend when a sale takes place around the time of the dividend payment, the stock exchange names an ex-dividend date. On and after this date, the stock sells ex-dividend; that is, the seller retains the dividend and the buyer is not entitled to it. The ex-dividend date is set at the second business day before the dividend record date. Since trades settle on the third business day after a trade, a purchaser of shares two days before the record date would not have the trade settle until the day after the record date, and would therefore not be a shareholder of record for purposes of receiving the dividend. The following example shows how the shares trade.
Example: Trading Ex- and Cum Dividend
Using the dates in the previous example, and assuming that all are business days, the shares would trade as follows:
Date Traded Date Settled Ex- or Cum Dividend
Monday June 9 Thursday June 12 Cum Dividend
Tuesday June 10 Friday June 13 Cum Dividend
Wednesday June 11 Monday June 16 Ex-dividend
Thursday June 12 Tuesday June 17 Ex-dividend
Friday June 13 Wednesday June 18 Ex-dividend
Monday June 16 Thursday June 19 Ex-dividend
The major Canadian stock exchanges publish dividend announcements in their daily releases to securities firms in the following form:
PaymentWhen
PayableShareholder’s
of Record*Ex-Dividend
Date
A Company .25 June 15 May 14 May 12
B Company .50 August 5 July 15 July 13
* or Shareholders of Record Date
Date Traded Date Settled Ex- or Cum Dividend
Monday June 9 Thursday June 12 Cum Dividend
Tuesday June 10 Friday June 13 Cum Dividend
Wednesday June 11 Monday June 16 Ex-dividend
Thursday June 12 Tuesday June 17 Ex-dividend
Friday June 13 Wednesday June 18 Ex-dividend
Monday June 16 Thursday June 19 Ex-dividend
PaymentWhen
PayableShareholder’s
of Record*Ex-Dividend
Date
A Company .25 June 15 May 14 May 12
B Company .50 August 5 July 15 July 13
* or Shareholders of Record Date

EIGHT • EQUITY SECURITIES: COMMON AND PREFERRED SHARES 8•9
© CSI GLOBAL EDUCATION INC. (2010)
Stocks going ex-dividend sometimes start trading at a price reduced by the exact amount of the dividend. This has an impact on open orders, which are a type of order that is usually entered at a specified price to buy or sell a security and is held open until executed or cancelled. Securities firms adjust open orders as part of standard operating procedures. Firms holding open orders to buy or open stop orders to sell automatically reduce these orders by the amount of the dividend when the stock starts to trade ex-dividend (unless otherwise advised). Open sell orders and open stop orders to buy are not reduced.
The person who buys the stock on the day that it goes ex-dividend does not get the declared dividend, but will of course receive subsequent dividends as long as the shares are held. The person who buys the stock the day before it goes ex-dividend, however, does receive the dividend, and in this case the stock is said to be cum dividend (meaning with dividend). The last day a stock trades cum dividend is the third business day before the dividend record date; in other words, it is the day before the first ex-dividend date.
DIVIDEND REINVESTMENT PLANS
Some major companies give their preferred and common shareholders the option of participating in an automatic dividend reinvestment plan. In such a plan, the company diverts the shareholders’ dividends to the purchase of additional shares of the company. Reinvested dividends are taxable to the shareholder as ordinary cash dividends even though the dividends are not received as cash.
Share purchases in most dividend reinvestment plans are made on the open market under the direction of a trustee. Participating shareholders are periodically sent a statement showing the number of shares, including fractional shares in some cases, bought under the plan and at what price.
Since under a reinvestment plan the company uses authorized dividends to purchase additional shares in bulk, a saving in commission is achieved. An individual shareholder trying to buy the same small number of shares would normally pay a higher commission, particularly if odd lots were involved.
In effect, a dividend reinvestment plan is an automatic savings plan which solves the problem of reinvesting small amounts of cash. Participating shareholders acquire a gradually increasing share position in the company, and because purchases by the plan are made regularly, shareholders can reduce the average cost paid per unit, a process known as dollar cost averaging. The provision in some plans for crediting participating shareholders with applicable fractions of shares is unique. Normally fractions of shares cannot be purchased in the market by a shareholder.
STOCK DIVIDENDS
Sometimes the dividend may be in the form of additional stock rather than cash. Often such dividends are paid from time to time by a rapidly growing company that needs to retain a high degree of earnings to finance future growth. The advantage to the company is that cash is conserved for expansion purposes while shareholders receive additional shares, which can be sold if they require the cash. These stock dividends would be recorded on the Statement of Retained Earnings in the same fashion as cash dividends.
Since stock dividends are treated as regular cash dividends for tax purposes, many investors, given the option, elect to receive dividends in cash.

CANADIAN SECURITIES COURSE • VOLUME 18•10
© CSI GLOBAL EDUCATION INC. (2010)
Voting PrivilegesVoting rights are an important feature of common shares. Through the right to vote at the annual meeting and at special or general meetings, shareholders exercise their rights as owners to control the destiny of the corporation. They elect the directors who guide and control the business operations of the corporation through its officers. Many matters of an unusual, non-recurring nature, such as the sale, merger or liquidation of the business and the amendment of the charter, must receive shareholder approval before action is taken.
However, many companies have two or even three different types of shares, often designated as Class A or B. Because all classes may not have voting rights and may differ in other respects such as dividend entitlement, it is important to know their respective features.
RESTRICTED SHARES
Restricted shares are shares which give the shareholder the right to participate to an unlimited degree in the earnings of a company and in its assets on liquidation, but do not have full voting rights. There are three categories of restricted or special shares:
• Non-voting – shares which have no right to vote, except perhaps in certain limited circumstances;
• Subordinate voting – shares which carry a right to vote, where there is another class of shares outstanding that carry a greater voting right on a per share basis; and
• Restricted voting – shares which carry a right to vote, subject to a limit or restriction on the number or percentage of shares that may be voted by a person, company or group.
In recent years, the number of companies issuing restricted shares has increased substantially. Some investors have become concerned and have resisted reorganizations which involve the creation of restricted shares.
Canadian securities regulators have introduced policies regarding these shares. In Ontario, for example, the details of these policies are set out in Ontario Securities Commission Policy 1.3. Investment advisors should be able to identify restricted shares and understand the implications of the differences in the voting rights of such shares in order to advise their clients properly.
STOCK EXCHANGE REGULATIONS OF RESTRICTED SHARES
The stock exchanges have urged companies having or issuing restricted shares to put in place provisions to ensure that the holders of restricted shares are treated fairly.
Some of the regulations published by the stock exchanges and securities commissions are:
• Restricted shares must be identifi ed by the appropriate restricted share term
• Disclosure documents such as information circulars, annual reports and fi nancial statements which are sent to voting shareholders must be sent to holders of restricted shares and must describe the restrictions on the voting rights of the restricted shares
• Restricted shares must be identifi ed in the fi nancial press with a code
• Dealer and advisor literature must properly describe restricted shares
EIGHT • EQUITY SECURITIES: COMMON AND PREFERRED SHARES 8•11
© CSI GLOBAL EDUCATION INC. (2010)
• Trade confi rmations must identify restricted shares as such
• Holders of restricted shares must be given notice of, be invited to attend and be permitted to speak at shareholders’ meetings
• Minority approval is required for any corporate action which would result in the creation of new restricted shares
Advisors should be aware of the protection offered to restricted shareholders, as the extent of such protection may vary.
Tax TreatmentThe tax system in Canada provides some benefits to investors holding common shares:
• A dividend tax credit is available that makes the purchase of dividend-paying shares of taxable Canadian companies relatively attractive compared to interest paying securities.
• The current exemption from tax of 50% of capital gains provides investors with a tax inducement to buy shares.
• Stock savings plans entitle residents of some provinces to deduct up to specifi ed annual amounts from (or obtain a tax credit for) the cost of certain stocks purchased in their respective provinces during the year.
DIVIDENDS FROM TAXABLE CANADIAN CORPORATIONS
Although greater risk is involved in owning common and preferred shares compared to owning debt securities, the pre-tax yield from common and preferred shares is normally below the yields available from debt investments. This is due to the tax treatment of interest received versus dividends received.
When a company pays interest on its debt, the interest is paid with the company’s pre-tax dollars because interest is considered a tax-deductible cost of doing business. When bond or debenture holders receive interest, it is treated as taxable income in their hands.
When a company pays dividends on its shares, the dividends are paid with after-tax dollars because dividends, being a share of a company’s profits, are not considered a tax-deductible cost of doing business. When shareholders receive dividends, the dollars involved have already been subject to tax in the company’s hands prior to payout. To alleviate double taxation, shareholders of Canadian companies receive tax relief through the dividend tax credit.
This procedure is applicable to dividends received from resident taxable Canadian corporations. No similar preferential treatment is applicable to interest income, foreign dividends or dividends from nontaxable Canadian corporations. The taxpayer is required to gross-up the amount of the dividend by 45% and can then claim a tax credit in the amount of 19% on this amount.
For example, if an individual receives a $100 dividend, it would be reported for tax purposes as $145 (145% of $100) in net income. The additional $45 is referred to as the grossed-up amount and the $145 is known as the taxable amount of dividend.

CANADIAN SECURITIES COURSE • VOLUME 18•12
© CSI GLOBAL EDUCATION INC. (2010)
The taxpayer calculates net income for the year using the $145 amount, and can then claim a credit in the amount of:
19% of the taxable amount of dividend
or
(19% × $145 = $27.55)
The tax credit directly reduces the amount of income tax paid (Taxation is covered in greater detail in Chapter 25).
All provinces and territories provide a dividend tax credit as well.
MINIMIZING TAXABLE INCOME
Dividends from taxable Canadian corporations (but not foreign corporations) are subject to less tax than interest. At the lower tax brackets, these dividends are more tax effective. Accordingly, a shift of investments from interest-paying investments into dividend-paying Canadian stocks may reduce taxes and improve after-tax yield.
TAX ON FOREIGN DIVIDENDS
Individuals who receive dividends from non-Canadian sources usually receive a net amount from these sources, as taxes are usually deducted at source. Such investors may be allowed a deduction from the Canadian income tax otherwise payable. The allowable credit is essentially the lesser of the foreign tax paid and the Canadian tax payable on the foreign income, subject to certain adjustments. Details on foreign tax deductions are available from the Canada Revenue Agency (CRA).
CAPITAL GAINS AND LOSSES
Investors are taxed on any capital gains or losses earned from their investments. Basically, a capital gain arises from the sale (or the deemed sale) of a capital property for more than its cost. A capital loss arises from the sale of a capital property for less than its cost. Any capital gains earned must be reported, and 50% of the gains must be included in income for that year and taxed at the investor’s marginal tax rate. Capital losses can be used to reduce any capital gains that have been earned, but generally cannot be used to reduce any other income. The taxation of capital gains and losses are covered in more detail in Chapter 25.
Stock Splits and ConsolidationsThe common shares of a prospering corporation can rise substantially in price over time. Most companies believe it is good corporate strategy to keep the market price of their shares in a popular price range, say $10 to $20, and use a stock split or subdivision to bring a high-priced stock into this range.
The mechanics of a stock split are straightforward. First, the company’s directors pass and submit a by-law for approval by a vote of the voting common shareholders at a special meeting. Depending on the current market price of the shares, the split could be on any basis such as two new shares for one old share, or three new for one old, or even ten for one.

EIGHT • EQUITY SECURITIES: COMMON AND PREFERRED SHARES 8•13
© CSI GLOBAL EDUCATION INC. (2010)
When a split becomes effective, the market price of the new shares reflects the basis of the split. For example, in a four-for-one split, the market price of shares selling at $100 (pre-split basis) will sell somewhere in the $25 range after the split. An investor who owned 1,000 shares of the company would now own 4,000 shares.
When a split is first announced, the initial effect on the market price of the stock may be bullish. There can be a modest surge in the price of the shares on increased volume. Dividend increases, often announced at the same time, contribute to the initial bullish impact. The effect of a split on the share’s market price after the initial flurry depends on several important factors, such as the company’s earnings trend and the stage of the equity cycle.
Although investor aversion to purchases of odd lots of high-priced shares is usually cited as the main reason for splits, commissions on odd-lot trading may also be a factor. The longer-term results of a split may be to broaden the distribution of a company’s shares, increase marketability and thus facilitate equity financing if required in the future.
While stock splits are associated with active and buoyant stock markets and are generally viewed in a positive light, the split itself does not affect the dollar value of a company’s equity, nor the value of a shareholder’s stake. Equity per share would be reduced, as the total number of shares outstanding would increase, but the equity section of the balance sheet would remain unchanged. Each individual shareholder would own more shares, but there would be a greater number of total shares outstanding, so proportionate ownership would stay the same. Table 8.1 illustrates the impact a stock split has on the financial structure of the company and its shareholders.
TABLE 8.1 EFFECT OF STOCK SPLIT
A company announces a 4 for 1 stock split.
Before the Stock Split
After the Stock Split
# of shares outstanding 1,000,000 4,000,000
Approximate market price per share $100 $25
Capitalization of company $100,000,000 $100,000,000
# of shares owned by Investor A 50,000 200,000
Dollar value of shares owned by Investor A $ 5,000,000 $ 5,000,000
Investor A’s proportionate ownership in company 5% 5%
Reverse stock splits or consolidations can occur with the result that each shareholder’s total shareholdings in a company are reduced. If a reverse split of one new share for four old were implemented after shareholder approval, a shareholder owning 100 shares of stock would own only 25 new shares after the split. The total dollar value of the holdings should theoretically not be affected. If the shares were selling at $0.25 before the split, the new shares would probably trade near $1.00 per share.
Reverse splits occur most frequently when a company’s shares have fallen in value to a level that is unattractive to investors with large amounts of capital. They are utilized when a company is

CANADIAN SECURITIES COURSE • VOLUME 18•14
© CSI GLOBAL EDUCATION INC. (2010)
in danger of being delisted by a stock exchange as the company’s share price has fallen below the exchange’s minimum share price rule.
For example, in March 2003, the price of the common shares of Aventura Energy Inc. had fallen to $0.41. This price level was so low that it discouraged purchases by institutional investors who had policies of avoiding shares with low prices. The company responded by implementing a 1 for 10 reverse split that raised the price to more than $4.00 per share.
A reverse split raises the market price of the new shares and can put the company in a better position to raise new capital.
Reading Stock QuotationsThere are two kinds of stocks traded during the day under review: those that are listed and thus traded on the stock exchanges, and the unlisted stocks that trade on the over-the-counter market.
A typical quotation for stocks traded in Canada during the day under review is shown here:
52 Weeks
High Low Stock Div. High Low Close Change Volume
12.55 9.25 BEC .50 10.65 10.25 10.35 +.50 6,000
This type of quotation is complex but very useful and may vary in format among financial newspaper quotation sections. This quotation means that:
• BEC common has traded as high as $12.55 per share and as low as $9.25 during the last 52 weeks.
• BEC common has paid dividends totalling $0.50 per share during the last 52 weeks (sometimes an indicated dividend rate may be shown if the company pays regular dividends and has recently increased a dividend payment).
• During the day under review, BEC common shares traded as high as $10.65 and as low as $10.25.
• The last trade of the day in this stock was made at $10.35.
• The closing trade price was $0.50 higher than the previous trading day’s closing trade price. (Therefore, BEC shares closed at $9.85 on the previous trading day.)
• A total of 6,000 BEC common shares traded that day.
Market prices used in stock quotations apply to “standard trading units” and exclude commission expense for trades in listed stocks. Financial publications generally provide information on how to read their quotations. To understand a stock quotation, note any code or symbol attached to a quotation and read the appropriate explanation of the code or symbol.
Complete the on-line activity associated with
this section.
52 Weeks
High Low Stock Div. High Low Close Change Volume
12.55 9.25 BEC .50 10.65 10.25 10.35 +.50 6,000

EIGHT • EQUITY SECURITIES: COMMON AND PREFERRED SHARES 8•15
© CSI GLOBAL EDUCATION INC. (2010)
PREFERRED SHARES
Shares can have a number of designations including common, ordinary, subordinated, Class A and preferred. In recent years the name given to shares has become less helpful in determining the attributes attached to the shares. It is necessary to go beyond the name to determine the true characteristics of a company’s shares. The notes to a company’s audited financial statements can be useful in this regard.
In this chapter, references to preferred shares apply to all shares not classified as common or restricted shares.
The Preferred’s PositionTypically, the preferred shareholder occupies a position between that of the company’s creditors and that of the common shareholder. Preferred shareholders are usually entitled to a fixed dividend payable out of retained earnings, subject to the discretion of the Board of Directors.
If a company’s ability to pay interest and dividends deteriorates because of lower earnings, the preferred shareholder is “in the middle.” The investor is better protected than the common shareholders but junior to the claims of the debtholders. It is important to keep in mind that bond and debenture holders are creditors, while preferred shareholders rank afterwards and are part owners along with common shareholders.
Some companies issue more than one class of preferred stock, and when this occurs, each class is separately identified. (Note that in this example, and the ones that follow, reference is sometimes made to preference shares. These shares generally hold the same meaning as preferred shares, but can rank ahead of the different classes of preferred shares that a company has outstanding.)
Example: ABC Corporation Limited has three preference share issues outstanding: a $2.50 Series Class A Preference; a $2.60 Series Class A Preference; and a 1962 $2.70 Series Class B Preference. If various outstanding preferred share issues rank equally as to asset and dividend entitlement, the shares are described as ranking pari passu.
PREFERENCE AS TO ASSETS
Preferred shares are usually given a prior claim to assets ahead of the common shares in the event of bankruptcy or dissolution of a company. Claims of creditors and debtholders rank ahead of preferred shareholder claims, and the common shareholder has to be content with anything that is left after all creditor, debtholder and preferred shareholder claims have been met.
This preference as to assets clause is found in most preferred share issues. Since preferred shareholders usually have no claim on earnings beyond the fixed dividend, it is fair that their position is buttressed by a prior claim on assets ahead of the common shares.
PREFERENCE AS TO DIVIDENDS
Preferred shares are usually entitled to a fixed dividend expressed either as a percentage of the par or stated value, or as a stated amount of dollars and cents.
PREFERRED SHARES

CANADIAN SECURITIES COURSE • VOLUME 18•16
© CSI GLOBAL EDUCATION INC. (2010)
Example: DEF Limited’s 5.6% First Preferred Series U shares pay a fi xed annual dividend of $2.80 per share.
Dividends are paid from earnings – current or past. However, unlike interest on a debt security, dividends are not obligatory and are payable only if declared by the Board of Directors. If the Board omits the payment of a preferred dividend, there is very little the preferred shareholders can do about it. However, the charters of some companies provide that no dividends are paid to common shareholders until preferred shareholders have received full payment of dividends to which they are entitled.
While directors have the right to defer the declaration of preferred dividends indefinitely, in practice dividends are paid if justified by earnings. Failure to declare an anticipated preferred dividend has unfavourable repercussions. Besides weakening investor confidence, the general credit and future borrowing power of the company suffer.
Since most preferred shares can be considered fixed-income securities, they do not offer, from an investment standpoint, the same potential for capital gain that common shares provide. Should interest rates decline, the preferred will increase in price, much like a bond; but good corporate earnings will have no effect on the dividend rate or equity allocation. Thus, the dividend rate is of prime importance to the preferred shareholder.
Why Companies Issue Preferred SharesIn comparison with debt, preferred shares are usually more expensive for a company because dividends paid are not a tax-deductible expense. However, when all considerations are weighed, there may be sufficient advantages to justify a new preferred share issue.
PREFERRED ISSUE VERSUS DEBT ISSUE
From a company’s viewpoint, preferreds do not create the demands that a debt issue creates. Preferreds do not usually have a maturity date, which may come at a financially awkward time, although some may have a purchase fund. If a preferred dividend payment is omitted, no assets are seized by preferred shareholders.
Because of the stringent legalities involved, a company will go to great lengths to avoid missing an interest or principal payment. However, the company has flexibility in deciding whether or not to declare a preferred dividend. Dividends are never omitted without good reason. But to preserve working capital in an emergency, a company’s directors may decide to omit a preferred dividend without jeopardizing the company’s solvency.
A corporation will choose to issue preferreds rather than debt if:
• It is not feasible for it to market a new debt issue. Existing assets may already be heavily mortgaged
• Market conditions are temporarily unreceptive to new debt issues
• The company has enough short- and long-term debt outstanding, i.e., its debt/equity ratio is high. Preferreds will increase the equity component
• The directors are reluctant to assume the legal obligations to pay interest and principal
• The directors decide that paying preferred dividends will not be onerously expensive. The company has a low apparent tax rate, which means it is less of a burden to pay dividends from after-tax profi ts.

EIGHT • EQUITY SECURITIES: COMMON AND PREFERRED SHARES 8•17
© CSI GLOBAL EDUCATION INC. (2010)
PREFERRED SHARES VERSUS COMMON SHARES
When a company has decided it will not or cannot issue bonds or debentures, it may find conditions are not favourable for selling common shares. The stock market may be falling or inactive, or business prospects may be uncertain. However, in such circumstances, preferred shares might be marketed as a compromise acceptable to both the issuing company and investors. Preferreds also offer the advantage of avoiding the dilution of equity that results from a new issue of common shares.
Why Investors Buy Preferred SharesPreferred shares are bought largely by income-oriented investors. Today, conservative individual investors, seeking income, purchase preferred shares to take advantage of the previously mentioned dividend tax credit. Institutional investors are attracted to the preferential tax treatment of preferreds as well. If the institutional investor, such as a pension fund, is not concerned with taxes, they will typically invest in bonds.
Canadian companies also purchase preferred shares as an income investment. Dividends paid by one resident taxable Canadian company to a similar company are not taxable in the hands of the receiving company. This is not the case with debt interest. When Canadian Company One purchases a debt issue of Canadian Company Two, the interest received by Company One is fully taxable in Company One’s hands.
Preferred Share FeaturesWhile the description of the rights of a debtholder is found in the trust deed or indenture, those of a preferred shareholder are found in the charter of the company. A company wishing to issue preferred shares must apply to make the necessary changes to its charter, unless the existing charter provides for issuance of preferred shares at the discretion of the directors.
After deciding to issue preferred shares, the directors meet with the company’s underwriters to determine the type of preferred to issue and the specific features to include. The features described in this section could be built into any of the types of preferred shares just described. Some features strengthen the issuer’s position, others protect the purchaser’s position. The final selection represents a compromise in that the new issue will offer safeguards to the buyer without unduly restricting the issuer.
CUMULATIVE AND NON-CUMULATIVE FEATURES
Most Canadian preferred shares have a cumulative dividend feature built into their terms. With a cumulative feature, if a company’s Board of Directors votes not to pay one or more preferred dividends when due, the unpaid dividends accumulate or pile up in what is known as arrears. All arrears of cumulative preferred dividends must be paid before common dividends are paid or before the preferred shares are redeemed.
If a company’s financial condition weakens because of a decline in earnings, the directors may reluctantly decide to omit a preferred dividend. This will likely cause a decline in the preferred’s market price. If the dividend is cumulative, the shares assume a speculative aspect which will become more pronounced if subsequent dividends are passed, causing the dollar amount of the arrears to grow. Later, if the company’s earnings improve or if losses change to profit, some investors may buy the preferred on speculation that dividends will resume. If a partial or complete repayment of arrears materializes, payment is made to the preferred shareholders
CANADIAN SECURITIES COURSE • VOLUME 18•18
© CSI GLOBAL EDUCATION INC. (2010)
owning shares at the time of repayment. No payments are made to preferred shareholders who previously sold their stock, and no interest is paid on arrears.
On non-cumulative preferreds, the shareholder is entitled to payment of a specified dividend in any year, only when declared.
When a non-cumulative preferred dividend is passed, arrears do not accrue and the preferred shareholder is not entitled to “catch-up” payments if dividends resume. For this reason, the dividend position of non-cumulative preferred shares is very weak.
Investors should determine if a cumulative feature is present before purchasing a preferred.
CALLABLE AND NON-CALLABLE FEATURES
Issuers of preferred shares frequently reserve the right to call or redeem preferred issues at a stated time and at a stated price. A call feature is a convenience to the issuer, rather than to the purchaser.
As with callable corporate debt, callable preferreds usually provide for payment of a small premium above the amount of per share asset entitlement fixed by the charter, as compensation to the investor whose shares are being called in.
The company will typically try to buy shares for cancellation on the open market or through invitations for tenders addressed to all holders. The price paid under these circumstances generally must not exceed the par value of the preferred shares plus the premium provided for redemption by call.
Non-callable preferred shares cannot be called or redeemed as long as the issuing company is in existence. This feature is restrictive from the issuer’s standpoint, in that it freezes a part of the capital structure for the life of the company. The feature is, therefore, rarely built into the terms of Canadian preferreds. It is advantageous to the purchaser since the investment cannot be redeemed.
VOTING PRIVILEGES
Virtually all preferred shares are non-voting so long as preferred dividends are paid on schedule. However, once a stated number of preferred dividends have been omitted, it is common practice to assign voting privileges to the preferred.
Issuing companies may consider a non-voting feature advantageous since it ensures the preferred shareholders have no say in running the company’s affairs so long as dividend requirements are met.
However, preferred shareholders are usually given a vote on matters affecting the quality of their security. For example, if the company intended to increase the amount of preferred stock authorized, the preferred shareholders would have to approve the new issue. Sometimes, the approval of holders of a stated percentage of the preferred shares outstanding must be obtained before funded debt is created.
PURCHASE FUNDS AND SINKING FUNDS
Many redeemable Canadian preferred shares have a purchase fund or a sinking fund built into their terms. These features are similar to those found in bonds and debentures, discussed in Chapter 6. A purchase fund is advantageous to preferred shareholders because it means that if the

EIGHT • EQUITY SECURITIES: COMMON AND PREFERRED SHARES 8•19
© CSI GLOBAL EDUCATION INC. (2010)
price of the shares declines in the market to or below a stipulated price, the fund will make every effort to buy specified amounts of shares for redemption. Consequently, a preferred share issue with a purchase fund has potential built-in market support through the fund’s purchasing efforts each year.
Straight PreferredsThese are preferred shares with normal preferences as to asset and dividend entitlement ahead of the common shares. Straight preferreds may have any or all of the features described previously. Since straight preferreds pay a fixed dividend rate, the shares trade in the market on a yield basis. As with the market price of bonds and debentures, if interest rates rise the market price of straight preferreds will fall, and if interest rates decline the market price of straight preferreds will rise.
From the standpoint of the purchaser, straight preferred shares provide:
• Greater safety than common shares through preference to dividend and asset entitlements
• A tax advantage to individuals through the dividend tax credit and to corporations which receive preferred dividends from taxable Canadian companies on a tax-exempt basis
• Less safety than a debt investment since dividends are not a legal obligation
• A fi xed dividend rate which will not be increased
• No voting privileges (unless a stated number of dividend payments are in arrears)
• No maturity date, unlike a debt investment
• Poorer marketability than common shares because there are usually fewer preferred shares than common outstanding
• Limited appreciation potential compared to common shares. The price at which the preferred could be redeemed by the issuer will limit any appreciation that might occur as a result of a decline in interest rates.
Convertible PreferredsConvertible preferreds are similar to convertible bonds and debentures because they enable the holder to convert the preferred into some other class of shares (usually common) at a predetermined price(s) and for a stated period of time. More recently, preferred shares have been issued where both the holder and the issuer have conversion privileges.
Conversion terms are set when the preferred is created and normally specify the number of common shares into which each preferred is convertible. The preferred price is set at a modest premium (perhaps 10% to 15%) above its converted value. The purpose of the premium is to discourage an early conversion, which would defeat the purpose of the convertible offering. Virtually all conversion privileges expire after a stated period of time, usually five to twelve years from the date of issue.
Example: GHI Inc., 4.70% Non-Cumulative Preferred Shares, Series J are convertible by the holder on a minimum of 65 days’ notice beginning July 31, 2015, and on the last day of January, April, July and October of each year into common shares. The conversion rate is determined by using a formula that considers the conversion date, declared and unpaid dividends, and the weighted average trading price of the common shares on the TSX over a specifi ed period. These shares are also convertible by the company beginning April 30, 2009 under various terms.
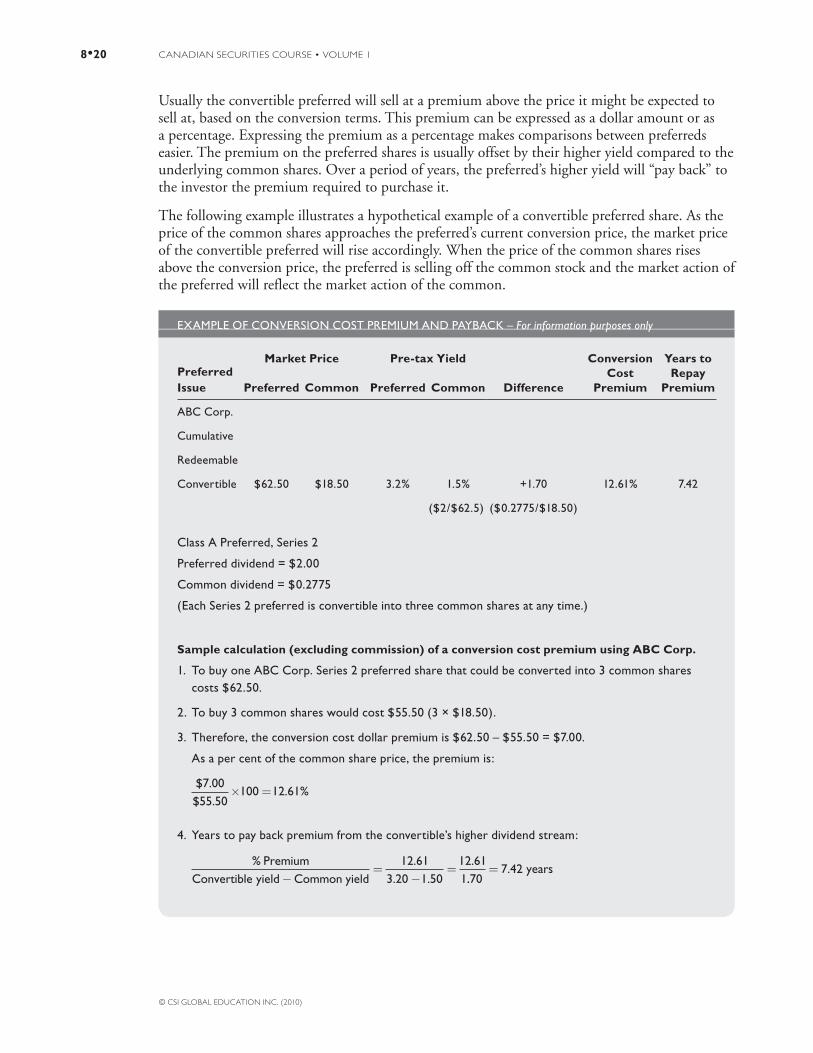
CANADIAN SECURITIES COURSE • VOLUME 18•20
© CSI GLOBAL EDUCATION INC. (2010)
Usually the convertible preferred will sell at a premium above the price it might be expected to sell at, based on the conversion terms. This premium can be expressed as a dollar amount or as a percentage. Expressing the premium as a percentage makes comparisons between preferreds easier. The premium on the preferred shares is usually offset by their higher yield compared to the underlying common shares. Over a period of years, the preferred’s higher yield will “pay back” to the investor the premium required to purchase it.
The following example illustrates a hypothetical example of a convertible preferred share. As the price of the common shares approaches the preferred’s current conversion price, the market price of the convertible preferred will rise accordingly. When the price of the common shares rises above the conversion price, the preferred is selling off the common stock and the market action of the preferred will reflect the market action of the common.
EXAMPLE OF CONVERSION COST PREMIUM AND PAYBACK – For information purposes only
Preferred Issue
Market Price Pre-tax Yield
Difference
Conversion Cost
Premium
Years to Repay
PremiumPreferred Common Preferred Common
ABC Corp.
Cumulative
Redeemable
Convertible $62.50 $18.50 3.2% 1.5% +1.70 12.61% 7.42
($2/$62.5) ($0.2775/$18.50)
Class A Preferred, Series 2
Preferred dividend = $2.00
Common dividend = $0.2775
(Each Series 2 preferred is convertible into three common shares at any time.)
Sample calculation (excluding commission) of a conversion cost premium using ABC Corp.
1. To buy one ABC Corp. Series 2 preferred share that could be converted into 3 common shares costs $62.50.
2. To buy 3 common shares would cost $55.50 (3 × $18.50).
3. Therefore, the conversion cost dollar premium is $62.50 – $55.50 = $7.00.
As a per cent of the common share price, the premium is:
$ .$ .
. %7 0055 50
100 12 61
4. Years to pay back premium from the convertible’s higher dividend stream:
% .. .
.PremiumConvertible yield Common yield
12 613 20 1 50
12 611..
.70
7 42 years

EIGHT • EQUITY SECURITIES: COMMON AND PREFERRED SHARES 8•21
© CSI GLOBAL EDUCATION INC. (2010)
SELECTING CONVERTIBLE PREFERREDS
Convertible preferreds are issued either in markets where a straight preferred is difficult to sell or in a situation where a high level of dividend coverage is lacking. Because of the added benefit of a conversion feature, the dividend on a convertible is often less than that of a comparable straight preferred.
From the standpoint of the purchaser, convertible preferred shares:
• Provide a two-way security: the holder is in a more secure position than the common shareholder and yet can realize a capital gain if the market price of the common rises suffi ciently
• Usually provide a higher yield than the underlying common shares
• Provide the right to obtain common shares through conversion without paying a commission
• Usually provide a lower yield than a comparable straight preferred
• Are vulnerable to a decline in price if selling off the common and the price of the common declines
• Sometimes convert into less (or more) than a standard trading unit of common shares which in turn may be a little more diffi cult to sell than a standard trading unit
• Revert to a straight preferred when the conversion period expires if conversion has not taken place
Retractable PreferredsWhile most preferred shares are redeemable, there is no assurance that redemption will occur, because the call privilege rests with the company. A retractable preferred shareholder, on the other hand, can force the company to buy back the retractable preferred for cash on a specified date(s) and at a specified price(s). Some are issued with two or more retraction dates. The principle of retraction, or pulling back, is identical to that described in Chapter 6 for retractable bonds and debentures. The holder of a retractable preferred can create a maturity date for the preferred by exercising the retraction privilege and tendering the shares to the issuer for redemption. The term soft retractable preferred refers to those retractables where the redemption value may be paid in cash or in common shares, generally at the election of the issuer.
Example: JKL Inc., Series 14, Cumulate Class A Preference Shares are retractable on the fi rst of each March, June, September and December at $100 per share.
From the standpoint of the purchaser, retractable preferred shares:
• Provide a predetermined date(s) and price(s) to tender shares for retraction. The shorter the time interval to the retraction date, the less vulnerable is the stock’s market price to increases in interest rates. Whereas a straight preferred will decline in price if interest rates rise, a retractable preferred will not fall signifi cantly below its retraction price as the retraction date approaches

CANADIAN SECURITIES COURSE • VOLUME 18•22
© CSI GLOBAL EDUCATION INC. (2010)
• Provide a capital gain if purchased at a discount from the retraction price and subsequently tendered at the retraction price
• Will sell above the retraction price and at least as high as the call price if interest rates decline suffi ciently
• Do not retract automatically. The retraction privilege will expire, if no action is taken by the holder during the election period(s)
• Become straight preferred shares if not retracted when the election period(s) expires. If this occurs in a period of high or rising interest rates, the stock’s market value will decline. The shares will sell on a straight yield basis after the retraction privilege expires.
Floating-Rate PreferredsIdentical in concept to variable or floating rate debentures, floating- or variable-rate preferreds pay dividends in amounts that fluctuate to reflect changes in interest rates. If interest rates rise, so will dividend payments, and vice versa.
Floating-rate preferreds are issued:
• During periods in the market when a straight preferred is hard to sell and the issuer has rejected making the issue convertible (because of potential dilution of equity) or retractable (because holders could force redemption on a specifi ed date); and
• When the issuer believes interest rates will not go much higher than they are at the date of issuance of the new issue. The company, in any event, is prepared to pay a higher dividend if interest rates rise. Of course, if interest rates decline, the issuer will pay a smaller dividend (subject in most cases to a guaranteed minimum rate).
Example: MNO Corp. Floating Rate Cumulative Series II shares are entitled to cumulative preferential cash dividends. The quarterly dividend rate is one quarter of 70% of the prime rate times $25. The dividend rate is set on the last business day of the preceding month.
Some preferred shares may have delayed floating-rate features. Known as delayed floaters, fixed-reset or fixed floaters, these shares entitle the holder to a fixed dividend for a predetermined period of time after which the dividend becomes variable.
From the standpoint of the purchaser, variable rate preferreds provide:
• Higher income if interest rates rise, but lower income if interest rates fall
• A variable amount of annual income that is diffi cult to predict accurately but which will refl ect prevailing interest rate levels
• An investment with a market price less responsive to changes in interest rates compared to the market prices of straight preferred shares. The dividend payout of a variable rate preferred is tied to changes in interest rates on a predetermined basis. Accordingly, the preferred’s market price is less sensitive to changes in interest rates.
EIGHT • EQUITY SECURITIES: COMMON AND PREFERRED SHARES 8•23
© CSI GLOBAL EDUCATION INC. (2010)
Foreign-Pay PreferredsMost Canadian preferreds pay dividends in Canadian funds. However, it is possible for a company to create and issue preferreds with dividends and certain other features payable in or related to foreign funds. These are known as foreign-pay preferreds.
Example: PQR 5.95% Non-cumulative Class B Series 10 shares pay an annual dividend of US$1.4875.
The key factor to selecting a foreign-pay preferred is the desirability of receiving dividends in a currency other than Canadian funds. There is additional risk in the form of foreign currency risk.
If the foreign currency increases in value compared to the Canadian dollar, your dividend will increase.
If, however, the Canadian dollar increases in value compared to the foreign currency, your dividend will decrease in value when you convert it to Canadian funds.
One of the advantages of this type of preferred share is that, although the dividend is received in a foreign currency, because it is paid by a Canadian company, the dividend is eligible for the dividend tax credit.
Other Types of PreferredsNew products are constantly being introduced to the marketplace. Many of these new products are custom-made for the issuer or the buyer (usually institutional). There are other types of preferreds that are not as common as those mentioned above but do trade, such as participating preferreds and deferred preferreds. The investor and the advisor must always investigate the security, in order to confirm the features of that particular issue.
Participating preferred shares have certain rights to a share in the earnings of the company over and above their specified dividend rate.
Example: STU Inc. Non-cumulative Participating Voting Preferred shares participate equally with subordinate voting shares in any further dividends after $0.009375 per share has been paid on the subordinate voting shares. The shareholder can also participate in any distribution of assets.
Deferred preferred shares do not pay out a regular dividend. Instead, the shares mature at a preset future date and the return is based on the purchase price and the redemption value paid out at maturity. On the maturity date, the difference between the purchase price and the redemption value is referred to as the “dividend premium” (and this represents a cumulative amount equal to the dividends that would have been received had the investor purchased a preferred share that paid a regular annual dividend). The dividend premium is not eligible for the dividend tax credit. The amount of the dividend premium is taxable as ordinary income. If the shares are sold prior to redemption, the income is treated as a capital gain (or loss).
These shares allow investors to defer taxes paid on income earned until a later date and are attractive to investors who do not have an immediate need for regular income. The shares are also attractive for investors who want to receive compounded growth in a registered account, such as an RRSP, as taxes are deferred to a later period.

CANADIAN SECURITIES COURSE • VOLUME 18•24
© CSI GLOBAL EDUCATION INC. (2010)
STOCK INDEXES AND AVERAGES
Stock indexes or averages are indicators used to measure changes in a representative grouping of stocks, such as the S&P/TSX Composite Index or the Dow Jones Industrial Average (DJIA). These indicators are important tools and are used to:
• Gauge the overall performance and directional moves in the stock market
• Enable portfolio managers and other investors to measure their portfolio’s performance against a commonly used yardstick within the stock market
• Create index mutual funds
• Serve as underlying interests for options, futures and exchange-traded funds
A stock index is a time series of numbers used to calculate a percentage change of this series over any period of time. Most stock indexes are value-weighted and are derived by using the total market value (i.e., market capitalization) of all stocks used in the index relative to a base period. The total market value of a stock is found by multiplying its current price by the number of shares outstanding. Each day, the total market value of all stocks included in the series is calculated, and this value is compared to the initial base value to determine the percentage change in the index.
Example: The S&P/TSX Composite Index closed at a value of 11,338 on September 28, 2009, and at a value of 12,278 on September 28, 2010. The change in the Index translates into a gain of 8.29% for the period.
In a value-weighted index, such as the S&P/TSX Composite Index or the S&P 500, companies with large market capitalizations dominate changes in the value of the index over time. Thus a change in the market capitalization of a large company will have a greater impact on the value of the index than a comparable change in the market capitalization of a smaller company.
A stock average is the arithmetic average of the current prices of a group of stocks designed to represent the overall market or some part of it. Most stock averages are price-weighted, which means that movements in the average are tied directly to changes in the prices of the stocks included in the group.
Probably the most widely used stock market average is the Dow Jones Industrial Average (DJIA). The DJIA includes 30 large, blue-chip stocks that trade on the New York Stock Exchange (NYSE). The DJIA is computed each day by adding up the current prices of the 30 stocks in the index and dividing by a specific divisor developed by Dow Jones & Co. The divisor adjusts the sum of the stock prices to reflect more accurately changes in value, for example from stock splits or mergers.
In contrast to a market-weighted stock index, stocks included in an average are composed of equally weighted items. Within a stock index, each stock has a relative weight based on the stock’s total market capitalization. A stock’s relative weight within an index can change every day, whereas a stock’s weight within an average is always the same.
STOCK INDEXES AND AVERAGES
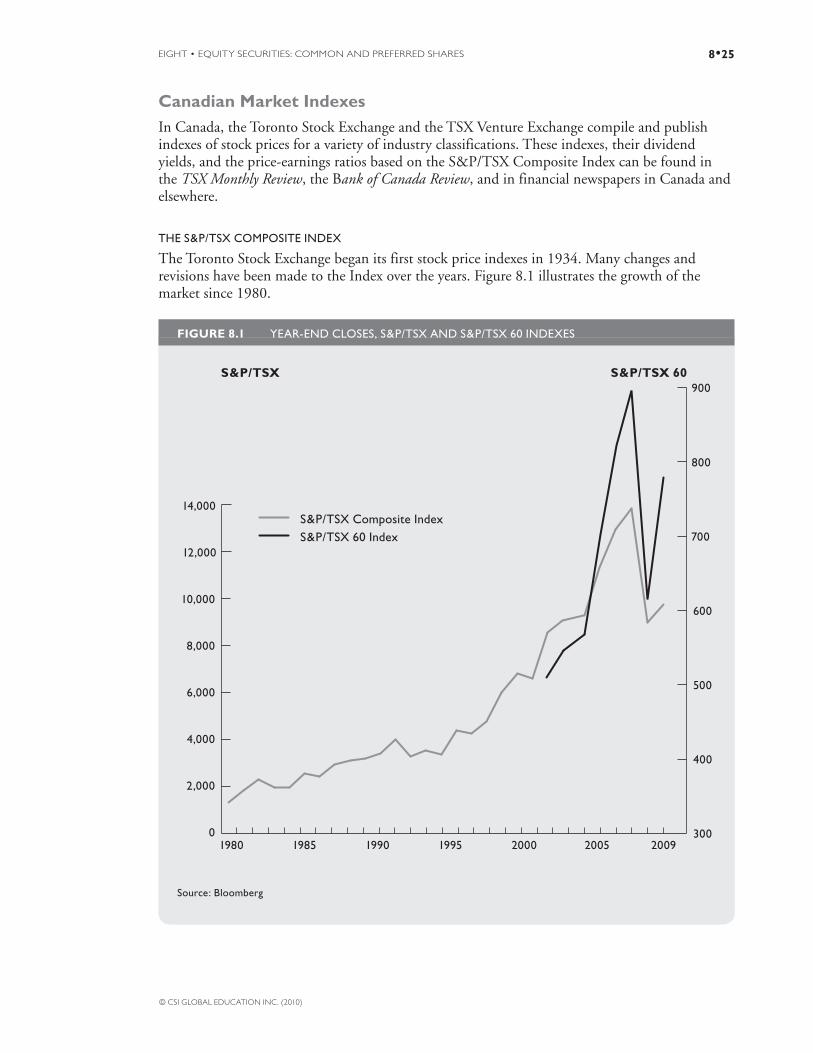
EIGHT • EQUITY SECURITIES: COMMON AND PREFERRED SHARES 8•25
© CSI GLOBAL EDUCATION INC. (2010)
Canadian Market IndexesIn Canada, the Toronto Stock Exchange and the TSX Venture Exchange compile and publish indexes of stock prices for a variety of industry classifications. These indexes, their dividend yields, and the price-earnings ratios based on the S&P/TSX Composite Index can be found in the TSX Monthly Review, the Bank of Canada Review, and in financial newspapers in Canada and elsewhere.
THE S&P/TSX COMPOSITE INDEX
The Toronto Stock Exchange began its first stock price indexes in 1934. Many changes and revisions have been made to the Index over the years. Figure 8.1 illustrates the growth of the market since 1980.
FIGURE 8.1 YEAR-END CLOSES, S&P/TSX AND S&P/TSX 60 INDEXES
0
2,000
4,000
6,000
8,000
10,000
S&P/TSX 60 IndexS&P/TSX Composite Index
S&P/TSX 60S&P/TSX
300
400
500
600
1980 1985 1990 1995 2000 2005 2009
70012,000
14,000
800
900
Source: Bloomberg
CANADIAN SECURITIES COURSE • VOLUME 18•26
© CSI GLOBAL EDUCATION INC. (2010)
The S&P/TSX Composite Index measures changes in the total market capitalization of the stocks in the Index. A stock’s weight within the Index changes if its price or the number of shares outstanding changes. The Index has a floating number of stocks.
To be included in the Index, a stock must meet the following criteria based on price, capitalization and liquidity:
• Companies must be listed on the Toronto Stock Exchange for at least 12 full calendar months as of the month end prior to the index stock review meeting;
• A company must have a minimum trade-weighted price of $1.00 over the past quarter as well as a closing price greater than or equal to $1 at the previous month-end;
• A company must represent a minimum weight of 0.05% of the Index, after including the fl oat for that company in the total fl oat capitalization for the Index;
• Trading volume, value and transactions of a candidate company for the 12 months immediately preceding its consideration as a candidate for inclusion in the Index must be at least 0.025% of the sum of all eligible companies, trading volume, value and number of transactions, as determined by trading on the Toronto Stock Exchange; and
• A company must have no more than 25 non-trading days over the past 12 full calendar months. The actual stocks that make up the S&P/TSX Index are reviewed quarterly. Stocks that no longer meet the S&P/TSX Index Maintenance Criteria are removed. At that time, stocks newly eligible for inclusion can be added.
The stocks are also classified by industry into ten sectors, based on the Global Industry Classification Standard (GICS). This standard was developed jointly by S&P and MSCI (Morgan Stanley Capital International Inc.) for use in all their indexes and is accepted worldwide. An Index has been created for each sector. There are also three subsector indexes, specific to the Canadian market: Diversified Mining, Real Estate and Gold. Table 8.2 lists the ten major industry sector indexes and their relative weights within the S&P/TSX Index.

EIGHT • EQUITY SECURITIES: COMMON AND PREFERRED SHARES 8•27
© CSI GLOBAL EDUCATION INC. (2010)
TABLE 8.2 10 SECTORS OF THE S&P/TSX COMPOSITE INDEX, DECEMBER 2009
Industry Group Relative Weight (%)
Financials 30.4
Energy 27.5
Materials 19.4
Industrials 5.6
Consumer Discretionary 4.3
Telecommunication Services 4.3
Information Technology 3.5
Consumer Staples 2.8
Utilities 1.7
Health Care 0.5
Total 100.00
Source: Bloomberg
In 1980 the Toronto Stock Exchange introduced a set of Total Return Indexes to complement the basic market value indexes. They measure changes in the portfolio caused not only by stock price fluctuations, but also by the reinvestment of dividends and other distributions from the stocks. Thus, these indexes show the compound return available from investing in stocks over time. They are recalculated once each day. The base for all Total Return Indexes was set equal to 1,000 in December 1976. The S&P/TSX Composite Total Return Index closed at 31,019 in December 2009, while the S&P/TSX Composite closed at 11,746.
Complete historical data on most indexes as well as related earnings, price-earnings ratios, dividends and other data are available from the Toronto Stock Exchange and other sources.
To interpret the indexes, it is important to understand the distinction between point changes and percentage changes. Based on the starting level of 250 for an index, a 1% change in the index is equivalent to 2.5 index points (calculated as 1% or 0.01 × 250). Similarly, a 1% change in other widely quoted indexes is not the same in terms of net point changes. For example, a 1% change is approximately:
• 125 points when the S&P/TSX is trading around 12,500
• 105 points when Tokyo’s Nikkei 225 is trading around 10,500
• 10 points when the S&P 500 is trading around 1000
Therefore, as indexes move up and down, the percentage change is a more accurate reflection of market performance than net point changes. Also, when a percentage change of the S&P 500 is compared to a percentage change in the S&P/TSX, currency values should be taken into account. An investment in the S&P 500 is in U.S. dollars, whereas an investment in the S&P/TSX would be made in Canadian dollars.
CANADIAN SECURITIES COURSE • VOLUME 18•28
© CSI GLOBAL EDUCATION INC. (2010)
THE S&P/TSX 60 INDEX
The S&P/TSX 60 Index was launched in December 1998 as part of a new partnership between Standard & Poor’s and the Toronto Stock Exchange. The index includes the 60 largest companies that trade on the TSX as measured by market capitalization and is broken down into 10 sectors that cover all S&P/TSX Index subgroups. All stocks listed on this index must also be included in the S&P/TSX Composite Index.
THE S&P/TSX VENTURE COMPOSITE INDEX
The S&P/TSX Venture Composite Index is a Canadian benchmark index for the public venture capital marketplace. Managed by Standard & Poor’s, it is a market capitalization-based index meant to provide an indication of performance for companies listed on the TSX Venture Exchange.
The index does not have a fixed number of companies, and is revised quarterly based on specific criteria for inclusion and maintenance policies. TSX Venture Exchange-listed companies are eligible for inclusion in the S&P/TSX Venture Composite Index if they are incorporated under Canadian federal, provincial or territorial jurisdictions and represent a relative weight of at least 0.05% of the total index market capitalization. Stocks eligible for inclusion must generally be listed on the TSX Venture Exchange for at least 12 full calendar months as of the effective date of the quarterly revision.
U.S. Stock Market Indexes
THE DOW JONES INDUSTRIAL AVERAGE
Although normally around 2,300 issues trade daily on the New York Stock Exchange, the most publicity is given to the trading performance of the 30 issues that make up the Dow Jones Industrial Average.
When a client asks, “How’s New York today?” he or she usually means, “How is the DJIA performing?” With a history dating back to before the turn of the century, the DJIA has become and remains synonymous with the New York market, though recently, broader indexes such as the Standard & Poor’s 500 have also become popular.
The DJIA has been criticized because so few companies are included in this average, which means that it is not a truly representative indicator of broad market activity. Also, since it is price weighted, when a higher-priced stock rises, it may distort the average. Even with the DJIA’s shortcomings, many people still use it as if it were an overall indicator of market performance. Figure 8.2 shows the performance of the DJIA and S&P 500 from 1985 to the present.

EIGHT • EQUITY SECURITIES: COMMON AND PREFERRED SHARES 8•29
© CSI GLOBAL EDUCATION INC. (2010)
FIGURE 8.2 HISTORY OF S&P 500 AND DOW JONES INDUSTRIAL AVERAGE 1985 TO 2009
0
2,000
4,000
6,000
8,000
10,000
12,000
'04'00'96'92'88'840
250
500
750
1,000
1,250
1,500
Dow Jones Industrial Average
S&P 500
DJIA
14,0001,750
'07 '09
S&P
Source: Bloomberg
As mentioned, the DJIA is calculated by adding the prices of each of the 30 issues in the average and dividing by a specially calculated divisor. The divisor was initially the number of stocks in the average – originally 14 (12 railways, 2 industrials). Because of obvious distortion through stock splits (a 2-for-1 split would mean a $100 share would become $50 in the average after the split), the divisor was adjusted downward for each split.
The calculation of the average simply adds the prices of the 30 issues before applying the divisor. Therefore, a stock that sells for a higher price receives a larger weight in the calculation than one selling for a lower price, even though the aggregate market value of each issue (price multiplied by the number of shares) may be about the same or even lower for the higher-price share.
It is important to view the DJIA in perspective. Because it comprises such a small number of components, day-to-day changes may appear more dramatic than they actually are. Also, since the DJIA is composed of blue-chip stocks with a typically lower risk profile, it tends to underperform the broader market over the longer term.
THE S&P 500
Because the Dow Jones average is not completely satisfactory as an indicator of broad market performance, other market indexes have been developed, such as the Standard & Poor’s 500 Stock Composite Index. This index is based on a large number of industrial stocks, some financial stocks, some utility stocks, and a smaller number of transportation stocks, which are weighted in the index by their market capitalization.

CANADIAN SECURITIES COURSE • VOLUME 18•30
© CSI GLOBAL EDUCATION INC. (2010)
Since the S&P 500 is weighted by market capitalization, more heavily weighted stocks have a greater effect on the value of the index, whereas higher-priced stocks have a greater effect on the level of the DJIA.
The S&P has become the main gauge for measuring the investment performance of institutional investments in the United States because of its broad industry coverage and the method of weighting the index. Many institutional investors have created investment funds that track the S&P 500.
OTHER U.S. STOCK MARKET INDEXES
This list is by no means exhaustive, but includes the most well-known indexes. Many other U.S. indexes exist.
The New York Stock Exchange Indexes: The New York Stock Exchange (NYSE) compiles five common stock indexes – composite, industrials, transportation, utilities, and finance and real estate. The indexes include all the listed common equities on the New York Stock Exchange applicable to each group, and are adjusted to reflect changes in listings. Like the Standard & Poor’s Indexes, the NYSE series are weighted according to market capitalization.
The AMEX Market Value Index: This market-weighted index is based on all the stocks listed on the American Stock Exchange (about 800). It includes the reinvestment of dividends, so it is a total return index.
The NASDAQ Composite Index: The NASDAQ index is a market-weighted index of more than 4,000 stocks that are traded over the counter. This index is dominated by smaller capitalization companies. Its market value is only about 13% of the NYSE-listed companies.
The Value Line Composite Index: Value Line is a composite index of about 1,700 stocks that is calculated by taking an average of the daily percentage change in each stock within the index. This equal-weighted index attempts to cover all the stocks for which there are daily quotations available. It was created by Wilshire Associates and is the broadest available barometer of all the U.S. indexes. Wilshire has also created other indexes.
International Market Indexes and AveragesAs the economy becomes more global, it makes sense for investors to diversify their equity portfolios by investing not only in various industries and stocks, but in different countries. As the economies of more and more countries mature, their equity markets grow in size and sophistication, and it becomes easier for foreign investors to enter.
During most of the 1980s, most funds that invested outside Canada preferred the large, liquid global stock markets such as those of the United States, the United Kingdom, Japan, Germany, France and Switzerland. However, in the 1990s, interest developed in riskier, more exotic markets such as those of China, India, Turkey, Sri Lanka, Taiwan, Korea and Mexico, which also have stock indexes.
Nikkei Stock Average (225) Price Index: This average is calculated like the Dow Jones average and was first released by the Tokyo Stock Exchange in 1950. This index is well known both inside and outside Japan. The equity derivatives based on this index trade on the SIMEX in Singapore.

EIGHT • EQUITY SECURITIES: COMMON AND PREFERRED SHARES 8•31
© CSI GLOBAL EDUCATION INC. (2010)
The FTSE 100 Index: This index consists of the 100 largest listed companies by market capitalization and is one of the most widely followed indexes in the United Kingdom. It is calculated using the market capitalization of the stock and is recalculated on a minute-by-minute basis.
The German DAX Index: The German DAX consists of 30 selected blue-chip stocks and is the most widely followed index on the German securities market. The index was set to 1,000 in 1987 and is weighted by market capitalization. Dividends and income from subscription rights are reinvested in the index.
The CAC 40 Share Price Index: The CAC 40 Index was developed in 1988 to serve as an underlying index for derivative products. It is based on 40 of the largest 100 companies in France. It is calculated on a market capitalization basis and had a base of 1,000 at December 31, 1987.
The Swiss Market Index: The Swiss Market Index (SMI) is Switzerland’s blue-chip index, which makes it the most important in the country. The index is made up of a maximum of 30 of the largest and most liquid stocks on the Swiss market, ranked by market capitalization. It was introduced on June 30, 1988 at a baseline value of 1,500.
CANADIAN SECURITIES COURSE • VOLUME 18•32
© CSI GLOBAL EDUCATION INC. (2010)
SUMMARY
After reading this chapter, you should be able to:
1. Discuss the benefi ts of common share ownership, describe how dividends are taxed, declared and claimed, and describe the impact of stock splits and consolidations on shareholders.
• The benefi ts of common share ownership can include capital appreciation, the right to receive common share dividends paid by the company, voting privileges, favourable tax treatment of dividends and capital gains, marketability through ease of disposition and acquisition, the right to receive fi nancial data and other relevant information in a standardized format, the right to examine relevant and specifi c company documents, the right to attend and ask questions at shareholders meetings, and limited liability.
• The board of directors decides whether to pay a dividend, the amount and the payment date.
• Individuals that have legal ownership of the shares before the ex-dividend date will receive the dividend; these individuals are the shareholders of record.
• Dividends received in unregistered accounts are subject to taxation, including those reinvested in dividend reinvestment plans and stock dividends.
• A dividend tax credit is available on dividends paid from taxable Canadian corporations. Dividends paid on foreign equities are also subject to taxation but receive no favourable tax treatment.
• A stock split increases the number of shares outstanding, while a consolidation reduces the number of shares outstanding. The market price of the underlying stock is adjusted to refl ect the split or consolidation on the day it occurs.
2. Discuss the position, advantages, disadvantages and special provisions of preferred shares, differentiate among the types of preferred shares, describe their features, and perform related calculations.
• Preferred shareholders occupy a position between the company’s creditors (including bondholders) and the company’s common shareholders, if any.
• Benefi ts of preferred shares can include preference as to assets and dividends ahead of common shareholders in the event of bankruptcy or dissolution of the company (although behind creditors or bondholders), and usually an entitlement to a fi xed dividend payable out of retained earnings, subject to the discretion of the Board of Directors.
• Preferred shares are usually more expensive for a company than issuing debt because dividends paid are not a tax-deductible expense.
SUMMARY

EIGHT • EQUITY SECURITIES: COMMON AND PREFERRED SHARES 8•33
© CSI GLOBAL EDUCATION INC. (2010)
• Preferred shares are typically issued instead of debt securities when it is not practical or feasible to issue new debt, market conditions are temporarily unreceptive to new debt issues, the company’s current debt-to-equity ratio is high, the company does not want to assume legal obligations related to debt, or a low apparent tax rate makes it cost effective to pay dividends from after-tax profi ts.
• Holders of cumulative preferred shares have the right to accumulate unpaid dividends in arrears and to have all accumulated dividends paid before dividends are paid on common shares or before the preferred shares are redeemed.
• Holders of non-cumulative preferred shares are entitled to payment of a specifi ed dividend in any year but only when declared.
• Issuers of callable preferred shares have the right to call or redeem preferred issues at a stated time and at a stated price.
• Non-callable preferred shares cannot be called or redeemed as long as the issuing company is in existence.
• Preferred shares are usually non-voting as long as preferred dividends are paid on schedule; however, once a stated number of preferred dividends have been omitted, it is common practice to assign voting privileges to the preferred shareholders.
• A purchase or sinking fund will attempt to buy preferred shares in the market if the price of the shares declines to or below a stipulated price.
• Straight preferred shares have normal preferences as to asset and dividend entitlement, pay a fi xed dividend rate, and trade in the market on a yield basis.
• Convertible preferred shares enable the holder to convert the preferred shares into some other class of shares (usually common) at a predetermined price and for a stated period of time.
• A retractable preferred shareholder can force the company to buy back the retractable preferred shares on a specifi ed date(s) and at a specifi ed price(s).
• Floating- or variable-rate preferred shares pay dividends in amounts that fl uctuate to refl ect changes in interest rates.
• Foreign-pay preferred shares pay dividends in a foreign currency or in relation to a foreign currency.
• Participating preferred shares have certain rights to a portion of company earnings over and above their specifi ed dividend rate.
• Deferred preferred shares do not pay out a regular dividend. Shares mature at a preset future date with the return based on the difference between the purchase price and the redemption value paid out at maturity.

CANADIAN SECURITIES COURSE • VOLUME 18•34
© CSI GLOBAL EDUCATION INC. (2010)
3. Differentiate between a stock market index and an average, and summarize the important stock market indexes and averages.
• A stock index is a time series of numbers used to calculate a percentage change in the series over any period of time.
• A stock average is the arithmetic average of the current prices of a group of stocks designed to represent the overall market or some part of it.
• The most important domestic stock market indexes include the S&P/TSX Composite Index, the S&P/TSX 60 Index, and the S&P/TSX Venture Composite Index.
• The most important U.S. stock market indexes and averages include the Dow Jones Industrial Average, the S&P 500, the New York Stock Exchange Indexes, the Amex Market Value Index, the NASDAQ Composite and the Value Line Composite.
• International indexes of signifi cance include the Nikkei Stock Average (225) Price Index, United Kingdom FTSE 100 Index, German DAX, France CAC 40 Share Price Index, and the Swiss Market Index.
Now that you’ve completed this
chapter and the on-line activities,
complete this post-test.

© CSI GLOBAL EDUCATION INC. (2010) 9•1
Chapter 9
Equity Securities: Equity Transactions

© CSI GLOBAL EDUCATION INC. (2010)9•2
9
Equity Securities: Equity Transactions
CHAPTER OUTLINE
Cash Accounts• Cash Account Rules• Free Credit Balances
Margin Accounts• Long Margin Accounts• Margining Long Positions
Short Selling• How Short Selling Is Done• Dangers of Short Selling
Trading and Settlement Procedures• Trading Procedures
Buying and Selling Securities
Summary

© CSI GLOBAL EDUCATION INC. (2010) 9•3
LEARNING OBJECTIVES
By the end of this chapter, you should be able to:
1. Distinguish between cash and margin accounts.
2. Calculate margin requirements for long and short positions.
3. Describe the process of short selling and discuss the risks associated with short selling.
4. Describe the trading and settlement procedures for equity transactions.
5. Distinguish among the types of buy and sell orders.
SECURITIES TRANSACTIONS IN PRACTIVE
Now that we have a better understanding of the types of securities that trade in the market, we turn our attention in this chapter to the mechanics of trading securities.
Learning about investment theory and other industry considerations is a critical part of being a successful advisor or investor. However, the mechanical process by which investments are acquired, held and disposed of is equally important. On the surface, buying or selling a stock on the Toronto Stock Exchange seems fairly straightforward, but there is more to it than simply calling a broker or discount brokerage and placing an order to buy 100 shares of CP Rail. The investor has the option of buying the shares on margin or short selling stock. The investor can also place a limit price on the trade, place the trade at the market, or add other conditions to the purchase.
These are important considerations because they affect the process of making an investment decision and ultimately the investment strategy being pursued. There are, of course, risks, advantages and disadvantages to the chosen trading strategy. This chapter focuses on equity transactions – margin, short selling, and the various buy and sell orders investors use to trade stocks.
In the on-line Learning Guide for this module,
complete the Getting Started
activity.

© CSI GLOBAL EDUCATION INC. (2010)9•4
KEY TERMS
All or none order Margin account
Any part order Margin Call
Cash account Market order
Day order Professional (PRO) order
Good through order Settlement date
Good till cancelled order Short position
Limit order Short sale
Long position Stop buy order
Margin Stop loss order

NINE • EQUITY SECURITIES: EQUITY TRANSACTIONS 9•5
© CSI GLOBAL EDUCATION INC. (2010)
CASH ACCOUNTS
A securities transaction through a dealer member must be made in either a cash account or a margin account.
• Cash accounts: Clients with regular cash accounts are expected to make full payment for purchases or full delivery for sales on or before the settlement date which is prescribed by industry rules and specifi ed in the contract. The normal settlement date is prescribed as the following business days after the transaction date:
• Government of Canada Treasury bills – same day as the transaction takes place
• Government of Canada bonds with a term of three years or less – two business days after
• All other securities – three business days after
• Margin accounts: In contrast, margin accounts are for clients who wish to buy and/or sell securities on credit and initially pay only part of the full price of the transaction. In such cases, the dealer member lends the remainder of the transaction price to the client, charging interest on the loan.
It is important to recognize the difference between cash accounts and margin accounts. When a client opens a cash account, the member does not grant credit and the explicit understanding is that the client will settle on the settlement date. On the other hand, when a client opens a margin account, it is on the explicit understanding that the member is granting credit based on the market value and quality of the securities held long and/or short in the account.
A long position represents actual ownership in a security. For example, an investor who is long 100 shares of CP Rail owns 100 shares of CP Rail’s stock. In contrast, a short position is created when an investor sells a security that he or she does not own.
Cash Account RulesIn most cases, a firm’s computerized accounting system will flag settlement dates for clients’ transactions. The computer will also keep track of the dates when accounts become overdue and the amounts of capital that must be maintained by the member to carry these overdue accounts. At a certain point, the account will become restricted and trading activity will no longer be permitted until the account is settled.
Dealer members may adopt more stringent rules to minimize the amount of capital being unprofitably tied up in carrying delinquent cash accounts. IAs must know industry and their own firm’s requirements as well as acceptable methods of settling both normal cash account transactions and those where restrictions have later been imposed.
Free Credit Balances Free credit balances are uninvested funds held in client accounts that the dealer member may use as a financing source for its business. These funds are, however, payable on demand to their clients. The exchanges and IIROC require that every statement of account given or sent to a customer by a dealer member contain the following written notice:
CASH ACCOUNTS
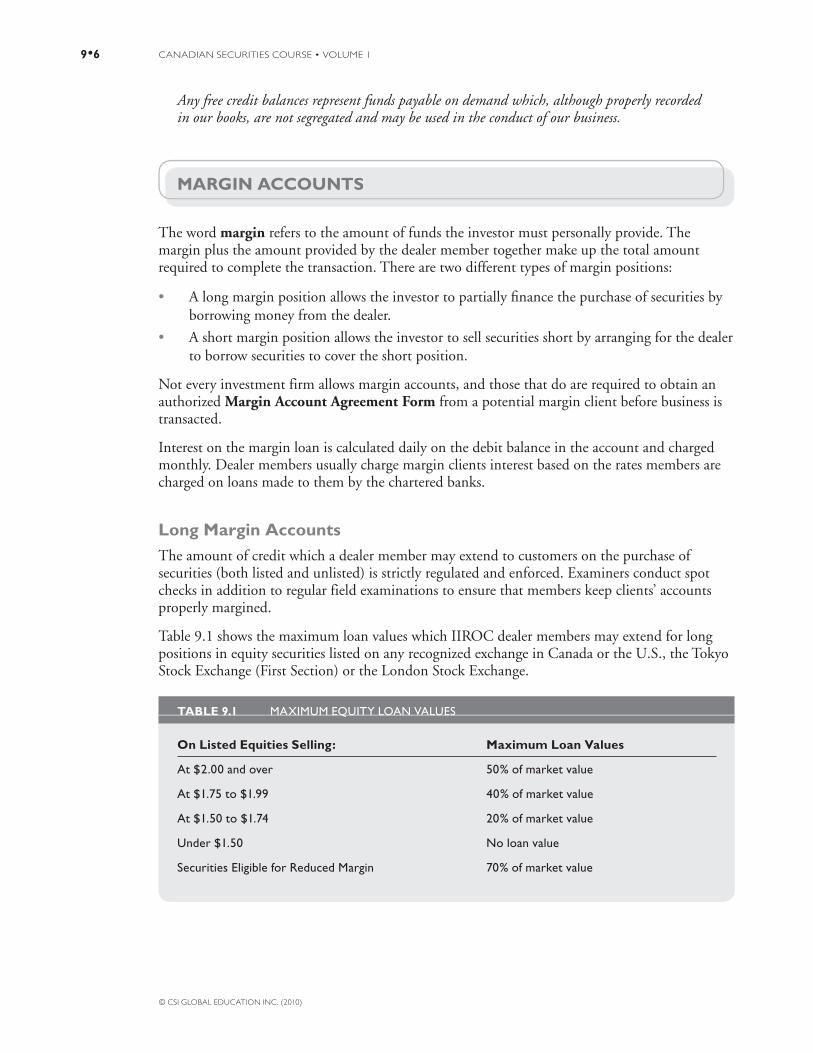
CANADIAN SECURITIES COURSE • VOLUME 19•6
© CSI GLOBAL EDUCATION INC. (2010)
Any free credit balances represent funds payable on demand which, although properly recorded in our books, are not segregated and may be used in the conduct of our business.
MARGIN ACCOUNTS
The word margin refers to the amount of funds the investor must personally provide. The margin plus the amount provided by the dealer member together make up the total amount required to complete the transaction. There are two different types of margin positions:
• A long margin position allows the investor to partially fi nance the purchase of securities by borrowing money from the dealer.
• A short margin position allows the investor to sell securities short by arranging for the dealer to borrow securities to cover the short position.
Not every investment firm allows margin accounts, and those that do are required to obtain an authorized Margin Account Agreement Form from a potential margin client before business is transacted.
Interest on the margin loan is calculated daily on the debit balance in the account and charged monthly. Dealer members usually charge margin clients interest based on the rates members are charged on loans made to them by the chartered banks.
Long Margin AccountsThe amount of credit which a dealer member may extend to customers on the purchase of securities (both listed and unlisted) is strictly regulated and enforced. Examiners conduct spot checks in addition to regular field examinations to ensure that members keep clients’ accounts properly margined.
Table 9.1 shows the maximum loan values which IIROC dealer members may extend for long positions in equity securities listed on any recognized exchange in Canada or the U.S., the Tokyo Stock Exchange (First Section) or the London Stock Exchange.
TABLE 9.1 MAXIMUM EQUITY LOAN VALUES
On Listed Equities Selling: Maximum Loan Values
At $2.00 and over 50% of market value
At $1.75 to $1.99 40% of market value
At $1.50 to $1.74 20% of market value
Under $1.50 No loan value
Securities Eligible for Reduced Margin 70% of market value
MARGIN ACCOUNTS
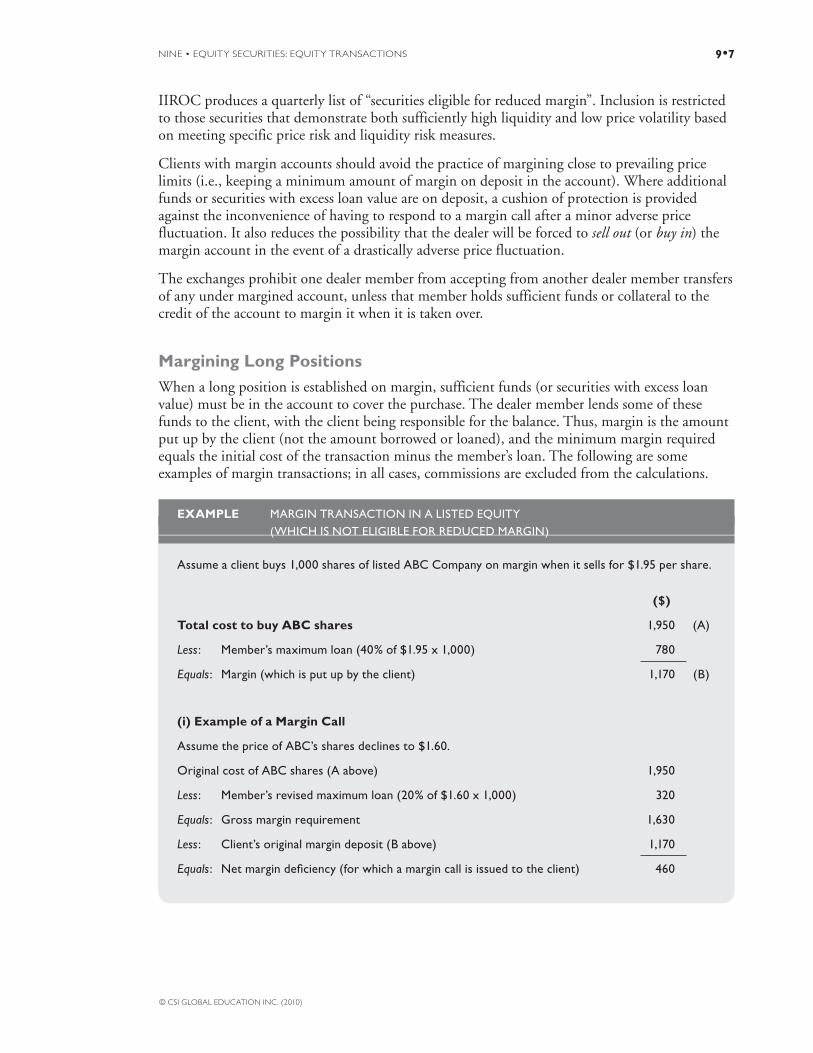
NINE • EQUITY SECURITIES: EQUITY TRANSACTIONS 9•7
© CSI GLOBAL EDUCATION INC. (2010)
IIROC produces a quarterly list of “securities eligible for reduced margin”. Inclusion is restricted to those securities that demonstrate both sufficiently high liquidity and low price volatility based on meeting specific price risk and liquidity risk measures.
Clients with margin accounts should avoid the practice of margining close to prevailing price limits (i.e., keeping a minimum amount of margin on deposit in the account). Where additional funds or securities with excess loan value are on deposit, a cushion of protection is provided against the inconvenience of having to respond to a margin call after a minor adverse price fluctuation. It also reduces the possibility that the dealer will be forced to sell out (or buy in) the margin account in the event of a drastically adverse price fluctuation.
The exchanges prohibit one dealer member from accepting from another dealer member transfers of any under margined account, unless that member holds sufficient funds or collateral to the credit of the account to margin it when it is taken over.
Margining Long PositionsWhen a long position is established on margin, sufficient funds (or securities with excess loan value) must be in the account to cover the purchase. The dealer member lends some of these funds to the client, with the client being responsible for the balance. Thus, margin is the amount put up by the client (not the amount borrowed or loaned), and the minimum margin required equals the initial cost of the transaction minus the member’s loan. The following are some examples of margin transactions; in all cases, commissions are excluded from the calculations.
EXAMPLE MARGIN TRANSACTION IN A LISTED EQUITY (WHICH IS NOT ELIGIBLE FOR REDUCED MARGIN)
Assume a client buys 1,000 shares of listed ABC Company on margin when it sells for $1.95 per share.
($)
Total cost to buy ABC shares 1,950 (A)
Less: Member’s maximum loan (40% of $1.95 x 1,000) 780
Equals: Margin (which is put up by the client) 1,170 (B)
(i) Example of a Margin Call
Assume the price of ABC’s shares declines to $1.60.
Original cost of ABC shares (A above) 1,950
Less: Member’s revised maximum loan (20% of $1.60 x 1,000) 320
Equals: Gross margin requirement 1,630
Less: Client’s original margin deposit (B above) 1,170
Equals: Net margin defi ciency (for which a margin call is issued to the client) 460

CANADIAN SECURITIES COURSE • VOLUME 19•8
© CSI GLOBAL EDUCATION INC. (2010)
EXAMPLE MARGIN TRANSACTION IN A LISTED EQUITY (WHICH IS NOT ELIGIBLE FOR REDUCED MARGIN) – Cont’d
(ii) Example of Excess Margin in Account
Assume this time the price of ABC’s shares – instead of declining
from $1.95 to $1.60 – had increased from $1.95 to $2.25.
Original cost of ABC shares (A above) 1,950
Less: Member’s revised maximum loan (50% of $2.25 x 1,000) 1,125
Equals: Gross margin requirement 825
Less: Client’s original margin deposit (B above) 1,170
Equals: Excess margin in account 345
The $345 can be used as margin toward the purchase of another security, or withdrawn from the account. It is not, however, an idle amount of cash that can be removed without consequence. The client is still borrowing money from the dealer member, on which interest will be charged. If the excess margin is left in the account, the amount borrowed would still be the $780 (1,950 – $1,170) lent initially by the dealer. What has changed is the amount of money the dealer is willing to lend: because the collateral value of the shares has increased, the member will now lend $1,125 instead of $780. By withdrawing the $345 margin surplus, the client will be borrowing (and paying interest on) this larger amount.
MARGIN RISKS
It is important to recognize that borrowing funds to invest involves more risk than simply buying and paying for a security in full from a cash account. Here are some of the risks associated with using a margin account:
• Margin increases market risk: borrowing to buy securities magnifi es the outcome, either in a positive or negative way.
• Loan and interest must be repaid: the client must pay interest during the period the security is margined and must repay the loan at the end, regardless of the value of the security.
• Margin calls must be paid without delay.
• The dealer can sell securities from the account to secure its loan without the client’s consent: if the security has fallen in price and the client fails to meet the margin call, the dealer can sell the security without notice and the client will suffer a loss.
NINE • EQUITY SECURITIES: EQUITY TRANSACTIONS 9•9
© CSI GLOBAL EDUCATION INC. (2010)
SHORT SELLING
Short selling is defined as the sale of securities that the seller does not own. Profits are made whenever the initial sale price exceeds the subsequent purchase cost. With long positions, an investor purchases a security and then holds it in the hope of selling it later at a higher price. With short selling, the order of the transactions is reversed. The investor sells the security first, and then waits in the hope of buying it back later at a lower price. Since the seller does not own the securities sold, the seller in effect creates a “deficit” or short position where he or she owes securities, and the subsequent purchase covers or “repays” this deficit.
Short selling is generally carried out in the belief that the price of a stock is going to fall. The short seller feels bearish towards a particular security and sells it short, hoping to buy it back later at a lower price. If the sale is made at a higher price than the subsequent purchase, the investor has made a profit.
How Short Selling is DoneA client wishing to short a security would first contact his or her IA and declare the intention to sell short. The IA’s firm would then lend the securities to be shorted to the client, and the client would sell them into the market in the same manner as a long position would be sold. The proceeds of the short sale are then deposited in the client’s account, and the client is required to deposit enough margin into the account, in addition to the sale proceeds, to bring the account balance up to the required minimum.
As an example, if an investor sells a stock short at $10.00 per share, the investor would have to put up margin of $5.00 per share. Since the investor is borrowing stock and putting up less money than the minimum required balance, the element of leverage exists for short sales. In fact, short selling has unlimited risk in that the security sold short could rise, at least theoretically, to infinity. Therefore, short selling is considered riskier than purchasing an outright long position, and such basic precautions as stop buy orders should be considered.
After the short position is established, the investor then waits for an opportune moment to cover the sale with a purchase at a lower price. Of course, since the price could also rise and lead to losses, regular monitoring of the position is advisable. A client may decide to enter a stop buy order to reduce the risk of loss.
When the short seller finally purchases the stock originally sold short, the stock is returned to the lender. Alternatively, the ultimate lender of the shorted security may ask that the security be returned. If no other lender can be found, the seller will be forced to buy back the security at whatever the current price is, regardless of whether the investor will suffer a loss from having to cover at unfavourable prices.
MARGINING SHORT POSITIONS
In contrast to a long position, margin is always required for a short position due to the risk factors involved in short selling. In fact, no loan is made to the client in a short sale. Instead, the client must put up more than the value of the short sale – essentially, the client is lending money to the firm to cover potential losses from a short sale. Table 9.2 shows the minimum margin requirements for short sales.
SHORT SELLING
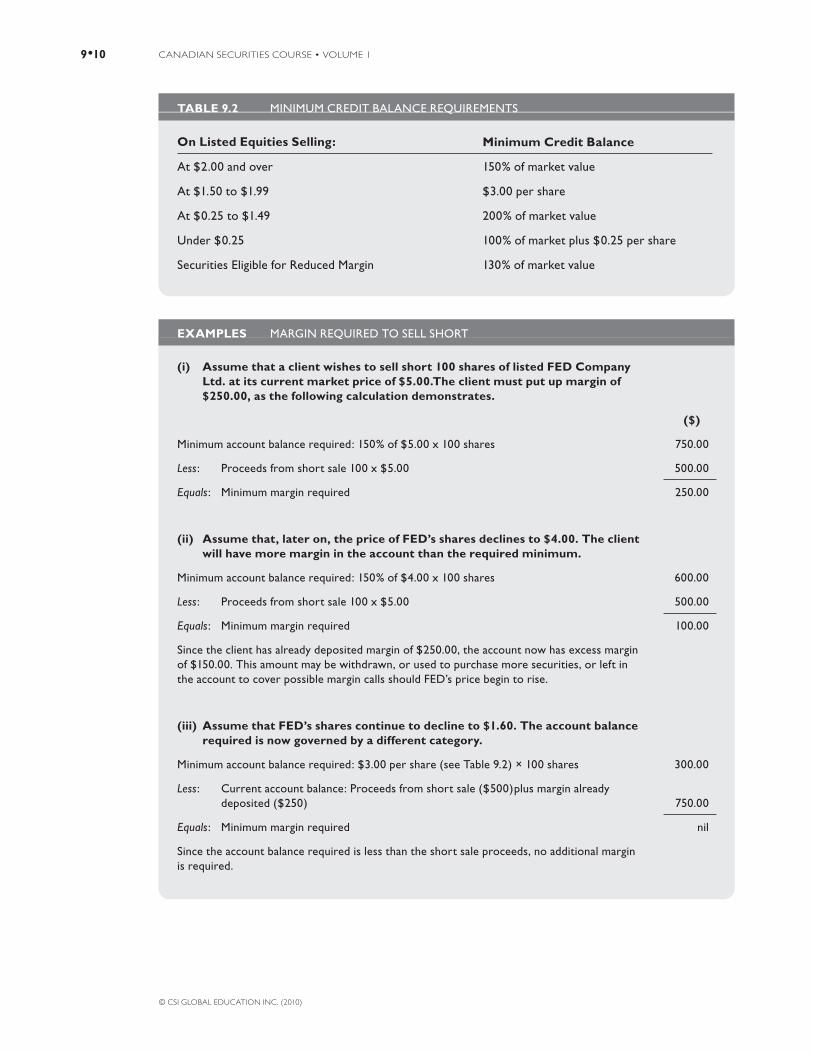
CANADIAN SECURITIES COURSE • VOLUME 19•10
© CSI GLOBAL EDUCATION INC. (2010)
TABLE 9.2 MINIMUM CREDIT BALANCE REQUIREMENTS
On Listed Equities Selling: Minimum Credit Balance
At $2.00 and over 150% of market value
At $1.50 to $1.99 $3.00 per share
At $0.25 to $1.49 200% of market value
Under $0.25 100% of market plus $0.25 per share
Securities Eligible for Reduced Margin 130% of market value
EXAMPLES MARGIN REQUIRED TO SELL SHORT
(i) Assume that a client wishes to sell short 100 shares of listed FED Company Ltd. at its current market price of $5.00.The client must put up margin of $250.00, as the following calculation demonstrates.
($)
Minimum account balance required: 150% of $5.00 x 100 shares 750.00
Less: Proceeds from short sale 100 x $5.00 500.00
Equals: Minimum margin required 250.00
(ii) Assume that, later on, the price of FED’s shares declines to $4.00. The client will have more margin in the account than the required minimum.
Minimum account balance required: 150% of $4.00 x 100 shares 600.00
Less: Proceeds from short sale 100 x $5.00 500.00
Equals: Minimum margin required 100.00
Since the client has already deposited margin of $250.00, the account now has excess margin of $150.00. This amount may be withdrawn, or used to purchase more securities, or left in the account to cover possible margin calls should FED’s price begin to rise.
(iii) Assume that FED’s shares continue to decline to $1.60. The account balance required is now governed by a different category.
Minimum account balance required: $3.00 per share (see Table 9.2) × 100 shares 300.00
Less: Current account balance: Proceeds from short sale ($500)plus margin already deposited ($250) 750.00
Equals: Minimum margin required nil
Since the account balance required is less than the short sale proceeds, no additional margin is required.

NINE • EQUITY SECURITIES: EQUITY TRANSACTIONS 9•11
© CSI GLOBAL EDUCATION INC. (2010)
(iv) If the price of FED’s shares advanced to $6.00 instead of declining, the client would receive a margin call as follows.
Minimum account balance required (based on current price of shorted security): 150% of $6.00 × 100 shares 900.00
Less: Proceeds from short sale (excluding commission) (based on original price of shorted security) 100 × $5.00 500.00
Equals: Minimum margin required 400.00
Less: Amount already deposited 250.00
Equals: Margin defi ciency (for which a margin call is issued to the client) 150.00
PROFIT OR LOSS ON SHORT SALES
The profit or loss on a short sale transaction is calculated in the same way as on a long transaction. It is simply the difference between the purchase and sale prices, or between the sale proceeds and the purchase cost. For example:
PROFIT OR LOSS ON SHORT SALES
(i) Assume a client sells short 100 shares of FED Company Ltd. at its current market price of $5.00. Later on, the price of FED’s shares declines to $1.60, and the client wishes to calculate the paper profi t.
Proceeds of the short sale 500.00
Less: Cost of buying 100 FED in the market at $1.60 per share should the client decide to cover the short sale 160.00
Equals: The client’s pre-tax profi t on the short sale 340.00
Since the price has dropped and the client is able to purchase the shares at a lower price than they were previously sold at, there is a paper profi t.
(ii) Assume instead that the price of FED’s shares rises to $6.00, and the client wishes to calculate the paper profi t or loss.
Proceeds of the short sale 500.00
Less: Cost of buying 100 FED in the market at $6.00 per share should the client decide to cover the short sale 600.00 600.00
Equals: The client’s loss on the short sale 100.00
Since the price has risen, there is paper loss rather than a profi t. The price of the purchase would be higher than the price of the sale if the position were covered at current prices.
EXAMPLES MARGIN REQUIRED TO SELL SHORT – Cont’d

CANADIAN SECURITIES COURSE • VOLUME 19•12
© CSI GLOBAL EDUCATION INC. (2010)
TIME LIMIT ON SHORT SALES
There is no time limit on how long a short sale position may be maintained, provided that the stock does not become de-listed or worthless. As well, the position remains open as long as equivalent amounts of the shorted security can be borrowed by the short seller’s dealer and adequate margin is maintained in the short account. For short sales of listed securities, borrowing can be arranged between dealers to facilitate the delivery required by the short sale.
Why do other dealers loan securities to the clients of firms who are selling short? The answer is that as security for the loan of securities, the loaning dealer receives the use of the money put up by the short seller. Such funds can be employed free of interest in the firm’s business or can be used to earn interest.
COVERING A SHORT POSITION
If the short seller’s dealer finds at some point that there is no replacement stock it can borrow to maintain or carry a client’s short position, then the client must buy the necessary shares and cover the short sale. This has to be done whether the short seller wants to buy back the shorted security or not, and regardless of the prevailing market price of the shorted security.
The danger of loss from short selling shares with thin marketability is particularly acute because it can be more difficult for the short seller’s dealer to borrow sufficient stock to maintain a short position for a prolonged period of time. Because of this potential problem, experienced traders normally confine short sales to shares of companies having a large number of shares outstanding that are widely held by many shareholders.
DECLARING A SHORT SALE
All of the exchanges require their members, when accepting an order for the sale of a security, to ascertain whether the sale is a short or a long sale.
IAs entering an order for a short sale of a security for anyone must clearly mark the sell-order ticket Short or S, so that the trading department may process the order properly.
The TSX Venture Exchange and the TSX compile and publicly report total short positions in applicable securities twice a month.
Dangers of Short SellingAmongst the difficulties and hazards of short selling are the following:
• There can be diffi culties in borrowing a suffi cient quantity of the security sold short to cover the short sale.
• The short seller is responsible for maintaining adequate margin in the short account as the price of the shorted security fl uctuates.
• The short seller is liable for any dividends or other benefi ts paid during the period the account is short.
• Buy-in requirements become effective if adequate margin cannot be maintained by the client and/or if the originally borrowed stock is called by its owner and no other stock can be borrowed to replace it.

NINE • EQUITY SECURITIES: EQUITY TRANSACTIONS 9•13
© CSI GLOBAL EDUCATION INC. (2010)
• It is diffi cult to obtain up-to-date information on total short sales on a security. (The exchanges do not report short positions on a daily basis and no data is available on unlisted short sales.)
• Price action in a shorted security may become volatile should a buying rush materialize when a number of short sellers try to cover their short sales at the same time.
• There is the theoretical possibility of unlimited loss if a shorted stock starts a dramatic rise in price. After all, the most that a purchaser of a security can lose is the entire purchase price. There is no maximum loss that a short seller can incur because there is no limit to how high the price of a stock can advance.
TRADING AND SETTLEMENT PROCEDURES
As explained in Chapter 2, stock exchange trades may involve the investment dealer acting as agent or as principal. Our description of roles which investment dealers may play begins with a traditional trade which involves two customers and two investment dealers acting as agents. Following this, we will describe some of the many other ways in which transactions are now commonly structured.
Trading ProceduresReferring to Chart 9.1, assume that XYZ’s common shares are listed for trading on a stock exchange. No matter which exchange the trade takes place on, the major steps are the same.
All trades involve both a buyer and a seller (positions 1 and 2 in our chart) who may live next door to, or across the country from, each other. Perhaps after consultation with investment advisors at their respective securities firms (3 and 4), the buyer has decided to acquire 100 XYZ shares and the seller wishes to sell 100 XYZ shares he owns. Both phone their IAs for a current price quotation. Their IAs learn, through communication links with the exchange, that XYZ common is currently $10.50 bid and $10.75 asked, and both IAs report this quotation to their clients.
The prospective buyer thus knows the lowest price at which anyone is currently willing to sell one standard trading unit (100 shares) of XYZ stock is $10.75 a share. The seller knows the highest per share price anyone presently is willing to pay for a standard trading unit is $10.50. A sale is possible if the buyer is willing to pay the seller’s price or if the seller is willing to accept the buyer’s price.
Assume the two clients then instruct their IAs to get the best possible current price for XYZ (a market order). The orders are relayed to the stock trading departments at each firm (5 and 6). Small orders (usually under 2,000 shares) are entered and executed electronically without any manual processing. Larger orders, while still executed electronically, will be handled personally by a trader.
The exchange’s data transmission system reports the trade over the exchange’s ticker and provides the buying and selling firms with specific details of the trade (e.g., time of trade and identity of the other member). Details are relayed to the IAs who originated the transactions and the IAs phone their clients to confirm the transaction. Each firm mails a written confirmation to its client that day or the next business day at the latest.
TRADING AND SETTLEMENT PROCEDURES
Complete the on-line activity associated with
this section.

CANADIAN SECURITIES COURSE • VOLUME 19•14
© CSI GLOBAL EDUCATION INC. (2010)
Variations in the above procedures occur in principal trades involving most new share issues, shares not listed for trading on a stock exchange and almost all bonds. If the trade is in an unlisted stock or bond, it might again involve two securities firms, but the transaction would be made by traders for both firms communicating over the telephone or computer network (7, 8 and 12) rather than on the floor of a stock exchange.
CHART 9.1 SIMPLIFIED CONCEPTION OF A TRADITIONAL RETAIL SECURITIES TRANSACTION

NINE • EQUITY SECURITIES: EQUITY TRANSACTIONS 9•15
© CSI GLOBAL EDUCATION INC. (2010)
SETTLEMENT PROCEDURES
Once a transaction has occurred, the buyer and seller will each receive a confirmation and they must “settle” the transaction. The buyer’s confirmation shows details of the purchase and the amount payable including commission. If the buyer has sufficient funds on deposit with the firm (either for payment in full with a cash account or for initial margin requirements in a margin account), the amount will be withdrawn from the account. Otherwise, the buyer must provide sufficient funds by the settlement date (three business days after the trade date). The buyer’s broker then makes payment for the purchase to the seller’s broker.
The seller’s confirmation also shows details of the sale as well as the amount to be received by the seller after commission is deducted.
In Canada, stock and bond certificates are not in the form of paper but held electronically to a very large extent by a clearing corporation. At the end of each trading day, the clearing corporation settles all purchases and sales of stock and bonds among dealers. The entries are made in the firm’s book of record showing who owns the stocks and bonds, and who owes money to pay for them.
OTHER TRANSACTION MODELS
The preceding discussion described a trade using a traditional agency transaction model. This agency model is just one of the many ways in which a transaction may occur. Chart 9.2 shows simplified models of other common ways in which transactions are structured.
Transaction A is a summary of the agency transaction described in Chart 9.1. The two counterparties are customers of different investment dealers.
Transaction B shows a common agency transaction in which a single investment dealer matches a buy order and a sell order between two of its customers. In this situation, the transaction price is based on the market price as determined on the exchange, even though the trade occurs first and its occurrence is recorded on the exchange after it is done. Many trades between large institutional customers are conducted in this manner. This kind of trade is commonly known as a cross.
Transaction C illustrates a trade in which the client’s order is filled directly by the investment dealer from inventory. The price at which the trade occurs is based on the current market value as determined on the exchange. In this form of transaction, the investment dealer acts as principal rather than as agent. Because of the possibility of conflict of interest, there are detailed regulations which define the conduct of the firm’s traders and the prices at which the transactions should occur.

CANADIAN SECURITIES COURSE • VOLUME 19•16
© CSI GLOBAL EDUCATION INC. (2010)
CHART 9.2 OTHER TRANSACTION MODELS
BUYING AND SELLING SECURITIES
There are a number of types of buy and sell orders, common to both listed and unlisted trading, which investment advisors are called upon to execute for clients. These include market orders, limit orders, day orders, good till cancelled orders, all or none orders, any part orders, good through orders, stop loss and stop buy orders, and pro orders.
Market Order: An order to buy or sell a specified number of securities at the prevailing market price. All orders not bearing a specific price are considered market orders, which could mean paying the offer (when buying) or accepting the bid (when selling). In any case, the trader will try to obtain a lower offer or a higher bid than the prevailing level.
Example: “Buy me 1,000 shares of ABC at market.” This order will be fi lled at the current ask price. “Sell 1,000 shares of DEF at market.” This order will be fi lled at the current bid price.
BUYING AND SELLING SECURITIES

NINE • EQUITY SECURITIES: EQUITY TRANSACTIONS 9•17
© CSI GLOBAL EDUCATION INC. (2010)
Clients and IAs should realize that a large market order for a thinly traded security may appreciably affect the current market price.
Limit Order: An order to buy or sell securities at a specific price or better. The order will only be executed if the market reaches or betters that price.
Example: “Buy 1,000 ABC at $20 or less” would be fi lled if the order could be executed at $20 or less. The order would be cancelled at the end of the trading day (if no limit was specifi ed) if the stock remained above $20.
Day Order: An order to buy or sell that expires if it is not executed on the day it is entered. All orders are considered to be day orders unless otherwise specified.
Example: “Buy 1,000 shares of ABC for my account at $20 or less.” No time limit is specifi ed, therefore the order is valid until the close of business on that day, or until fi lled, whichever is sooner.
Good Till Cancelled (GTC) Order: An order to buy or sell that remains in effect until it is either executed or cancelled. Many firms will not allow GTC orders and will insist on an end date, after which the order may be renewed on the client’s instructions. This type of order is the same as an open order.
Example: “Sell 1,000 shares of ABC whenever the price reaches $20 or more.” The order stays open until the price of ABC reaches $20 or more, at which time it will be fi lled.
To avoid an unwieldy build-up of GTC (or open) orders on the firm’s trading books, many firms will limit a GTC order for a specified time (e.g., 30 days) and then ask if the client wishes to renew it.
All or None (AON) Order: An order whereby the entire amount of stock must be bought or sold or no part of the order will be executed. An order may be given under this heading that states the minimum number of shares (to be bought or sold) that is acceptable to the client.
Example: “Buy 2,500 shares of ABC at $20 on an all or none basis.” There may not be 2,500 shares of ABC selling at $20. Even if there are 2,000 shares selling for $20, the client will not accept only part of the total shares ordered. If 2,500 shares of ABC cannot be found at this price, no shares of ABC will be purchased for the client.
Any Part Order: The exact opposite of an AON order in which the client will accept all stock in odd lot or standard trading units up to the full amount of the order.
Example: “Buy 2,500 shares of ABC at $20 or less on an any part basis.” There may be 1,500 shares of ABC available at the time the order is placed, followed by 500 later in the trading day and then 500 shares on the following trading day. The order will be fi lled in these three stages.
Good Through Order: An order to buy or sell that is good for a specified number of days and then automatically cancelled if it has not been filled by the end of the trading session on the date specified in the order.
Example: “Sell 1,000 shares of ABC if the price reaches $20 or more on or before March 30.” The order is open until fi lled at $20 or more, or until the close of business on March 30, whichever is fi rst.
CANADIAN SECURITIES COURSE • VOLUME 19•18
© CSI GLOBAL EDUCATION INC. (2010)
Stop Loss Order: An order to sell a security when the price of one standard trading unit of the security declines to or falls below a certain amount, thus limiting the loss or protecting a paper profit. Stop loss orders become market orders when the stop price is reached.
Example: “Sell my ABC stock if the price drops to $24.50 or below.” Assume the ABC shares trade at $30 and client Bill Smith purchased the stock at this price. Smith decides that should ABC decline unexpectedly, it would be preferable to limit his loss to $5.50 per share (ignoring commission). He places a stop loss order on 100 shares of ABC at $24.50. If the price of ABC declines so that at least one standard trading unit traded at $24.50 or below, his 100 shares would automatically be sold as a market order. In placing his stop loss order, he would hope that should it be executed, he would be sold out at $24.50, but there is no assurance of this. Since the order becomes a market order, it would simply be fi lled at the best possible price available at the time.
If in the same example, Bill Smith had paid $20 per share for BEF (prior to the stock advancing to $30), he could have put in a stop loss order at $24.50. This would allow him to protect at least part of his paper profit should the stock decline unexpectedly before he could act.
Stop Buy Order: An order to buy a security only after it has reached a certain price. This type of order may be used to protect a short position or to ensure that a stock is purchased while its price is rising. It is the opposite of a stop loss order.
Example: ABC stock is currently trading at $30 per share and a client decides that he would like to buy it – but only if it moves up to $35. A limit buy order of $35 would immediately be fi lled because the trader is obliged to buy the stock at $35 “or better” and the prevailing market is $30. But by entering the order as a stop buy at $35, the stock will not be purchased until it trades at $35 or above.
Note: It is important to realize the inherent dangers of stop buy and stop loss orders. IAs should try to obtain defi nite upward and downward price limits from clients entering stop orders. Some dealer members will not accept a stop order without a price limit.
Professional (Pro) Order: A fundamental trading regulation to protect the public relates to the priority given to clients’ orders. Where the order of a client competes with a non-client order at the same price, the client’s order is given priority of execution over the non-client order. A non-client order is an order for an account in which a partner, director, officer, shareholder, IA or, in some cases, other employee of a member holds a direct or indirect interest or an arbitrage order. This rule is applied within dealer members in its dealings with clients so that client orders have priority over “pro orders.”
Pro orders are orders for the accounts of partners, directors, officers, shareholders, IAs and, in some cases, specified employees. Tickets for such orders must be clearly labelled Pro or N-C (non-client) or Emp (employee) orders. Under the preferential trading rule, this type of order is executed after a client’s order if both orders compete at the same price for the same security.
Example: An order is placed to sell 100 shares of ABC at $20. In this case, the account holder is an employee of the dealer member. Thus, the order must be marked PRO (or EMP/N-C). If any client orders to sell ABC at $20 are outstanding, these will be fi lled before the employee’s order.
Note: It is important to realize the inherent dangers of stop buy and stop loss orders. IAs should tryto obtain defi nite upward and downward price limits from clients entering stop orders. Some dealer members will not accept a stop order without a price limit.

NINE • EQUITY SECURITIES: EQUITY TRANSACTIONS 9•19
© CSI GLOBAL EDUCATION INC. (2010)
SUMMARY
After reading this chapter, you should be able to:
1. Distinguish between cash and margin accounts.
• Clients with regular cash accounts are expected to make full payment for purchases or full delivery for sales on or before the settlement date. Clients with cash accounts can hold only long positions.
• Clients with margin accounts can buy and/or sell securities on credit and initially pay only part of the full price of the transaction. In such cases, the dealer member lends the remainder of the transaction price to the client, charging interest on the loan.
2. Calculate margin requirements for long and short positions.
• A long margin position allows the investor to partially fi nance the purchase of securities by borrowing money from the dealer. An investor enters a long position with the expectation that the underlying stock price will rise.
• A short margin position allows the investor to sell securities he or she does not own by arranging with the dealer to borrow securities to cover the position.
• When a long position is established on margin, suffi cient funds (or securities with excess loan value) must be in the account to cover the purchase.
• Margin is the amount put up by the client (not the amount borrowed or loaned), and the minimum margin required equals the initial cost of the transaction minus the loan.
• The loan value of securities in an account is strictly regulated and depends on the loan value status of the individual securities.
• No loan is made to the client in a short sale. The client must maintain a margin amount that is more than the value of the short sale, although the proceeds of the short sale can be used as part of the margin amount if not withdrawn from the account.
3. Describe the process of short selling and discuss the risks associated with short selling.
• Short selling is the sale of securities that the seller does not own and is generally carried out in the belief that the price of a stock is going to fall.
• The short seller’s dealer lends the securities to be shorted to the client, and the client sells the securities in the market, declaring the trade to be a short sale.
• The proceeds of the short sale are deposited in the account, and the client is required to deposit suffi cient additional funds to bring the account balance to a required minimum level.
• Profi ts are made when the initial sale price exceeds the subsequent repurchase cost once the short position is closed out.
SUMMARY
CANADIAN SECURITIES COURSE • VOLUME 19•20
© CSI GLOBAL EDUCATION INC. (2010)
• There is no limit on how long a short sale position can be maintained, provided the stock does not become de-listed or worthless.
• The risks associated with short selling include:
– Diffi culties in borrowing or continuing to borrow the securities sold short
– Maintaining adequate margin if the price of the shorted security fl uctuates
– Liability for dividends or other benefi ts paid while the security is sold short
– Potential volatility in the price if a large number of short sellers cover their position
– The potential for unlimited loss if the price of the security rises rather than falls
4. Describe the trading and settlement procedures for equity transactions.
• Once a buy order and sell order are matched and a trade is completed on an exchange, the exchange’s data transmission system reports the trade over the ticker and provides the buying fi rm with trade details.
• A confi rmation with details about the settlement (i.e., date, amount, location) is sent to the buyer and seller once the transaction has occurred.
• Cross trades occur when a dealer matches buy and sell orders internally instead of on an exchange.
• Principal transactions (i.e., new issues or orders fi lled out of a dealer’s inventory) are done outside of an exchange.
• In all cases, the buyer provides payment and the seller delivers the security by the settlement date. The mechanism and time frame for settlement depend on the type of securities traded.
5. Distinguish among the types of buy and sell orders.
• A market order is an order to buy or sell a specifi ed number of securities at the prevailing market price.
• A limit order is an order to buy or sell securities at a specifi c price or better.
• A day order is an order to buy or sell that expires if it is not executed on the day it is entered.
• A good till cancelled (GTC) order is an order to buy or sell that remains in effect until it is either executed or cancelled.
• An all or none (AON) order must be fi lled for the entire number of shares specifi ed. No smaller amount will be accepted, nor will a succession of trades adding to the total amount specifi ed.
• An any part order can be fi lled by any combination of odd lot or standard trading units up to the full amount of the order (opposite of AON order).

NINE • EQUITY SECURITIES: EQUITY TRANSACTIONS 9•21
© CSI GLOBAL EDUCATION INC. (2010)
• A good through order is an order to buy or sell that is good for a specifi ed number of days and then automatically cancelled if it has not been fi lled by the end of the trading session on the date specifi ed.
• A stop loss order is an order to sell a security when the price of one standard trading unit of the security declines to or falls below a certain price (the stop price), and it becomes a market order when the stop price is reached.
• A stop buy order is an order to buy a security only after it has reached a certain price (the stop price), and it becomes a market order when the stop price is reached.
• Professional (pro) orders are orders for the accounts of partners, directors, offi cers, shareholders, investment advisors and, in some cases, specifi ed employees.
Now that you’ve completed this
chapter and the on-line activities,
complete this post-test.


© CSI GLOBAL EDUCATION INC. (2010) 10•1
Chapter 10
Derivatives

© CSI GLOBAL EDUCATION INC. (2010)10•2
10
Derivatives
CHAPTER OUTLINE
What is a Derivative?• Features Common to All Derivatives• Derivative Markets• Exchange-Traded versus OTC Derivatives
Types of Underlying Assets• Commodities• Financials
Why Investors Use Derivatives• Individual Investors• Institutional Investors• Corporations and Businesses• Derivative Dealers
Options• Option Exchanges• Option Strategies for Individual and Institutional Investors• Option Strategies for Corporations
Forwards and Futures• Key Terms and Defi nitions• Futures Exchanges• Futures Strategies for Investors
© CSI GLOBAL EDUCATION INC. (2010) 10•3
Rights and Warrants• Rights• Warrants
Summary
LEARNING OBJECTIVES
By the end of this chapter, you should be able to:
1. Describe what a derivative is and explain the differences between over-the-counter and exchange-traded derivatives.
2. Identify the types of underlying assets on which derivatives are based.
3. Describe the participants in and uses of derivative trading.
4. Describe what options are and how they are traded, and evaluate call and put option strategies for individual and in-stitutional investors and corporations.
5. Describe what forwards are, distinguish futures contracts from forward agreements, and evaluate futures strategies for investors and corporations.
6. Defi ne and describe rights and warrants, explain why they are issued, and calculate the value of rights and warrants.
THE ROLE OF DERIVATIVES
In the past two decades, there has been phenomenal growth in the creation and use of various derivative instruments. The source of this growth, to a large extent, has been the increase in the volatility of interest rates, exchange rates and commodity prices. Financial deregulation, advances in information technology and breakthroughs in fi nancial engineering have also contributed to the growth. Depending on the position taken, derivatives make it possible to enhance overall portfolio returns and to hedge or reduce exposure to different sources of risk.
For many investors, particularly smaller retail investors, derivatives are considered risky, complex investments. This viewpoint can be attributed to what derivatives are: specialized fi nancial instruments created by market participants. They are not assets like stocks and bonds because their value is derived from an underlying asset, such as a fi nancial security or a commodity. Institutional investors and portfolio managers rely on derivatives and consider them quite sensible investments to enhance returns and protect against the inherent risk in the market.
Certainly, the frenzied trading that the fi nancial press often reports about oil and gas futures, foreign currencies, pork bellies and gold does sound exciting. We have all heard stories about a commodity trader somewhere in the world betting the right way on a position in natural gas, for example, and making a fortune.
In the on-line Learning Guide for this module,
complete the Getting Started
activity.

© CSI GLOBAL EDUCATION INC. (2010)10•4
Clearly, derivatives can be viewed in a variety of ways. They can be used as wildly speculative or rigorously conservative investment vehicles, as well as in strategies that fall between these two extremes.
This chapter focuses on the building blocks of derivatives. The key to understanding these products is becoming comfortable with the terminology, the contractual obligations being assumed and the type of strategy being pursued.
KEY TERMS
American-style option Hedging
Assigned In-the-money
At-the-money Long-Term Equity AnticiPation Securities (LEAPS)
Call option Marking-to-market
Canadian Derivatives Clearing Corporation (CDCC) Naked call
Cash-secured put write Offering price
Commodity futures Offsetting transaction
Covered call Open interest
Cum rights Opening transaction
Default risk Option premium
Derivative Out-of-the-money
European-style option Performance bond
Exchange-traded funds (ETFs) Put option
Exercise Record date
Exercise price Right
Expiration date Strike price
Ex-rights Subscription price
Financial futures Sweetener
Forward Time value
Forward agreement Trading unit
Futures contract Underlying asset
Good-faith deposit Warrant

TEN • DERIVATIVES 10•5
© CSI GLOBAL EDUCATION INC. (2010)
WHAT IS A DERIVATIVE?
A derivative is a financial contract between two parties whose value is derived from, or dependent upon, the value of some other asset. The other asset, known as the derivative’s underlying asset or underlying interest or security, can be a financial asset, such as a stock or bond, a currency, or even an interest rate, a futures contract or an equity index. It can also be a real asset or commodity, such as crude oil, gold or wheat. Because of the link between the value of a derivative and its underlying asset, derivatives can act as a substitute for, or as an offset to, a position in the underlying asset. As such, derivatives are often used to manage the risk of an existing or anticipated position in the underlying asset, as well as to speculate on the value of the underlying asset. While some derivatives have complex structures, they all fall into one of two basic types: options or forwards.
• Options are contracts between two parties: a buyer and a seller. The buyer of an option has the right, but not the obligation, to buy or sell a specifi ed quantity of the underlying asset in the future at a price agreed upon today. The seller of the option is obligated to complete the transaction if called upon to do so. An option that gives its owner the right to buy the underlying asset is known as a call option; the right to sell the underlying asset is known as a put option.
• Forwards are also contracts between a buyer and a seller. With forwards, however, both parties obligate themselves to trade the underlying asset in the future at a price agreed upon today. Neither party has given the other any right; they are both obligated to participate in the future trade.
Despite this fundamental difference between options and forwards, all derivatives share some features.
Features Common to All DerivativesAll derivatives are contractual agreements between two parties, often known as counterparties. One counterparty is the buyer, and the other is the seller. The agreements spell out the rights and/or obligations of each party. Derivatives have a price. Buyers try to buy derivatives as cheaply as possible while sellers try to sell them for as much as possible.
All derivatives have an expiration date. Both parties must fulfill their obligations or exercise their rights under the contract on or before the expiration date. After that date, the contract is automatically terminated.
When a derivative contract is drawn up, it includes a price or formula for determining the price of an asset to be bought and sold in the future, either on or before the expiration date.
• With forwards, no up-front payment is required. Sometimes one or both parties make a performance bond or good-faith deposit, which gives the party on the other side of the transaction a higher level of assurance that the terms of the forward will be honoured.
• With options, the buyer makes a payment to the seller when the contract is drawn up. This payment, known as a premium, gives the buyer the right to buy or sell the underlying asset at a preset price on or before the expiration date.
WHAT IS A DERIVATIVE?

CANADIAN SECURITIES COURSE • VOLUME 110•6
© CSI GLOBAL EDUCATION INC. (2010)
Another feature of derivatives is that, unlike financial assets such as stocks and bonds, derivatives can be considered a zero-sum game. In other words, aside from commission fees and other transaction costs, the gain from an option or forward contract by one counterparty is exactly offset by the loss to the other counterparty: every dollar gained by one party represented a dollar lost by the counterparty on the other side of the contract.
Derivative MarketsIn Chapter 6, you learned that most bonds trade in the over-the-counter (OTC) market and a small number trade on organized exchanges. In Chapter 1, you learned that stocks and derivatives trade on exchanges and OTC markets as well. Whereas the primary difference between exchange-traded and OTC stocks and bonds is trading mechanics, the difference between exchange-traded and OTC derivatives is much more pronounced.
OVER-THE-COUNTER DERIVATIVES
The OTC derivatives market is an active and vibrant market that consists of a loosely connected and lightly regulated network of brokers and dealers who negotiate transactions directly with one another primarily over the telephone and/or computer terminals. As explained in Chapter 1, the OTC market is dominated by financial institutions, such as banks and brokerage houses, that trade with their large corporate clients and other financial institutions. This market has no trading floor and no regular trading hours. At nights and during weekends and holidays, some traders and support staff are still working at their trading desks.
One of the attractive features of OTC derivatives to the corporations and institutional investors that use them is that contracts can be custom designed to meet specific needs. As a result, OTC derivatives tend to be somewhat more complex than exchange-traded derivatives, as special features can be added to the basic properties of options and forwards.
EXCHANGE-TRADED DERIVATIVES
A derivative exchange is a legal corporate entity organized for the trading of derivative contracts. The exchange provides the facilities for trading, either a trading floor or an electronic trading system or, in some cases, both. The exchange also stipulates the rules and regulations governing trading in order to maintain fairness, order and transparency in the marketplace. Derivative exchanges evolved in response to the OTC issues of standardization, liquidity and credit risk.
There are two derivative exchanges in Canada: the Montréal Exchange (the Bourse de Montréal) and ICE Futures Canada. The Montréal Exchange lists options on stocks, bonds and indexes, and futures (forwards that are exchange-traded) on bonds and indexes. ICE Futures Canada lists futures and future options on agricultural goods such as canola and western barley.
Exchange-Traded versus OTC DerivativesReaders may ask how organized exchanges and OTC markets successfully co-exist when the interests that underlie derivative instruments in both markets are basically the same. One would think that over time, one of the two markets would prevail.
The co-existence has proven successful and long-lasting because the two markets differ in significant ways, each market offering advantages to users depending on their particular needs.

TEN • DERIVATIVES 10•7
© CSI GLOBAL EDUCATION INC. (2010)
STANDARDIZATION AND FLEXIBILITY
One of the most important differences between exchange-traded and OTC derivatives is flexibility. In the OTC market, the terms and conditions of a contract can be tailored to the specific needs of their users. The users may choose the most appropriate terms to meet their particular needs. In contrast, for exchange-traded derivatives, the exchange specifies the contracts that are available to be traded on the exchange; each contract has standardized terms and other specifications, which may or may not meet the needs of certain derivative users.
PRIVACY
Another important difference is the private nature of OTC derivatives. In an OTC derivative transaction, neither the general public nor others (including competitors) know about the transaction. On exchanges, all transactions are recorded and known to the general public, although the exchanges do not announce, nor do they necessarily know, the identities of the ultimate counterparties to every transaction.
LIQUIDITY AND OFFSETTING
Because they are private and custom designed, OTC derivatives cannot be easily terminated or transferred to other parties in a secondary market. In many cases, these contracts can only be terminated through negotiations between the two parties.
By contrast, the standardized and public nature of exchange-traded derivatives means that they can be terminated easily by taking an offsetting position in the contract. As a user’s needs may change in line with changing economic, market and business conditions, it is sometimes advantageous to be able to terminate a derivative before it expires. (The concept of expiration as it applies to derivatives is explained later in the chapter in the sections on options and forwards.)
DEFAULT RISK
Another downside to the private nature of OTC derivatives is that default or credit risk is a major concern. Default risk is the risk that one of the parties to a derivative contract cannot meet its obligations to the other party. Given this risk, many derivative dealers in the OTC market do not deal with customers that are unable to establish certain levels of creditworthiness. In addition, the size of most contracts in the OTC market may be greater than most investors can manage. For this reason, the OTC market is restricted to large institutional and corporate customers. Individual investors are generally limited to dealing in exchange-traded derivatives.
Default risk is not a significant concern with exchange-traded derivatives. Clearinghouses, which are set up by exchanges to ensure that markets operate efficiently, guarantee the financial obligations of every party and contract. The existence of clearinghouses means that market participants need not be concerned with the honesty or reliability of other trading parties. The integrity of the clearinghouse is the only concern. In the history of U.S. and Canadian derivative exchanges, a clearinghouse has never failed to meet its obligations, so this concern is minimal.
The clearing corporation becomes, in effect, the buyer for every seller and the seller for every buyer. By being on the opposite side of all trades, the clearing corporation minimizes the risk of default. Although individual trades are negotiated between the two parties through the exchange, once the contract has been made, the clearing corporation is the counterparty. The Canadian Derivatives Clearing Corporation (CDCC) is responsible for clearing Montréal Exchange futures and option trades and ICE Clear Canada has sole responsibility for clearing ICE Futures Canada trades.

CANADIAN SECURITIES COURSE • VOLUME 110•8
© CSI GLOBAL EDUCATION INC. (2010)
REGULATION
A final difference between OTC and exchange-traded derivatives arises out of the fact that OTC contracts are private and exchange-traded contracts are public. While derivative transactions on exchanges are extensively regulated by the exchanges themselves and government agencies, OTC derivative transactions are generally unregulated. On the one hand, the largely unregulated environment in the OTC markets permits unrestricted and explosive growth in financial innovation and engineering. Generally, no government approval is needed to offer new types of derivatives. The innovative contracts are simply created by parties that see mutual gain in doing business with each other. There are no costly constraints or bureaucratic red tape. On the other hand, the regulated environment of exchange-traded derivatives brings about fairness, transparency and an efficient secondary market.
Table 10.1 summarizes these and other differences between exchange-traded and OTC derivatives.
TABLE 10.1 DIFFERENCES BETWEEN EXCHANGE-TRADED AND OVER-THE-COUNTER DERIVATIVES
• Exchange-Traded
• Traded on an exchange
• Standardized contract
• Transparent (public)
• Easy termination prior to contract expiry
• Clearinghouse acts as third-party guarantor ensuring contract’s performance to both trading partners
• Performance bond required, depending on the type of derivative
• Gains and losses accrue on a day-to-day
• Heavily regulated
• Delivery rarely takes place
• Commission visible
• Used by retail investors, corporations and institutional investors
• Over-the-Counter
• Traded largely through computer and/or phone lines
• Terms of the contract agreed to between buyer and seller
• Private
• Early termination more diffi cult
• No third-party guarantor
• Performance bond not required in most cases
• Contracts are generally not marked-to-market; basis (marking-to-market) gains and losses are generally settled at the end of the contract
• Much less regulated
• Delivery or fi nal cash settlement usually takes place
• Fee usually built into price
• Used by corporations and fi nancial institutions
Complete the on-line activity associated with
this section.

TEN • DERIVATIVES 10•9
© CSI GLOBAL EDUCATION INC. (2010)
TYPES OF UNDERLYING ASSETS
There are generally two major categories of underlying assets for derivative contracts – commodities and financial assets. A brief summary follows outlining the assets that underlie derivative contracts traded on organized exchanges in the U.S. and Canada. In the OTC markets, the choice of underlying assets is limited only by the imagination and needs of market participants.
CommoditiesCommodity futures and options are commonly used by producers, merchandisers and processors of commodities to protect themselves against fluctuating commodity prices. Most of these commodities, like soybeans, crude oil and copper, are used mainly for consumption purposes while others, like gold, are used primarily for investment purposes. Speculators also use commodities to profit from the fluctuating prices. Depending on the commodity, prices are affected by supply and demand, agricultural production, weather, government policies, international trade, demographic trends, and economic and political conditions. The following are the types of commodities that underlie derivative contracts:
• Grains and oilseeds such as wheat, corn, soybeans and canola
• Livestock and meat such as pork bellies, hogs, live cattle and feeder cattle
• Forest, fi bre and food such as lumber, cotton, orange juice, sugar, cocoa and coffee
• Precious and industrial metals such as gold, silver, platinum, copper and aluminum
• Energy products such as crude oil, heating oil, gasoline, natural gas and propane
Other than the energy category, most commodity derivatives are exchange-traded contracts.
FinancialsThe last two decades have witnessed an explosive growth in derivatives, especially in financial derivatives. This growth has been fuelled by:
• increasingly volatile interest rates, exchange rates and equity prices
• fi nancial deregulation and intensifi ed competition among fi nancial institutions
• globalization of trade and the tremendous advances in information technology
• extraordinary theoretical breakthroughs in fi nancial engineering
The most commonly used financial derivatives are summarized below.
EQUITY INDEXES
Equity is the underlying asset of a large category of financial derivatives. The predominant equity derivatives are equity options – options on individual stocks. These derivatives are traded mainly on organized exchanges such as the Bourse de Montréal in Canada, and the Chicago Board Options Exchange (CBOE), International Securities Exchange (ISE), Boston Options Exchange (BOX), and American Stock Exchange (AMEX) in the U.S. All other major trading nations have equity derivatives listed on one or more of their exchanges.
TYPES OF UNDERLYING ASSETS

CANADIAN SECURITIES COURSE • VOLUME 110•10
© CSI GLOBAL EDUCATION INC. (2010)
INTEREST RATES
Exchange-traded interest rate derivatives are generally based on interest rate-sensitive securities rather than on interest rates directly. In Canada, underlying assets include bankers’ acceptances and Government of Canada bonds. All interest rate futures trading in Canada takes place at the Bourse de Montréal. Futures options (i.e., options contracts with futures as the underlying asset) are available on three-month bankers’ acceptances futures.
In the U.S., underlying assets for exchange-traded interest rate derivatives include Eurodollars, which are traded at the CME (Chicago Mercantile Exchange), as well as U.S. Treasury notes and bonds, which are traded at the CBOT (Chicago Board of Trade). Futures options are available on these contracts.
In the OTC market, interest rate derivatives are generally based on well-defined floating interest rates, which are not easily manipulated by market participants. Examples of such underlying assets include LIBOR or the London Interbank Offer Rate (the interest earned on Eurodollar deposits in London) and the yields on Treasury bills and Treasury bonds. Because these OTC derivatives are based on an interest rate rather than an actual security, the contracts are settled in cash.
CURRENCIES
The most commonly used underlying assets in currency derivatives are the U.S. dollar, British pound, Japanese yen, Swiss franc and Euro. The types of contracts traded include currency futures and options on organized exchanges and currency forwards and currency swaps in the OTC market. There are no currency derivative contracts listed on any Canadian exchanges.
WHY INVESTORS USE DERIVATIVES
Derivative users can be divided into four groups: individual investors, institutional investors, businesses and corporations, and derivative dealers. The first three groups are the end users of derivatives. These parties use derivatives either to speculate on the price or value of an underlying asset, or to protect the value of an anticipated or existing position in the underlying asset. The latter application, a form of risk management, is known as hedging.
The last group, derivative dealers, are the intermediaries in the markets, buying and selling to meet the demands of the end users. Derivative dealers do not normally take large positions in derivative contracts. Rather, they try to balance their risks and earn profits from the volume of deals they do with their customers.
Individual InvestorsFor the most part, individual investors are able to trade exchange-traded derivatives only. They are active investors in exchange-traded options markets and, to a lesser extent, futures markets.
Individual investors should only use derivatives if they fully understand all of their potential risks and rewards. Furthermore, investors should consider speculative strategies only if they have a high degree of risk tolerance, because there is the potential to suffer large losses in derivative trading. Risk management strategies, on the other hand, can be beneficial to all investors, from the most conservative to the most aggressive.
WHY INVESTORS USE DERIVATIVES

TEN • DERIVATIVES 10•11
© CSI GLOBAL EDUCATION INC. (2010)
Individual investors in Canada can trade exchange-traded derivatives directly by opening a special type of account with a full-service or discount brokerage firm registered to offer such accounts. To deal with investors in exchange-traded derivatives, investment advisors at full-service firms and investment representatives at discount firms must be specially licensed. Licensing requires successful completion of CSI’s Derivatives Fundamentals Course (DFC) and either the Options Licensing Course (OLC) or Futures Licensing Course (FLC).
Institutional InvestorsInstitutional investors that use derivatives include mutual fund managers, hedge fund managers, pension fund managers, insurance companies and more. Like individual investors, institutional investors use derivatives for both speculation and risk management. Unlike individual investors, most institutional investors are able to trade OTC derivatives in addition to exchange-traded derivatives.
Many institutional investors use derivatives to quickly carry out changes to their portfolio’s asset allocation—the mix of stocks, bonds, and cash held in a portfolio. In today’s ever-changing financial environment, portfolio managers frequently need to shift funds from one market segment to another market segment, from one type of market to another type of market, and from one country to another country. For example, the manager of a global equity mutual fund may decide to sell all or a significant portion of the fund’s British stocks and use the proceeds to buy a basket of French and German stocks.
Quickly exiting and entering a market in the conventional way – buying and selling the actual stocks – can be inefficient and more costly than one might imagine. There are costs associated with trading, including commission fees, bid-ask spreads and other administrative fees. These transaction costs can be quite high in some cases, and may impact on the decision to enter or exit a market. In addition, buying or selling a large quantity of certain securities may produce adverse price pressures on the market. This represents a hidden cost to the transaction. A large sell order may push the price down so that less money will be received from selling the securities. Conversely, a large buy order may bid up the price so that it will cost more than the current available price to complete the transaction. These adverse price effects could be especially severe in thinly traded equity or bond markets.
If the switch is permanent or long-term in nature, it is usually accomplished by liquidating positions in one market and transferring the funds into the other market. Quite frequently, however, the switch from market to market is only temporary. For example, the manager of the global equity fund may want to switch out of British stocks and into French and German stocks for only a few months. When market conditions subsequently change, a reverse switch and other shifts of funds are quite possible. In these cases, it is usually more efficient and cost-effective to carry out the switch temporarily using derivatives rather than trading in the underlying assets directly.

CANADIAN SECURITIES COURSE • VOLUME 110•12
© CSI GLOBAL EDUCATION INC. (2010)
In Exhibit 10.1, the manager of the global equity fund effects the temporary portfolio switch using futures contracts rather than the underlying stocks. This strategy allows the manager to secure the desired asset allocation without incurring the costs associated with such a shift.
EXHIBIT 10.1 USING FUTURES CONTRACTS TO FACILITATE A TEMPORARY ASSET ALLOCATION SWITCH
The manager of the Razor Global Equity Fund has $100 million invested in European equities: 20% in British stocks, 25% in German stocks, 20% in French stocks, and 35% in a mixture of Italian, Spanish, Swedish and Finnish stocks. She believes that this is the right long-term allocation for the fund, but she also believes that over the next six months the German and French markets will signifi cantly outperform the British market. She fi gures that, over the next six months, a 0% allocation to British stocks, a 35% allocation to German stocks, a 30% allocation to French stocks, and a combined 35% allocation to Italian, Spanish, Swedish and Finnish stocks will give her portfolio above-average returns with an appropriate amount of risk.
Rather than disrupt the portfolio by buying and selling a very large amount of stock and incurring the transaction costs, and then reversing the whole process again in six months, the portfolio manager decides to use equity index futures to implement the switch. Specifi cally, she will use six-month futures on British, German and French equity indexes.
For simplicity, assume that the current value of the stocks represented by each of these equity index futures contracts is $100,000.To implement the switch, the portfolio manager would have to sell 200 British equity index futures contracts and buy 100 each of the German and French equity index futures contracts. The buying and selling of these contracts would entail much lower transaction costs than buying and selling a total of $40 million worth of British, German and French stocks.
In six months, when the portfolio manager offsets the futures positions, the overall return on the fund will be similar to that of the desired weighting of 0% British stocks, 35% German stocks, 30% French stocks and 35% of other European stocks. This is because any gain or loss on the British equity index futures will offset any loss or gain on the actual British stocks in the fund, while the gain or loss on the German and French equity index futures will amplify the gain or loss on the actual German and French stocks in the fund.
Corporations and BusinessesCorporations that use derivatives come in all shapes and sizes, but for the most part they tend to be larger companies that make use of borrowed money, have multinational operations that generate or require foreign currency, or produce or consume significant amounts of one or more commodities.
Corporations and businesses use derivatives primarily for hedging purposes. In particular, these users tend to focus on derivatives that help them hedge interest rate, currency and commodity price risk. Hedging is the attempt to eliminate or reduce the risk of either holding an asset for future sale or anticipating a future purchase of an asset. Hedging with derivatives involves taking a position in a derivative with a payoff that is opposite to that of the asset to be hedged. For example, if a hedger owns an asset, and is concerned that the price of the asset could fall in the future, a short position in a forward contract based on the asset would be appropriate. A decline in the price of the asset will result in a loss on the asset being held, but would be offset by a profit on the short forward contract. Another solution would be to buy a put option on the underlying asset.

TEN • DERIVATIVES 10•13
© CSI GLOBAL EDUCATION INC. (2010)
Corporations that hedge with derivatives do so because they would rather focus their efforts on running their primary business instead of trying to guess where interest rates, currencies or commodity prices are going.
On the other hand, if a hedger anticipates buying an asset in the future, and is concerned that the price could rise by the time the purchase is made, buying a forward contract or a call option would be appropriate. A price increase will result in a higher price being paid by the hedger, but this would be offset by a profit on the forward or call option.
A hedger starts with a pre-existing risk that is generated from a normal course of business. For example, a farmer growing wheat has a pre-existing risk that the price of wheat will decline by the time it is harvested and ready to be sold. In the same way, an oil refiner that holds storage tanks of crude oil waiting to be refined has a pre-existing risk that the price of the refined product may decline in the interim.
To reduce or eliminate these price risks, the farmer and the refiner could take derivative positions that will profit if the price of their assets declined. Any losses in the underlying assets would be offset by gains in the derivative instruments. That being said, any gains in these assets might be offset by derivative losses of roughly the same size, depending on the type of derivative chosen and the overall effectiveness of the hedge.
The decision to hedge increasingly is becoming a corporate-level decision. Where once the use of derivatives by a company was poorly understood and cause for concern, it is now expected that a company’s Board of Directors use derivatives in an appropriate fashion as a risk management tool. Exhibit 10.2 illustrates this shift in attitude. Although it often seems like a simple decision, the determination of whether or not to hedge and how to hedge can often be complex. Hedging does not always result in the complete elimination of all risks.
In reality, the proper use of derivatives involves first understanding the derivative contracts that can be used for a particular hedge and then deciding on an appropriate level of balance between risk and return that is consistent with the hedger’s overall strategy.
EXHIBIT 10.2 HEDGING OR NOT HEDGING: A LEGAL MATTER?
There can be many good reasons for hedging and sometimes good reasons for not hedging. To hedge or not to hedge? Corporate boardrooms are not the only place this intriguing question is debated and answered. This question is increasingly decided in courtrooms.
Take the case of Farmers Cooperative (FC), a grain elevator co-op in Indiana. It engaged in the business of buying, storing and selling grain. In the late 1970s, FC’s profi ts had declined steadily. Acting on the advice of its accountant, FC’s Board of Directors authorized FC’s manager to begin hedging using futures contracts. FC continued to experience substantial operating losses, as less than one per cent of grain sales were actually hedged. Shareholders fi gured that a proper hedge would have saved the company large amounts of money, so they sued the Board of Directors.
The plaintiffs argued that the Board breached its duty by using an inexperienced manager and by failing to supervise the manager. The plaintiffs also argued that the Board members failed to learn enough about hedging to protect the shareholders’ interests. The plaintiffs won the lawsuit and the directors were ordered to pay over $400,000 to the plaintiffs.
A lesson to be learned? Directors must be informed or must get informed about the advantages and disadvantages of hedging and how derivative markets work. They must also supervise management to ensure that a hedging program is executed properly. Ignorance cannot be used as a legal defence.

CANADIAN SECURITIES COURSE • VOLUME 110•14
© CSI GLOBAL EDUCATION INC. (2010)
Derivative DealersThe last group of users is the derivative dealers. Derivative dealers play a crucial role in the OTC markets by taking the other side of the positions entered into by end users. Dealers in the exchange traded market take the form of market makers that stand ready to buy or sell contracts at any time.
In Canada, the primary OTC derivative dealers are the “big six” banks and their investment dealer subsidiaries, as well as the Canadian subsidiaries of large foreign banks and investment dealers. Exchange-traded market makers include banks and investment dealers as well as professional individuals.
OPTIONS
An option is a contract between two parties, a buyer (also known as the long position or holder) and a seller (also known as the short position or the writer). This contract gives certain rights or obligations to buy or sell a specified amount of an underlying asset, at a specified price (known as the strike price or exercise price), within a specified period of time. The buyer has the right but is not obligated to exercise her contract, while the seller is obligated to fulfill his part of the contract if called upon to do so.
To obtain the right to buy or sell the underlying asset, option buyers must pay sellers a fee, known as the option price or option premium. Once the premium has been paid, the option buyer has no further obligation to the writer, unless the buyer decides to exercise the option. Therefore, the most that the buyer of an option can lose is the premium paid. On the other hand, writers of options must always stand ready to fulfill their obligation to buy or sell the
underlying asset. To provide evidence of their ability to fulfill their obligation at all times, writers of exchange-traded options are required to provide and maintain sufficient margin in their option accounts. Writers of OTC options typically do not have this requirement.
An option that gives its holder the right to buy and its writer the obligation to sell the underlying asset is known as a call option, while an option that gives its holder the right to sell and its writer the obligation to buy the underlying asset is referred to as a put option. Table 10.2 summarizes the rights and obligations associated with the four basic option positions, and Exhibit 10.3 explains how the terminology is used in the marketplace.
TABLE 10.2 RIGHTS AND OBLIGATIONS ASSOCIATED WITH OPTION POSITIONS
Buyer or Holder Writer or Seller
Call Pays premium to the writer for the right to BUY the underlying asset.
Receives premium from the buyer and has the obligation to SELL the underlying asset, if called upon to do so.
Put Pays premium to the writer for the right to SELL the underlying asset.
Receives premium from the buyer and has the obligation to BUY the underlying asset, if called upon to do so.
OPTIONS
TEN • DERIVATIVES 10•15
© CSI GLOBAL EDUCATION INC. (2010)
EXHIBIT 10.3 DESCRIBING AN OPTION
When traders and investors discuss options, they usually describe the specifi c option they are talking about by quickly summarizing the option’s most salient features into one phrase. The following syntax is typically used:
“{Underlying Asset} + {Expiration Month} + {Strike Price} + {Option Type}”
For example, if an investor wanted to buy 10 exchange-traded call options on XYZ stock with an expiration date in December and a strike price of $50, the investor would say that he wanted to “buy 10 XYZ December 50 calls.” Just as he would if he were buying a stock, the investor would also indicate the price at which he is willing to pay. He could buy them “at market,” in which case he agrees to accept the best price currently available, or he could enter a limit order by specifying the highest price at which he is willing to pay.
An option’s trading unit describes the size or amount of the underlying asset represented by one option contract. For example, all exchange-traded stock options in North America have a trading unit of 100 shares. Therefore, the holder of one call option has the right to buy 100 shares of the underlying stock, while the holder of one put option has the right to sell 100 shares. Options on other underlying assets have a variety of trading units.
The premium of an option is always quoted on a “per unit” basis, which means that the premium quote for a stock option is the premium for each share of the underlying stock. To calculate the total premium for a contract, multiply the premium quote by the option’s trading unit. For example, if a stock option is quoted with a premium of $1, it will cost the buyer $100 for each contract.
Options that can be exercised at any time up to and including the expiration date are referred to as American-style options. If the option can be exercised only on the expiration date, it is referred to as a European-style option. All exchange-traded stock options in North America are American-style options. Most index options are European-style options.
Traditionally, options have been listed with relatively short terms of nine months or less to expiration. They are useful for investors who want to profit or protect themselves from short-term market fluctuations. The exchanges have begun listing options with much longer expirations. These options are called Long-Term Equity AnticiPation Securities (LEAPS). LEAPS are simply long term option contracts and offer the same risks and rewards as regular options.
When an investor establishes a new position in an option contract, it is called an opening transaction. An opening buy transaction results in a long position in the option, while an opening sell transaction results in a short position in the option. On or before an option’s expiration date, one of three things will happen to all long and short option positions.
1. Positions may be liquidated prior to expiration by way of an offsetting transaction, which, in effect, cancels the position. Offsetting a long position involves selling the same type and number of contracts, while offsetting a short position involves buying the same type and number of contracts. Unless they are specifi cally designed to be transferable, OTC options can only be offset through negotiations between the long and short parties. Exchange-traded options, however, can be offset simply by an entering an offsetting order on the exchange on which the option trades.

CANADIAN SECURITIES COURSE • VOLUME 110•16
© CSI GLOBAL EDUCATION INC. (2010)
2. The party holding the long position can exercise the option. When this happens, the party holding the short position is said to be assigned on the option. For the owners of call options, the act of exercising involves buying the underlying asset from the assigned writer at a price equal to the strike price. For the owners of put options, exercising involves selling the underlying asset to the assigned put writer at a price equal to the strike price.
3. The party holding the long position can let the option expire. Buyers of options have rights, not obligations. If they do not want to exercise their options before they expire, they do not have to; it is totally up to them.
Owners of options will exercise only if it is in their best financial interest, which can only occur when an option is in-the-money.
• A call option is in-the-money when the price of the underlying asset is higher than the strike price. If this is the case, the call option holder can exercise the right to buy the underlying asset at the strike price and then turn around and sell it at the higher market price.
• A put option is in-the-money when the price of the underlying asset is lower than the strike price. If this is the case, the put option holder can exercise the right to sell the underlying asset at the higher strike price, which would create a short position, and then cover the short position at the lower market price.
The in-the-money portion of a call or put option is referred to as the option’s intrinsic value. For example, if XYZ stock is trading at $60, a call option on XYZ stock with a strike price of $55 has $5 of intrinsic value. Similarly, a put option on XYZ with a strike price of $65 has $5 of intrinsic value.
Intrinsic Value of an In-the-Money Call Option = Price of Underlying – Strike Price
$5 = $60 – $55
Intrinsic Value of an In-the-Money Put Option = Strike Price – Price of Underlying
$5 = $65 – $60
If an option is not in-the-money, it has zero intrinsic value. For example, a call option on XYZ with a $65 strike price has no intrinsic value, as does a put option with a strike price of $55.
Prior to the expiration date, most options trade for more than their intrinsic value. The amount that an option is trading above its intrinsic value is known as the option’s time value.
For example, if a call option on XYZ with a strike price of $55 is trading for $6 when XYZ stock is trading at $60, the option has $1 of time value.
Time Value of an Option = Option Price – Option’s Intrinsic Value
$1 = $6 – $5
If you re-arrange the equation for the time value of an option, you’ll see that the price of any option is simply the sum of its intrinsic and time values.
Option Price = Intrinsic Value + Time Value
Intrinsic value is a relatively easy concept to understand: it is the amount that the owner of an in-the-money option would earn by immediately exercising the option and offsetting any resulting position in the underlying asset. Time value, on the other hand, is a more nebulous concept.

TEN • DERIVATIVES 10•17
© CSI GLOBAL EDUCATION INC. (2010)
Simply put, time value represents the value of uncertainty. Option buyers want options to be in-the-money at expiration; option writers want the reverse. The greater the uncertainty about where the option will be at expiration, either in-the-money or out-of-the-money, the greater the option’s time value.
Owners of options will definitely not exercise if they are out-of-the-money or at-the-money.
• A call option is out-of-the-money when the price of the underlying asset is lower than the strike price.
• A put option is out-of-the-money when the price of the underlying asset is higher than the strike price.
• Call and put options are at-the-money when the price of the underlying asset equals the strike price.
In either of these cases, it is not in the financial best interest of an option holder to exercise. If a call option is out-of-the-money, it does not make financial sense for the call option holder to buy the underlying asset at the strike price (by exercising the call) when it can be purchased at a lower price in the market. Similarly, if a put option is out-of-the-money, it does not make financial sense for the put option holder to sell the underlying asset at the strike price (by exercising the put) when it can be sold at a higher price in the market.
Since there is generally no advantage to exercising an at-the-money option (for which the strike price equals the market price of the underlying asset), at-the-money options are normally left to expire worthless.
Option ExchangesIn Canada, the Montréal Exchange lists options on individual stocks, stock indexes, financial futures and exchange traded funds (ETFs). ICE Futures Canada lists options on agricultural futures. Table 10.3 illustrates the volume of options traded in Canada in the years 2005 through 2009.
TABLE 10.3 VOLUME OF OPTIONS TRADED IN CANADA FROM 2005 TO 2009
Year Ending December 31
2009 2008 2007 2006 2005
Montréal Exchange
Equity and Long Term Options 14,507,261 14,633,599 12,634,060 11,416,758 9,409,938
Futures Options 247,392 282,190 748,991 605,806 377,370
Montréal Exchange Total 14,754,653 14,915,789 13,383,051 12,022,564 9,787,308
ICE Futures Canada
Futures Options 86,075 21,211 21,841 27,603 29,447
CANADA TOTAL 14,840,728 14,937,000 13,404,892 12,050,167 9,816,755
Source: Montréal Exchange, and ICE Futures Canada websites.

CANADIAN SECURITIES COURSE • VOLUME 110•18
© CSI GLOBAL EDUCATION INC. (2010)
Exchange-traded option prices and trading information are reported in the business press the next day, just like stocks. Table 10.4 provides an illustration.
TABLE 10.4 EQUITY OPTION QUOTATION
XYZ Inc. 17 3/4 Bid Ask Last Opt Vol Opt Int
Mar. $17.50 3.80 4.05 3.95 50 1595
$17.50P 2.35 2.60 2.40 5 3301
Sept. $17.50 1.10 1.35 1.25 41 3403
$17.50P .95 1.05 1.00 30 1058
Dec. $20.00P 1.85 2.00 1.90 193 1047
Total 319 10,404
Explanation
XYZ Inc. The underlying equity for the option.
17 3/4 The closing market price of the underlying equity.
Mar. The options’ expiration month (March, September, December).
$17.50 The exercise price of each series.
$17.50P The option is a put.
3.80 The closing bid price for each XYZ option expressed as a per share price.
4.05 The closing asked price for each XYZ option expressed as a per share price.
3.95 The last sale price (last premium traded) of an option contract for the day expressed as a per share price. For example, the 3.95 fi gure for the XYZ March 17.50 calls is the last sale price for this series on the trading day in question.
Opt Vol The total trading day’s volume in all series of XYZ’s options (50 + 5 + 41 + 30 + 193 = 319). The trading volume for each series is listed in the column below. For example, 50 XYZ March 17.50 calls were traded on the day shown, representing 5,000 underlying XYZ (50 x 100).
Op Int The open interest – the total number of option contracts in the series that are currently outstanding and have not been closed out or exercised. For example, the fi gure 1595 refers to the open interest for the XYZ March 17.50 calls. The fi gure 10,404 refers to the open interest of all series of XYZ options, including the series that did trade as well as the series that did not trade.
Option Strategies for Individual and Institutional InvestorsThe range and complexity of options trading strategies are practically limitless.
This section illustrates and examines eight option strategies used by individual and institutional investors. Each strategy will be either a speculative or risk management strategy, and each will be based on exchange-traded options on the shares of a fictitious company, XYZ Inc. It is important

TEN • DERIVATIVES 10•19
© CSI GLOBAL EDUCATION INC. (2010)
to note that these strategies and the majority of the results are equally applicable to options on any underlying asset.
All of the strategy discussions involve either a long or short position in an XYZ call or put option. Sometimes the option position will be the only part of the strategy, while in other cases the option position will be combined with a position or expected position in XYZ stock. There are other, more complex strategies that are commonly employed, but they are beyond the scope of this course. If you want to learn more about options, the Derivatives Fundamentals Course offered by CSI explains the strategies commonly used in the market to speculate or hedge portfolios.
All of the strategies assume that it is currently June and that XYZ Inc. stock is trading at $52.50 per share. If XYZ Inc. was a real company and it had options listed on its stock, there would typically be a variety of expiration dates and strike prices to choose from. The discussions that follow will make use of one of the four options listed in Table 10.5.
TABLE 10.5 FOUR OPTIONS ON XYZ INC. STOCK TRADING AT $52.50
Option Type Expiration Strike Price Premium
Call September $50 $4.55
Call December $55 $2.00
Put September $50 $1.50
Put December $55 $4.85
To keep things simple, commissions, margin requirements and dividends are ignored in all of the examples in this chapter.
BUYING CALL OPTIONS
Investors buy call options for many reasons. The most popular reason for buying calls is to profit from an expected increase in the price of the underlying stock. This speculative strategy relies on the fact that call option prices tend to rise as the price of the stock rises. The challenge with this strategy is to select the appropriate expiration date and strike price to generate the maximum profit given the expected increase in the price of the stock. There are two ways to realize profit on call options when the underlying increases in price: Investors can exercise the option and buy the stock at the lower exercise price or they can sell the option directly into the market at a profit.
Calls are also bought to establish a maximum purchase price for the stock, or to limit the potential losses on a short position in the stock. In this sense, buying options act much like insurance, protecting the investor when the stock price moves higher. These strategies are considered risk management strategies.
Strategy #1: Buying Calls to Speculate
Suppose an investor buys 5 XYZ December 55 call options at the current price of $2. The investor pays a premium of $1,000 ($2 × 100 shares × 5 contracts) to obtain the right to buy 500 shares of XYZ Inc. at $55 a share on or before the expiration date in December. Because the options are out-of-the-money (the strike price is greater than the stock price of $52.50), the $2 premium consists entirely of time value. The options have no intrinsic value.

CANADIAN SECURITIES COURSE • VOLUME 110•20
© CSI GLOBAL EDUCATION INC. (2010)
If the investor (we’ll call him or her the call buyer) is a speculator, the intent of the call purchase is to profit from an expectation of a higher XYZ stock price. The call buyer probably has no intention of actually owning 500 shares of XYZ. Rather, the call buyer will want to sell the 5 XYZ December 55 calls before they expire, preferably at a higher price than what was paid for them. The chances of this depend on many factors, most importantly the price of XYZ shares. If the price of XYZ shares rise, the price of the calls will likely rise, and the call buyer will be able to sell them at a profit. Of course, the call buyer faces the risk that the stock price does not rise or, worse, it falls. If this happens, the price of the calls will likely fall as well, and the investor may be forced to sell them at a loss.
For example, if by September the price of XYZ stock is $60, the XYZ December 55 calls will be trading for at least their intrinsic value, which in this case is $5. Since there are still three months remaining before the options expire, the premium will also include some time value. Assuming the calls have $1.70 of time value, they will be trading at $6.70. Therefore, the investor could choose to sell the options at $6.70 and realize a profit of $4.70 a share, equal to the difference between the current premium minus the premium paid, or $2,350 total ($4.70 × 100 shares × 5 contracts).
If, however, XYZ shares are trading at $45 a share in September, the XYZ December 55 calls might be worth only $0.25. At this time, and indeed, at all other times before expiration, the investor will have to decide whether to sell the options or hold on in the hope that the stock price (and the options’ price) recovers. If the investor decides to sell at this time, a loss equal to $1.75 a share, or $875 total ($1.75 × 100 shares × 5 contracts) will result.
The decision to sell prior to expiration is not an easy one. On the one hand, selling before expiration allows the call buyer to earn any time value that remains built into the option premium. On the other hand, the option buyer gives up any chance of reaping any further increases in the option’s intrinsic value. The call buyer’s outlook for the price of the stock obviously plays a crucial role in the decision.
EXHIBIT 10.4 OPTIONS AND LEVERAGE
This example highlights one of the reasons why investors are attracted to the strategy of buying calls in anticipation of a higher stock price: leverage. In the realm of buying call options, leverage results in larger profi ts or losses, on a percentage basis, from buying calls instead of buying the stock directly. For instance, if the price of XYZ Inc. stock rose to $60 in September, and the call buyer sold the XYZ December 55 calls for a profi t of $4.70, the call buyer’s rate of return, based on the initial cost of $2, is 235%.
$4.70= 235%
$2
If the stock price declined to $45, however, and the call buyer sells the options for a loss of $1.75, the rate of return is -87.5%.
– $1.75= – 87.5%
$2

TEN • DERIVATIVES 10•21
© CSI GLOBAL EDUCATION INC. (2010)
EXHIBIT 10.4 OPTIONS AND LEVERAGE – Cont’d
To see how leverage increases both profi ts and losses on a percentage basis, compare these returns to the returns from simply buying the stock at $52.50. If the stock is sold at $60, for a profi t of $7.50 a share, the return is “only” 14.3%.
$7.50= 14.3%
$52.50
If the stock fell to $45, and the loss is $7.50 a share, the rate of return is -14.3%.
– $7.50= – 14.3%
$52.50
Thus, while the call provided a greater rate of return when the stock price increased, it also provided a lower rate of return when the stock price fell. This is the risk faced by all investors who decide to use leverage when they buy call options.
Strategy #2: Buying Calls to Manage Risk
The other reason that investors buy call options is to manage risk. Suppose a fund manager intends to buy 50,000 shares of XYZ stock, but will not receive the funds until December. Buying 500 XYZ December 55 call options will protect the fund manager from any sharp increase in the price of XYZ above the $55 strike price, because they will establish a maximum price at which the shares can be purchased.
For instance, if XYZ shares increase to $60 just prior to the expiration date in December, the options will be trading for their intrinsic value only, in this case $5 ($60 – $55). Since the call buyer now has the money to buy the shares, the calls can be exercised, at which point the call buyer will purchase 50,000 shares of XYZ at the strike price of $55. Since the options originally cost $2, the call buyer’s net purchase price is actually $57 a share.
If, however, XYZ shares are trading at $45 just prior to the expiration date, the call buyer will let the options expire and will buy the shares at the going price of $45 each. The investor’s effective cost is $47, which includes the $2 paid for the calls.
WRITING CALL OPTIONS
Investors write call options primarily for the income they provide. The income, in the form of the premium, is the writer’s to keep no matter what happens to the price of the underlying asset or what the buyer eventually does. Call-writing strategies are primarily speculative in nature, but they can be used to manage risk as well.
Call option writers can be classified as either covered call writers or as naked call writers. Covered call writers own the underlying stock, and will use this position to meet their obligations if they are assigned. Naked call writers do not own the underlying stock. If a naked call writer is assigned, the underlying stock must first be purchased in the market before it can be sold to the call option buyer. Since call option buyers will only exercise if the price of the stock is above the strike price, assigned naked call writers must buy the stock at one price (the market price) and sell at a lower price (the strike price). Naked call writers hope, however, that this loss is less than the premium they originally received, so that the overall result for the strategy is a profit.

CANADIAN SECURITIES COURSE • VOLUME 110•22
© CSI GLOBAL EDUCATION INC. (2010)
Since all exchange-traded stock options have an American-style exercise feature, call writers (and put option writers for that matter) face the risk of being assigned at any time prior to expiration. That being said, prior to expiration, most call buyers will find it more advantageous to sell their options rather than exercise them, because by selling they receive the option’s time value as well as its intrinsic value. Only the intrinsic value is captured when an option is exercised. So the chance of being assigned before expiration is not as great as one might think. But it does happen, particularly when the time value is small, and option writers must be aware of this.
Strategy #1: Covered Call Writing
Suppose an investor writes 10 XYZ September 50 call options at the current price of $4.55. The investor receives a premium of $4,550 ($4.55 × 100 shares × 10 contracts) to take on the obligation of selling 1,000 shares of XYZ Inc. at $50 a share on or before the expiration date in September. Because the options are in-the-money (the strike price is less than the stock price), the $4.55 premium consists of both intrinsic and time value. Intrinsic value is equal to $2.50 and time value is equal to $2.05.
If the investor already owned (or purchased at the same time as the options were written) 1,000 shares of XYZ, the overall position is known as a covered call. (We’ll call this investor the covered call writer.) If at expiration in September, the price of XYZ stock is greater than $50 (i.e., the options are in-the-money), the covered call writer will be assigned and will have to sell the stock to the call buyer at $50 a share. From the covered call writer’s perspective, however, the effective sale price is $54.55, because of the initial premium of $4.55.
If, however, the price of the stock at expiration in September is less than $50, the covered call writer will not be assigned and the options will expire worthless. Call buyers will not elect to buy the stock at $50 when it can be purchased for less in the market. The covered call writer will retain the shares and the initial premium. In this case, the premium reduces the covered call writer’s effective stock purchase price by $4.55 a share. That is, if the covered call writer bought the XYZ stock at, say, $50, and the options expired worthless, the covered call writer’s effective purchase price is now $45.45 ($50 – $4.55). In this sense, writing the call slightly reduces the risk of owning the stock.
Strategy # 2: Naked Call Writing
Suppose a different investor writes 10 XYZ September 50 call options at the current price of $4.55. If this investor did not already own the shares, the investor is considered a naked call writer (and that’s what we’ll call him or her). The best that the naked call writer can hope for is that the price of XYZ stock will be lower than $50 at expiration. If this happens, the calls will expire worthless and the naked call writer will earn a profit equal to $4.55 a share, the initial premium received. This is the most that the call writer can expect to earn from this strategy.
If the price of the shares increases, the naked call writer will realize a loss if the stock price is higher than the strike price plus the premium received, in this case $54.55. If this happens, the naked call writer will be forced to buy the stock at the higher market price and then turn around and sell them to the call buyer at the $50 strike price. When the stock price is greater than $54.55, the cost of buying the stock is greater than the combined proceeds from selling the stock and the premium initially received.
For example, if the price of the XYZ rose to $60 at expiration, the naked call writer will suffer a $10 loss on the purchase and sale of the shares (buy at $60, sell at $50). This loss is offset somewhat by the initial premium of $4.55, so that the actual loss is $5.45 a share, or $5,450 in total ($5.45 × 100 shares × 10 contracts).
TEN • DERIVATIVES 10•23
© CSI GLOBAL EDUCATION INC. (2010)
BUYING PUT OPTIONS
Investors buy put options for many reasons. A popular reason for buying puts is to profit from an expected decline in the price of the stock. This speculative strategy relies on the fact that put option prices tend to rise as the price of the stock falls. Just like buying calls, the selection of an expiration date and strike price is crucial to the success (or lack thereof ) of the strategy.
Puts are also bought for risk management purposes. Because puts can be used to lock in a minimum selling price for a stock, they are very popular with investors who own stock. Buying puts can protect investors from a decline in the price of a stock below the strike price.
Strategy #1: Buying Puts to Speculate
Suppose an investor buys 10 XYZ September 50 put options at the current price of $1.50. The put buyer pays a premium of $1,500 ($1.50 × 100 shares × 10 contracts) to obtain the right to sell 1,000 shares of XYZ Inc. at $50 a share on or before the expiration date in September. Because the options are out-of-the-money (the strike price is less than the stock price), the $1.50 premium consists entirely of time value. The option has no intrinsic value.
The put buyer could have an opinion about the price of XYZ stock exactly opposite that of the call buyer. That is, the put buyer might believe that the price of XYZ stock will fall and that put options on XYZ can be bought and sold for a profit. The put buyer might have no intention of actually selling 1,000 shares of XYZ stock. In fact, the put buyer in this case probably doesn’t even own 1,000 XYZ shares to sell.
If the stock price falls, the XYZ September 50 put options will likely rise in value. This will allow the put buyer to sell his options for a profit. Of course, if the stock price rises, the put options will most likely lose value and the put buyer may be forced to sell the options at a loss.
For example, if XYZ stock is trading at $45 one month before the September expiration date, the XYZ September 50 puts will be trading for at least their intrinsic value, or $5. Since there is still one month before the expiration date, the options will have some time value as well. Assuming they have time value of $0.25, the options will be trading at $5.25. Therefore, the put buyer could choose to sell the puts for $5.25 and realize a profit of $3.75 a share, which is equal to the difference between the current put price and the put buyer’s original purchase price. Based on 10 contracts, the put buyer’s total profit is $3,750 ($3.75 × 100 shares × 10 contracts).
If, however, XYZ were trading at $60 a share, the XYZ September 50 puts might be worth only $0.05. Because the options are so far out-of-the-money, and because there is only one month left until the options expire, the options will not have a lot of time value. The low option price tells us the market does not believe there is much of a chance for XYZ shares to fall below $50 anytime over the next month.
The put buyer would have to decide whether to sell the options at this price, or hold on in hope that the price of XYZ does fall to below $50. If the stock does fall, the price of puts will rise. If the stock doesn’t fall below $50, the puts will be worthless when they expire. If the put buyer decides to sell the options at $0.05, a loss equal to $1.45 a share ($0.05 – $1.50) or $1,450 total ($1.45 × 100 shares × 10 contracts) would result.
Strategy #2: Buying Puts to Manage Risk
Suppose a different investor buys 10 XYZ September 50 put options at the current price of $1.50, but in this case the put buyer actually owns 1,000 shares of XYZ. In this case, the put purchase will act as insurance against a drop in the price of the stock. Recall that put buyers have

CANADIAN SECURITIES COURSE • VOLUME 110•24
© CSI GLOBAL EDUCATION INC. (2010)
the right to sell the stock at the strike price. Therefore, buying a put in conjunction with owning the stock, a strategy known as a married put or a put hedge, gives the put buyer the right to sell the stock at the strike price. If the price of the stock is below the strike price of the put when the puts expire, the put buyer will most likely exercise the puts and sell the stock to the put writer. The strike price acts as a floor price for the sale of the stock.
For example, if XYZ shares are trading at $45 just prior to the expiration date in September, the puts will be trading very close to their intrinsic value of $5, because the puts are in-the-money and there is very little time left until the expiration date. The put buyer may choose to exercise the puts and sell the stock at the $50 strike price. The put buyer has been protected from the drop in the stock price below $50. The protection was not free, however, because the put buyer had to pay $1.50 for the puts. The put buyer’s effective sale price is actually only $48.50, after deducting the cost of the puts. But this sale price is still better than the stock’s $45 market price.
The put buyer, for whatever reason, may not want or even be able to sell the stock. If so, the puts should be sold. Any profit on the sale of the puts reduces the put buyer’s effective stock purchase price. If the put buyer originally bought the stock at a price of, say, $40, and then sold the puts at $5, for a net profit of $3.50, the effective stock purchase price becomes $36.50. Eventually, when the shares are sold, the put buyer will measure the total profit on the stock purchase as the difference between the sale price and the effective purchase price of $36.50.
WRITING PUT OPTIONS
Investors write put options primarily for the income they provide. The income, in the form of the premium, is the writer’s to keep no matter what happens to the price of the underlying asset or what the buyer eventually does. Like their call-writing cousins, put-writing strategies are primarily speculative in nature, but they can be used to manage risk as well.
Put option writers can be classified as either covered or naked. Covered put writing, however, is not nearly as common as covered call writing because, technically, a covered put write combines a short put with a short position in the stock. It’s a simple fact of the stock markets that there are many more long positions in stocks than there are short positions.
A more common, “nearly” covered put writing strategy is known as a cash-secured put write. A cash-secured put write involves writing a put and setting aside an amount of cash equal to the strike price. If possible, the cash should be invested in a short-term, liquid money market security such as a Treasury bill so that it will earn some interest. If the cash-secured put writer is assigned, the cash (or proceeds from selling the T-bill) will be used to buy the stock from the exercising put buyer. Naked put writers have no position in the stock and have not specifically earmarked an amount of cash to buy the stock. That being said, naked put writers must be prepared to buy the stock, so they should always have the financial resources to do so. Naked put writers hope to profit from a stock price that stays the same or goes up. If this happens, the price of the puts will likely decline as well, and the chance of being assigned will also be less. The naked put writer may then choose to buy back the options at the lower price to realize a profit. If the stock price does not rise, the put writer may be assigned, and may suffer a loss. Depending on how low the stock price is and the amount of premium received, naked put writers may still profit even if they are assigned.
Strategy # 1: Cash-Secured Put Writing
Suppose an investor writes 5 XYZ December 55 put options at the current price of $4.85. The put writer receives a premium of $2,425 ($4.85 × 100 shares × 5 contracts) to take on the

TEN • DERIVATIVES 10•25
© CSI GLOBAL EDUCATION INC. (2010)
obligation of buying 500 shares of XYZ Inc. at $55 a share on or before the expiration date in December. Because the options are in-the-money (the strike price is greater than the stock price), the $4.85 premium consists of both intrinsic value and time value. Intrinsic value is equal to $2.50 and time value is equal to $2.35.
If the put writer had set aside an amount of cash equal to the purchase value of the stock, the strategy is known as a cash-secured put write. The put writer in this case would have to set aside $27,500 ($55 strike price × 100 shares × 5 contracts).
Some investors actually use cash-secured put writes as a way to buy the stock at an effective price that is lower than the current market price. The effective price is equal to the strike price minus the premium received.
For example, if at expiration in December the price of XYZ stock is less than $55, the put writer will be assigned and will have to buy 500 shares of XYZ at the strike price of $55 a share. The effective purchase price is actually $50.15, because the put writer received a premium of $4.85 when the options were written. This effective purchase price is less than the $52.50 price of the stock when the cash-secured put write was established.
If at expiration in December the price of XYZ stock is greater than $55, the cash-secured put writer will not be assigned because the options are out-of-the-money. The cash-secured put writer, however, gets to keep the premium of $4.85, and will have to decide whether to use the cash to buy the stock at the market price.
Strategy #2: Naked Put Writing
Suppose a different investor writes 5 XYZ December 55 put options at the current price of $4.85. If the put writer does not set aside a specific amount of cash to cover the potential purchase of the stock, the put writer is considered a naked put writer. The naked put writer wants the price of XYZ to be higher than $55 at expiration. If this happens, the puts will expire worthless and the put writer will earn a profit equal to $4.85 a share, the initial premium received.
If the price of XYZ stock falls, however, the naked put writer will most likely realize a loss, because put buyers will exercise their options to sell the stock at the higher strike price. (The naked put writer in this case will suffer a loss only if XYZ stock is trading for less than $50.15 at option expiration.) The naked put writer will have to buy stock at a price that is higher than the market price. If the put writer did not want to hold the shares in anticipation of a higher price, they could be sold.
For example, if the price of XYZ fell to $45 at expiration, the naked put writer will suffer a $10 loss on the purchase and sale of the shares (buy at the strike price of $55, sell at the market price of $45). This loss is offset somewhat by the initial premium of $4.85, so that the actual loss is $5.15 a share, or $2,575 in total ($5.15 × 100 shares × 5 contracts).
Option Strategies for CorporationsUnlike individual and institutional investors, corporations do not normally speculate with derivatives. They’re just not interested in risking their shareholders’ money betting on the price of an underlying asset. They are, however, interested in managing risk, and they often use options to do so. The risks that corporations most often manage are related to interest rates, exchange rates or commodity prices. For instance, corporations regularly take on debt to help finance their operations. Sometimes the interest rate on the debt is a floating rate that rises and falls with
CANADIAN SECURITIES COURSE • VOLUME 110•26
© CSI GLOBAL EDUCATION INC. (2010)
market interest rates. Just like the investor who buys a call to establish a maximum purchase price for a stock, corporations can buy a call to establish a maximum interest rate on floating-rate debt.
CALL OPTION STRATEGIES
Suppose a Canadian company knows it will buy US$1 million worth of goods from a U.S. supplier in three months’ time. Based on an exchange rate of C$1.12 per U.S. dollar, the U.S. dollar purchase will cost the company C$1.12 million. The company can do two things to secure the US$1 million: buy it now and pay C$1.12 million, or wait three months and pay whatever the exchange rate is at that time. The company would prefer to do the latter and wait, but by doing this, it faces the risk that the value of the U.S. dollar will strengthen relative to the Canadian dollar. This would cause the Canadian dollar cost of the purchase to be higher than C$1.12 million. To protect itself against this risk, the corporation can buy a call option on the U.S. dollar.
Suppose the corporation buys a three-month U.S. dollar call option with a strike price of C$1.15. This option is an OTC option and would most likely be written by the corporation’s bank. If at the end of three months the exchange turns out to be C$1.20, the corporation will exercise the call and buy the U.S. dollars from its bank for C$1.15 million. If, however, the U.S. dollar weakens so that in three months the exchange rate is C$1.10, the corporation will let the option expire and will buy the U.S. dollars at the lower exchange rate. The purchase of the call option has capped the exchange rate at C$1.15 plus the cost of the option.
PUT OPTION STRATEGIES
Suppose a Canadian oil company will have 1 million barrels of crude oil to sell in six months’ time. The current price of crude oil is US$70 a barrel, but the company is not sure what the price will be in six months. To lock in a minimum sale price, the company buys a put option on one million barrels of crude oil with a strike price of US$68 a barrel. This will protect the company from an oil price lower than US$68 a barrel.
If in six months the price of crude oil is less than US$68, the company will exercise its put option and sell the oil to the put option writer at the strike price. If the price is greater than US$68, the company will let the option expire and will sell the oil at the going market price.
FORWARDS AND FUTURES
A forward is a contract between two parties: a buyer and a seller. The buyer of a forward agrees to buy the underlying asset from the seller on a future date at a price agreed upon today. Unlike for options, both parties are obligated to participate in the future trade.
Forwards can trade on an exchange or over the counter. When a forward is traded on an exchange, it is known as a futures contract. Futures are usually classified into two groups depending on the type of underlying asset. Contracts that have a financial asset – a stock, bond, currency, interest rate or index – as the underlying asset are referred to as financial futures. Contracts that have a physical asset (such as gold, crude oil, soybeans and more) as the underlying asset are known as commodity futures.
FORWARDS AND FUTURES

TEN • DERIVATIVES 10•27
© CSI GLOBAL EDUCATION INC. (2010)
When a forward is traded over the counter, it is generally referred to as a forward agreement. The predominant types of forward agreements are based on interest rates and currencies. Forward agreements on commodities exist, but the size of trading in these contracts is small compared to trading in interest rate and currency forwards.
While forwards are certainly an interesting topic on which much can be said, the market is dominated by institutional traders and large corporations, not investment advisors and individual investors. Futures, on the other hand, are accessible to a much broader segment of the market, including investment advisors and individual investors. The remainder of this section will focus on the key features of futures and some basic futures strategies.
Key Terms and DefinitionsFutures are simply exchange-traded forward contracts, and as such they have many of the features inherent to all forward contracts. They are agreements between two parties to buy or sell an underlying asset at some future point in time at a predetermined price. Like all exchange-traded derivatives, futures are standardized with respect to the amount of the asset underlying each contract, expiration dates and delivery locations. There is no single expiration date for the different futures contracts available. For example, futures on the S&P/TSX 60 Index expire on the third Friday of the contract month, while futures on ten-year Government of Canada bonds expire on the third business day before the last business day of the month. As is the case with exchange traded options, the expiration date is set by the exchange on which the contract is listed.
Many commodity futures require additional standardization for things such as the quality of the underlying asset and the delivery location. As usual, standardization allows users to offset their contracts prior to expiration and provides the backing of a clearinghouse.
The party that agrees to buy the underlying asset holds a long position in the futures contract. This party is also said to have bought the futures contract. The party that agrees to sell the underlying asset holds a short position in the futures contract, and is said to have sold the futures contract. The buyer of a futures contract does not pay anything to the seller when the two enter into the contract. Likewise, the seller does not deliver the underlying asset right away. The futures contract simply establishes the price at which a trade will take place in the future. As it turns out, most parties end up offsetting their positions prior to expiration, so that few deliveries actually take place.
If a contract is not offset and is held to the expiration date, delivery will occur. Longs will have to accept delivery of the underlying asset and make payments to the shorts. Shorts have to make delivery of the underlying asset and accept payments from the longs.
CASH-SETTLED FUTURES
Many financial futures are based on underlying assets that are difficult or even impossible to deliver. For these types of futures, delivery involves an exchange of cash from one party to the other based on the performance of the underlying asset from the time the future was entered into until the time that it expires. These futures are known as cash-settled futures contracts.
An equity index futures contract is an example of a futures contract that is cash settled. Those who are long a stock index futures contract are not obligated to accept delivery of the stocks that make up the index, nor are those who are short required to make delivery of the stocks. Instead, if the position is held to the expiration date, either the long or the short will make a cash payment

CANADIAN SECURITIES COURSE • VOLUME 110•28
© CSI GLOBAL EDUCATION INC. (2010)
to the other based on the difference between the price agreed to in the futures contract and the price of the underlying asset on the expiration date.
• If the price agreed to in the futures contract is greater than the price of the underlying asset at expiration, prices have fallen, and the long must pay the short.
• If the price agreed to in the futures contract is less than the price of the underlying asset at expiration, prices have risen, and the short must pay the long.
As with all other futures contracts, cash-settled futures can be offset prior to expiration.
MARGIN REQUIREMENTS AND MARKING-TO-MARKET
Buyers and sellers of futures contracts must deposit and maintain adequate margin in their futures accounts. Unlike margin on stock transactions (which are the counterpart to the maximum loan value that a dealer may extend to its clients), futures margins are meant to provide a level of assurance that the financial obligations of the contract will be met. In effect, futures margins represent a good-faith deposit or performance bond.
There are two levels of margin used in futures trading: initial margin and maintenance margin. Initial or original margin is required when the contract is entered into. Maintenance margin is the minimum account balance that must be maintained while the contract is still open.
Minimum initial and maintenance margin rates for a particular futures contract are set by the exchange on which it trades, although investment dealers may impose higher rates on their clients. Dealers, however, may not charge their clients less than the exchange minimums.
One of the important features of futures trading is the daily settlement of gains and losses. This process is known as marking-to-market. At the end of each trading day, those who are long a contract make a payment to those who are short, or vice versa, depending on the change in the price of the contract from the previous day.
If either party accumulates losses that cause their account balance to fall below the maintenance margin level, they must deposit addition margin to their futures accounts.
Futures ExchangesICE Futures Canada lists futures contracts on canola and western barley. The Bourse de Montréal lists financial futures contracts and is currently the only exchange in Canada to list these types of contracts. The Bourse offers contracts on index futures, two-year and ten-year Government of Canada bonds, bankers’ acceptances, and the 30-day overnight repo rate. Table 10.6 illustrates the number of futures contracts traded in Canada in the years 2005 through 2009.
TABLE 10.6 NUMBER OF FUTURES CONTRACTS TRADED IN CANADA 2005–2009
Year Ending December 31
2009 2008 2007 2006 2005
Bourse de Montréal 12,979,478 17,345,955 24,595,857 24,481,675 18,240,626
ICE Futures Canada 3,483,271 3,299,999 3,430,324 2,868,933 2,094,774
Canada Total 16,462,749 20,645,954 28,026,181 27,350,608 20,335,400
Source: Bourse de Montréal, and ICE Futures Canada websites.
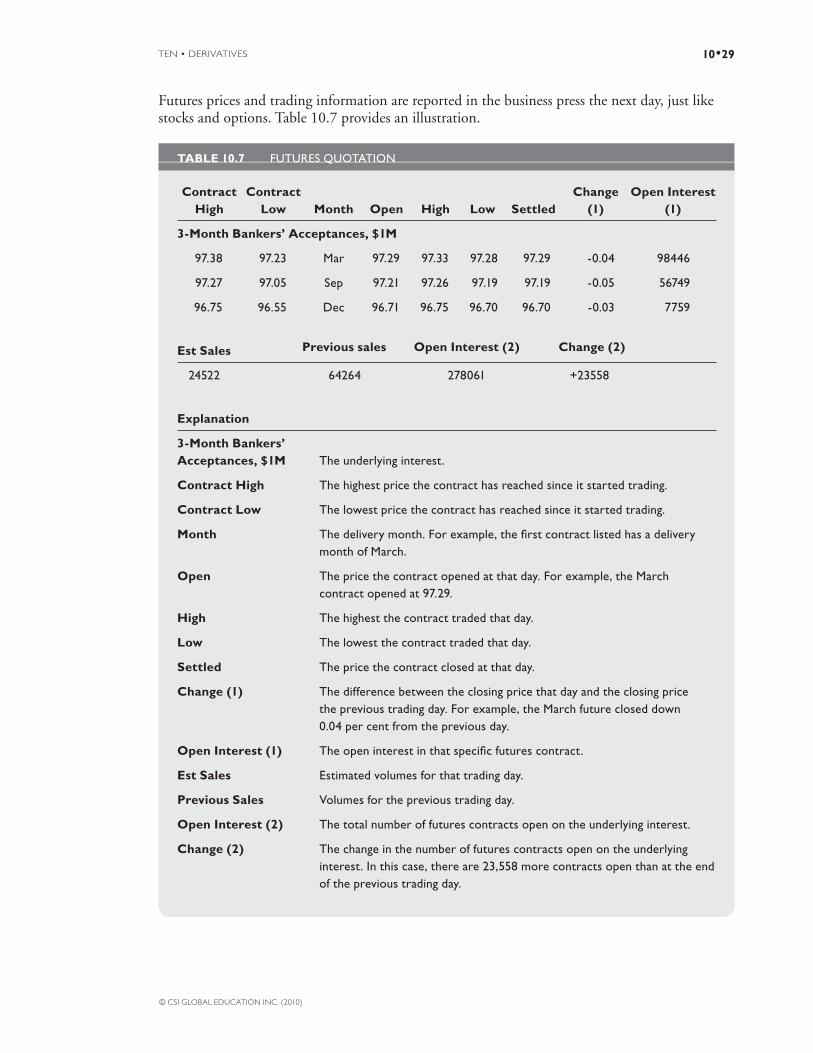
TEN • DERIVATIVES 10•29
© CSI GLOBAL EDUCATION INC. (2010)
Futures prices and trading information are reported in the business press the next day, just like stocks and options. Table 10.7 provides an illustration.
TABLE 10.7 FUTURES QUOTATION
Contract High
Contract Low Month Open High Low Settled
Change (1)
Open Interest (1)
3-Month Bankers’ Acceptances, $1M
97.38 97.23 Mar 97.29 97.33 97.28 97.29 -0.04 98446
97.27 97.05 Sep 97.21 97.26 97.19 97.19 -0.05 56749
96.75 96.55 Dec 96.71 96.75 96.70 96.70 -0.03 7759
Est Sales Previous sales Open Interest (2) Change (2)
24522 64264 278061 +23558
Explanation
3-Month Bankers’ Acceptances, $1M The underlying interest.
Contract High The highest price the contract has reached since it started trading.
Contract Low The lowest price the contract has reached since it started trading.
Month The delivery month. For example, the fi rst contract listed has a delivery month of March.
Open The price the contract opened at that day. For example, the March contract opened at 97.29.
High The highest the contract traded that day.
Low The lowest the contract traded that day.
Settled The price the contract closed at that day.
Change (1) The difference between the closing price that day and the closing price the previous trading day. For example, the March future closed down 0.04 per cent from the previous day.
Open Interest (1) The open interest in that specifi c futures contract.
Est Sales Estimated volumes for that trading day.
Previous Sales Volumes for the previous trading day.
Open Interest (2) The total number of futures contracts open on the underlying interest.
Change (2) The change in the number of futures contracts open on the underlying interest. In this case, there are 23,558 more contracts open than at the end of the previous trading day.

CANADIAN SECURITIES COURSE • VOLUME 110•30
© CSI GLOBAL EDUCATION INC. (2010)
Futures Strategies for InvestorsFutures are inherently simpler than options. Whereas with options there are four basic positions – long a call, short a call, long a put, short a put – there are only two basic positions with futures contracts – long and short. Options also have strike prices, so that an almost uncountable number of different strategies can be designed by combining options with different strike prices and expiration dates, as well as with a position in the underlying asset. The number of strategies that can be designed with futures is limited because there are only two basic positions for each expiration date.
BUYING FUTURES
Investors buy futures either to profit from an expected increase in the price of the underlying asset, or to lock in a purchase price for the asset on some future date. The former application is speculation while the latter is risk management.
Strategy #1: Buying Futures to Speculate
Suppose an investor buys 10 December gold futures at a price of US$575 an ounce. Since each gold futures contract has an underlying asset of 100 ounces of gold, the investor has agreed to buy 1,000 ounces of gold from the futures seller on a specific date in December for a total cost of US$575,000 ($575 × 100 ounces × 10 contracts).
If the investor bought the futures to profit from the expectation of a higher gold futures price, the investor probably has no intention of actually buying 1,000 ounces of gold. Rather, the investor wants to sell the 10 December gold futures, preferably at a higher price than what was paid for them. The chances of this happening depend primarily on the price of gold in the spot or cash market. If the spot price of gold rises, then the price of gold futures will rise, too. Of course, the investor faces the risk that the price of gold will fall. If this happens, the price of gold futures will fall as well, and the investor may be forced to sell the contracts at a loss.
For example, if in early November the price of December gold futures have risen to $600 in response to a rising gold spot price, the investor could choose to sell the futures at $600 and realize a profit of $25 an ounce, or $25,000 total ($25 × 100 ounces × 10 contracts).
If, however, December gold futures were trading at $550, the investor would have to decide whether to sell the futures or hold on in the hope that the price recovers before the expiration date.
If the investor decided to sell at this price, a loss equal to $25 an ounce, or $25,000 total ($25 × 100 ounces × 10 contracts), would result.
Strategy #2: Buying Futures to Manage Risk
Suppose a different investor buys 10 December gold futures at a price of US$575 an ounce with the intention of actually buying 1,000 ounces of gold in December. The gold purchase may actually be a speculative decision, but the purchase of futures to lock in a purchase price is considered a risk management decision. In this case, all the investor needs to do is not offset the contract. At expiration, the investor will be required to take delivery of 1,000 ounces of gold for a payment of US$575,000. The purchase of the futures contracts locks the investor in to a purchase price of US$575 an ounce regardless of what happens to the price of gold in the spot market.

TEN • DERIVATIVES 10•31
© CSI GLOBAL EDUCATION INC. (2010)
SELLING FUTURES
Investors sell futures either to profit from an expected decline in the price of the underlying asset or to lock in a sale price for the asset on some future date.
Strategy #1: Selling Futures to Speculate
Suppose an investor sells 5 December Government of Canada ten-year bond futures at a price of 105. (Just like prices in the bond market, the price of a bond futures contract is always quoted on a “per $100 of face value” basis.) Since each bond futures contract has a $100,000 face value bond as its underlying asset, the investor has agreed to sell a $500,000 face value bond to the buyer on a specific date in December for total proceeds of $525,000 ([105 ÷ 100] × $100,000 bond × 5 contracts).
The investor in the above scenario could have sold the futures simply to profit from an expectation of a lower bond futures price. The investor probably has no intention of actually selling $500,000 of bonds. Rather, the investor will want to buy back the 5 December bond futures in the market, preferably at a lower price than what they were sold for. The chances of this happening depend primarily on the price of ten-year Government of Canada bonds in the spot or cash market. If bond prices fall in the cash market, then the price of bond futures will fall, too. Of course, the investor faces the risk that bond prices will rise. If this happens, the price of bond futures will rise as well, and the investor may be forced to buy back the contracts at a loss.
For example, if in early November the price of December bond futures have declined from 105 to 100, the investor could choose to buy back the futures at 100 and realize a profit of 5 points, or $25,000 total ([5 ÷ 100] × $100,000 face value × 5 contracts).
If, however, December bond futures were trading at 107.50, the investor would have to decide whether to buy the futures or hold on in the hope that the price falls before the expiration date. If the investor decided to buy them back, a loss equal to 2.5 points, or $12,500 total ([2.5 ÷ 100] × $100,000 face value × 5 contracts), would result.
Strategy #2: Selling Futures to Manage Risk
Suppose a different investor sells 5 December Government of Canada ten-year bond futures at a price of 105 and that, for whatever reason, the investor actually wanted to sell $500,000 of bonds in December. In this case, all the investor needs to do is not offset the contracts. At expiration, the investor will be required to make delivery of $500,000 of bonds and in return will receive $525,000. The sale of the futures contracts locks the investor in to a sale price of 105 regardless of what happens to bond prices.
FUTURES STRATEGIES FOR CORPORATIONS
Corporations use futures to manage risk in the same way that investors do. When a company needs to lock in the purchase price of an asset, they may decide to buy futures on the asset. Similarly, when a company needs to lock in the sale price of an asset, they may decide to sell futures on the asset.
Even though they take futures positions consistent with their risk management needs, many companies offset their positions before expiration rather than actually making or taking delivery of the underlying asset, as the investor examples illustrated. But the futures can still satisfy a company’s risk management needs by providing price protection.

CANADIAN SECURITIES COURSE • VOLUME 110•32
© CSI GLOBAL EDUCATION INC. (2010)
Exhibit 10.5 describes how a futures strategy is used.
EXHIBIT 10.5 EXAMPLE OF A FUTURES STRATEGY (FOR INFORMATION PURPOSES ONLY)
In July, a brewery determines that it will need 100 tonnes of barley in November. Barley is trading in the spot market at $150 a tonne, while November barley futures are trading at $155 a tonne. The brewery’s regular barley supplier will not guarantee a fi xed price for the November purchase, but instead will charge the spot price on the day the brewery places the order. In order to protect itself from a sharp increase in the price of barley, the brewery buys 5 November barley futures at the current price of $155. (Each barley futures contract has an underlying asset of 20 tonnes of barley.)
In early November, barley is trading at $170 a tonne in the spot market. At the same time, November barley futures are trading at $171 a tonne. Rather than take delivery by holding its futures position until the expiration date, the brewery would like to buy the barley from its regular supplier. There are a number of reasons why the brewery might want to do this.
• First, the brewery’s operations may be located far from the standardized delivery location for barley futures. If the brewery were to take delivery of the barley, it would incur the expense of shipping the barley from the delivery location to its own location.
• Second, the exact quality of the barley that underlies the barley futures contract may not match the quality the brewery normally uses. The brewery’s regular supplier would presumably be able to deliver the required quality.
• Third, the standardized delivery date of the barley futures contract may not coincide with the exact date the brewery requires the barley. Again, the regular supplier would likely be able to deliver on the date the brewery required.
As a result, the brewery would likely want to deal with its regular supplier. To get out of its obligation to buy barley by way of the futures contracts, the brewery offsets its position by selling 5 November barley futures at the current price of $171 a tonne. Because the price rose and the brewery had a long position, it earns a profi t of $16 a tonne on the futures transactions.
At the same time, the brewery places an order to buy 100 tonnes of barley from its supplier. The supplier charges the brewery the current spot price of $170 a tonne. The brewery’s effective price, however, is lower than this because of the futures profi t. The net effect is that the brewery ends up paying $154 a tonne, which is equal to the $170 purchase price minus the $16 futures profi t. So, even though barley rose $20 from late July to early November, the price the brewery actually pays is only $4 higher than the price back in July. This is because the futures provided the brewery with price protection for the majority of the price increase. This process illustrates how companies use futures for price protection rather than an outlet to buy or sell the underlying asset.
TEN • DERIVATIVES 10•33
© CSI GLOBAL EDUCATION INC. (2010)
RIGHTS AND WARRANTS
Like call options on stocks, rights and warrants are securities that give their owners the right, but not the obligation, to buy a specific amount of stock at a specified price on or before the expiration date.
Unlike options, however, rights and warrants are usually issued by a company as a method of raising capital. Although they may dilute the positions of existing shareholders if they are exercised, they allow the company to raise capital quickly and cost-effectively.
The other major difference between rights, warrants and call options is the time to expiration. Rights are usually very short term, with an expiration date often as little as four to six weeks after they are issued, while warrants tend to be issued with three to five years to expiration.
RightsA right is a privilege granted to an existing shareholder to acquire additional shares directly from the issuing company. To raise capital by issuing additional common shares, a company may give shareholders rights that allow them to buy additional shares in direct proportion to the number of shares they already own. For example, shareholders may be given one right for each share they own, and the offer may be based on the right to buy one additional share for each ten shares held. In this case, the company wants to increase its outstanding shares by 10%, and each shareholder is given the opportunity to increase their own holdings by 10%.
The exercise price of a right, known as the subscription or offering price, is almost always lower than the market price of the shares at the time the rights are issued. This makes the rights valuable and gives shareholders an incentive to exercise them.
When a company decides to do a rights offering, they announce a record date to determine the list of shareholders who will receive the rights, much as they do when they issue a dividend. All common shareholders who are in the record books on the record date receive rights.
For the two business days before the record date, the shares trade ex rights. This means that anyone buying shares on or after the ex rights date is not entitled to receive the rights from the company. Between the day of the announcement that rights will be issued and the ex rights date, the stock is said to be trading cum rights, meaning that anyone who buys the stock is entitled to receive the rights if they hold the stock until at least the record date.
The usual method of making an offering is to issue one right for each outstanding common share. A certain number of these rights are required to buy one new share. In addition to having the correct number of rights required to purchase shares, the subscriber must pay the subscription price to the company to acquire these additional shares. No commission is levied when the rights holder exercises the rights and acquires shares. Fractional shares may or may not be issued, at the company’s discretion.
A secondary market in the rights may develop, so that rights holders who do not want to subscribe can sell their rights on the listing exchange and non-shareholders can buy them. The rights are usually listed on the exchange that lists the underlying common stock.
The price of the rights tends to rise and fall in the secondary market as the price of the common stock fluctuates, although not necessarily to the same degree.
RIGHTS AND WARRANTS

CANADIAN SECURITIES COURSE • VOLUME 110•34
© CSI GLOBAL EDUCATION INC. (2010)
A rights holder may take any one of four courses of action:
• Exercise some or all of the rights and acquire the shares
• Sell some or all of the rights
• Buy additional rights to trade or exercise later
• Do nothing and let the rights expire worthless
Doing nothing provides no benefit. Rights are not automatically exercised on behalf of their holders. The holder must select a course of action appropriate for his or her circumstances.
THE INTRINSIC VALUE OF RIGHTS DURING THE EX-RIGHTS PERIOD
Like options, rights may have intrinsic value. As mentioned previously, rights are normally issued with a subscription price lower than the market price of the stock. This means that they have intrinsic value at the time they are issued. After they are issued, they will have intrinsic value as long as the market price of the stock stays above the subscription price. Because rights have a short lifespan, they generally have very little time value. That being said, they usually have some time value. As with options, the trading price of a right is equal to the intrinsic value, if any, plus the time value.
There are two formulas used to calculate the intrinsic value of a right: one is used during the cum-rights period and the other is used during the ex-rights period. We’ll explain the ex-rights formula first because the logic behind the intrinsic value formula is more straightforward during the ex-rights period than it is during the cum-rights period.
Two business days before the record date, the shares start trading ex rights and the rights begin to trade as a separate entity. The intrinsic value of a right during the ex-rights period is calculated using the following formula:
Intrinsic Value of Rights during the Ex-Rights PeriodS X
n
S = the market price of the stock
X = the exercise or subscription price of the rights
N = the number of rights needed to buy one share
For example, on June 1, ABC Co. declares a rights offering whereby shareholders of record on Friday, June 10, will be granted one right for each common share held. Five rights are required to buy one new share at a subscription price of $23. The rights will expire at the close of business on July 6.
On June 8, the first day of the ex-rights period, the rights begin to trade as a separate security. If on this day ABC shares open for trading at $25, the intrinsic value of each right is $0.40.
$25 $23Intrinsic Value of Rights
5$25
$0.40

TEN • DERIVATIVES 10•35
© CSI GLOBAL EDUCATION INC. (2010)
THE INTRINSIC VALUE OF RIGHTS DURING THE CUM-RIGHTS PERIOD
A different formula is needed to calculate the intrinsic value of a right during the cum-rights period because during this time the rights are embedded in the common stock. Since buyers of the stock during the cum-rights period are eligible to receive the rights, a portion of the common stock’s price represents the value of the rights as well as the value of the stock. The best way to understand this is to work through an example.
Continuing with the previous ABC example, suppose that ABC announced the rights offering after 4 p.m. on June 1, a day on which its shares closed at $25.50. Because the closing price is $2.50 more than the rights’ subscription price, and because 5 rights are needed to buy one new share, the intrinsic value of each right based on this closing price (and based on the formula for intrinsic value during the ex rights period) is $0.50. In other words, if the rights traded separately from the stock immediately after the company announced the rights offering – which they do not – their intrinsic value would be $0.50 each.
On June 2, buyers of ABC common shares know that they are entitled to receive the rights, and they know that based on the previous closing price these rights are worth $0.50 each. All else being equal, buyers should now be willing to pay $26 for ABC shares, not because they think ABC is now worth more, but because they know they are entitled to receive rights that are worth $0.50.
The correct formula for the intrinsic value of the rights during the cum-rights period must take into account the fact that part of the price of ABC shares includes the intrinsic value of the rights. If we used the formula for the intrinsic value during the ex-rights period, it would show that the intrinsic value of the ABC rights is $0.60 rather than $0.50. But we have just shown that these rights are worth only $0.50. Therefore, the following formula must be used to determine the intrinsic value of rights during the cum-rights period:
Intrinsic Value of Rights during the Cum-Rights Period1
S Xn
Adding the “+1” term to the denominator is all that’s needed to make the adjustment and account for the fact that the price of ABC now includes the intrinsic value of the rights.
When ABC shares open for trading at $26 on June 2, and this price is plugged into the formula, the intrinsic value of the rights remains $0.50.
$26 $23Intrinsic Value of Rights
5 1
$36
$0.50
TRADING RIGHTS
If the common shares of the company issuing rights are listed on a stock exchange, the rights are listed on the exchange automatically. Trading in the rights takes place until they expire. Rights seldom sell precisely at their intrinsic value because of buying and selling costs and temporary imbalances of supply and demand.
Canadian trading practice requires that a rights transaction be settled by the third business day after the transaction takes place. This is known as regular delivery and is identical to the settlement period for a stock.
CANADIAN SECURITIES COURSE • VOLUME 110•36
© CSI GLOBAL EDUCATION INC. (2010)
On the TSX Venture Exchange, rights are usually traded on a cash basis three days prior to and including the expiry date. Starting on the third business day prior to expiry, the buyer is required to pay cash and take delivery of the rights on the same day the transaction takes place.
The TSX Venture Exchange terminates trading in the rights at the close of the market on the expiry date.
The Toronto Stock Exchange has special settlement procedures for rights to facilitate settlement as the expiry date approaches. Trades three days before the expiry date settle one day before the expiry date. Trades two days and one day before the expiry date settle for cash the next day. Trades executed on the expiry date are settled in cash the same day. Because the settlement periods are shortened, the investor must deliver the rights certificate to the investment dealer’s offices in time to make the trades. Orders may not be accepted unless the certificates are held in the member firm’s account.
The TSX terminates trading in the rights at noon on the expiry date.
Investment advisors are cautioned that the terms of trading may change with different rights listings. In addition, exchanges may issue or change trading rules in order to relieve trading or clearing problems. Any investor or investment advisor wishing to trade rights should confirm the procedures and rules before executing any trades.
Because of their short lifetime, rights are often bought and sold on a when-issued basis between the date on which the rights are first announced by the company and the date on which the actual rights are received by shareholders. When the rights are issued, all when-issued trades are settled. Subsequent transactions are made on a regular delivery or cash basis.
WarrantsA warrant is a security that gives its holder the right to buy shares in a company from the issuer at a set price for a set period of time. In this sense, warrants are similar to call options. The primary difference between the two is that warrants are issued by the company itself, whereas call options are issued – that is, written – by other investors.
Warrants are often issued as part of a package that also contains a new debt or preferred share issue. The warrants help make these issues more attractive to buyers by giving them the opportunity to participate in any appreciation of the issuer’s common shares. In other words, they function as a sweetener.
Once issued, warrants can be sold either immediately or after a certain holding period. The expiration date of warrants, which can extend to several years from the date of issue, is longer than that of a right.
VALUING WARRANTS
Like options, warrants may have both intrinsic value and time value. Intrinsic value is the amount by which the market price of the underlying common stock exceeds the exercise price of the warrant. A warrant has no intrinsic value if the market price of the common stock is less than the exercise price. Time value is the amount by which the market price of the warrant exceeds the intrinsic value.
If the market price of the underlying common stock is less than the exercise price of the warrant, the warrant has no intrinsic value. But this does not mean the warrant has no value; it may still

TEN • DERIVATIVES 10•37
© CSI GLOBAL EDUCATION INC. (2010)
have time value because of the potential for the stock price to increase before the warrants expire. All else being equal, the further away the expiration date, the greater the time value.
For example, even though a warrant to buy one common share at $40 has no intrinsic value when the price of the common stock is $30, it could still have a market value of several dollars. Even with no intrinsic value, the market will attach a time value to the warrant. With a large amount of time remaining to expiration, there will be more time for the underlying common stock to increase in price. The market will speculate on this possibility and attach a value to it: hence the term “time value.” As the expiration date approaches, there is less time for the common stock to increase in value, so the time value also falls. When it expires, an unexercised warrant is worthless.
Table 10.8 shows three hypothetical warrants with different characteristics. The warrants of Company A exhibit no intrinsic value but do have a time value. The warrants of Companies B and C have both an intrinsic value and time value.
TABLE 10.8 CALCULATION OF INTRINSIC VALUE AND TIME VALUE OF WARRANTS
MarketPrice of Shares
MarketPrice of
Warrants
ExercisePrice of
Warrants
IntrinsicValue
Col. (1) -Col. (3)
TimeValue
Col. (2) -Col. (4)
(1) (2) (3) (4) (5)
Company A $14.75 $0.50 $30.00 to Nil $0.50June 15/10
Company B $5.50 $3.00 $3.25 to $2.25 $0.75May 31/11
Company C $35.00 $18.00 $20.00 to $15.00 $3.00Sept. 30/12
WHY INVESTORS BUY WARRANTS
The main attraction of warrants is their leverage potential. The market price of a warrant is usually much lower than the price of the underlying security, and generally moves in the same direction at the same time as the price of the underlying. The capital appreciation of a warrant on a percentage basis can therefore greatly exceed that of the underlying security.
Example: A warrant has a market value of $4, exercisable at $12 on an underlying common stock that has a market price of $15. If the common stock rises to $23 a share before the warrants expire, the warrants would rise to at least their intrinsic value of $11, generating a 175% return from the original market value. The common stock buyer’s profi t would be $8 ($23 – $15), or 53%.
Of course, the reverse is also true. A decline in the price of the common stock from $23 to $15 would result in a 35% loss for the shareholder, whereas if the warrants fall from $11 to $4, the buyer will face a 64% loss.

CANADIAN SECURITIES COURSE • VOLUME 110•38
© CSI GLOBAL EDUCATION INC. (2010)
SUMMARY
After reading this chapter, you should be able to:
1. Describe what a derivative is and explain the differences between over-the-counter and exchange-traded derivatives.
• A derivative is a fi nancial contract that has a specifi c expiration date and includes rights and/or obligations for the buyer and the seller. The derivative includes a price or formula to determine the price of the asset being bought or sold in the future and whose value is derived from or dependent on the value of some other asset.
• Derivatives that trade over-the-counter (OTC) can be customized to fi t specifi c circumstances and are typically more complex than exchange-traded derivatives.
• OTC derivatives may not be liquid, are generally conducted privately without public disclosure, have default risk, are lightly regulated, often result in delivery of the underlying asset or a cash payment, and are generally used only by corporate or institutional investors.
• Exchange-traded derivatives are standardized contracts. They are liquid, traded publicly, have little or no default risk, are heavily regulated, rarely result in delivery of the underlying asset, and are used by a variety of investors.
2. Identify the types of underlying assets on which derivatives are based.
• Commodities that underlie derivative contracts include grains and oilseeds; livestock and meat; forest, fi bre, and food; precious and industrial metals; and energy products.
• Financials that underlie derivative contracts include equities and equity indexes, interest rates and interest-rate sensitive securities, and currencies.
3. Describe the participants in and uses of derivative trading.
• There are four main participants in derivatives: individual investors, institutional investors, businesses and corporations, and derivative dealers.
• Investors, businesses and corporations use derivatives to speculate on the price or value of an underlying asset (speculators) or to protect the value of an anticipated or existing position in an underlying asset (hedgers).
• Derivative dealers are the intermediaries in the markets, buying and selling to meet the demands of the end users.
SUMMARY
TEN • DERIVATIVES 10•39
© CSI GLOBAL EDUCATION INC. (2010)
4. Describe what options are and how they are traded, and evaluate call and put option strategies for individual and institutional investors and corporations.
• Options are contracts between a buyer and seller and can be exchange-traded or traded OTC.
• The buyer of an option has the right, but not the obligation, to buy or sell a specifi ed quantity of the underlying asset in the future at a price agreed on today. The seller of the option is obligated to complete the transaction if called on to do so.
• An option that gives its owner the right to buy the underlying asset is known as a call option; the right to sell the underlying asset is known as a put option.
• Option buyers must pay sellers a fee known as the option price or option premium. Once the premium has been paid, the option buyer has no further obligation to the writer, unless the buyer decides to exercise the option. The most that the buyer of an option can lose is the premium paid.
• American-style options can be exercised at any time up to and including the expiration dates; European-style options can be exercised only on the expiration dates.
• Exchange-traded options can be offset by entering an offsetting order on the exchange on which the option trades. OTC options can be offset or closed only by negotiation between buyer and seller.
• A call option is in-the-money when the price of the underlying asset is higher than the strike price.
• A put option is in-the-money when the price of the underlying asset is lower than the strike price.
• The amount that an option is trading above its intrinsic value is the option’s time value.
• An investor buys a call option to lock in a price for a future purchase or to speculate on a future rise in price.
• An investor writes or sells a call option to generate income. Naked call writers do not own the stock, which can be risky; covered call writers own the stock.
• An investor buys a put option to lock in a selling price for a current position or to speculate on a future decline in price.
• An investor writes or sells a put option to generate income. A covered put writer typically has a short position in the underlying asset or is secured by a cash position; most put writers are naked, which can be risky.

CANADIAN SECURITIES COURSE • VOLUME 110•40
© CSI GLOBAL EDUCATION INC. (2010)
5. Describe what forwards are, distinguish futures contracts from forward agreements, and evaluate futures strategies for investors and corporations.
• Forwards are contracts between a buyer and a seller in which both parties obligate themselves to trade the underlying asset in the future at a price agreed on at the time of contract creation.
• Futures contracts are standardized and regulated exchange-traded forward contracts that can be offset through the exchange prior to expiration.
• Daily gains and losses on futures contracts are marked-to-market (calculated and settled) daily.
• Investors buy futures either to profi t from an expected increase in the price of the underlying asset or to lock in a purchase price for the asset on some future date.
• Investors sell futures either to profi t from an expected decline in the price of the underlying asset or to lock in a sale price for the asset on some future date.
6 Defi ne and describe rights and warrants, explain why they are issued, and calculate the value of rights and warrants.
• A right is a privilege granted to a shareholder by an issuing company to acquire additional shares in direct proportion to the number of shares already owned. The shares are acquired directly from the issuing company up to a set expiration date at a price (known as the subscription or offering price) that is usually lower than the market price of the shares at the time of the rights issue.
• Corporations issue rights when market conditions are not conducive to an ordinary common share issue, a company wants to give existing shareholders the opportunity to acquire additional shares before anyone else, or a company wants to allow existing shareholders to maintain their proportionate interest in the company.
• Secondary markets may develop for rights. Rights begin to trade separately from the related stock on the ex-rights day.
• The intrinsic value of a right during the ex-rights period is calculated as:
Market price of the stock Subscription priceNumber of rights needed to buy one share
• The intrinsic value of a right during the cum-rights period is calculated as:
Market price of the stock Subscription priceNumber of rights needed to buy one share 1
• A warrant is a security, often issued as part of a package that also contains a new debt or preferred share issue, that gives its holder the right to buy shares in a company from the issuer at a set price until expiration.
• Warrants can be sold either immediately or after a certain holding period.

TEN • DERIVATIVES 10•41
© CSI GLOBAL EDUCATION INC. (2010)
• Intrinsic value of a warrant is the amount, if any, that the market price of the underlying common stock exceeds the exercise price of the warrant.
• Time value of a warrant is the amount that the market price of the warrant exceeds the intrinsic value.Now that you’ve
completed this chapter and the
on-line activities, complete this
post-test.


© CSI GLOBAL EDUCATION INC. (2010)
SECTION IV
The Corporation

© CSI GLOBAL EDUCATION INC. (2010) 11•1
Chapter 11
Financing and Listing Securities

© CSI GLOBAL EDUCATION INC. (2010)11•2
11
Financing and Listing Securities
CHAPTER OUTLINE
Types of Business Structures
Incorporated Businesses• Public and Private Corporations• The Structure of the Organization
Government Financings• Canadian Government Issues• Provincial and Municipal Issues
Corporate Financings• Equity Financing• Debt Financing and Other Alternatives
The Corporate Financing Process• The Dealer’s Advisory Relationship with Corporations• The Method of Offering• The Prospectus• Other Documents and Sale of the Issue• After-Market Stabilization
Other Methods of Distributing Securities to the Public• Junior Company Distributions• Options of Treasury Shares and Escrowed Shares• Capital Pool Company Program• NEX
© CSI GLOBAL EDUCATION INC. (2010) 11•3
The Listing Process• Advantages and Disadvantages of Listing• Listing Procedure for a Company• Withdrawing Trading Privileges
Summary
LEARNING OBJECTIVES
By the end of this chapter, you should be able to:
1. Compare and contrast the three types of business structures and explain the process, outcomes, advantages and disadvantages of incorporation.
2. Describe the processes by which governments raise debt capital to fi nance their funding requirements.
3. Describe the processes by which corporations raise debt or equity capital to fi nance their funding requirements.
4. Summarize the steps in the corporate fi nancing process, explain the different methods of offering securities to the public, summarize the prospectus system and evaluate after-market stabilization.
5. Identify other methods of distributing securities to the public through stock exchanges.
6. Discuss the advantages and disadvantages of listing shares for trading on an exchange and explain the circumstances and ways in which exchanges can withdraw trading privileges.
BRINGING SECURITIES TO MARKET
So far in this course we have learned a great deal about the different types of financial securities and the roles played by financial intermediaries and the various financial markets. What we have yet to talk about is the way in which a company has its securities listed on a stock exchange so that investors can trade them.
Stocks and bonds go through a very detailed process before they can be listed on a stock exchange. Not only are there regulatory requirements, but there is also significant financial expense. The process is established and rigorous and has been refined over the years so that investors are protected and the integrity of the capital markets is maintained.
© CSI GLOBAL EDUCATION INC. (2010)11•4
The media often discusses new and exciting initial public offerings (IPOs); however, before the new issue can get to that stage, the issuing company faces many challenges. Financial institutions have specific departments to handle securities offerings because the last thing a company wants to do is issue securities that investors are not interested in buying.
This chapter begins with a look at the different ways that companies are structured and then reviews the financing process.
KEY TERMS
After-market stabilization NEX
Authorized shares No par value
Banking Group Non-competitive tender
Blue sky Outstanding shares
Bought deal Over-allotment option
Broker of record Override
Capital Pool Company (CPC) Partnership
Capital stock Preliminary prospectus
Competitive tender Primary dealers
Continuous disclosure Primary offering
Corporation Private offering
Covenants Prospectus
Delayed opening Protective Provisions
Delisting Proxy
Direct bond Public fl oat
Due diligence report Red herring prospectus
Equity capital Reporting issuer
Escrowed shares Selling Group
Exchange offering prospectus Shareholder
In the on-line Learning Guide for this module,
complete the Getting Started
activity.

© CSI GLOBAL EDUCATION INC. (2010) 11•5
Final prospectus Short form prospectus
Financing Short position
Fiscal agency Sole proprietorship
General partnership Statement of material facts
Government securities distributor Suspension of trading
Green shoe option Syndicate
Greensheet Transparency
Grey market Tombstone advertisements
Halt in trading Treasury shares
Information circular Trust Deed
Initial Public Offering (IPO) Trust Deed Restrictions
Issued shares Trustee
Limited partnership Underwriting
Listing agreement Voting trust
Material fact Waiting period
Negotiated offering

CANADIAN SECURITIES COURSE • VOLUME 111•6
© CSI GLOBAL EDUCATION INC. (2010)
TYPES OF BUSINESS STRUCTURES
There are three forms of business organization: sole proprietorships, partnerships and corporations. A sole proprietorship involves one person running his or her own business, and the individual is taxed on earnings at their personal income tax rate. While the individual profits if the venture is successful, he or she is also personally liable for all debts, losses and obligations arising from the business activity beyond the assets held in the business. While the sole proprietorship is not regulated to the extent of other forms of business organization and the proprietor is free to make decisions, resources are limited for acquiring capital and expertise.
A second form of organization is the partnership, which involves two or more persons contributing to the business, whether it be capital or expertise required to run the enterprise. This form of business organization is legislated under the Partnership Act. There are two forms of partnership agreements: general partnership and limited partnership. While the general partners are involved in the day-to-day operations and are personally liable for all debts and obligations incurred in the course of business, a limited partner cannot participate in the daily business activity and liability is limited to the partner’s investment.
In both the sole proprietorship and the partnership, there is unlimited personal risk to the proprietor or general partners: these owners are personally liable to the creditors of the business for all the debts of the business.
Proprietorships and partnerships have limited ability to grow and expand. For example, while a partnership might have been able to operate a stagecoach to transport goods and people between local towns many years ago, it would not have been able to fund the construction of ships to cross oceans or the building of railways to cross continents. The need for capital helped lead to the development of the third type of business organization, the corporation.
A corporation is unique in that it is a distinct legal entity separate from the people who own its shares. Corporations pay taxes and can sue or be sued in a court of law. Property acquired by the corporation does not belong to the shareholders of the corporation, but to the corporation itself. The shareholders have no liability for the debts of the corporation and there can be no additional levy on shareholders if the debts of a bankrupt corporation exceed the value of its realizable assets. In addition, corporations are able to raise funds by issuing equity or debt, and are thus more suitable for large business ventures than proprietorships or partnerships.
INCORPORATED BUSINESSES
Although corporations form a small percentage of the total number of businesses, they attract a large proportion of the total capital invested. The basic procedure for incorporation is for one or more persons to file documents with the appropriate department of either the federal or a provincial government and pay the required fees. The government will issue a charter, the document under which the corporation comes into existence, in the form of letters patent, memorandum of association or articles of incorporation. The charter usually includes such information as the corporate name, date of incorporation, location of the registered office, any maximum authorized capital, the characteristics of the shares, the restrictions, if any, in the business the corporation may carry on, the transfer of shares, etc.
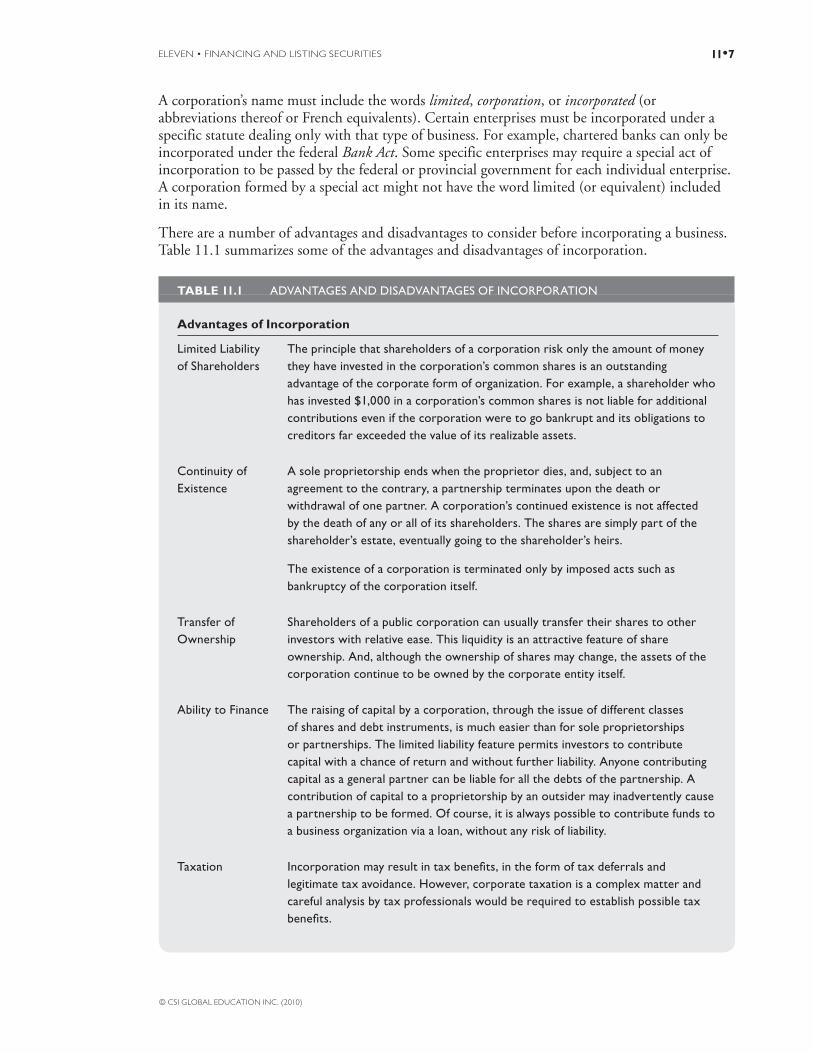
ELEVEN • FINANCING AND LISTING SECURITIES 11•7
© CSI GLOBAL EDUCATION INC. (2010)
A corporation’s name must include the words limited, corporation, or incorporated (or abbreviations thereof or French equivalents). Certain enterprises must be incorporated under a specific statute dealing only with that type of business. For example, chartered banks can only be incorporated under the federal Bank Act. Some specific enterprises may require a special act of incorporation to be passed by the federal or provincial government for each individual enterprise. A corporation formed by a special act might not have the word limited (or equivalent) included in its name.
There are a number of advantages and disadvantages to consider before incorporating a business. Table 11.1 summarizes some of the advantages and disadvantages of incorporation.
TABLE 11.1 ADVANTAGES AND DISADVANTAGES OF INCORPORATION
Advantages of Incorporation
Limited Liability of Shareholders
The principle that shareholders of a corporation risk only the amount of money they have invested in the corporation’s common shares is an outstanding advantage of the corporate form of organization. For example, a shareholder who has invested $1,000 in a corporation’s common shares is not liable for additional contributions even if the corporation were to go bankrupt and its obligations to creditors far exceeded the value of its realizable assets.
Continuity of Existence
A sole proprietorship ends when the proprietor dies, and, subject to an agreement to the contrary, a partnership terminates upon the death or withdrawal of one partner. A corporation’s continued existence is not affected by the death of any or all of its shareholders. The shares are simply part of the shareholder’s estate, eventually going to the shareholder’s heirs.
The existence of a corporation is terminated only by imposed acts such as bankruptcy of the corporation itself.
Transfer of Ownership
Shareholders of a public corporation can usually transfer their shares to other investors with relative ease. This liquidity is an attractive feature of share ownership. And, although the ownership of shares may change, the assets of the corporation continue to be owned by the corporate entity itself.
Ability to Finance The raising of capital by a corporation, through the issue of different classes of shares and debt instruments, is much easier than for sole proprietorships or partnerships. The limited liability feature permits investors to contribute capital with a chance of return and without further liability. Anyone contributing capital as a general partner can be liable for all the debts of the partnership. A contribution of capital to a proprietorship by an outsider may inadvertently cause a partnership to be formed. Of course, it is always possible to contribute funds to a business organization via a loan, without any risk of liability.
Taxation Incorporation may result in tax benefi ts, in the form of tax deferrals and legitimate tax avoidance. However, corporate taxation is a complex matter and careful analysis by tax professionals would be required to establish possible tax benefi ts.

CANADIAN SECURITIES COURSE • VOLUME 111•8
© CSI GLOBAL EDUCATION INC. (2010)
TABLE 11.1 ADVANTAGES AND DISADVANTAGES OF INCORPORATION – Cont’d
Advantages of Incorporation
Growth The corporate form is well suited to handle easily the large amounts of capital needed to operate large and growing businesses.
Legal Entity A corporation or a partnership can sue or be sued. A shareholder of a corporation can sue the corporation or the corporation can sue the shareholder. However, a partnership cannot sue a partner, nor can a partner sue the partnership.
Professional Management
Although the shareholders are the ultimate owners of the corporation, they play a very small part in the management of the corporation. They elect, through their voting rights, a board of directors who manage the affairs of the corporation. If the directors do not manage the corporation to their satisfaction, the shareholders may elect different directors.
Disadvantages of Incorporation
Loss of Flexibility A corporation is subject to many rules imposed by various statutes, and the trend is towards an increase in the degree of regulation. Partnerships and sole proprietorships operate almost free of any special statutory regulation. For a corporation to arrange for its earnings to be transferred to its shareholders, formal dividends must be declared and paid. Changes in the charter and by-laws of the corporation can be complicated and sometimes require formal approval of the government of the incorporating jurisdiction as well as of the directors and shareholders. In a partnership, major changes can usually be accomplished with comparative ease.
Taxation The possibility of double taxation arises when the after-tax profi ts of a corporation are distributed in the form of dividends to shareholders, who themselves pay tax on their dividend income. There is no possibility of double taxation in the cases of partnerships or sole proprietorships.
Expense After the initial cost of incorporation, there are annual costs additional to those incurred in proprietorships or partnerships. Annual returns, audits, preparation of federal and provincial corporate tax returns, the holding of shareholders’ meetings and, for many corporations, the requirements of securities laws can result in substantial additional administrative costs.
Capital Withdrawal For partnerships and proprietorships, the withdrawal of unneeded capital from the business is simple. For a corporation, the statutory procedures for the redemption of shares and purchase of shares by the corporation, when permitted by the applicable statute, must be very carefully followed. Practically, a small investor in a public corporation can withdraw his or her capital only by selling the shares.

ELEVEN • FINANCING AND LISTING SECURITIES 11•9
© CSI GLOBAL EDUCATION INC. (2010)
Once a decision has been made to incorporate, the jurisdiction of incorporation must be selected. In most cases the choice will be whether to incorporate under the laws of the province where the corporation’s chief place of business will be located or to incorporate federally under the Canada Business Corporations Act (CBCA).
One factor in this decision is how the differences in the laws governing a provincial and a federal corporation will affect the affairs of the particular business. Depending upon the province, some of these differences may be the method of incorporation, provincial tax rates, corporate names available, requirement of directors to be Canadian residents, minimum age of the applicants, necessity of holding formal meetings, number of directors and filing of financial statements.
A provincially incorporated corporation can carry on business in the province of incorporation, but may need a further licence or registration to carry on business in other provinces.
A federally incorporated corporation is subject to the laws of general application in a province and may have to register there, but no provincial law may discriminate against a federal corporation so as to deprive it of the powers conferred on it by the federal government.
Public and Private CorporationsHistorically, corporations have been divided into two types:
• Private corporations, which have in their charters a restriction on the right of shareholders to transfer shares, a limitation on the number of shareholders to not more than 50, and a prohibition on inviting members of the public to subscribe for their securities
• Public corporations, which are incorporated without such restrictions
The CBCA and many provincial acts no longer make this distinction. However, the distinction is still relevant for the purposes of the securities statutes, which provide exemptions for private corporations. All corporations whose shares are listed on a stock exchange or traded over the counter are public corporations.
THE BY-LAWS
A corporation is regulated by:
• The federal or provincial act under which its charter is issued
• Its own charter
• Its by-laws
A general by-law is prepared at the time of incorporation and contains rules that govern the conduct of the corporation. By-laws are passed by the directors and approved by the shareholders. Provisions in the by-laws usually deal with items such as:
• Shareholders’ meetings – the time, place and method of notifying shareholders, the date as of which the list of shareholders eligible to vote shall be made up, the number constituting a quorum, and the procedures for proxy votes
• Directors’ meetings – the time, place and method of notifying directors and the number of quorum
CANADIAN SECURITIES COURSE • VOLUME 111•10
© CSI GLOBAL EDUCATION INC. (2010)
• Qualifi cation, election and removal of directors
• Appointment, duties and remuneration of offi cers
• Declaration and payment of dividends
• Date of fi scal year end
• Signing authority for documents
VOTING AND CONTROL
Through the right to vote at the annual meeting and at special or general meetings, shareholders exercise their rights as owners to control the destiny of the corporation. They elect the directors who guide and control the business operations of the corporation through its officers. Many matters of an unusual, non-recurring nature, such as the sale, merger or liquidation of the business and the amendment of the charter, must receive shareholder approval before action is taken. To vote, an individual must have shares registered in his or her own name or be in possession of a completed proxy form.
Usually each common shareholder has one vote for each share owned. If there were nine directors being elected, each shareholder may cast a ballot for each of the nine persons to be elected, with a vote equal to the number of shares the shareholder owns. Under this system, one or more shareholders controlling more than half of the total number of voting shares can determine every question and elect all the directors. The result is control by those holding a majority of the voting shares and not necessarily by the majority in number of shareholders. If the voting shares are widely held (i.e., held by many shareholders), a corporation may be controlled by a shareholder or a group of shareholders owning substantially less than 50% of the voting shares.
A corporation’s charter may provide that different classes of shares may vote separately for a certain number of directors. Some classes of shares have no voting rights. Other classes of shares have multiple voting rights. The use of non-voting and multiple voting shares by control groups to retain control has increased steadily over the last 20 years.
SHAREHOLDERS’ MEETINGS
All shareholders must be given the opportunity to receive materials relating to meetings of shareholders, including proxies and audited (or unaudited) annual financial statements, and to attend and to vote at the meetings. Shares may not be voted by intermediaries (including investment dealers) unless instructions have been given by the shareholder to do so.
Shareholders ordinarily take action as a group only at corporate meetings after proper notice has been given and in accordance with the by-laws. In the case of a regular meeting, the list of eligible shareholders is prepared as of a certain date prior to the meeting and shareholders are notified of the meeting within a specified time period. At the annual meeting, they elect the directors, appoint independent auditors (or accountants), receive the financial statements and the auditor’s (or accountant’s) report for the preceding year and consider other matters regarding the company’s affairs. Special meetings may be called for any matter that requires attention prior to the next annual meeting.

ELEVEN • FINANCING AND LISTING SECURITIES 11•11
© CSI GLOBAL EDUCATION INC. (2010)
VOTING BY PROXY
A proxy is a power of attorney given by a shareholder that gives a designated person the authority to vote the shareholder’s stock at a shareholders’ meeting. Under the federal act and many provincial acts, the proxy holder need not be a shareholder of the company. A proxy is given for one meeting and all adjournments thereof. A wider power of attorney may give authority to vote at all meetings for a stated period. Proxies are always revocable.
Sending proxies to company shareholders is compulsory. A proxy form and an information circular must accompany the notice of a shareholders’ meeting which is sent to all shareholders. The information circular sent with the notice of the annual meeting must contain details about proposed directors, directors’ and officers’ remuneration, interest of directors and officers in material transactions, the appointment of auditors and particulars of other matters to be acted upon at the meeting.
At the annual shareholders’ meeting of a public corporation, enough shareholders have usually signed proxy forms appointing the management nominees as their proxy that the management is able to carry any resolution it wishes. Most resolutions are passed as a matter of course with or without significant prior discussion. Even in these circumstances, where individual shareholders have no real chance to defeat a management proposal, the meeting can be a valuable opportunity for shareholders to question management and to make their views known.
In many public corporations, the management group itself does not own a large percentage of the issued shares and may be dependent upon the support of the shareholders at large. In such circumstances, there is always the possibility of a contest for control of the corporation, with both the management group and the challengers actively seeking proxy support from the shareholders at large before the meeting. Although such “proxy fights” are rare, they can lead to the removal of the existing management if enough shareholders lend support to the challengers.
VOTING TRUSTS
A corporation that is undergoing a restructuring due to financial difficulties may be placed under the control of a few individuals through a voting trust. The voting trust is usually put into effect for specific periods of time, or until certain results have been achieved. It is used because financiers may be willing to inject new capital only if they can be assured of control to protect their investment until there is a recovery in the fortunes of the corporation.
To transfer voting control, shareholders are asked to deposit their shares with a trustee, usually a trust company, under the terms of a voting trust agreement. The trustee issues a voting trust certificate, which returns to the shareholder the same rights possessed by the original shares, with the exception of the voting privileges which remain with the trustee.

CANADIAN SECURITIES COURSE • VOLUME 111•12
© CSI GLOBAL EDUCATION INC. (2010)
The Structure of the OrganizationOrganizational Chart 11.1 illustrates the way corporations are structured.
CHART 11.1 SIMPLIFIED ORGANIZATION CHART OF A HYPOTHETICAL CORPORATION
* Many Boards of Directors elect Executive Committees, Finance Committees and Audit Committees.
Table 11.2 lists the main responsibilities of the highest members of a corporation’s structure.
TABLE 11.2
Directors • Must be of the age of majority, of sound mind and not an undischarged bankrupt
• Set company policies by passing resolutions
• Supervise the work of the offi cers
• They are normally responsible for the appointment and supervision of offi cers and signing authorities for banking, the authorization of important contracts; the approval of budgets, fi nancing and plans for expansion; the decision to issue shares ; and the declaration of dividends and other dispositions of profi ts
• They are personally liable for illegal acts of the corporation done with their knowledge and consent
• They are personally responsible for employees wages, declared dividends and government remittances
• They must act honestly, in good faith and in the best interests of the corporation. Many corporations’ statutes require that directors must also exercise the care, diligence and skill that a reasonably prudent person would exercise in comparable circumstances
• Subject to regulatory sanctions, criminal prosecution under securities legislation, or prosecution under the criminal law

ELEVEN • FINANCING AND LISTING SECURITIES 11•13
© CSI GLOBAL EDUCATION INC. (2010)
TABLE 11.2 – Cont’d
Offi cers • Appointed by the company directors
• They are corporate employees responsible for the day-to-day operation of the business
Chairman of the Board
• Elected by the board of directors
• May have all or any of the duties of the president or any other offi cer of the corporation
• May be the chief executive offi cer
• Presides over meetings of the board and generally exerts great infl uence on the management of the affairs of the corporation
• May be combined with the job of president
President • Appointed by and responsible to the board of directors
• Exercises authority through the other offi cers and through the heads of departments or divisions
• If the job of president is not combined with that of the chairman, the president may act as chairman in the latter’s absence
Executive Vice-President
• The “second in command”
• Is often an executive vice-president who may be the chief operating offi cer
Vice-Presidents
• Vice-presidents are appointed to head specifi c areas of the corporation’s operations such as sales or fi nance
• Some corporations appoint both senior vice-presidents and vice-presidents.
• The number of vice-presidents varies widely according to each corporation’s size and requirements.
GOVERNMENT FINANCINGS
Financing, or underwriting as it is sometimes called, is the process by which an issuer (government or company) raises debt or equity capital either publicly or privately. For governments, this financing is often accomplished through an auction process and occasionally through a fiscal agency. For companies, financing takes the form of a private offering, an initial public offering or IPO, or a secondary offering. Public financings are undertaken by public companies that trade on the exchanges and the over-the-counter markets. Private financings are discussed only briefly in this chapter.
The finance department of an investment dealer helps corporations and governments achieve their funding targets. This provides new investment opportunities for investors. There are usually two distinct groups in the finance department of an investment dealer: Government Finance and Corporate Finance.
CANADIAN SECURITIES COURSE • VOLUME 111•14
© CSI GLOBAL EDUCATION INC. (2010)
The government finance department specializes in selling debt instruments to institutions and other interested parties, and advises both clients and the issuing governments on debt issues. The persons charged with the responsibility of government finance need to be in touch with the market at all times to ensure awareness of market conditions and prices. Their advice to issuing governments includes:
• The size (or dollar value), coupon (interest rate offered) and currency of denomination of the issue
• The timing of the issue
• Whether the issue should be domestic or foreign
• What effect the issue may have on the market
• Whether the issue should be a new maturity, or whether a previous issue should be re-opened
Governments issue debt securities because:
• Revenues sometimes cannot support the current level of spending
• Funding is required for infrastructure projects (e.g., roads and bridges)
• Funding is required for services (e.g., operating expenses for schools and hospitals)
Government finance departments act as intermediaries between investors and the issuers of debt securities (i.e., the various levels of government), trying to negotiate deals that satisfy both parties.
Canadian Government IssuesThe Canadian Government brings new issues of fixed-coupon marketable bonds and treasury bills to market on a regularly scheduled basis by using the competitive tender system. The securities are issued by way of an auction, whereby the amount won at the auction is based on the bids submitted. Only those institutions recognized as government securities distributors are permitted to submit bids to the Bank of Canada. These institutions include the Schedule I and Schedule II banks, investment dealers, and foreign dealers active in the distribution of government securities. Government securities distributors that maintain a certain threshold of activity are known as primary dealers.
Bids can also be submitted on a non-competitive tender basis, whereby the bid is accepted in full by the Bank of Canada and bonds are awarded at the auction average.
The process generally works as described below.
• Bids are submitted to the Bank of Canada, usually electronically, by 12:30 p.m. on the date of the auction.
• Competitive tenders may consist of up to seven bids stated in multiples of $1,000 and subject to a minimum size per individual bid of $100,000. Bids do not state a price for the bond, but instead, the yield on the bond that each bidder hopes to earn.
• Primary dealers have bidding limits on the auctioned amount that cannot exceed 40% of the total amount of the bonds being offered. Bidders may not act in collusion with another bidder to acquire more bonds than the auction limit.

ELEVEN • FINANCING AND LISTING SECURITIES 11•15
© CSI GLOBAL EDUCATION INC. (2010)
• Each government securities distributor may also submit one non-competitive tender, in addition to any competitive bids. The ceiling on non-competitive bids for each participant is $3 million. Non-competitive tenders are allotted by the Bank of Canada at the average price of the accepted competitive tenders. A non-competitive tender is in multiples of $1,000, subject to a minimum of $1,000.
The submitted bids are accepted in rising order of yield until the full amount of the auction has been allocated. The total amount of the bids, as well as the high, low and average bid, are published. The day of the tender, the Bank of Canada sends out complete information on the results of the tender. Based on this information, each participant can determine the number and cost of the bonds and/or bills specifically awarded.
Consider an auction of $2.5 billion Government of Canada ten-year bonds, for which ten government securities distributors submit bids in the following manner:
Bidder Competitive Bid Yield* Size
1 5.041% $500 million
2 5.043% $500 million
3 5.043% $500 million
4 5.044% $500 million
5 5.047% $500 million
6 5.048% $500 million
7 5.048% $500 million
8 5.049% $500 million
9 5.049% $500 million
10 5.053% $500 million
Non-Competitive Tenders – $25 million
*Bond yields are discussed in detail in Chapter 7.
In this situation, bonds would be allocated to the first five competitive bidders only. The first four bidders would each receive $500 million of bonds which represents their total bid amounts. The fifth bidder would receive $475 million of bonds which is equal to its bid amount of $500 million minus the $25 million amount of non-competitive bids. Each of the five successful competitive bidders pays a price based on its competitive bid yield. The non-competitive bidders would receive $25 million of bonds, paying a price based on the average yield of the bonds awarded (i.e., based on the average yield of the five accepted bids, or 5.0436%).
Generally, the total bids received from government securities distributors, excluding the Bank of Canada, are for a greater amount of bonds than the amount being offered, so all bids will not be successful.
To maintain regularity and openness, or clarity (called transparency), in its debt operations, the Canadian Government now holds regularly scheduled quarterly auctions of benchmark

CANADIAN SECURITIES COURSE • VOLUME 111•16
© CSI GLOBAL EDUCATION INC. (2010)
two-, five- and ten-year bonds, and semi-annual auctions for the benchmark 30-year bond. Denominations available are $1,000, $5,000, $100,000 and $1 million.
Provincial and Municipal IssuesAlthough government bonds are guaranteed and backed by the tax-generating powers of the government in question, the size of a government issue is important. There must be enough bonds outstanding (i.e., market depth) to ensure sufficient marketability in the secondary markets to facilitate large bond trades. New issues of provincial direct bonds and guaranteed bonds offered in Canada are usually sold at a negotiated price through a fiscal agent. Under this method, a provincial government appoints a group (syndicate) of investment dealers and banks to underwrite issues as well as advise and manage the process of issuing securities. The syndicate usually includes many major dealers, whose combined financial responsibility and distribution powers are more than adequate to underwrite and sell the large issues required by these parties.
The terms direct and guaranteed refer to the structure of the debt issued by the government. A direct obligation is one that is issued in the government’s name, e.g., Province of Manitoba bonds. A guaranteed debt is an obligation that is issued in the name of a crown corporation, but is guaranteed by the provincial government as to payment. An example of a guaranteed obligation would be a bond issued by Ontario Electric Financial Corporation but guaranteed by the Province of Ontario.
Each fiscal agency agreement lasts at least a year and sets out the participation, the underwriting fee, the types of issues covered and other pertinent matters. There are some exceptions for short term issue (e.g., private placements arranged by one or two dealers or banks). It is the responsibility of the syndicate manager or lead underwriter of the fiscal agency to provide continuous advice to the province on market conditions, the characteristics of issues most acceptable to investors (innovations are important), the timing of offerings (avoiding simultaneous offerings of other borrowers) and pricing of issues.
Municipal bond and debenture issues are more likely to be placed in institutional portfolios and pension accounts. Municipal bonds and debentures require in-depth knowledge of the tax-generating potential of the local municipal area as well as the industrial base and other demographic information.
Federal, provincial and municipal pension plans are important purchasers of municipal debt issues. Also, the Federal Government often loans municipalities money directly for specific projects.
CORPORATE FINANCINGS
Corporations seek new financing for a variety of reasons, including the need to:
• Increase working capital
• Repay debts
• Purchase fi xed assets, other companies, or repurchase the fi rm’s own shares
ELEVEN • FINANCING AND LISTING SECURITIES 11•17
© CSI GLOBAL EDUCATION INC. (2010)
Very few companies generate enough cash internally to satisfy all their cash needs. Companies often need to borrow to fund activities such as additional research, expansion and growth. Even a profitable company must seek external funds to expand and compete in an increasingly competitive global marketplace. This new funding is provided by the market, if the company can prove that its plans are viable, and that such an investment sufficiently compensates the investor for the risk borne from making the investment.
Financing is a careful balancing act in which the dealer must balance the needs of the corporate client that requires funding with the requirements of the investing public who provide the money necessary for corporate purposes. The dealer must also balance current market conditions in both the debt and equity markets with the limitations of the company’s balance sheet and future prospects. This requires skill in market timing, technical knowledge with regard to legal and financial matters, and a thorough understanding of financial analysis and promotion. Some of the decisions involved with a new issue include:
• What types of securities are to be issued
• Whether the issue should be a private or public offering
• What the issue price will be
• What the coupon rate or valuation multiple (such as the price-earnings ratio) will be
• What the underwriting fee charged to the corporation will be
• When the issue will come to market
• What proportion of the issue will be bought by institutional and by retail investors
Canadian financings sometimes occur by competitive tender. This is an auction by a number of dealers to buy an issuer’s new securities. A negotiated offering is more commonplace for corporate issues. Under a negotiated offering, a firm’s management negotiates with a dealer on the type of security, price, interest or valuation multiple, special features and protective provisions needed to market a new issue successfully.
Equity FinancingThe money to start a corporation is often raised by issuing common shares for cash to persons who thus become the initial shareholders of the corporation. The common shares usually carry the right to vote at shareholders’ meetings.
In many cases, charters also authorize another class of shares, sometimes called preferred or special shares, which may be non-voting but have a special status compared to the common shares in terms of dividends, distribution of assets in liquidation, etc. In larger corporations, there may be several classes of preferred shares with different features.
Both common shares and preferred shares form the company’s capital stock or equity capital.
SHARE CAPITAL
Authorized shares refer to the maximum number of common (or preferred) shares that the corporation may issue under the terms of its charter. Usually more shares are authorized than issued to shareholders so that the corporation may raise additional funds in the future by issuing more shares. A corporation may amend its charter to increase or decrease the number of authorized shares. In recent years, corporations’ acts have made it possible to provide for an unlimited number of shares which may be issued for an unlimited amount of money.

CANADIAN SECURITIES COURSE • VOLUME 111•18
© CSI GLOBAL EDUCATION INC. (2010)
Example: The charter of ABC Inc. indicates that it has 1,000,000 commons shares authorized. The company’s balance sheet would show the following:
Common Shares – Authorized 1,000,000 shares of no par value
Issued shares refer to that part of the authorized shares that have been issued by the corporation. A corporation is not required to issue all of its authorized shares. In a related way, outstanding shares refer to that part of the issued shares which remain outstanding and owned by the shareholders of the company. Issued and outstanding shares are often used interchangeably.
The capital stock section of the balance sheet shows the number of shares a company currently has issued and outstanding. From time to time, a corporation may redeem or purchase some or all of various classes of its issued shares, which in normal circumstances would then reduce the number of shares outstanding. If no redemptions or repurchases of shares are made by the corporation, the total number of shares issued will be the same as the total number outstanding.
Example: ABC Inc. has 850,000 common shares issued and outstanding. The company’s balance sheet would show the following:
Common Shares – Authorized 1,000,000 shares of no par value – Issued and outstanding 850,000 shares
The total of a company’s outstanding shares is used to determine its market capitalization, which is the total dollar value of the company based on the current market price of its issued and outstanding shares. For ABC Inc., if the shares are currently trading at a price of $10 a share, its market capitalization is $8,500,000.
Public float refers to that part of the issued shares that are outstanding and available for trading by the public and not held by company officers, directors or institutions that hold a controlling interest in the company. Public float is different from outstanding shares as it excludes those shares owned in large blocks by institutions (e.g., mutual funds or pension funds). Investors should be interested in the size of a company’s public float. The smaller the float, the more volatile the price of the stock will be because large buy or sell orders on the stock can influence its price dramatically. A larger float means that the stock’s price would be less volatile.
Example: ABC Inc. has 200,000 common shares held by the company’s officers and directors and by large institutions. Its public float is then 650,000 shares (850,000 issued and outstanding shares less the 200,000 non-public shares).
PAR VALUE
Some corporations acts provide that shares of a corporation may be designated in the corporation’s charter as either par value or no par value. However, under the federal and some provincial corporations acts, shares must be without par value.
The par value of a share is its stated face value, most commonly expressed in terms of so many dollars such as $5, $10, $25, $50 or $100 per share. Conversely, no par value (n.p.v.) shares have no such stated face value.
The use of par value shares can be misleading because there is no fixed amount of assets to which the shares are entitled. There is also no fixed relationship between the par value of a share and its current market value. Novice investors can be confused when a stock with a par value of, say, $50 is selling at $40 or $60 in the marketplace. Therefore, shares are most often issued without par

ELEVEN • FINANCING AND LISTING SECURITIES 11•19
© CSI GLOBAL EDUCATION INC. (2010)
value, although the shares still have a stated value assigned by the company’s board of directors for accounting purposes. In some jurisdictions, shares with a par value (excluding shares of mining corporations) cannot be issued at a discount from their par value. Thus, a corporation which has issued part of its authorized capital, and wishes to sell some of its remaining authorized but unissued shares to raise funds, will find this difficult if the shares are selling in the market at less than the par value. There is no such set price at which no par value shares must be sold. A corporation simply issues them at a price which is attractive to investors, and will assist in their distribution to the public.
Debt Financing and Other AlternativesA corporation with a large need for new capital may also undertake debt financing. Unlike equity financing, funds raised by issuing debt securities really represent a loan from investors and must be repaid. The two main types of securities used in long-term debt financing are mortgage bonds and debentures. Other financing methods include bank loans, medium-term notes, callable bonds and convertible bonds. Mortgage bonds are backed by a specific pledge of assets such as land or properties, similar to the way that a mortgage loan on a house is secured by the house itself to protect the lender. Debentures are backed only by the general credit of the corporation. The corporation’s ability to repay its obligations is considered sufficient without a specific pledge of its assets.
In practice, a corporation also has many other financing alternatives including bank loans, money market borrowing, commercial paper, bankers’ acceptances, leasing, government grants and export financing assistance.
THE CORPORATE FINANCING PROCESS
When deciding on who will be the corporation’s inaugural lead dealer or its new lead dealer, a corporate issuer considers the dealer’s reputation for providing various services. These include advisory services on timing, amount and pricing of an issue, issue distribution, after-issue market support, and after-issue market informational support. Corporate issuers attempt to engage a lead dealer with a better reputation, since this usually results in both better market acceptance of the issue and a cheaper financing for the issuing corporation. Frequently used measures of a dealer’s reputation are the number and the dollar value of new issues for which the dealer was the lead.
The dealer’s corporate finance team regularly advises corporations and governments of market conditions and factors affecting their outstanding or proposed securities. They provide advice on re-organization of companies, privatization of government companies (i.e., sale to the private sector), taking companies public, buying public shares back, as well as mergers and takeovers.
When negotiations for a new issue of securities begin between the dealer and corporate issuer, the dealer normally prepares a thorough study of the corporation and the industry within which the corporation operates. This includes the position of the corporation within that industry, the financial record and financial structure of the corporation, its future prospects, and all risk factors associated with the industry and company. This report is sometimes referred to as the due diligence report. If the dealer has an established advisory position with the corporation – for which the dealer would receive a fee – most of this information is already possessed by the dealer. If the dealer has had no previous connection with the corporation, as is often the case for

CANADIAN SECURITIES COURSE • VOLUME 111•20
© CSI GLOBAL EDUCATION INC. (2010)
an IPO, the investigation begins from the ground up. Often the assistance of outside consultants or experts in the appropriate field, such as engineering, geology, management or chartered accountancy, is required. After the study is conducted, the dealer decides whether it wants to continue to negotiate to be the lead in the proposed offering.
The Dealer’s Advisory Relationship with CorporationsWhether the dealer subsequently acts as principal or agent, the issuing corporation relies on the dealer’s advice and guidance in security design, including establishing the amount of the issue, its attributes and the final issue price. Corporations that frequently raise capital develop a close advisory relationship with the lead dealer, similar to the professional relationship between a lawyer and client. The dealer often is represented on the corporation’s board of directors, especially for smaller companies.
From the corporation’s point of view, continuous access to professional financial advice is valuable, as is the continuing interest of the dealer in the secondary market of the corporation’s securities. Once the relationship is solidified, the dealer may become the broker of record and may have the right of first refusal on new financings planned by the corporation.
ADVICE ON THE SECURITY TO BE ISSUED
The lead dealer’s corporate finance team plays an important role in designing the new issue and advising the corporation on the best approach in the market. The corporation wants to ensure both that the new securities are consistent with its capitalization (i.e., the way the firm is financed with debt and equity) and that the restrictive covenants or provisions included in these new securities do not limit the corporation’s future decision-making flexibility. Based on the dealer’s assessment of current market conditions, investor preferences, the impact of various financing options on the corporation’s existing capitalization, future earnings stability and prospects, the dealer recommends an appropriate financing vehicle.
When considering the merits of recommending a debt issue instead of an equity issue, the dealer considers the advantages and disadvantages of each type of financing.
Factors to consider when choosing between a debt and an equity issue include:
• Debt may be the lowest after-tax cost source of fi nancing since interest charges payable on money borrowed to purchase income-producing assets are tax deductible.
• Debt issues do not dilute equity ownership.
• Debt increases the rate of return earned by the owners of the corporation if the rate of return earned on the use of the borrowed money exceeds the cost of the borrowed money.
• Assets are not burdened nor is management restricted with the issuance of equity.
• An equity issue improves a company’s credit rating by providing a greater cushion against insolvency and by enhancing the stability of a corporation’s operating income stream.
Once the decision to issue debt and/or equity is made, the corporation, in conjunction with the dealer, decides on the exact security to be issued. Table 11.3 summarizes some of the advantages and disadvantages in issuing different debt and equity securities.
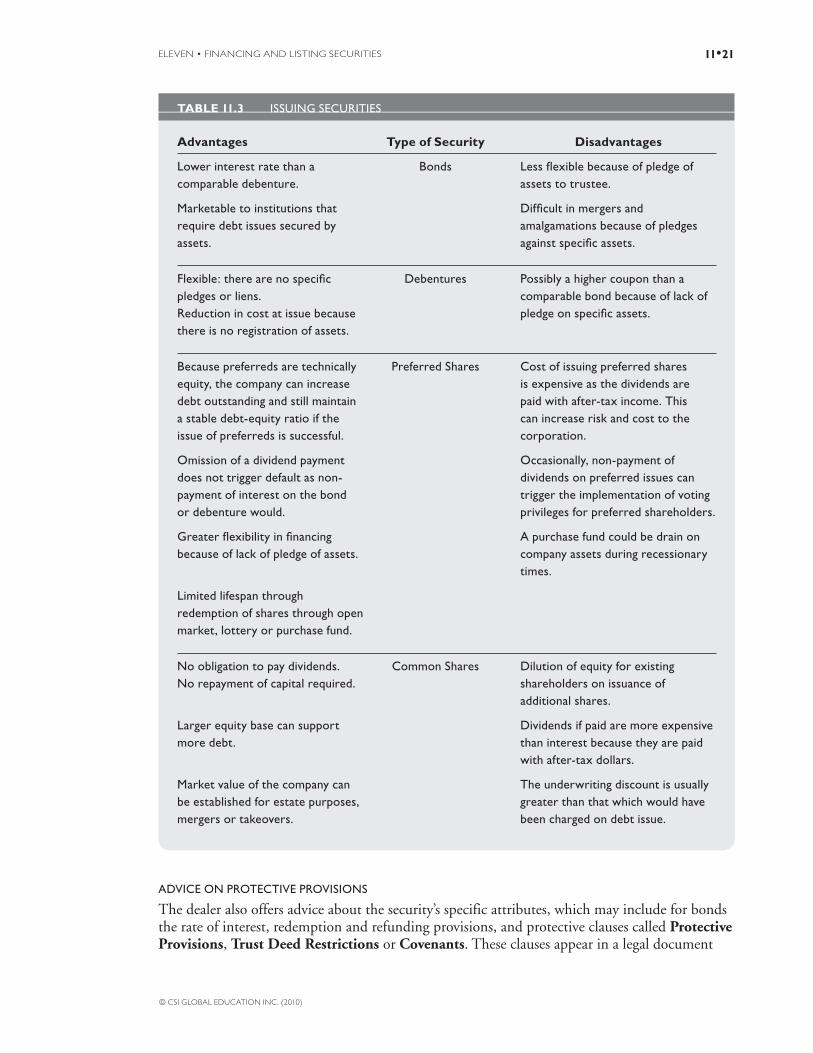
ELEVEN • FINANCING AND LISTING SECURITIES 11•21
© CSI GLOBAL EDUCATION INC. (2010)
TABLE 11.3 ISSUING SECURITIES
Advantages Type of Security Disadvantages
Lower interest rate than a comparable debenture.
Bonds Less fl exible because of pledge of assets to trustee.
Marketable to institutions that require debt issues secured by assets.
Diffi cult in mergers and amalgamations because of pledges against specifi c assets.
Flexible: there are no specifi c pledges or liens.Reduction in cost at issue because there is no registration of assets.
Debentures Possibly a higher coupon than a comparable bond because of lack of pledge on specifi c assets.
Because preferreds are technically equity, the company can increase debt outstanding and still maintain a stable debt-equity ratio if the issue of preferreds is successful.
Preferred Shares Cost of issuing preferred shares is expensive as the dividends are paid with after-tax income. This can increase risk and cost to the corporation.
Omission of a dividend payment does not trigger default as non-payment of interest on the bond or debenture would.
Occasionally, non-payment of dividends on preferred issues can trigger the implementation of voting privileges for preferred shareholders.
Greater fl exibility in fi nancing because of lack of pledge of assets.
A purchase fund could be drain on company assets during recessionary times.
Limited lifespan through redemption of shares through open market, lottery or purchase fund.
No obligation to pay dividends.No repayment of capital required.
Common Shares Dilution of equity for existing shareholders on issuance of additional shares.
Larger equity base can support more debt.
Dividends if paid are more expensive than interest because they are paid with after-tax dollars.
Market value of the company can be established for estate purposes, mergers or takeovers.
The underwriting discount is usually greater than that which would have been charged on debt issue.
ADVICE ON PROTECTIVE PROVISIONS
The dealer also offers advice about the security’s specific attributes, which may include for bonds the rate of interest, redemption and refunding provisions, and protective clauses called Protective Provisions, Trust Deed Restrictions or Covenants. These clauses appear in a legal document

CANADIAN SECURITIES COURSE • VOLUME 111•22
© CSI GLOBAL EDUCATION INC. (2010)
called a Trust Deed. They are called a Deed of Trust and Mortgage in the case of a mortgage bond secured by assets, or a Trust Indenture in the case of a corporate debenture. These clauses are essentially safeguards placed in the issue’s contract with the purchaser to guard against any further weakening in the position of the security holder if the issuer’s financial position weakens. Protective provisions may make an issue more appealing to an investor. A company in weak financial condition may need to include more, or more stringent, restrictive protective provisions in order to float a new issue than a company with greater financial strength.
The Method of OfferingThe dealer helps decide how the issue is to be distributed or sold, either as a private placement or as a public offering.
THE PRIVATE PLACEMENT
In a private placement, one or a few large institutional investors, such as banks, mutual fund companies, insurance companies and pension funds, are solicited and the entire issue is sold to one or more of them. Given that private placements are generally offered to sophisticated investors and institutional clients, the requirements for detailed disclosure and public notice are typically waived, thus no formal prospectus need be prepared. This dramatically reduces the cost of distribution for the issuing company. In many cases, private placements are announced after they have occurred, usually via advertisements in the financial press.
PUBLIC OFFERINGS
Where the decision is to offer securities to the public in Canada, the corporation and the dealer come to a preliminary agreement only on whether the dealer is to act as agent or is to underwrite the securities as a principal. Agreement on the dealer’s commission (when acting as agent) or on the spread between the possible offering price and the dealer’s cost price (when acting as principal) is arranged at an early stage in the negotiations. The final offering price and certain other details are usually finalized just before the public offering date. The pricing of the issue and the actual volume of securities issued are dependent upon the market environment at the issue date.
Prior to issue, steps are taken to comply with the provisions of the provincial securities acts that regulate the manner in which securities may be sold. Whenever a new issue of securities is offered to the public in the province, a prospectus must be prepared in accordance with the requirements of the particular provincial act, and must be accepted for filing by the provincial securities commission. The prospectus must be approved separately in each Canadian province and territory where the offering will be sold.
A primary offering of securities refers to a new issue of securities by an issuer and generally takes place in the IPO market. The IPO requires a great deal of finesse by the underwriter, especially in terms of the pricing and marketing of the issue. The company seeking financing is relying on the expertise and advice of the investment dealer in providing funding. How the issue is handled can affect the financial well-being of the company for years to come.
A secondary offering refers to the public sale of a company’s previously issued securities made after its IPO. As with an IPO, a secondary offering (or distribution) is usually handled by an investment dealer or syndicate. The dealer purchases the shares from the company at an
ELEVEN • FINANCING AND LISTING SECURITIES 11•23
© CSI GLOBAL EDUCATION INC. (2010)
agreed-upon price and then resells them at a higher price to institutions and the public, making a profit on the spread.
In a related tactic, a company may find it advantageous to repurchase some of its outstanding shares currently trading in the market. These repurchased shares are called treasury shares. Treasury shares do not have voting rights or dividend entitlements; however, the company does have the option of reselling them back to the market at a later date through a secondary offering (or treasury offering). Accordingly, a secondary common share offering increases the number of shares outstanding.
The ProspectusA prospectus provides a detailed description of the securities offered and of the issuing corporation, including its history, operations, management, risk and audited financial statements. The basic principle governing prospectus requirements is “full, true and plain disclosure of all material facts relating to the securities offered.” A material fact is any information that significantly affects, or would reasonably be expected to have a significant effect on, the market price of the securities being offered. In no way does the prospectus imply that any government body has approved the issue as being a suitable or attractive investment. The prospectus is designed to enable prospective investors to make intelligent investment decisions.
The acts of most provinces require that a prospectus accepted for filing by the administrator be mailed or delivered to all purchasers of the securities being offered through public offerings. This mailing or delivery must be made to the purchaser or the purchaser’s agent by not later than midnight on the second business day after the trade.
Prospectuses contain a great amount of important and valuable information concerning both financial and non-financial matters of the issuer. The information must be presented in narrative form to make it more meaningful to prospective investors. Examples of some of the more important items required for a prospectus company include:
• Details of the offering (e.g., offering price to the public, plan of distribution, characteristics of the security)
• What the company plans to do with the proceeds from the issue
• Information on the business and affairs of the issuer (e.g., history, operation details, directors and their history, legal proceedings)
• Factors affecting an investment decision (e.g., risk factors, income tax considerations)
• Information on promoters, principal security holders, and interest of management in material transactions
• Financial information, including the company’s share and loan capital structure, operating results, debt, etc.
The issuing company may decide to list its shares in the unlisted market. In this case, a prospectus or a similar disclosure document would still be required for filing with the provincial administrators.
THE PRELIMINARY AND FINAL PROSPECTUS
Most provinces require that issuers file both a preliminary prospectus and a final prospectus. When the issuer and the underwriters have agreed to the basic terms and methods of issuing

CANADIAN SECURITIES COURSE • VOLUME 111•24
© CSI GLOBAL EDUCATION INC. (2010)
the new securities, they submit the preliminary prospectus to the respective provincial securities commissions for review. The applicable securities commission will then issue a receipt and the issuing company will have 90 days to prepare, submit and receive approval for the final prospectus. This period of 90 days is referred to as the waiting period.
Since the preliminary prospectus is not in its final form, it is required to display in red ink on its front cover a statement, in approved form, stating that it is preliminary. It should say something to the effect that the preliminary prospectus has been filed but is not final, is subject to completion or amendment, and that commitments for the purchase or sale of the securities cannot be made until a receipt for the final prospectus has been issued. This prominent warning led to the term red herring prospectus.
A preliminary prospectus serves two key purposes. It is a disclosure document required under provincial securities laws. Secondly, underwriters use the preliminary prospectus to solicit expressions of interest from potential buyers of the security.
The dealers may also prepare an information circular, for in-house use only, called a greensheet. For sales representatives, the greensheet highlights the salient features of the new issue, both pro and con, in order to successfully solicit interest to the general public.
The form and content of a preliminary prospectus must comply substantially with the requirements of the acts covering the form and content of a final prospectus. However, the preliminary prospectus often does not include information that is quite important to potential investors. The price and size of an issue are usually not stated in the preliminary prospectus because that information is not finalized until after the issue has been marketed to the investment community.
The interval between issuing the preliminary and final prospectuses is a mandatory period during which only limited communication with potential investors is permitted. The sales staff is allowed to identify the security, its features and price (if determined), and is obligated to record names and addresses of individuals and corporations who have requested and received a preliminary prospectus. If any amendments to the preliminary prospectus are to be made, a copy of the amended prospectus must be forwarded to all prospective purchasers that had received the original copy. Most other activities in furtherance of an issue (e.g., entering into agreements of purchase and sale of the new securities) are strictly prohibited. Additionally, information not contained in the preliminary prospectus, such as market commentary, research and investment reports, projections and other matters relating to the issuer in question, may not be distributed to interested investors during this time.
Once all of the issues in the preliminary prospectus have been resolved, a receipt is issued by the securities commission and a copy of the final prospectus must be delivered to all security purchasers on record.
A final prospectus must contain sufficient details on the securities being offered for sale, so as to provide full, true and plain disclosure of all material facts about the securities proposed to be distributed. The final prospectus must contain all the information that may have been omitted in the preliminary prospectus, such as the offering price to the public, the proceeds to the issuer (and/or selling security holders), the underwriting discount, and any other required information that may have been omitted in the preliminary prospectus. The final prospectus must include the consent of experts such as appraisers, engineers, auditors and lawyers whose reports or opinions are referred to in the prospectus, the certificates and undertakings relating to financing
ELEVEN • FINANCING AND LISTING SECURITIES 11•25
© CSI GLOBAL EDUCATION INC. (2010)
and distribution arrangements, and other documents evidencing compliance with regulatory requirements.
The regulators review the documents carefully and may require changes before final approval. Once approval of the final prospectus is granted, the issue is then said to be blue skyed and may be distributed to the investing public.
THE SHORT FORM PROSPECTUS SYSTEM
Certain issuers may have quicker access to capital markets without the necessity of preparing a full preliminary and final prospectus prior to a distribution. The short form prospectus system may be used only by certain senior reporting issuers who have made public distributions and who are subject to continuous disclosure requirements of annual financial and other required information. The short form prospectus works on the theory that much of the information that would be included in a full prospectus is already available and widely known because of this continuous disclosure. The system shortens the time period and streamlines the procedures by which qualified issuers can access Canadian securities markets through prospectus offerings.
Under the system, an issuer is permitted to use a short form prospectus if it:
• fi les electronically using SEDAR (System for Electronic Document Analysis and Retrieval)
• is a reporting issuer in at least one Canadian jurisdiction
• is up to date in its fi lings in every Canadian jurisdiction in which it is a reporting issuer
• has fi led current annual fi nancial statements and a current AIF in at least one Canadian jurisdiction in which it is a reporting issuer
• is not an issuer whose operations have ceased or whose principal asset is cash, cash equivalents or exchange listing (i.e., capital pool companies)
• has equity securities listed and posted for trading or quoted on a “short form eligible exchange” (i.e., TSX, TSX V Tiers 1 and 2, and CNSX)
Under certain circumstances, a long form prospectus will still be required.
A short form prospectus does not include a large portion of the information found in a full prospectus. It focuses on matters relating primarily to the securities being distributed, such as price, distribution spread, use of proceeds and the securities’ attributes. The short form prospectus incorporates by reference certain information contained in the most recent AIF and continuous disclosure documents of the issuer, and also describes how members of the public may obtain copies of such documents. The system is one of the reasons why the bought deal has become a frequently used method of raising corporate capital.
The “bought” deal is a refinement of a conventional underwriting. In contrast to the conventional short form prospectus system or other offering in which an underwriter agrees to make its best efforts to sell securities of an issuer to the public, a bought deal underwriter commits to buy a specified number of securities at a set price. The underwriter will then resell those securities to the public. In a conventional underwriting, if the securities do not sell, the issuer will not receive the proceeds of the sale of the securities. In a bought deal, the underwriter pays the full proceeds to the issuer regardless of whether the underwriter has been able to resell the securities to the public.
In bought deals, an investment dealer negotiates with the issuer directly and bids for a specific new issue of securities. Under a bought deal, the dealer assumes the risk of the position, that

CANADIAN SECURITIES COURSE • VOLUME 111•26
© CSI GLOBAL EDUCATION INC. (2010)
is, acts as principal. The details of price and the type of issue are decided either simultaneously with filing the short form prospectus or shortly thereafter. Under a bought deal arrangement, the spread between the dealer’s cost and the final selling price may be as low as one per cent of the issue price, well below traditional financing spreads. Once final regulatory approval is received, the bought issue is sold by the investment dealer, either as a private placement to a select group of investors or as a public issue under a short form prospectus. Distribution probably is not as wide, since only one, or possibly a few, dealers are involved with the bought deal as opposed to the many dealers involved in other types of public offerings.
Other Documents and Sale of the IssueWhile the preliminary prospectus is with the securities commissions, work proceeds on the preparation of other documents for the issue along with the appropriate marketing materials. These include:
• The Trust Deed, or Trust Indenture in the case of a debt issue.
• The underwriting agreement or the agency agreement between the dealer and the corporation, providing for the purchase of the issue by the dealer for resale or defi ning the dealer’s agency position in the offering. This agreement specifi es the price to the public and the price to the dealer.
• The Banking Group Agreement – the lead dealer may invite a limited number of other dealers to join in the offering to the public on the basis of sharing ownership, liability and profi ts of the issue.
• The Selling Group Agreement – an extensive additional group of dealers (frequently including all members of IIROC and of specifi ed Canadian stock exchanges) may be offered the opportunity to purchase the new issue for resale to their clients.
Final agreement on the public and dealer issue prices. The price to the public is based on a careful appraisal by the dealer of investor indications of interest. Proper pricing of the issue is vital to its success, as an unsuccessful issue results in a loss to the dealer distributing the issue as principal. It also has an immediate and potentially future adverse impact on the ability of the issuing corporation to raise funds publicly. An unsuccessful issue from the issuer’s perspective is one where the corporation does not raise the funds required, or the issue was overly underpriced. Both situations may mean that subsequent issues will be necessary, leading to substantial additional issuance costs.
Example: The following is a step-by-step description of the financing process in a simplified form. Chart 11.2 illustrates this process.

ELEVEN • FINANCING AND LISTING SECURITIES 11•27
© CSI GLOBAL EDUCATION INC. (2010)
CHART 11.2 THE FINANCING PROCESS
Step 1
The Issuing Company sells a $100 million bond issue at a discounted price of 98¼ to the Financing Group (also known as managing underwriters and syndicate managers or lead underwriters) consisting of Dealer A and Dealer B for public resale at the par value price of 100. In this case, the bond issue is sold for a total cost of $98.25 million to the Financing Group, while the sale to the public is made at $100 million.
Dealers A and B have been in continuous contact with the Issuing Company, providing recommendations on type, size and timing of the issue, any covenants, protective clauses, as well as currency of payment, pricing, etc. They also arranged for the preparation of the prospectus and the trust deed, the clearing with securities commissions, and the provision of selling documents, etc. The Financing Group accepts the liability of the issue on behalf of Banking Group members, which include themselves.
In addition to Dealers A and B, the Banking Group consists of Dealers C to T, all of whom have previously agreed to participate on set terms and to accept a liability up to their individual participation. For example:
• Dealers A and B might typically have participation (hence ultimate liability) ranging from perhaps $7 million to $25 million for an issue size of $100 million.
CANADIAN SECURITIES COURSE • VOLUME 111•28
© CSI GLOBAL EDUCATION INC. (2010)
• Dealers C to T agree in advance to their individual participations (i.e., potential liabilities) in the Banking Group. Dealers C to T undertake to comply with terms and conditions concerning underwriting and distribution set out in the Banking Group agreement. Dealers A and B offer various amounts to Banking Group Members C to T based on estimated distribution ability, geographical locations, etc. However, the Issuing Company may request or require that special consideration be given to certain dealers. For example, on its global bond issues, the federal government may request that a certain minimum percentage be reserved for Canadian dealers.
Step 2
The Financing Group sells the $100 million bond issue to the Banking Group (Dealers A to T) at 98½. In practice, a “draw down” price somewhat higher than 98½ is established. The differential provides a fund which is applied against expenses incurred by the Financing Group on behalf of the Banking Group in connection with preparing and clearing the prospectus, legal fees, accountant fees, IIROC levy, etc. Any residue in the fund is ultimately distributed to Banking Group members proportionately.
The Financing Group (Dealers A and B) also obtains an override, which is an additional payment over and above their original entitlement on the entire issue in payment for their services as financial advisors and syndicate managers or leads. Each Banking Group member (Dealers A to T) has a preset maximum liability.
Dealers A to T are the dealers whose names appear in so-called tombstone advertisements which appear in the financial press as a matter of record once the deal has been completed.
Step 3
The initial designation of bonds set by the Financing Group may be altered as the sale of the issue progresses.
• $60 million of the issue may be allotted to the Banking Group (Dealers A to T) for distribution to their clients at a price of 100 or par. This means that each dealer has 60% of its participation to sell although the liability of each dealer is still 100% of the agreed-upon participation.
• $30 million may be designated for sale to the exempt list at 100. This list usually includes only large professional buyers, mostly fi nancial institutions, who are exempt from prospectus requirements. They may receive a selling document instead of the prospectus, which would include the salient features of the issue. Each of these buyers is offered bonds by the Financing Group (Dealers A and B) on behalf of the entire Banking Group. Resultant sales are applied to reduce each Banking Group member’s liability proportionately.
If exempt list sales are less than $30 million, the remainder may be returned proportionately to the Banking Group (Dealers A to T) or, if considered desirable, allocated to other dealers.
ELEVEN • FINANCING AND LISTING SECURITIES 11•29
© CSI GLOBAL EDUCATION INC. (2010)
• $10 million may be provided to (i) the Selling Group, (ii) Casual Dealers, or (iii) Special Group. Bonds allotted to these three groups proportionately reduce each Banking Group (Dealers A to T) member’s liability. However, any shortfall is returned to the Banking Group.
i) The Selling Group consists of other dealers, normally members of IIROC, who are not members of the Banking Group (Dealers A to T). They are invited in writing by the Financing Group to buy bonds at 991/4 to offer at 100 to their clients (excluding the exempt list). The Selling Group orders are subject to allotment and each member of the Selling Group has liability for the orders placed with the Financing Group.
ii) Casual Dealers are non-members of the Banking or Selling Groups. They may be brokers, broker dealers, foreign dealers, banks, etc. They are not offered bonds directly or indirectly, but may receive orders for bonds from clients and apply to the Financing Group for an allocation. They may, at the discretion of the Financing Group, be allotted bonds at, say, 991/2 for resale at 100. Since they have fi rm orders, they incur no liability.
iii) Special Group orders occur under various circumstances. For example, the Issuing Company may demand special consideration for a dealer or its banker, or its parent’s banker if it is a subsidiary of a foreign parent. The terms and conditions of the allotment are not standardized.
After-Market StabilizationOnce an issue is brought to market, one of the duties of the lead dealer may involve providing after-market stabilization of that security’s offering. Under this arrangement, the dealer is required to support the offer price of the stock once it begins trading in the secondary market (also called the after-market). Typically, the issuing company and the dealer will negotiate the terms of any after-market stabilization as part of the underwriting contract. The dealer’s role is stated on the front page of the prospectus, and additional information must be provided inside the prospectus.
Three types of after-market stabilization activities are possible.
The most common type of activity is for the dealer syndicate to initially sell securities in excess of the original amount offered by the issuer for sale to the public. In this way, the dealer oversells the offering, setting up what is called a short position in the stock prior to the close of the offering. Once the offering begins to trade in the after-market, two possible scenarios could develop: the share price falls below the IPO offer price, or the share price rises above the offer price on strong demand for the issue.
Example: ABC Co. goes public with an IPO of 10 million shares at $10 a share. The offering includes an over-allotment option (also referred to as a green shoe option) whereby 10 million shares are issued but 11 million shares are actually sold to the public. This creates a short position of 1 million shares for the dealer once the offering begins to trade. If the price of the ABC shares drops below the $10 IPO offer price, the dealer will cover the short position by buying shares offered for sale by public investors in the after-market. The buying activity on the part of the dealer is intended to bring liquidity to the issue through open market purchases to help the share price rise back to its offer price. If the price of the ABC shares rises above the $10 offer price, the dealer can exercise the over-allotment option and cover the short position by buying shares from ABC at the original IPO price.

CANADIAN SECURITIES COURSE • VOLUME 111•30
© CSI GLOBAL EDUCATION INC. (2010)
These activities help to stabilize the after-market price of the recently issued security by either increasing demand in the case of covering a short position or increasing supply in the case of overallotment option exercise.
The second most common after-market stabilization activity is called a “penalty bid”. The lead underwriter will penalize members of the selling group if their customers “flip” (sell) shares in weak issues in the after-market during the distribution or shortly after the offer closes. The penalty may include paying back commissions to the underwriter or the underwriter may reduce the number of shares the IA receives in future initial public offerings.
The least common stabilization activity is one where the dealer posts a stabilizing bid to purchase shares at a price not exceeding the offer price if the distribution of shares is not complete. These activities help to stabilize the after-market price of the recently issued security by maintaining demand while the dealer attempts to complete the distribution of securities.
OTHER METHODS OF DISTRIBUTING SECURITIES TO THE PUBLIC
A different form of prospectus may be used when shares are distributed through the facilities of Canadian stock exchanges. The exchange, rather than the Administrator, reviews the prospectus and approves or disapproves it. Companies already listed may use a less detailed exchange offering prospectus or a statement of material facts with the applicable exchanges and securities administrators. Currently, only the TSX Venture Exchange maintains an Exchange Offering Prospectus (EOP) system.
Junior Company DistributionsWhen a listed junior company decides it must raise new capital through a distribution of treasury shares to the public, it must find a member firm to act either as an underwriter for the offering or as the issuing company’s agent with respect to the offering.
Treasury share underwritings or distributions through the facilities of a stock exchange are usually priced below the stock’s prevailing market price, but the discount from the market can be no greater than a stated schedule of percentages (10% to 25% depending on the market price of the shares).
The exchanges require that each underwriting or distribution must provide a company with a stated minimum of new capital. This minimum ranges from $100,000 to $350,000.
Historically, listed junior mining and oil companies are frequent users of such distributions, raising millions of dollars. Such companies usually have no record of earnings and few assets that would qualify as collateral for conventional credit sources (i.e., bank loans, mortgage or funded debt, government assistance). The funds these companies need is known as risk capital because it is usually earmarked for exploration and development with a high risk of failure.

ELEVEN • FINANCING AND LISTING SECURITIES 11•31
© CSI GLOBAL EDUCATION INC. (2010)
Options of Treasury Shares and Escrowed SharesAs an incentive to an underwriter to provide risk capital as a principal rather than merely acting as agent for an offering, junior companies often grant the underwriter specified treasury share options.
This technique involves the use of escrowed shares which serve as payment for properties, goods or services. Escrowed shares are shares held by an independent trustee in trust for its owner that cannot be sold or transferred unless special approval is given. Shares can be released from escrow only with the permission of the appropriate authorities, such as a stock exchange(s) or the securities administrators.
Escrowing shares ties the value of the shares held by these shareholders to what happens to the property used to obtain these shares. In addition, it prevents their owners from selling their shares before a proper market can develop. This ensures some stability in the secondary market performance of the new issue after the completed offering. Escrowed shares maintain full voting and dividend privileges for these (primarily, non-dividend-paying) companies. Escrowed share release is usually determined by a formula designed not to disrupt the market for the company’s free shares, and is usually based on some milestones being reached by the company. For example, this could involve completion of exploration drilling that has provided favourable and promising assay results.
Capital Pool Company ProgramFor small, emerging private companies, the costs associated with going public through a traditional IPO is not always financially viable. Accordingly, the TSX Venture Exchange, home to many emerging Canadian businesses, developed the Capital Pool Company (CPC) program as a vehicle to provide businesses with an opportunity to obtain financing earlier in their development than might be possible with a regular IPO.
The CPC program permits an IPO to be conducted and a TSX Venture Exchange listing to be achieved by a newly created company which, other than cash, has no assets and has no business or operations. The CPC then uses this pool of funds to identify and evaluate assets or businesses which, when acquired, qualify the CPC for listing as a regular Tier 1 or Tier 2 issuer on the Venture Exchange (a “Qualifying Transaction”).
The CPC program involves a two-stage process. The first stage involves the filing and clearing of a CPC prospectus, the completion of the IPO and the listing of the CPC’s common shares on the Venture Exchange. The second stage involves:
• the identifi cation of a business or asset that can be acquired as a Qualifying Transaction (QT)
• the preparation and fi ling with the Venture Exchange of a comprehensive CPC information circular containing prospectus-level disclosure of the QT
• the holding of a shareholders’ meeting to get approval to close the QT
At the time of listing and until completion of the QT, the CPC’s directors and senior officers must be either Canadian residents, or individuals who have a demonstrated positive association with Canadian or U.S. public companies. A minimum of $100,000 in seed capital must be contributed by directors and officers of the CPC or companies controlled by them.
CANADIAN SECURITIES COURSE • VOLUME 111•32
© CSI GLOBAL EDUCATION INC. (2010)
Under the CPC program, the issuer must raise between $200,000 and $1,900,000 in an initial public offering. The IPO offering price can range from $0.15 to $0.30 per share.
The TSX Venture Exchange may suspend from trading or delist the listed shares of a CPC where the issuer has failed to complete a QT within 18 months after the date of listing.
NEXNEX is a new and separate board of the TSX Venture Exchange that provides a trading forum for companies that have fallen below the Venture Exchange’s listing standards. Companies that have low levels of business activity or who do not carry on active business will trade on the NEX board, while companies that are actively carrying on business will remain with the main TSX Venture Exchange stock list.
NEX companies benefit from the support and visibility provided by a listing and trading environment that meets their needs, while the profile and reputation of TSX Venture Exchange companies are enhanced as a result of the overall improved quality of the main TSX Venture stock list.
NEX provides a trading forum for:
• Issuers that have been listed on the TSX Venture Exchange but no longer meet the Tier Maintenance Requirements (these companies are currently known as Inactive Issuers)
• CPCs that have failed to complete a QT in accordance with the requirements of the exchange
• TSX issuers that no longer meet continued listing requirements and would have been eligible for listing on TSX Venture as Inactive Issuers under existing policies
THE LISTING PROCESS
Sometimes as a new share issue is brought to market, a market develops for the security prior to actual exchange listing. This grey market is an unofficial OTC market comprised of dealers wishing to execute customers’ orders as well as support the issue until the official listing of the stock on a recognized exchange.
Advantages and Disadvantages of ListingBefore applying for a listing, a public company considers the advantages and disadvantages both to the company itself and to its shareholders of doing so. Some of the advantages of listing are listed in table 11.4:

ELEVEN • FINANCING AND LISTING SECURITIES 11•33
© CSI GLOBAL EDUCATION INC. (2010)
TABLE 11.4
Advantages of Listing Disadvantages of Listing
Prestige and goodwill
Company prestige is enhanced due to increased public visibility. Shareholder goodwill is increased as buying and selling become easier and visibility of market performance is enhanced.
Additional controls on management
After listing, restrictions with respect to such matters as stock options (those issued for internal use only), reporting of dividends, issue of shares for assets, etc., are put in place.
Established and visible market value
The market value of a listed company is readily visible. This may be a benefi t for the company for mergers and acquisitions, the issuance of convertible debt or debt with warrants attached, and for employee stock options. This may be a benefi t for shareholders because it may enhance the collateral value of an investor’s share holding.
Need to keep market participants informed
A listed company’s management must devote considerable time to meeting with security analysts and institutional investors and meeting with the press to explain company developments.
Excellent market visibility
The daily fi nancial press carries full details of listed trading on a daily and weekly basis. Over-the-counter (unlisted) trading is reported in less detail.
Market indifference
Low trading volume and poor market performance of a listed company are a matter of public record.
More information available
Because of strict exchange disclosure regulations, investors have access to more information on a regular basis.
Additional disclosure
Listing imposes additional disclosure requirements on the company that consume management time. Specifi cally, management is required to make continuous and prompt disclosure of material changes related to the company.
Facilitate valuation for tax purposes
The valuation of securities for estate tax purposes and estate tax planning is easier.
Additional costs to the company
Various fees, including a listing fee and subsequent annual sustaining fee, must be paid to the exchange(s) when a class of shares is listed.
Increased investor following
Financial analyst following is likely to be higher with listing. In turn, this can attract new shareholders, enhancing overall marketability in the secondary market and increase the market for new issues by the company.

CANADIAN SECURITIES COURSE • VOLUME 111•34
© CSI GLOBAL EDUCATION INC. (2010)
Listing Procedure for a CompanyCompanies wishing to be listed on a recognized exchange must apply and be accepted for trading. The application is a lengthy questionnaire designed to obtain detailed information about the company and its operations.
The listing application must be accompanied by the following:
• Copies of the company’s charter
• Any current prospectus
• Financial statements including three to fi ve consecutive years of profi t and loss statements
• Sample share certifi cates
• Annual reports
A written opinion from the company’s legal counsel verifying the propriety of all matters relating to the organization of the company and the issue of its securities
When the listing application is completed and supporting documents are assembled, the company signs a formal Listing Agreement. The agreement details the specific regulations and reporting requirements that the company must follow to keep its listing in good standing.
The exchanges have listing committees (e.g., the Stock List Committee on the TSX) which consider listing applications and then rule on the acceptability of applications. After approval is given, a specific date is set for applicable securities to be called for trading on an exchange. There are formal announcements to members and public announcements in the financial press.
By signing a Listing Agreement, a company agrees to comply with specific regulations, some of which pertain to:
• The submission of annual and interim fi nancial reports and other corporate reports to the exchange(s)
• Prompt notifi cation to the exchange(s) about dividends or other distributions; proposed employee stock options; sale or issue of treasury shares
• Notifi cation to the exchange(s) of other proposed material changes in the business or affairs of a listed company
• The listing standards of the various exchanges are not static and may become more stringent when an exchange wants to increase its prestige or is reacting to some event that damaged its prestige.
Withdrawing Trading PrivilegesAs a protection to investors, the exchanges are empowered to withdraw a listed security’s trading and/or listing privileges temporarily or permanently. Serious action such as delisting occurs infrequently. Other actions occur more frequently and may be implemented by either the exchanges or at the request of companies with regard to their own securities.
TEMPORARY INTERRUPTION OF TRADING
There are three types of temporary withdrawals of trading privileges which exchanges can invoke.

ELEVEN • FINANCING AND LISTING SECURITIES 11•35
© CSI GLOBAL EDUCATION INC. (2010)
DELAYED OPENING
Shortly before the opening of trading, an exchange can order trading in a security to be delayed. The need for this action might arise if a heavy influx of buy and/or sell orders for a particular security materialized. The delay gives exchange traders time to sort out the orders and match up buys with sells to allow fair and orderly trading when the delay order is removed. A delayed opening in one security does not affect trading in other listed securities.
HALT IN TRADING
A temporary halt in the trading of a security can be ordered or arranged at any time to allow significant news to be reported and widely disseminated (e.g., a pending merger or a substantial change in dividends or earnings).
SUSPENSION IN TRADING
Trading privileges can be suspended for more than one trading session. Such suspensions are imposed if the company’s financial condition does not meet the exchange’s requirements for continued trading, if a company fails to comply with the terms of its listing agreement or for some other good cause. If the company rectifies the problem to the exchange’s satisfaction within the time required by the exchange, trading in the suspended security will resume. During the suspension, members are usually allowed to execute orders for the suspended security in the unlisted market except for those securities suspended from trading on TSX Venture Exchange.
CANCELLING A LISTING (DELISTING)
A listed security can be delisted by the exchanges (or at the request of the company itself ) which would be a permanent cancellation of listing privileges. Reasons for delisting could include:
• The delisted security no longer exists, having been called for redemption (e.g. a preferred share) or substituted for another security as a result of a merger
• The company is without assets or bankrupt
• The public distribution of the security has dwindled to an unacceptably low level
• The company has failed to comply with the terms of its listing agreement

CANADIAN SECURITIES COURSE • VOLUME 111•36
© CSI GLOBAL EDUCATION INC. (2010)
SUMMARY
After reading this chapter, you should be able to:
1. Compare and contrast the three types of business structures and explain the process, outcomes, advantages, and disadvantages of incorporation.
• The earnings from a sole proprietorship are taxed at the owner’s personal income tax rate, profi ts accrue to the owner, and losses or debts are the owner’s personal liabilities.
• A partnership (two or more persons contributing to the business) is legislated under the Partnership Act and is either a general or a limited partnership.
• General partners are involved in day-to-day operations and are personally liable for debts and obligations. Limited partners are not involved in the day-to-day business and are liable only up to the amount of their investment.
• A corporation is owned by shareholders, is considered to be a unique entity under the law, pays taxes, and can sue or be sued. Property of the corporation belongs to the corporation, not to the shareholders. Shareholders have no liability for debts or other obligations of the corporation. The corporation can raise funds by issuing debt or equity.
• Corporations are created through incorporation, which requires fi ling of jurisdiction dependent documents with the relevant provincial or federal authorities.
• Corporations are generally either public or private, and are regulated by corporate by-laws, a corporate charter, and relevant federal or provincial legislative acts.
• Shareholders generally have a right to vote or to assign a proxy at annual or general meetings.
• Advantages of incorporation include limited liability of shareholders, continuity of interest, ability to transfer ownership of shares, certain tax benefi ts, feasibility of capital growth, status as a separate legal entity and professional management.
• Disadvantages of incorporation include loss of fl exibility, double taxation, additional expenses, and restrictions on withdrawal of capital.
SUMMARY

ELEVEN • FINANCING AND LISTING SECURITIES 11•37
© CSI GLOBAL EDUCATION INC. (2010)
2. Describe the processes by which governments raise debt capital to fi nance their funding requirements.
• Federal government fi nancing is usually accomplished through an auction and sometimes through a fi scal agency.
• Auction bids can be submitted on a competitive or non-competitive tender (the bid is accepted in full and bonds are awarded at the auction average).
• Competitive bids are fi lled from highest price to lowest price, until all bonds not allocated to the amount of the non-competitive tender are distributed.
• New issues of provincial direct and guaranteed bonds offered in Canada are usually sold at a negotiated price through a fi scal agent.
3. Describe the processes by which corporations raise debt or equity capital to fi nance their funding requirements.
• Corporations issue shares (common and/or preferred) to raise capital, which creates the company’s capital stock.
• The term issued shares refers to all shares issued; authorized shares are the maximum number of shares the company can issue according to its corporate charter; outstanding shares are the issued shares that have not been redeemed or repurchased by the company.
• Corporations may also raise capital by issuing debt securities (e.g., bonds, debentures, medium-term notes, callable bonds, convertible bonds) or by borrowing from lending institutions (e.g., bank loan).
4. Summarize the steps in the corporate fi nancing process, explain the different methods of offering securities to the public, summarize the prospectus system and evaluate after-market stabilization.
• A corporate issuer chooses a dealer to act as principal or agent in a new security issue.
• The dealer prepares analyses of market conditions and other factors and suggests the terms and type of the issue, including debt or equity. Securities are then issued as a public offering or private placement (one or more large institutional investors buy the entire issue).
• The prospectus is the primary information document for a new securities issue and is based on the premise of full, true and plain disclosure of all material facts relating to securities being offered.
• Most provinces require that issuers fi le both a preliminary prospectus and a fi nal prospectus.
• The preliminary prospectus is a disclosure document required under provincial securities laws; it is also used to determine the level of interest of potential buyers of the security.

CANADIAN SECURITIES COURSE • VOLUME 111•38
© CSI GLOBAL EDUCATION INC. (2010)
• Companies that have previously made public distributions and that are subject to continuous disclosure requirements can use a short form prospectus.
• After the securities have been issued, the lead dealer may be required to provide after-market stabilization in any of three ways: overselling to establish a short position that will be covered later in the open market if the price falls below the issue price, penalizing members of the selling group that sell securities shortly after issue, or creating an open bid to buy securities at the offer price.
5. Identify other methods of distributing securities to the public through stock exchanges. Discuss the advantages and disadvantages of listing shares for trading on an exchange and explain the circumstances and ways in which exchanges can withdraw trading privileges.
• Other methods of distributing securities to the public include distributions through the exchanges, junior company distributions, treasury share options, release of escrowed shares, the Capital Pool Company (CPC) program, and NEX (a separate trading board of the TSX Venture Exchange).
• Advantages of listing shares for trading on an exchange include prestige and goodwill, establishment of market value, increased market visibility, wider distribution of company information, easier valuation for tax purposes and increased investor following.
• Disadvantages of listing shares for trading on an exchange include additional controls on management, additional costs, visibility of any market indifference, requirement for additional disclosure, and the requirement to provide information to a range of individuals and organizations on a regular basis.
• Companies must apply and be approved by the exchange(s) prior to listing.
• Exchanges have the power to withdraw a listed security’s trading and/or listing privileges temporarily or permanently if necessary to protect investors.
Now that you’ve completed this
chapter and the on-line activities,
complete this post-test.

© CSI GLOBAL EDUCATION INC. (2010) 12•1
Chapter 12
Corporations and their Financial Statements

© CSI GLOBAL EDUCATION INC. (2010)12•2
12
Corporations and their Financial Statements
CHAPTER OUTLINE
The Balance Sheet• Classifi cation of Assets• Classifi cation of Liabilities• Shareholders’ Equity
The Earnings Statement• Structure of the Earnings Statement• The Operating Section (items 28 to 34)• The Non-Operating Section (items 35 and 36)• The Creditors’ Section (items 37 and 38)• The Owners’ Section (items 40 to 45)
The Retained Earnings Statement
The Cash Flow Statement• Operating Activities• Financing Activities (items 51 to 54)• Investing Activities (items 55 to 57)• The Change in Cash Flow (items 58 to 60)• Supplemental Information (items 61 to 62)
The Annual Report• Footnotes to the Financial Statements• The Auditor’s Report• Trends in accounting standards

© CSI GLOBAL EDUCATION INC. (2010) 12•3
Summary
Appendix A - Sample Financial Statements
LEARNING OBJECTIVES
By the end of this chapter, you should be able to:
1. Describe the format and the items of the balance sheet and explain how the items are classifi ed.
2. Describe the structure of the earnings statement and explain the sources of net income (or net earnings).
3. Describe the purpose of the retained earnings statement and describe its link with the balance sheet and earnings statement.
4. Describe the components of the cash fl ow statement and classify an accounting activity or item as a cash fl ow from operating, fi nancing or investing activities.
5. Explain the importance of the notes to the fi nancial statements and the auditor’s report.
UNDERSTANDING THE FINANCIAL STATEMENTS
Financial information that is accurate and relevant is the driving force behind good investment decisions. A company’s fi nancial statements are one of the best ways it can communicate the successes (and challenges) it has experienced to the investing public.
Financial statements are like a scorecard of a company’s operations; they show what the company owns and how it was fi nanced, as well as how profi table it was (or the losses it incurred) over a given period, usually a year. The ability to understand and analyze these statements effectively, and compare them with other companies, is important for anyone who is considering investing in a company’s stocks or bonds, because the statements can reveal a great deal about a company’s fi nancial health.
The success or failure of investing in a company’s securities depends on how the company will fare in the future. Future prospects are diffi cult to forecast with a high degree of accuracy, but the past often provides a clue. Thus, if an investor has some knowledge of a company’s present fi nancial position and information about its past fi nancial record, she is more likely to select securities that will stand the test of time. The investor will, of course, need to combine this information with an understanding of the industry in which the company operates, the economy in general, and the specifi c plans and prospects for the company in question to make a sound selection from investment alternatives.
In the on-line Learning Guide for this module,
complete the Getting Started
activity.

© CSI GLOBAL EDUCATION INC. (2010)12•4
Whether you are an investor, advisor or analyst, you need to approach a company’s fi nancial statements like an investigator. Becoming familiar with the information presented in the fi nancial statements is a fi rst step toward making informed investment decisions.
KEY TERMS
Accounts payable Earnings before interest and taxes (EBIT)
Amortization Earnings statement
Asset Equity Income
Balance sheet Extraordinary item
Book value FIFO (first-in-first-out)
Canadian Public Accountability Board (CPAB) Future income tax
Capitalize Generally Accepted Accounting Principles (GAAP)
Contributed surplus Goodwill
Inventory Intangible asset
Cost method International Financial Reporting Standards (IFRS)
Cost of goods sold Liabilities
Current asset LIFO (last-in-first-out)
Current liabilities Net book value
Declining-balance method Retained earnings
Deferred charge Share capital
Deferred revenue Shareholders’ equity
Depletion Straight-line method

TWELVE • CORPORATIONS AND THEIR FINANCIAL STATEMENTS 12•5
© CSI GLOBAL EDUCATION INC. (2010)
THE BALANCE SHEET
The balance sheet shows a company’s financial position at a specific date. In annual reports, that date is the last day of the company’s fiscal year. While many companies have a fiscal year end that corresponds with the calendar year end, i.e., December 31, this is not always the case. For example, many broadcasting and media companies have an August 31 fiscal year end, while banks and trust companies traditionally end their fiscal year on October 31. In this instance, October 2010 would be the last month of the bank’s “fiscal 2010” while November 2010 would represent the first month of “fiscal 2011.”
One side of the balance sheet (often the left side) shows what the company owns and what is owing to it. These items are called assets. The other side of the balance sheet shows (1) what the company owes (called liabilities) and (2) the shareholders’ equity or net worth of the company which represents the shareholders’ interest in the company. Shareholders’ equity represents the excess of the company’s assets over its liabilities. Accordingly, the company’s total assets are equal to the sum of the company’s liabilities plus the shareholders’ equity.
Assets = Liabilities + Shareholders’ Equity
Balance sheets are prepared and presented in more or less the same way whether for small businesses or large nationally known corporations. One might contain nine items and the other forty-nine, but basically they tell the same financial story.
Using the Trans-Canada Retail Stores Ltd. financial statements shown in the Appendix A of this chapter as an example, the relationship between items on the balance sheet is shown in Table 12.1.
TABLE 12.1 SIMPLIFIED BALANCE SHEET
ASSETS LIABILITIES
Assets $19,761,000 Liabilities $6,402,000
Shareholders’ Equity $13,359,000
Total Assets $19,761,000 Total Liabilities and Shareholders’ Equity
$19,761,000
The above equation between balance sheet items may alternatively be expressed as:
Assets $19,761,000
Less: Liabilities 6,402,000
Equals: Shareholders’ Equity $13,359,000
Often shareholders’ equity is referred to as the book value of the company, and this represents the total value of the company’s assets that shareholders would theoretically receive if the company were liquidated. However, this item does not necessarily indicate the amount shareholders will receive for their ownership interest in the event of sale. The market value of the shareholders’ interest may be worth a lot more or less than the book value, largely depending upon the company’s earning power and prospects.
THE BALANCE SHEET
CANADIAN SECURITIES COURSE • VOLUME 112•6
© CSI GLOBAL EDUCATION INC. (2010)
Classification of AssetsTaking each class of asset one by one and in the order in which they are shown in the Trans-Canada Retail balance sheet, we will see what they are and what they tell us about the company.
CURRENT ASSETS (ITEMS 1 TO 6)
Current assets are cash and assets which can be turned into cash right away or which, in the normal course of business, will be turned into cash in the near future, i.e., normally within one year. Current assets are the most important group of assets because they largely determine a firm’s ability to pay its day-to-day operating expenses. On the balance sheet, current assets are usually listed in order of liquidity, i.e., those which can be converted into cash most quickly are listed first, followed by the others.
There are five broad groups of current assets:
• Cash – on hand or in the bank.
• Temporary investments – bonds and stocks that can be readily sold for cash.
• Accounts receivables – money owing to the company for goods or services it has sold. Because some customers fail to pay their bills, an item called allowance for doubtful accounts is often subtracted from receivables. This allowance is management’s estimate of the amount that will not be collected. This item is generally not shown separately on the balance sheet but it is assumed that an adequate allowance has been made.
• Prepaid expenses – payment made by the company for services to be received in the near future. Since these prepaid expenses eliminate the need to pay cash for goods or services in the immediate future, they are the equivalent of cash. Rents, insurance premiums and taxes, for example, are sometimes paid in advance. For accounting purposes, their cost is generally spread over the periods during which the company benefi ts from this expenditure.
• Inventories – consists of the goods and supplies that a company keeps in stock. For example, a furniture manufacturer that sells chairs to Trans-Canada Retail would have inventories of raw materials (e.g., the fabric and wood used to build the chairs), work-in-progress (assembled chair frames) and fi nished goods (completed chairs ready for shipping).
Inventories are changed by successive steps into cash. Raw materials are processed into finished goods. Finished goods are sold on 30, 60, 90 days or longer credit terms and give rise to receivables. These receivables become due and are paid off in cash. This process goes on day after day, providing the funds to enable the company to pay for wages, raw materials, taxes and other expenses and ultimately to provide the profits out of which dividends may be paid to shareholders.
Inventories are valued at original cost or current market value – whichever is lower. If the original cost is used, there are three commonly used methods of determining the cost of inventories:
• Average cost of all items in inventory;
• FIFO (fi rst-in-fi rst-out) – items acquired earliest are assumed to be used or sold fi rst; or
• LIFO (last-in-fi rst-out) – items acquired most recently are assumed to be used or sold fi rst
TWELVE • CORPORATIONS AND THEIR FINANCIAL STATEMENTS 12•7
© CSI GLOBAL EDUCATION INC. (2010)
Example: A computer company manufactured 1,000 hard drives last month at a cost of $125 each and an additional 1,000 units this month at a cost of $150 each. The higher costs are due to rising raw materials prices. The company sells 1,000 hard drives today.
Under the FIFO method, the cost of the goods sold is $125 per hard drive because that was the cost of each of the first hard drives into inventory. The remaining hard drives would be valued at the more recent and higher cost of $150 each, which works out to an inventory value of $150,000 (1,000 hard drives × $150).
Under the LIFO method, the cost of the goods sold is $150 per hard drive because that was the cost of the last hard drives into inventory. The remaining hard drives are valued at the older and lower cost of $125 each, or an inventory value of $125,000 (1,000 hard drives × $125).
As its name suggests, the average cost method uses the average of the total cost of the goods purchased over the period on a per unit basis. The total cost of the hard drives is $275,000 ([1,000 × $125] + [1,000 × $150]). The average cost of the inventory is $137.50 ($275,000 ÷ 2,000 units). The cost of the goods sold is $137.50 and the inventory value on the balance sheet would be reported as $137,500.
As the above example shows, if prices are changing, each of these methods produces a different inventory value on the balance sheet and, consequently, a different profit based on the costs of the goods sold. As you will learn in the section on the earnings statement, the lower cost of goods sold under the FIFO method produces a higher profit level for the company. On the contrary, the LIFO method reports a higher cost of the goods sold and this translates into a lower profit for the company during a period of rising prices.
MISCELLANEOUS ASSETS (ITEM 7)
Miscellaneous assets are assets that are neither current nor fixed. The most common are:
• Cash surrender value of life insurance
• Amounts due from directors, offi cers and employees of the company
• Investments of a long-term nature, e.g., investment in, or money lent to, a supplier
• Investments in, and advances to, subsidiary and affi liated companies
PROPERTY, PLANT AND EQUIPMENT (ITEM 8)
Property, plant and equipment (also called capital assets) consist of land, buildings, machinery, tools and equipment of all kinds, trucks, furnishings and so on used in the day-to-day operations of a business. Unlike current assets, which are converted by successive steps into cash, the value of capital assets to a company lies in their use in producing goods and services for sale, rather than in their sale value. They are not intended to be sold.
Capital assets are shown on the balance sheet at original cost, including installation and other acquisition expenses. Except for land, capital assets are amortized (or reduced in value to reflect depreciation) each year and the total accumulated amortization is deducted from the original cost. The value of capital assets recorded on the balance sheet after the deduction of amortization is called the net carrying amount (or net book value) of the assets. If a capital asset is sold, its original cost and related amortization are removed from the balance sheet. The difference between the sale price of the capital asset and that asset’s net carrying amount is a profit (or loss) and is treated as non-operating income (or expense) of the company.

CANADIAN SECURITIES COURSE • VOLUME 112•8
© CSI GLOBAL EDUCATION INC. (2010)
AMORTIZATION AND DEPLETION
With the exception of land, capital assets wear out in time or otherwise lose their usefulness. Between the time when a given asset is acquired and when it is no longer economically useful, a decrease in its value takes place. This loss in value over a period of years is known as amortization (some companies use the term depreciation to refer to the annual decrease in value). Amortization is also used to describe the writing off of intangible assets such as patents or trademarks.
To spread the cost of capital assets over their years of useful service, companies record amortization expenses against each year’s earnings. This is done on the grounds that the capital assets are used in the process of producing goods or services and amortization is, therefore, a cost of doing business, just like wages and other operating expenses.
Amortization applies to the ordinary wearing out of plant and equipment. The amount recorded as amortization each year is based upon the original cost of each asset, its expected life and the probable salvage or scrap value, if any, when it is withdrawn from service.
There are several methods by which these amounts can be allocated to each accounting period. The method used most frequently in Canada by public companies is the straight-line method, whereby an equal amount is charged to each period. The declining-balance method is also frequently used. This method applies a fixed percentage, rather than a fixed dollar amount, to the outstanding balance to determine the expense to be charged in each period. This amount is deducted from the capital asset balance to determine the amount against which the percentage will be applied in the subsequent period – thus the term declining balance. Other methods are available, but are used less frequently.
The example in Table 12.2 shows the calculation of amortization by the straight-line and declining balance methods.
TABLE 12.2 METHODS OF CALCULATING AMORTIZATION
Suppose a piece of equipment bought by XYZ Co. Ltd. at $100,000 is expected to have a useful life of eight years and a salvage value of $10,000 at the end of the asset’s life. The annual amortization for this asset utilizing the straight-line method is:
$100,000 $10,000$11,250
8
and the amortization rate is 12.5% (100% / 8) per year for each of the eight years of expected usefulness.
Let’s assume XYZ uses an amortization rate of 25% under the declining-balance method on each year’s remaining balance. Thus, in Year 1: $100,000 amortized at 25% = $25,000. In Year 2: $75,000 ($100,000 – $25,000) amortized at 25% = $18,750. By the end of eight years, using the declining balance method of calculating amortization, there is an unamortized balance of $10,011 as the following table shows:

TWELVE • CORPORATIONS AND THEIR FINANCIAL STATEMENTS 12•9
© CSI GLOBAL EDUCATION INC. (2010)
TABLE 12.2 METHODS OF CALCULATING AMORTIZATION – Cont’d
Amortization: Straight-Line Versus Declining-Balance
Cost of Asset: $100,000 Salvage Value: $10,000 Useful Life: 8 Years
Straight-Line Declining-Balance
FiscalYear-End
Amortization Charge
Carrying Amount on
Balance SheetAmortization
Charge
Carrying Amount on
Balance Sheet
1st $11,250 $88,750 $25,000 $75,000
2nd 11,250 77,500 18,750 56,250
3rd 11,250 66,250 14,063 42,188
4th 11,250 55,000 10,547 31,641
5th 11,250 43,750 7,910 23,730
6th 11,250 32,500 5,933 17,798
7th 11,250 21,250 4,449 13,348
8th 11,250 10,000 3,337 10,011
Amortization is intended to allocate the cost (net of salvage value) of the company’s capital assets over their useful lives, and to provide a realistic matching of earnings to expenses in a fiscal period, in order to determine the net income of a company on an annual basis.
Depletion is similar to amortization and is usually used by mining, oil, natural gas, timber companies and other extractive industries. The assets of these industries consist largely of natural wealth such as minerals in the ground or standing timber. As these assets are developed and sold, the company loses part of its assets with each sale. Such assets are known as wasting assets and depletion is the annual decrease in value the company records.
An allowance for depletion is made in recognition of the fact that as companies sell their natural assets, they must recover not only the cost of extraction, but also the original cost of acquiring such natural resources, before a profit can be recognized.
Annual allowances for amortization and depletion appear as non-cash charges against earnings in the earnings statement. Thus, it is quite possible for a company to add considerably to its cash resources for the year yet show little or no net earnings, if substantial amortization charges were made. These effects will be reflected in the cash flow statement, where the cash from operations is reported.
The accumulated allowances for amortization and depletion usually appear on the asset side of the balance sheet as a direct deduction from the capital assets to which they apply. Usually only one figure for accumulated amortization is shown for all assets. The breakdown of amortization by each class of capital asset is relegated to the notes to the financial statements.
CANADIAN SECURITIES COURSE • VOLUME 112•10
© CSI GLOBAL EDUCATION INC. (2010)
CAPITALIZATION
Capitalizing refers to the recording of an expenditure as an asset rather than as an expense. This is done to allow for the spreading of an expense over more than one accounting period. For example, a company will record the cost to purchase a building or piece of machinery as an expense on its earnings statement in the year incurred. Thus, the purchase of a $10 million piece of machinery will likely have a substantial impact on a company’s net income for the year. When a company decides to capitalize an asset, net income in the year of acquisition is impacted in a much smaller way. The expense is instead recorded as an asset on the balance sheet which is then amortized over a certain number of periods.
DEFERRED CHARGES (ITEM 9)
Deferred charges are another type of asset frequently shown on the balance sheet. These charges represent payments made by the company for which the benefit will extend to the company over a period of years. In this way, it is similar to prepaid expenses (described earlier) except that the benefits received extend for a longer period of time. For accounting purposes, the cost of such items is spread out over several years by annual write-offs. This gradual writing off of deferred charges is the equivalent of amortization of capital assets. At the date of the balance sheet, the balance of amounts paid for benefits, which have not been totally used, is shown as an asset. Deferred charges may represent expenses incurred in issuing bonds, commission paid on the sale of capital stock, organizational expenses or research expenses.
GOODWILL AND OTHER INTANGIBLE ASSETS (ITEM 10)
Intangible assets are assets that cannot be touched, weighed or measured. They are not available for the payment of debts of a going business and they usually decline greatly in value in the event of liquidation. Some common examples are goodwill, patents, copyrights, franchises and trademarks. Intangible assets, which may be grouped on the balance sheet under the headings “miscellaneous assets” or “other assets,” comprise valuable legal rights essential to the operations of the company.
Since the realizable value in cash of intangible assets is uncertain, most companies show them on the balance sheet at a nominal value. This practice indicates that management is being quite conservative in its accounting policy, because the intangible assets listed may be quite valuable to the company.
Goodwill is often defined as the probability that a regular customer will continue to return to do business. If people get into the habit of doing business with a firm because of its location or reputation for fair dealing and good products, they will probably continue that habit, at least to some extent, even though the firm changes hands.
The buyer of a business is often willing to pay for its “good name” in addition to the value of its assets. Goodwill may also signify the amount that a purchaser of a company will pay for the good management of the company. It will appear on consolidated (or combined) balance sheets as the excess of the amount paid for the shares over their net asset value.
Intangible assets with finite useful lives are amortized over this useful life (usually straight-line). Goodwill and intangible assets with infinite useful lives are tested at least annually, to verify that the amount recorded is still the fair value. When the carrying amount of goodwill or an intangible asset exceeds its fair value, an impairment loss should be recognized in an amount equal to the excess.

TWELVE • CORPORATIONS AND THEIR FINANCIAL STATEMENTS 12•11
© CSI GLOBAL EDUCATION INC. (2010)
In general, the values given to intangible assets on the balance sheet should be viewed with caution. The value of such an asset is connected more to its contribution to earning power than to its saleability as an asset. For example, a trademark may mean much to a company from the point of view of brand recognition, yet it may be difficult to assess the trademark’s dollar value if it were to be sold.
Classification of LiabilitiesWe now turn our attention to the right-hand side of the balance sheet, where liabilities and shareholders’ equity are found. First we will examine the various categories of liabilities.
CURRENT LIABILITIES (ITEMS 12 TO 17)
For the most part, current liabilities are debts incurred by a company in the ordinary course of its business which have to be paid within a short time – a year at the most. The Trans-Canada Retail balance sheet shows five common types of current liabilities:
• Bank advances – consist of short-term loans from fi nancial institutions;
• Accounts payable – includes unpaid bills for raw materials, supplies and the like;
• Dividends payable – are funds that have been set aside after the company declares a dividend;
• Income taxes payable – consist of taxes to be paid to the government in the near term;
• First mortgage bonds due within one-year – are the current portion of the company’s long-term debt.
In addition, all other kinds of obligations that must be met within a year are included in current liabilities. Some of these are: outstanding wages and salaries, bank and bond interest, legal fees, pension payments, and property and excise taxes. In every case, the liability is a very definite one and has to be met. Quite often, the values given to assets may shrink, but liabilities, particularly current ones, never do.
It is important to distinguish between debts (i.e., where the company has borrowed money through methods such as bank advances or bonds) and other types of liabilities such as accounts payable or taxes owed. This is an important point to remember when calculating debt ratios for companies. Only debts incurred by borrowing are included in ratios involving debt.
FUTURE INCOME TAXES (ITEM 18)
Future income tax results from temporary differences between the book value of assets and liabilities as reported on the balance sheet and the amount attributed to that asset or liability for tax purposes. A company will take the difference between these two amounts and then multiply it by a future tax rate to arrive at the amount of future tax for the period.
Guidelines for future income taxes are calculated according to Canadian Institute of Chartered Accountants (CICA) guidelines.
NON-CONTROLLING INTEREST IN SUBSIDIARY COMPANIES (ITEM 19)
This item appears in some balance sheets that are consolidated. Consolidated financial statements combine all the assets, liabilities and operating accounts of a parent company with those of its subsidiaries into a single joint statement when a company owns more than 50% of a subsidiary.
CANADIAN SECURITIES COURSE • VOLUME 112•12
© CSI GLOBAL EDUCATION INC. (2010)
(The consolidated method of accounting is used in these circumstances.) Even if the parent company owns less than 100% of a subsidiary’s stock, all of the assets and liabilities are combined in the consolidated financial statements. To compensate, that part of the subsidiary not owned by the parent company is shown in the consolidated balance sheet as non-controlling interest in subsidiary companies or as minority interest. From the viewpoint of the consolidated statement, this non-controlling or minority interest is considered to be the interest or ownership outsiders have in the subsidiary company. Accordingly, it is regarded as a quasi-liability, which must be deducted in arriving at the consolidated shareholders’ equity of the parent company.
OTHER LIABILITIES
Some companies use a section of the balance sheet between liabilities and shareholders’ equity to set up provisions for estimated losses they expect to incur (e.g., from a lawsuit in progress against the company at balance sheet date or as a result of investments in politically unstable countries). If such a contingency is based solely on conservative thinking and refers to remote contingencies and not to a specific loss in prospect, the amount is more properly included as a note to the financial statements.
Deferred revenue results when a company receives payment for goods or services that it has not yet provided. Since the company has an obligation to deliver the goods or services in the future, the unearned portion of the revenue represents a liability to the company and is therefore shown as such. Deferred revenue is somewhat the opposite of a deferred charge.
One common type of deferred revenue is a prepaid subscription to a magazine, which covers future issues still unpublished at date of the payment. These payments represent deferred revenue to the publisher of the magazine. The amount would be shown as current or long-term, depending on the circumstances. The deferred revenue liability would, in theory, be reduced whenever the obligation was fulfilled; in practice, because of the work involved in tracking many such transactions, the liability is usually reduced on an annual basis.
LONG-TERM DEBT (ITEM 20)
This group of items can normally be thought of as financing the capital assets on the other side of the balance sheet. As distinct from current debts, which have to be paid within a year, the long-term debt of a company is usually due in monthly or annual instalments over a period of years or in a lump sum in a future year. Any portion of long-term debt that is due in the next year is shown as a current item. The most common of these debts are mortgages, bonds and debentures, though promissory notes and similar types of debt instruments are often found. Frequently, capital assets have been pledged as security for such borrowings.
It is customary to describe these debt items directly on the balance sheet or in a note attached to it. There must be sufficient detail to tell the reader what kind of security is provided on the loan, the interest rate carried, when the debt becomes repayable and what sinking fund provision, if any, is made for repayment. The sinking fund is the amount set aside each year for repayment of the debt.
The money is usually given to a trustee who may either call in some of the debt securities for repayment, purchase them on the open market for cancellation, or invest the funds in government securities for repayment of the debt at maturity as provided in the terms of the issue.

TWELVE • CORPORATIONS AND THEIR FINANCIAL STATEMENTS 12•13
© CSI GLOBAL EDUCATION INC. (2010)
Shareholders’ EquityThe items in this section of the balance sheet represent the amount that shareholders have at risk in the business. The money that is paid in by the shareholders is designated as capital, and the profits that have been earned over a period of years and not paid out as dividends make up the retained earnings. Another item called contributed surplus sometimes appears in this section. It, too, belongs to the shareholders but originates from sources other than earnings. Thus, the shareholders’ equity section of the balance sheet is made up of the following items:
SHARE CAPITAL (ITEMS 21 AND 22)
This item is the amount received by the company for its shares at the time they were issued. Thus, the share capital shown on the balance sheet is not related in any way to the current market price of the outstanding shares. Share capital would not change from year to year unless the company issued new shares or bought back outstanding ones. Any excess received (when the shares were issued) over par or stated value is shown in contributed surplus.
CONTRIBUTED SURPLUS (ITEM 23)
Contributed surplus originates from sources other than earnings. It may originate when a company sells its stock for more than the stock’s par value or, in the case of no par value shares, its stated value. Thus, if a company’s stock has a par value of $100 per share and is sold for $125 per share, the $100 is applied against the capital stock account, while the difference of $25 is put into the contributed surplus account.
RETAINED EARNINGS (ITEM 24)
Retained earnings is the portion of annual earnings retained by the company after payment of all expenses and the distribution of dividends. The earnings retained each year are reinvested in the business. The reinvestment of accumulated earnings may be held in cash or reinvested in inventories, property or any other of the company’s assets.
Retained earnings also serve as a cushion to absorb losses incurred in bad years. If a company suffers a loss in any year, the loss is deducted from the retained earnings. In this event, each shareholder’s ownership interest in the company is reduced because there are less retained earnings from which dividend distributions can be made. If more losses than earnings accumulate, the resulting figure is designated a deficit.
FOREIGN CURRENCY TRANSLATION ADJUSTMENT (ITEM 25)
This item may appear in consolidated financial statements of companies that have subsidiaries in foreign countries. The assets of these subsidiaries are valued in the currency of the country in which they are resident. If, due to a significant change in the exchange rate, the foreign assets are worth more (or less) at the time the consolidated balance sheet is prepared, this difference is included as an adjustment to shareholders’ equity.
Example: Suppose a Canadian company owned a subsidiary in the United States, and the U.S. dollar had risen dramatically since the subsidiary was purchased. The American company would be more valuable to the Canadian parent after the rise in the U.S. dollar, and the Canadian parent would show this increase as an addition to Foreign currency translation adjustments under shareholders’ equity.

CANADIAN SECURITIES COURSE • VOLUME 112•14
© CSI GLOBAL EDUCATION INC. (2010)
THE EARNINGS STATEMENT
This statement – sometimes called the Income Statement or Profit and Loss Statement – shows how much revenue a company received during the year from the sale of its products or services and the expenses the company incurred for wages, materials, operating costs, taxes and other expense items. The difference between the two is the company’s profit or loss for the year. The amount left over, after payment of income taxes, is net earnings, out of which dividends may be paid to the shareholders.
Thus, the earnings statement reveals the following information about a company:
• Where the income comes from and how it is spent; and
• The adequacy of earnings both to assure the successful operation of the company and to provide income for the holders of its securities.
It should be emphasized that, in analyzing the financial condition of a company, its earning power and cash flow are of primary interest. The proof of a company’s financial strength and its security lies in its ability to generate earnings and cash flow through those earnings. Evidence of this is provided by both the earnings statement and the cash flow statement.
Structure of the Earnings StatementAlthough earnings statements all provide the same kind of financial information, their make-up varies widely, not only among companies in different industries, but also among companies in the same industry. A condensed statement that consists of only three, four or five items is inadequate; an elaborate and more revealing statement may consist of twenty or thirty items. In most statements, about ten to twenty items are found, but no matter how many items there are, they may be readily grouped into one of four broad sections:
• The operating section
• The non-operating section
• The creditors’ section (relates to interest on items in creditors’ section of the balance sheet)
• The owners’ section (relates to shareholders’ equity in the balance sheet)
(The section headings would not normally appear as such in the earnings statement but are included in the sample statement as a learning aid.)
Sections 1 and 2 show origin of income, sections 3 and 4 its distribution.
Generally, a company has two main sources of income. First, there is income from operations, i.e., the income from selling its main products or services. For example, if the company is a public utility, it derives its main income from the sale of gas or electricity. Such income is termed operating income, the income from its main operations.
The second source of income is not directly related to a company’s normal operating activities. Such income would include dividends and interest from investments, rents, royalties from processes or patents it owns and sometimes profits from the sale of capital assets. Since income from these sources is not directly related to a company’s main operations, it is called non-operating income.
THE EARNINGS STATEMENT
TWELVE • CORPORATIONS AND THEIR FINANCIAL STATEMENTS 12•15
© CSI GLOBAL EDUCATION INC. (2010)
If operating and non-operating income are combined in one figure in the earnings statement, it is impossible to gain a true picture of the company’s real earning power. For example, a company might in one year realize a substantial profit from the sale of securities or some other asset. A profit of this kind is not likely to be repeated the next year. Yet if it were combined with operating income, it would be impossible to obtain an accurate indication of the company’s true earning power based upon its main operations. For this reason, good accounting practice requires that operating income and non-operating income be shown separately in the earnings statement, especially if non-operating income is substantial.
The Operating Section (items 28 to 34)The operating section of the earnings statement may be divided into three parts:
• The operating income received by source
• The expense incurred to obtain that income
• The balance or net amount of that income (operating profi t or loss)
The terminology used in describing income in the operating section is not always the same. Railroads and public utilities generally use the term operating revenue. In the case of an industrial concern, the comparable term is sales.
NET SALES AND COST OF GOODS SOLD (ITEMS 28 AND 29)
The earnings statement of a commercial, mercantile or industrial company should start with the amount of net sales (net revenue for other types of company).
Net sales consists of gross sales less:
• Excise tax – applies to the oil, beverage and tobacco industries;
• Returns and allowances – adjustments made as the result of delivery to customers of unsatisfactory goods and returns of reusable containers;
• Discounts – rebates of a percentage of the sale price to customers for prompt payment.
Net sales or net revenue is a key figure in the earnings statement. It is the figure needed to calculate various ratios useful in determining the basic soundness of a company’s financial position. For example, net sales must be known in order to calculate net and gross profit margins. These ratios are used by credit managers, bankers and security analysts in making a detailed investigation of a company’s financial affairs.
From the net sales figure, various operating expenses are deducted. These expenses arise in producing the income received from the sale of the company’s products or services. The first such deduction, in the case of a manufacturing or merchandising concern, is termed cost of goods sold. This item includes costs of labour, raw materials, fuel and power, supplies and services and other kinds of expenses which go directly into the cost of manufacturing or, in the case of a merchandising concern, the cost of goods purchased for resale.
GROSS OPERATING PROFIT (ITEM 30)
Deducting the cost of goods sold from the amount of net sales produces another significant figure, which is termed gross operating profit. This figure is significant because it measures the margin of profit or spread between the cost of goods produced for sale and the net sales. When
CANADIAN SECURITIES COURSE • VOLUME 112•16
© CSI GLOBAL EDUCATION INC. (2010)
the percentage of gross operating profit to net sales is calculated and compared with those of other companies engaged in the same line of business, it provides an indication of whether the company’s merchandising operations are more or less successful in producing profits than its competitors. Between different companies in the same business, differences in the margin of gross operating profit generally reflect differences in managerial ability, although they can also be caused by the inclusion of some expense items in the cost of goods sold of one company and not in another.
OPERATING EXPENSES (ITEMS 31 TO 33)
After gross operating profit has been determined, a number of other operating expense items are then deducted. The first is selling, general and administrative expenses. This item includes such expenses as office expenses, the cost of maintaining a sales organization and accounting staff, advertising expenses and similar types of costs necessary to operate a business. Sometimes this item is combined with the cost of sales item and only one figure is shown to cover all these direct operating expenses. This practice is becoming less common as reporting standards improve.
The next item deducted is amortization. As explained, amortization represents a cost of doing business and as such is deducted from operations. Amortization reduces taxable income for the year, but, as a non-cash expense, does not reduce cash on hand.
Adequate amortization is of great importance to investors and, therefore, one of the figures the CICA requires to be disclosed. The amortization charge is included as part of the cost of goods sold if the related assets are used in the manufacturing process, and, if so, a note would be appended to the statement indicating the treatment.
It is highly significant to the investor if the annual provision for amortization is insufficient. In this event, the earnings of the company would be overstated and securities holders might find that the company was living off its capital or, in other words, not reinvesting sufficiently in plant and equipment to maintain operations. For this reason, the annual allowance and method of calculating amortization should be carefully assessed. Even if accounting amortization is adequate, however, the company may still be living off its capital.
In addition to expense items already mentioned, various other items properly regarded as operating expenses, such as pension expense, are deducted in the operating section. Directors’ fees, remuneration of officers and legal fees may also be charged as separate expense items.
THE NET OPERATING PROFIT (OR LOSS) (ITEM 34)
After deducting the total of all these operating expenses from the gross profit figure, one reaches the net operating profit of the company for the period under review. This is an important figure as it excludes non-operating income. It provides a truer picture of the company’s earning power, as non-operating income items may not be repeated from year to year. Combining them with operating income could unrealistically inflate (or deflate) income in that year.
The Non-Operating Section (items 35 and 36)As previously noted, the non-operating section of the earnings statement reveals the income received from various sources not directly related to the main operations of the company. These include interest and dividends on securities held, rents from no-longer-required properties, royalties on patents, finance charges earned, etc. Such income is often included in sales and, therefore, distorts the sales figure for comparative purposes. Consequently, non-operating income

TWELVE • CORPORATIONS AND THEIR FINANCIAL STATEMENTS 12•17
© CSI GLOBAL EDUCATION INC. (2010)
must be excluded from sales before calculating ratios for comparison with other companies in the same industry.
The total of operating profit and non-operating income is known as earnings before interest and taxes (EBIT) (item 36). This figure is used in many ratio calculations.
The Creditors’ Section (items 37 and 38)How a company distributes its income is shown in the Creditors’ section and the Owners’ section of the earnings statement. Debtholders receive interest payments on their securities or loans to the company and the Government gets its share as tax.
The distribution of income to creditors is usually made in the form of fixed interest charges to banks and other debtholders who have lent money to the company. These interest charges are paid out of income before taxes and are fixed in the sense that the amount of interest that has to be paid on borrowed money is definite. If the company has $1,000,000 worth of bonds outstanding in the hands of investors, and these bonds bear interest at the rate of 9% per annum, there is exactly $90,000 interest to be paid each year.
Interest charges are also fixed in the sense that they must be paid. Non-payment would result in default and give creditors the right to place the company in receivership. In the event of bankruptcy, the assets may be offered for sale and the proceeds used to pay off the claims of the creditors. Consequently, if receivership is to be avoided, the fixed charges incurred by the company must be paid before any of the income may be distributed to the shareholders. (Bank interest and debt interest, even taxes, may also be considered operating expenses on the basis that they are necessary costs of doing business.)
Subtracting the amount of fixed charges from total net income results in a figure that brings us to the owners’ section of the statement. This figure (item 39) is known as net income before taxes (NIBT).
The Owners’ Section (items 40 to 45)
TAXES AND NON-CONTROLLING INTEREST (ITEMS 40 TO 41)
The shareholders of a company are its owners and are entitled to their share of the net earnings of the company. The net earnings (item 45) are total net income less creditors’ charges and income taxes. Most companies today show two types of income taxes: current and future. The current portion represents the money that must be remitted to CRA in that year. The future portion represents the accounting or temporary differences in that year (as already explained under the balance sheet item – future income taxes).
In consolidated statements of companies with non-controlling interests, a deduction is made for the non-controlling interest portion of the earnings of the subsidiary since this does not belong to the shareholders of the parent company. (As explained earlier, this item is also referred to as minority interest.) For example, a company owns 80% of the shares of a subsidiary, which earned $1,000,000 last year. The $1,000,000 will be included in the earnings of the parent company but a corresponding deduction of $200,000 will show as non-controlling interest to represent the 20% that is not owned by the parent company.
CANADIAN SECURITIES COURSE • VOLUME 112•18
© CSI GLOBAL EDUCATION INC. (2010)
EQUITY INCOME (ITEM 42)
Equity income is derived using the equity accounting method, where significant influence exists without control (traditionally when 20% to 50% of the voting shares are owned) and where each company has its own financial statements. One other method, called the cost method, is primarily used for ownership holdings that do not result in significant influence existing (traditionally ownership of less than 20%) and where investments in other companies are reported simply as investments on the financial statements. As explained earlier, the consolidated method is used when a company owns more than 50% of a subsidiary.
Equity income is earned when a company reports its share of an entity subject to significant influence earnings. For example, Trans-Canada Retail Stores Ltd. owns 25% of Alberta Retail Stores Ltd., and Alberta Retail Stores earned $20,000 (after tax) in a particular fiscal year. Trans-Canada Retail Stores, in its earnings statement, reports $5,000 (25%) of this as equity income. This item might alternatively be called equity earnings, earnings from an entity subject to significant influence, earnings from long-term investments, or something similar.
Certain earnings calculations must be adjusted for equity income because, while the company reports this income, it does not actually receive it in cash. Thus, equity income is a non-cash source of funds, just as amortization and depletion are non-cash uses of funds. Company earnings need to be reduced by the amount of equity income when calculating ratios when a true picture of the company’s cash earnings is required.
If an entity subject to significant influence experiences a loss, the company will report its share of the loss on its earnings statement. This entry, called Equity loss or something similar, would reduce earnings on the company’s earnings statement. But, as with equity income, an equity loss is also a non-cash item. The amount of the equity loss would therefore have to be added back to the company’s earnings when calculating ratios when a true picture of the company’s cash earnings is required.
EXTRAORDINARY GAINS OR LOSSES (ITEM 44)
In any given year, a company may experience a gain or loss that is not expected to occur frequently, is not typical of normal business activity, and is not dependent primarily on decisions by management or owners. A company may receive a “windfall-type” capital gain through an expropriation, or a loss resulting from a flood, earthquake or revolution, etc. The amount of this special gain or loss is usually stated as an extraordinary item on the earnings statement, after all other revenues and expenses have been accounted for. (Another category – unusual items – results from occurrences that are typical of the normal business activity of the company even though caused by unusual circumstances, e.g., unusual bad debt or inventory losses.)
If extraordinary items were included in the company’s income, the results for the year would be distorted. Accordingly, companies report earnings both before and after the inclusion of extraordinary items. To make year-to-year comparisons meaningful, any calculations of a company’s net earnings for a year should always be made before extraordinary items.
NET EARNINGS AFTER EXTRAORDINARY ITEMS (ITEM 45)
The earnings statement finishes with net earnings (or deficit), the amount of profit from the year’s operations that may be available for distribution to shareholders. This may also be referred to as net income.
At this point net earnings are transferred to the retained earnings statement. This is where you will find any dividends paid to shareholders that year.

TWELVE • CORPORATIONS AND THEIR FINANCIAL STATEMENTS 12•19
© CSI GLOBAL EDUCATION INC. (2010)
THE RETAINED EARNINGS STATEMENT
The profit or loss in a company’s most recent year is determined in the earnings statement and then transferred to the Retained Earnings Statement. Retained earnings are profits earned over the years that have not been paid out to shareholders as dividends. These retained profits accrue to the shareholders, but the directors have decided for the present time to reinvest them in the business.
The retained earnings statement provides a record of the profits kept in the business year after year. Profit for the current year is added to, or the loss is subtracted from, the balance of retained earnings shown in the statement from the previous year. Dividends declared during the year are subtracted in this statement.
In addition to showing earnings and dividends, the retained earnings statement is used to record adjustments relating to the earnings of prior periods. From time to time, amounts may be set aside from retained earnings as a reserve against possible events such as a decline in the value of raw materials inventory purchased at a time of high commodity prices.
The use of a reserve in the retained earnings statement does not mean that a fund of cash has been set aside for the purpose described. It merely means that a portion of the retained earnings has been earmarked as unavailable for distribution to shareholders. The provision of a fund to meet some future contingency or event would require separate action on the part of the board of directors. The establishment of a reserve, in itself, has limited usefulness, except to inform readers or investors of possible plans or contingencies of the company.
A new final retained earnings figure is determined and carried to the balance sheet where it appears in the shareholders’ equity section (item 24). Thus, the retained earnings statement provides a link between the earnings statement and the balance sheet.
THE CASH FLOW STATEMENT
While the balance sheet shows a company’s financial position at a specific point in time and the earnings statement summarizes the company’s operating activities for the year, neither statement shows how the company’s financial position changed from one period to the next. The cash flow statement fills this gap between the balance sheet and the earnings statement by providing information about how the company generated and spent its cash during the year.
The cash flow statement assists users of financial statements in evaluating the liquidity and solvency of a company. In assessing the quality of a company, the user needs to determine if the company will be able to:
• Pay its creditors, especially in business downturns;
• Fund its needs internally if necessary; and
• Reinvest and continue to pay dividends to shareholders.
A review of the cash flow statements over a number of years may illustrate trends that might otherwise go unnoticed. The cash flow statement often provides a clearer picture of the viability
THE RETAINED EARNINGS STATEMENT
THE CASH FLOW STATEMENT
CANADIAN SECURITIES COURSE • VOLUME 112•20
© CSI GLOBAL EDUCATION INC. (2010)
of a company than does the earnings statement, as the cash flow statement measures actual cash generated from the business.
For purposes of the cash flow statement, “cash” normally includes cash held in bank accounts, net of short-term borrowings, and temporary investments. In some cases, other elements of working capital might be included when they are equivalent to cash. This financial statement details the changes in cash, and the reasons for them.
A cash flow statement shows the company’s cash flows for the period under the following three headings:
• Operating Activities
• Financing Activities
• Investing Activities
Operating ActivitiesThe cash flow statement begins by looking at those accounts that directly reflect the business activities of the company – those activities requiring an inflow of cash or outflow of cash, which generate sales and expenses during the year.
It begins with income before extraordinary items (item 43). As previously explained, extraordinary items are excluded from the income figure in order to make useful year-to-year comparisons, as well as comparisons with other companies. Added back to income are all items not involving cash (item 32) such as amortization. Future income taxes (item 49) and non-controlling interest (item 41) are added back and equity income (item 42) is subtracted, as none are actual cash transactions for the company.
The “Net change in operating working capital items” (item 50) represents changes in the various asset and liabilities accounts that appear on the balance sheet. The dollar amounts of these accounts in the current year are compared to the dollar amounts of the accounts in the previous year. The change in each account is recorded in the cash flow statement. Operating working capital items include accounts such as:
• Accounts receivable
• Inventories
• Accounts payable
• Accrued liabilities
• Interest payable
• Taxes payable
• Advances from customers
For example, the receivables account records invoices that have been sent to customers, but have not yet been paid. The company includes the sale in revenue but has not yet received the money. When the invoice is paid, the receivables account declines as the cash account increases.
Why are changes in these accounts considered important? For example, if accounts receivable increases substantially in the current year, the company’s sales revenue will be much higher than the amount of cash collected over the period. This may require further investigation on the part of the analyst. It could be an indication that the company has a poorly managed receivables

TWELVE • CORPORATIONS AND THEIR FINANCIAL STATEMENTS 12•21
© CSI GLOBAL EDUCATION INC. (2010)
department or that it is extending credit to customers that are unable to pay. More importantly, a company needs a regular stream of cash flowing into the business to maintain its operations. If credit sales go uncollected for an extended period of time, it might be difficult for the company to pay its bills or meet interest charges. While the company may look good on paper because its revenues are up, as demonstrated by the earnings statement, the company may shortly be in serious financial difficulty if it cannot generate enough cash to pay its creditors.
Financing Activities (items 51 to 54)Cash flows from financing activities involve transactions used to finance the company. If the company has issued new shares (item 51) or debt (item 53), cash flows into the company. If the company repays debt (item 52) or pays dividends to the shareholders (item 54), cash flows out of the company. This section is of particular interest to the shareholders of the company as it highlights changes to a company’s capital structure – the overall use of debt and equity financing. A substantial increase in debt, or issuance of new shares, may negatively affect the shareholders’ equity in the company.
Investing Activities (items 55 to 57)Investing activities highlight what the company did with any money not used in the direct operation of the company. It includes any investments that the company made in itself, such as the purchase of new capital assets (item 55) or disposal of such assets (item 56). As well, in this section you will find any dividends actually received from an investment in another company (item 57) or the initial purchase of an interest in another company.
The Change in Cash Flow (items 58 to 60)The final section of the cash flow statement sums up the cash flows from operating, investing and financing activities to arrive at the increase (decrease) in cash (item 58) for the current fiscal year. As a final check, the statement compares the cash and temporary investments at the beginning of the year (item 59) to the cash and temporary investments at the end of the year (item 60). Since the cash flow statement looks at the actual change in the cash position for the year, the final balance in cash and temporary investments (item 60) is comprised of cash (item 1) and temporary investments (item 2) found in the year-end balance sheet for Trans-Canada Retail. This figure should be identical to the net increase (decrease) found in item 58. Ideally the company should always have a positive net cash flow. If it does not, it is important to find out why.
Supplemental Information (items 61 to 62)Information relating to both interest paid and income taxes paid are required to be disclosed in the cash flow statement. Since these items are not specifically identified when the indirect method is used, these items are shown as supplementary information.
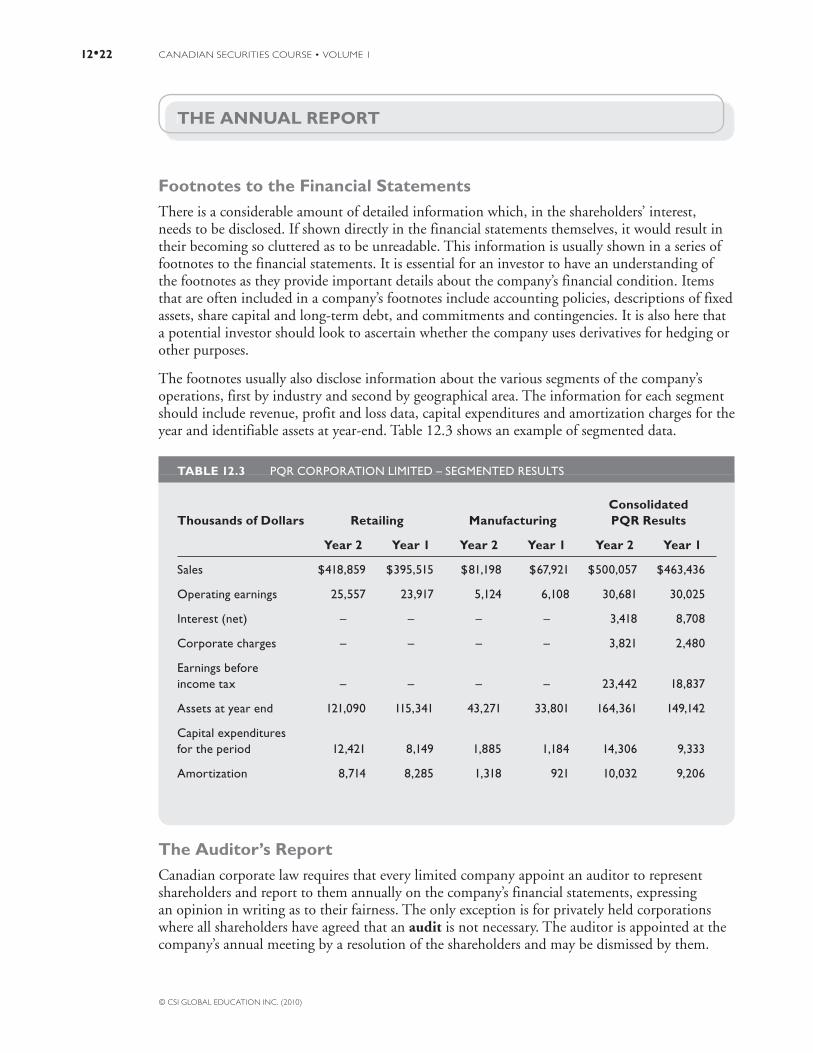
CANADIAN SECURITIES COURSE • VOLUME 112•22
© CSI GLOBAL EDUCATION INC. (2010)
THE ANNUAL REPORT
Footnotes to the Financial StatementsThere is a considerable amount of detailed information which, in the shareholders’ interest, needs to be disclosed. If shown directly in the financial statements themselves, it would result in their becoming so cluttered as to be unreadable. This information is usually shown in a series of footnotes to the financial statements. It is essential for an investor to have an understanding of the footnotes as they provide important details about the company’s financial condition. Items that are often included in a company’s footnotes include accounting policies, descriptions of fixed assets, share capital and long-term debt, and commitments and contingencies. It is also here that a potential investor should look to ascertain whether the company uses derivatives for hedging or other purposes.
The footnotes usually also disclose information about the various segments of the company’s operations, first by industry and second by geographical area. The information for each segment should include revenue, profit and loss data, capital expenditures and amortization charges for the year and identifiable assets at year-end. Table 12.3 shows an example of segmented data.
TABLE 12.3 PQR CORPORATION LIMITED – SEGMENTED RESULTS
Thousands of Dollars Retailing ManufacturingConsolidatedPQR Results
Year 2 Year 1 Year 2 Year 1 Year 2 Year 1
Sales $418,859 $395,515 $81,198 $67,921 $500,057 $463,436
Operating earnings 25,557 23,917 5,124 6,108 30,681 30,025
Interest (net) – – – – 3,418 8,708
Corporate charges – – – – 3,821 2,480
Earnings before income tax – – – – 23,442 18,837
Assets at year end 121,090 115,341 43,271 33,801 164,361 149,142
Capital expenditures for the period 12,421 8,149 1,885 1,184 14,306 9,333
Amortization 8,714 8,285 1,318 921 10,032 9,206
The Auditor’s ReportCanadian corporate law requires that every limited company appoint an auditor to represent shareholders and report to them annually on the company’s financial statements, expressing an opinion in writing as to their fairness. The only exception is for privately held corporations where all shareholders have agreed that an audit is not necessary. The auditor is appointed at the company’s annual meeting by a resolution of the shareholders and may be dismissed by them.
THE ANNUAL REPORT

TWELVE • CORPORATIONS AND THEIR FINANCIAL STATEMENTS 12•23
© CSI GLOBAL EDUCATION INC. (2010)
In Canada the auditor’s report conventionally has three paragraphs. The introductory paragraph identifies the financial statements covered by the auditor’s report and distinguishes between the responsibilities of management and the responsibilities of the auditor.
The second paragraph, known as the scope paragraph, states how the audit was conducted. The purpose of the second paragraph is for the auditor to inform the reader that the audit was planned and conducted in accordance with Canadian generally accepted auditing standards, and that the auditor has made judgments in applying these standards. It explains to the reader the nature and extent of an audit and the degree of assurance it provides.
The third paragraph gives the auditor’s opinion on the financial statements of the company being audited. This paragraph states that the financial statements present fairly the financial position of the company, the results of the operations and the cash flows for the period, in accordance with generally accepted accounting principles.
In some cases, the auditor may find that generally accepted accounting principles have not been used or may be unable to form an opinion on one or more of the financial statements submitted to the shareholders. In such cases, the auditor would state that he or she was unable to give any opinion whatsoever, or else include in the report his or her qualifications regarding the dubious items. A qualified report should be regarded as a signal that the financial statements may not present fairly the financial position or results of operations of the company in question. In some provinces, qualified reports are not allowed. Accordingly, shareholders and investors should exercise caution in appraising the company’s financial status.
Trends in accounting standardsIn Canada, financial statements of publicly-traded companies have been historically prepared based on Generally Accepted Accounting Principles (GAAP). Under this system, and because of differences in operating environments for companies in different industries, GAAP allowed for some flexibility for companies to choose among accounting standards. This flexibility gave the management of a company the ability or discretion to select accounting standards that best reflect its operations. These decisions can substantially affect the income figures reported by the company. A change to a different accounting practice can alter the revenue and net income of a company without an actual change in the operating performance of the company occurring.
By January 1, 2011, Canada will move from GAAP to International Financial Reporting Standards (IFRS), a globally accepted high-quality accounting standard already used by public companies in several countries around the world. This change will enhance transparency and increase comparability of Canadian publicly-traded companies with those using IFRS and help Canadian companies to access international capital. A transition period is in place and some IFRS standards are currently active.

CANADIAN SECURITIES COURSE • VOLUME 112•24
© CSI GLOBAL EDUCATION INC. (2010)
FOR INFORMATION PURPOSES ONLY:
International Financial Reporting Standards (IFRS)
The major ‘philosophical’ difference between GAAP and IFRS methodologies is that IFRS is almost entirely principle-based whereas Canadian and U.S. GAAP are primarily rules-based.
Rules-based accounting is more rigid, meaning specifi c procedures are observed when preparing fi nancial statements. This makes for less ambiguity but also increases the complexity of the process. There is also more diffi culty in making rules that fi t every situation.
In principle-based accounting, guidelines are more general because the goal is to have the completed fi nancial statements achieve a set of good reporting objectives. An example of a good reporting objective is suffi cient disclosure of data so that an investor can make an objective analysis.
In comparison to GAAP, IFRS requires a more extensive and detailed disclosure by the company to explain why particular accounting treatments are utilized.
The Canadian Public Accountability Board (CPAB) was created in 2003 with a primary mandate of strengthening public confidence in the “integrity of financial reporting of public companies in Canada by promoting high quality, independent auditing” and the credibility of financial statements in general. Major accounting firms in Canada (who already conduct 85% of the public company audits) are reviewed annually and are subject to a comprehensive examination of their quality control policies and procedures.
The Securities and Exchange Commission (SEC) in the U.S. also instituted new rules requiring chief executives and financial officers of large publicly traded companies to personally vouch for and file sworn statements attesting to the accuracy of their companies’ financial statements. As with the creation of the CPAB in Canada, the SEC rules were created with a goal of improving public confidence in the financial markets. To achieve this, the Public Company Accounting Oversight Board was created by the Sarbanes-Oxley Act of 2002. The Board is a private-sector, non-profit corporation created to oversee the auditors of public companies in order to protect the interests of investors and further the public interest in the preparation of audited financial reports. The Board will directly perform quality reviews of audit procedures and practices, and will have the power to discipline accounting firms as well as individual accountants.
Complete the on-line activity associated with
this section.

TWELVE • CORPORATIONS AND THEIR FINANCIAL STATEMENTS 12•25
© CSI GLOBAL EDUCATION INC. (2010)
SUMMARY
After reading this chapter, you should be able to:
1. Describe the format of and the items on the balance sheet and explain how the items are classifi ed.
• A balance sheet presents a snapshot of a company’s operations at a specifi c date. The statement shows the book value of its assets, liabilities and shareholders’ equity.
• Assets are what the company owns, including buildings, machinery, inventory and investments. Liabilities are the company’s obligations, including what it owes to creditors, suppliers, workers and the government. Shareholders’ equity is the claim on the company’s assets by its owners, the equity shareholders.
• Assets and liabilities are classifi ed as current when their use is expected to occur normally within a year; they are classifi ed as long-term when they have a more permanent status. For example, inventory would be a current asset, while land and buildings would be long-term assets; debt due in the upcoming 12 months would be a current liability, while debt due several years in the future would be a long-term liability.
• The basic accounting relationship shows how the balance sheet balances:
Assets = Liabilities + Shareholders’ Equity.
2. Describe the structure of the earnings statement and explain the sources of net income (or net earnings).
• An earnings statement shows a company’s profi tability: the revenue received from selling its products, the expenses incurred to generate the revenue, and the net income (or loss) from its operations.
• The operating section shows how the company generated revenue from selling its products; the non-operating section shows sources of income not directly related to normal operating activities (e.g., income from investments).
• The creditors’ and the owners’ sections show how a company distributes its income, for example, the payment of interest to debtholders and tax to government.
SUMMARY
CANADIAN SECURITIES COURSE • VOLUME 112•26
© CSI GLOBAL EDUCATION INC. (2010)
3. Describe the purpose of the retained earnings statement and describe its link with the balance sheet and earnings statement.
• A retained earnings statement records the profi ts kept in the business and provides a direct link with the earnings statement and balance sheet.
• Profi t for the current year is added to, or the loss is subtracted from, the balance of retained earnings shown in the statement from the previous year. The net result is an end-of-year balance that then gets reported as retained earnings in the shareholders’ equity section of the balance sheet.
4. Describe the components of the cash fl ow statement and classify an accounting activity or item as a cash fl ow from operating, fi nancing or investing activities.
• The cash fl ow statement provides a look at how a company generated and spent its cash during the period and reports the net change in the cash account over the period.
• Operating activities directly refl ect the business activities of the company: those that require an infl ow or outfl ow of cash to generate sales and expenses during the year. Financing activities involve transactions used to fi nance the company and include the issue of new shares, new debt or the payment of dividends. Investing activities highlight what the company did with any money not used in its direct operations.
5. Explain the importance of the notes to the fi nancial statements and the auditor’s report.
• Notes to the fi nancial statements provide important details about the company’s fi nancial condition not reported in the actual fi nancial statements, for example, explanations of accounting policies or the descriptions of fi xed assets.
• The auditor’s report presents an independent opinion on the fi nancial statements of the company being audited. The report is important because it ensures that the company’s fi nancial statements are fair and have been prepared in accordance with generally accepted accounting principles.
APPENDIX A - SAMPLE FINANCIAL STATEMENTS
The financial statements on the following pages should be referred to when reviewing this chapter. To make them easier to understand, these financial statements differ from real financial statements in the following ways:
1. Comparative (previous year’s) fi gures are not shown.
2. No Notes to Financial Statements are included.
3. The consecutive numbers on the left-hand side of the statements, which are used in explaining ratio calculations, do not appear in real reports.
Note: It is assumed that Trans-Canada Retail Stores Ltd. is a non-food retail chain.
APPENDIX A - SAMPLE FINANCIAL STATEMENTS
Note: It is assumed that Trans-Canada Retail Stores Ltd. is a non-food retail chain.
Now that you’ve completed this
chapter and the on-line activities,
complete this post-test.

TWELVE • CORPORATIONS AND THEIR FINANCIAL STATEMENTS 12•27
© CSI GLOBAL EDUCATION INC. (2010)
Trans-Canada Retail Stores Ltd.CONSOLIDATED BALANCE SHEETas at December 31, 20XX
ASSETS
CURRENT ASSETS1. Cash and bank balances ............................................................................................................... $ 129,0002. Temporary investments – at cost, which approximates market value ........................... 2,040,0003. Accounts receivable (less allowances for doubtful accounts – $9,000) ........................ 975,0004. Inventories of merchandise – valued at the lower cost or net realizable value ........... 9,035,0005. Prepaid expenses ........................................................................................................................... 59,0006. Total Current Assets ................................................................................................................... 12,238,0007. Investment in affiliated company ............................................................................................... 917,0008. CAPITAL ASSETS, at cost
Land .................................................................................................................. $ 1,370,000Buildings ........................................................................................................... 2,460,000Equipment ....................................................................................................... 6,750,000
10,580,000Accumulated amortization ........................................................................ (4,260,000) 6,320, 000
9. DEFERRED CHARGES (unamortized expenses and discount on bond issue) ........... 136,000
INTANGIBLE ASSET
10. Goodwill ......................................................................................................................................... 150,00011. TOTAL ASSETS ............................................................................................................................ $ 19,761,000
LIABILITIES
CURRENT LIABILITIES12. Bank advances ............................................................................................................................... $ 1,630,00013. Accounts payable ......................................................................................................................... 2,165,00014. Dividends payable ........................................................................................................................ 97,000
15. Income taxes payable .................................................................................................................. 398,00016. First mortgage bonds due within one year ........................................................................... 120,00017. Total Current Liabilities ............................................................................................................. $ 4,410,00018. FUTURE INCOME TAXES........................................................................................................ 485,00019. NON-CONTROLLING INTEREST IN SUBSIDIARY COMPANIES ............................ 157,000
FUNDED DEBT (due after one year)
20. 11% First Mortgage Sinking Fund Bonds due Dec. 30, 2027 ............................................ 1,350,0006,402,000
SHAREHOLDERS’ EQUITY — CAPITAL STOCK
21. $2.50 Cumulative Redeemable Preferred – Authorized 20,000 shares, $50 par value – issued and outstanding 15,000 shares ...................................................................... 750,000
22. Common – Authorized 500,000 shares of no par value – issued and outstanding 350,000 shares .............................................................................................................................. 1,564,000
23. CONTRIBUTED SURPLUS ...................................................................................................... 150,00024. RETAINED EARNINGS ............................................................................................................. 10,835,00025. FOREIGN EXCHANGE ADJUSTMENT ............................................................................... 60,00026. Total Shareholders’ Equity......................................................................................................... 13,359,00027. Total Liabilities & Shareholders’ Equity .................................................................................. $ 19,761,000
Approved on behalf of the Board:
[Signature], Director
[Signature], Director

CANADIAN SECURITIES COURSE • VOLUME 112•28
© CSI GLOBAL EDUCATION INC. (2010)
Trans-Canada Retail Stores Ltd.CONSOLIDATED EARNINGS STATEMENTas at December 31, 20XX
OPERATING SECTION
28. Net Sales $ 43,800,000
29. Less: Cost of goods sold ............................................................................................................ 28,250,000
30. Gross Operating Profit .............................................................................................................. 15,550,000
31. Less: Selling, administrative and general expenses ............................. $ 12,752,000
32. Less: Amortization ...................................................................................... 556,000
33. Less: Directors’ remuneration ................................................................ 110,000 13,418,000
34. Net Operating Profit ................................................................................................................... 2,132,000
NON-OPERATING SECTION
35. Income from investments ........................................................................................................... 130,000
36. TOTAL OPERATING AND NON-OPERATING SECTION .......................................... 2,262,000
CREDITORS’ SECTION
37. Less: Bank interest ....................................................................................... $ 120,700
38. Less: Bond interest ...................................................................................... 168,300 289,000
OWNERS’ SECTION
39. Earnings before income taxes .................................................................................................. 1,973,000
40. Less: Income Taxes:
Current........................................................................................................... $ 830,000
Future ............................................................................................................. 50,000 880,000
41. Less: Non-controlling Interest in earnings of subsidiary companies ............................. 12,000
42. Equity Income – affiliated company ........................................................................................ 5,000
43. Earnings before extraordinary item ....................................................................................... $ 1,086,000
44. Extraordinary gain on sale of capital assets (net of taxes) .............................................. 200,000
45. Net earnings.................................................................................................................................. $ 1,286,000
Trans-Canada Retail Stores Ltd.CONSOLIDATED RETAINED EARNINGS STATEMENTas at December 31, 20XX
46. Balance at beginning of year...................................................................................................... $ 9,936,500
45. Net earnings for the year .......................................................................................................... 1,286,000
11,222,500
Deduct Dividends -
47. on preferred shares ($2.50 per share) ................................................... $ 37,500
48. on common shares ($1.00 per share) ..................................................... 350,000 387,500
24. Balance at end of year ................................................................................................................. $ 10,835,000

TWELVE • CORPORATIONS AND THEIR FINANCIAL STATEMENTS 12•29
© CSI GLOBAL EDUCATION INC. (2010)
Trans-Canada Retail Stores Ltd.CONSOLIDATED CASH FLOW STATEMENTas at December 31, 20XX
OPERATING ACTIVITIES43. Earnings before extraordinary items ..................................................................................... $ 1,086,00032. Add items not involving cash – Amortization ..................................................................... 556,00049. Future income taxes ................................................................................................................... 50,00041. Non-controlling interest in income of subsidiary companie ........................................... 12,00042. Equity income – affiliated company ........................................................................................ *(5,000)50. Net change in operating working capital items .................................................................. (401,000)CASH FLOWS FROM OPERATING ACTIVITIES ..................................................................... 1,298,000
FINANCING ACTIVITIES51. Proceeds from share issue ........................................................................................................ 750,00052. Repayment of long-term debt.................................................................................................. (400,000)53. Borrowing of long-term debt .................................................................................................. 50,00054. Dividends paid .............................................................................................................................. (387,500)CASH FLOWS FROM FINANCING ACTIVITIES ..................................................................... 12,500
INVESTING ACTIVITIES55. Acquisitions of capital assets ................................................................................................... (900,000)56. Proceeds from disposal of capital assets .............................................................................. 75,00057. Dividends received from affiliated company ........................................................................ 2,000CASH FLOWS FROM INVESTING ACTIVITIES ....................................................................... (823,000)
58. INCREASE IN CASH AND TEMPORARY INVESTMENTS .......................................... 487,50059. CASH AND TEMPORARY INVESTMENTS – BEGINNING OF YEAR..................... 1,681,50060. CASH AND TEMPORARY INVESTMENTS – END OF YEAR .................................... 2,169,000
SUPPLEMENTAL INFORMATION61. INTEREST PAID ......................................................................................................................... 289,00062. INCOME TAXES PAID ............................................................................................................. $ 432,000
* ( ) = deduction
AUDITORS’ REPORT
To the Shareholders of Trans-Canada Retail Stores Ltd.
We have audited the balance sheet of Trans-Canada Retail Stores Ltd. as at December 31, 20XX and the statements of earnings, retained earnings and cash flows for the year then ended. These financial statements are the responsibility of the company’s management. Our responsibility is to express an opinion on these financial statements based on our audit.
We conducted our audit in accordance with Canadian generally accepted auditing standards. Those standards require that we plan and perform an audit to obtain reasonable assurance whether the financial statements are free of material misstatement. An audit includes examining, on a test basis, evidence supporting the amounts and disclosures in the financial statements. An audit also includes assessing the accounting principles used and significant estimates made by management, as well as evaluating the overall financial statement presentation.
In our opinion, these financial statements present fairly, in all material respects, the financial position of the company as at December 31, 20XX and the results of its operations and the cash flows for the year then ended in accordance with Canadian generally accepted accounting principles.
Toronto, Ontario
February 8, 20XX Signature of Auditors


© CSI GLOBAL EDUCATION INC. (2010) G•1
Glossary
The following is a glossary of investment terms that will help you study for the CSC examination and increase your overall knowledge of the investment industry. Some of the terms also have a general meaning, but only their specialized investment industry meaning is given here. Words in bold face type within defi nitions have their own glossary defi nitions. Note that this list is not complete: it should be used in conjunction with your own defi nitions of terms compiled during your studies and with the Index.

© CSI GLOBAL EDUCATION INC. (2010)
GLOSSARY G•3
Accounts PayableMoney owed by a company for goods or services purchased, payable within one year. A current liability on the balance sheet.
Accounts ReceivableMoney owed to a company for goods or services it has sold, for which payment is expected within one year. A current asset on the balance sheet.
Accredited InvestorAn individual or institutional investor who meets certain minimum requirement relating to income, net worth, or investment knowledge. Also referred to as a sophisticated investor.
Accrued InterestInterest accumulated on a bond or debenture since the last interest payment date.
Adjusted Cost BaseThe deemed cost of an asset representing the sum of the amount originally paid plus any additional costs, such as brokerage fees and commissions.
Advance-Decline LineA tool used in technical analysis to measure the breadth of the market. The analyst takes difference between the number of stocks that increased in value each day less the number that have decreased.
Affi liated CompanyA company with less than 50% of its shares owned by another corporation, or one whose stock, with that of another corporation, is owned by the same controlling interests.
After Acquired ClauseA protective clause found in a bond’s indenture or contract that binds the bond issuer to pledging all subsequently purchased assets as part of the collateral for a bond issue.
After MarketSee Secondary Market.
Agency TradersManage trades for institutional clients. They do not trade the dealer member’s capital, and they trade only when acting on behalf of clients. Agency traders do not merely take orders; they must manage institutional orders with minimal market impact and act as the client’s eyes and ears for relevant market intelligence.
AgentAn investment dealer operates as an agent when it acts on behalf of a buyer or a seller of a security and does not itself own title to the securities at any time during the transactions. See also Principal.
All or None Order (AON)An order that must be executed in its entirety – partial fi lls will not be accepted.
AllocationThe administrative procedure by which income generated by the segregated fund’s investment portfolio is fl owed through to the individual contract holders of the fund.
AlphaA statistical measure of the value a fund manager adds to the performance of the fund managed. If alpha is positive, the manager has added value to the portfolio. If the alpha is negative, the manager has underperformed the market.
Alternative Trading Systems (ATS)Privately-owned computerized networks that match orders for securities outside of recognized exchange facilities. Also referred to as Proprietary Electronic Trading Systems (PETS).
American OptionAn option that can be exercised at any time during the option’s lifetime. See also European Option.
AmortizationGradually writing off the value of an intangible asset over a period of time. Commonly applied to items such as goodwill, improvements to leased premises, or expenses of a new stock or bond issue. See also Depreciation.
Annual Information Form (AIF)A document in which an issuer is required to disclose information about presently known trends, commitments, events or uncertainties that are reasonably expected to have a material impact on the issuer’s business, fi nancial condition or results of operations. Although investors are typically not provided with the AIF, the prospectus must state that it is available on request.
Annual ReportThe formal fi nancial statements and report on operations issued by a company to its shareholders after its fi scal year-end.
AnnuitantPerson on whose life the maturity and death benefi t guarantees are based. It can be the contract holder or someone else designated by the contract holder. In registered plans, the annuitant and contract holder must be the same person.
AnnuityA contract usually sold by life insurance companies that guarantees an income to the benefi ciary or annuitant at some time in the future. The income stream can be very fl exible. The original purchase price may be either a lump sum or a stream of payments. See Deferred Annuity and Immediate Annuity.
Any Part OrderA type of order in which the client will accept all stock in odd, broken or standard trading units up to the full amount of the order.
Approved ParticipantsSee Participating Organization.
ArbitrageThe simultaneous purchase of a security on one stock exchange and the sale of the same security on another exchange at prices which yield a profi t to the arbitrageur.
ArbitrationA method of dispute resolution in which an independent arbitrator is chosen to assist aggrieved parties recover damages.
ArrearsInterest or dividends that were not paid when due but are still owed. For example, dividends owed but not paid to cumulative preferred shareholders accumulate in a separate account (arrears). When payments resume, dividends in arrears must be paid to the preferred shareholders before the common shareholders.
AskThe lowest price a seller will accept for the fi nancial instrument being quoted. See also Bid.
AssetEverything a company or a person owns or has owed to it. A balance sheet category.
© CSI GLOBAL EDUCATION INC. (2010)
CANADIAN SECURITIES COURSEG•4
Asset AllocationApportioning investment funds among different categories of assets, such as cash, fi xed income securities and equities. The allocation of assets is built around an investor’s risk tolerance.
Asset-backed commercial paper (ABCP)A type of security that has a maturity date of less than one year, typically in the range of 90 to 180 days, with a legal and design structure of an asset-backed security.
Asset MixThe percentage distribution of assets in a portfolio among the three major asset classes: cash and equivalents, fi xed income and equities.
AssignmentThe random process by which the clearing corporation allocates the exercise of an option to a member fi rm. A client of that member fi rm is then chosen to fulfi l the obligation taken on when the option was written, by: in the case of a put, purchasing the underlying security from the put holder; or, in the case of a call, delivering the underlying security to the call holder. See also Exercise.
AssurisA not for profi t company whose member fi rms are issuers of life-insurance contracts and whose mandate is to provide protection to contract holders against the insolvency of a member company,
At-the-MoneyAn option with a strike price equal to (or almost equal to) the market price of the underlying security. See also Out-of-the-money and In-the-money.
Attribution RulesA Canada Revenue Agency rule stating that an investor cannot avoid paying taxes at their marginal rate by transferring assets to other family members who have lower personal tax rates.
Auction MarketMarket in which securities are bought and sold by brokers acting as agents for their clients, in contrast to a dealer market where trades are conducted over-the-counter. For example, the Toronto Stock Exchange is an auction market.
Auction Preferred SharesA type of preferred share that offers a dividend rate determined by an auction between the holder and the issuer.
AuditA professional review and examination of a company’s fi nancial statements required under corporate law for the purpose of ensuring that the statements are fair, consistent and conform with Generally Accepted Accounting Principles (GAAP).
Authorized SharesThe maximum number of common (or preferred) shares that a corporation may issue under the terms of its charter.
Automatic StabilizersElements in the economy which mitigate the extremes of the business cycle by running counter to it. Example: government payouts for unemployment insurance in recessionary periods.
Autorité des marchés fi nanciers (Financial Services Authority) (AMF)The body that administers the regulatory framework surrounding Québec’s fi nancial sector: securities sector, the distribution of fi nancial products and services sector, the fi nancial institutions sector and the compensation sector.
AveragesA statistical tool used to measure the direction of the market. The most common average is the Dow Jones Industrial Average.
Back-End LoadA sales charge applied on the redemption of a mutual fund.
Balance of PaymentsCanada’s interactions with the rest of the world which are captured here in the current account and capital account.
Balance SheetA fi nancial statement showing a company’s assets, liabilities and shareholders’ equity on a given date.
BalloonIn some serial bond issues or mortgages an extra-large amount may mature in the fi nal year of the series – the “balloon” payment.
Bank of CanadaCanada’s central bank which exercises its infl uence on the economy by raising and lowering short-term interest rates.
Bank RateThe minimum rate at which the Bank of Canada makes short-term advances to the chartered banks, other members of the Canadian Payments Association and investment dealers who trade in the money market.
Bankers’ AcceptanceA commercial draft (i.e., a written instruction to make payment) drawn by a borrower for payment on a specifi ed date. A BA is guaranteed at maturity by the borrower’s bank. As with T-bills, BAs are sold at a discount and mature at their face value, with the difference representing the return to the investor. BAs may be sold before maturity at prevailing market rates, generally offering a higher yield than Canada T-bills.
Banking GroupA group of investment fi rms, each of which individually assumes fi nancial responsibility for part of an underwriting.
BankruptThe legal status of an individual or company that is unable to pay its creditors and whose assets are therefore administered for its creditors by a Trustee in Bankruptcy.
Basis PointOne-hundredth of a percentage point of bond yields. Thus, 1% represents 100 basis points.
BearOne who expects that the market generally, or the market price of a particular security, will decline. See also Bull.
Bear MarketA sustained decline in equity prices. Bear markets are usually associated with a downturn (recession or contraction) in the business cycle.
Bearer SecurityA security (stock or bond) which does not have the owner’s name recorded in the books of the issuing company nor on the security itself and which is payable to the holder, i.e., the holder is the deemed owner of the security. See also Registered Security.
Benefi cial OwnerThe real (underlying) owner of an account, securities or other assets. An investor may own shares which are registered in the name of an investment dealer, trustee or bank to facilitate transfer or to preserve anonymity,
© CSI GLOBAL EDUCATION INC. (2010)
GLOSSARY G•5
but the investor would be the benefi cial owner.
Benefi ciaryThe individual or individuals who have been designated to receive the death benefi t. Benefi ciaries may be either revocable or irrevocable.
Best Efforts UnderwritingThe attempt by an investment dealer (underwriter) to fulfi ll a customer’s order or to sell an issue of securities, to the best of their abilities, but does not guarantee that any or all of the issue will be sold. The investment dealer is not held liable to fulfi ll the order or to sell all of the securities. The underwriter acts as an agent for the issuer in distributing the issue.
BetaA measure of the sensitivity (i.e., volatility) of a stock or a mutual fund to movements in the overall stock market. The beta for the market is considered to be 1. A fund that mirrors the market, such as an index fund, would also have a beta of 1. Funds or stocks with a beta greater than 1 are more volatile than the market and are therefore riskier. A beta less than 1 is not as volatile and can be expected to rise and fall by less than the overall market.
BidThe highest price a buyer is willing to pay for the fi nancial instrument being quoted. See also Ask.
Blue ChipAn active, leading, nationally known common stock with a record of continuous dividend payments and other strong investment qualities. The implication is that the company is of “good” investment value.
Blue SkyA slang term for laws that various Canadian provinces and American states have enacted to protect the public against securities frauds. The term blue skyed is used to indicate that a new issue has been cleared by a securities commission and may be distributed.
BondA certifi cate evidencing a debt on which the issuer promises to pay the holder a specifi ed amount of interest based on the coupon rate, for a specifi ed length of time, and to repay the loan on its maturity. Strictly speaking, assets are pledged as
security for a bond issue, except in the case of government “bonds”, but the term is often loosely used to describe any funded debt issue.
Bond ContractThe actual legal agreement between the issuer and the bondholder. The contract outlines the terms and conditions – the coupon rate, timing of coupon payments, maturity date and any other terms. The bond contract is usually administered by a trust company on behalf of all the bondholders. Also called a Bond Indenture or Trust Deed.
Bond IndentureSee Bond Contract.
Bond SwitchesAn investment strategy whereby the investor may sell one bond and replace it with another, to capture some advantage such as yield improvement.
Book ValueThe amount of net assets belonging to the owners of a business (or shareholders of a company) based on balance sheet values. It represents the total value of the company’s assets that shareholders would theoretically receive if a company were liquidated. Also represents the original cost of the units allocated to a segregated fund contract.
Bottom-Up Investment ApproachAn investment approach that seeks out undervalued companies. A fund manager may fi nd companies whose low share prices are not justifi ed. They would buy these securities and when the market fi nally realizes that they are undervalued, the share price rises giving the astute bottom up manager a profi t. See also Top-Down Investment Approach.
Bought DealA new issue of stocks or bonds bought from the issuer by an investment dealer, frequently acting alone, for resale to its clients, usually by way of a private placement or short form prospectus. The dealer risks its own capital in the bought deal. In the event that the price has to be lowered to sell out the issue, the dealer absorbs the loss.
Bourse de MontréalA stock exchange (also referred to as the Montréal Exchange) that deals exclusively with non-agricultural options and futures in Canada, including all options that previously traded on the Toronto Stock
Exchange and all futures products that previously traded on the Toronto Futures Exchange.
BrokerAn investment dealer or a duly registered individual that is registered to trade in securities in the capacity of an agent or principal and is a member of a Self-Regulatory Organization.
Broker of RecordThe broker named as the offi cial advisor to a corporation on fi nancial matters; has the right of fi rst refusal on any new issues.
BucketingConfi rming a transaction where no trade has been executed.
Budget Defi citOccurs when total spending by the government for the year is higher than revenue collected.
Budget SurplusOccurs when government revenue for the year exceeds expenditures.
BullOne who expects that the market generally or the market price of a particular security will rise. See also Bear.
Bull MarketA general and prolonged rising trend in security prices. Bull markets are usually associated with an expansionary phase of the business cycle. As a memory aid, it is said that a bull walks with his head up while a bear walks with his head down.
Business CycleThe recurrence of periods of expansion and recession in economic activity. Each cycle is expected to move through fi ve phases – the trough, recovery, expansion, peak, contraction (recession). Given an understanding of the relationship between the business cycle and security prices an investor or fund manager would select an asset mix to maximize returns.
Business RiskThe risk inherent in a company’s operations, refl ected in the variability in earnings. A weakening in consumer interest or technological obsolescence usually causes the decline. Examples include manufacturers of vinyl records, eight track recording tapes and beta video machines.

© CSI GLOBAL EDUCATION INC. (2010)
CANADIAN SECURITIES COURSEG•6
Buy-BackA company’s purchase of its common shares either by tender or in the open market for cancellation, subsequent resale or for dividend reinvestment plans.
Buy-InsIf a client or a broker fails to deliver securities sold to another broker within a specifi ed number of days after the value (settlement) date, the receiving broker may buy-in the securities in the open market and charge the client or the delivering broker the cost of such purchases.
Call FeatureA clause in a bond or preferred share agreement that allows the issuer the right to “call back” the securities prior to maturity. The company would usually do this if they could refi nance the debt at a lower rate (similar to refi nancing a mortgage at a lower rate). Calling back a security prior to maturity may involve the payment of a penalty known as a call premium.
Call OptionThe right to buy a specifi c number of shares at a specifi ed price (the strike price) by a fi xed date. The buyer pays a premium to the seller of the call option contract. An investor would buy a call option if the underlying stock’s price is expected to rise. See also Put Option.
Call PriceThe price at which a bond or preferred share with a call feature is redeemed by the issuer. This is the amount the holder of the security would receive if the security was redeemed prior to maturity. The call price is equal to par (or a stated value for preferred shares) plus any call premium. See also Redemption Price.
Call ProtectionFor callable bonds, the period before the fi rst possible call date.
CallableMay be redeemed (called in) upon due notice by the security’s issuer.
Canada Deposit Insurance Corporation (CDIC)A federal Crown Corporation providing deposit insurance against loss (up to $100,000 per depositor) when a member institution fails.
Canada Education Savings Grant (CESG)An incentive program for those investing in a Registered Education Savings Plan (RESP) whereby the federal government will make a matching grant of a maximum of $500 to $600 per year of the fi rst $2,500 contributed each year to the RESP of a child under age 18.
Canada Pension Plan (CPP)A mandatory contributory pension plan designed to provide monthly retirement, disability and survivor benefi ts for all Canadians. Employers and employees make equal contributions. Québec has its own parallel pension plan Québec Pension Plan (QPP).
Canada Premium Bonds (CPBs)A relatively new type of savings product that offers a higher interest rate compared to the Canada Savings Bond and is redeemable once a year on the anniversary of the issue date or during the 30 days thereafter without penalty.
Canada Savings Bonds (CSBs)A type of savings product that pays a competitive rate of interest and that is guaranteed for one or more years. They may be cashed at any time and, after the fi rst three months, pay interest up to the end of the month prior to being cashed.
Canada Yield CallA callable bond with a call price based on the greater of (a) par or (b) the price based on the yield of an equivalent-term Government of Canada bond plus a specifi ed yield spread. Also known as a Doomsday call. See also Call Price and Callable Bond.
Canadian Council of Insurance RegulatorsThe association of insurance regulators in jurisdictions across Canada.
Canadian Derivatives Clearing Corporation (CDCC)The CDCC is a service organization that clears, issues, settles, and guarantees options, futures, and futures options traded on the Bourse de Montréal (the Bourse).
Canadian Investor Protection Fund (CIPF)A fund that protects eligible customers in the event of the insolvency of an IIROC dealer member. It is sponsored solely by
IIROC and funded by quarterly assessments on dealer members.
Canadian Life and Health Insurance Association Incorporated (CLHIA)The national trade group of the life insurance industry, which is actively involved in overseeing applications and setting industry standards.
Canadian National Stock Exchange (CNSX)Launched in 2003 as an alternative marketplace for trading equity securities and emerging companies.
Canadian Originated Preferred Securities (COPrS)Introduced to the Canadian market in March 1999, as long-term junior subordinated debt instruments. This type of security offers features that resemble both long-term corporate bonds and preferred shares.
Canadian Payments AssociationEstablished in the 1980 revision of the Bank Act, this association operates a highly automated national clearing system for interbank payments. Members include chartered banks, trust and loan companies and some credit unions and caisses.
Canadian Securities Administrators (CSA)The CSA is a forum for the 13 securities regulators of Canada’s provinces and territories to co-ordinate and harmonize the regulation of the Canadian capital markets.
Canadian Unlisted Board (CUB)An Internet web-based system for investment dealers to report completed trades in unlisted and unquoted equity securities in Ontario.
CanDealProvides institutional investors with electronic access to federal bond bid and offer prices and yields from its six bank-owned dealers.
CanPxA joint venture of several IIROC member fi rms and operates as an electronic trading system for fi xed income securities providing investors with real-time bid and offer prices and hourly trade data.
CapitalHas two distinct but related meanings. To an economist, it means machinery, factories and inventory required to produce other
© CSI GLOBAL EDUCATION INC. (2010)
GLOSSARY G•7
products. To an investor, it may mean the total of fi nancial assets invested in securities, a home and other fi xed assets, plus cash.
Capital Cost Allowance (CCA)An amount allowed under the Income Tax Act to be deducted from the value of certain assets and treated as an expense in computing an individual’s or company’s income for a taxation year. It may differ from the amount charged for the period in depreciation accounting.
Capital and Financial AccountAccount which refl ects the transactions occurring between Canada and foreign countries with respect to the acquisition of assets, such as land or currency. Along with the current account a component of the balance of payments.
Capital GainSelling a security for more than its purchase price. For non-registered securities, 50% of the gain would be added to income and taxed at the investor’s marginal rate.
Capital Leases or Capitalized LeasesAn expenditure recorded on the balance sheet as an asset rather than as an expense.
Capital LossSelling a security for less than its purchase price. Capital losses can only be applied against capital gains. Surplus losses can be carried forward indefi nitely and used against future capital gains. Only 50% of the loss can be used to offset any taxable capital loss.
Capital MarketFinancial markets where debt and equity securities trade. Capital markets include organized exchanges as well as private placement sources of debt and equity.
Capital StockAll shares representing ownership of a company, including preferred as well as common. Also referred to as equity capital.
Capitalization or Capital StructureTotal dollar amount of all debt, preferred and common stock, contributed surplus and retained earnings of a company. Can also be expressed in percentage terms.
CapitalizeRecording an expenditure initially as an asset on the balance sheet rather than as an earnings statement expense, and then writing
it off or amortizing it (as an earnings statement expense) over a period of years. Examples include capitalized leases, interest, and research and development.
Carry ForwardThe amount of RRSP contributions that can be carried forward from previous years. For example, if a client was entitled to place $13,500 in an RRSP and only contributed $10,000, the difference of $3,500 would be the unused contribution room and can be carried forward indefi nitely.
Cash AccountA type of brokerage account where the investor is expected to have either cash in the account to cover their purchases or where an investor will deliver the required amount of cash before the settlement date of the purchase.
Cash FlowA company’s net income for a stated period plus any deductions that are not paid out in actual cash, such as depreciation and amortization, deferred income taxes, and minority interest. For an investor, any source of income from an investment including dividends, interest income, rental income, etc.
Cash-Secured Put WriteInvolves writing a put option and setting aside an amount of cash equal to the strike price. If the cash-secured put writer is assigned, the cash is used to buy the stock from the exercising put buyer.
Cash ValueThe current market value of a segregated fund contract, less any applicable deferred sales charges or other withdrawal fees
CBIDAn electronic trading system for fi xed-income securities operating in both retail and institutional markets.
CDS Clearing and Depository Services Inc. (CDS)CDS provides customers with physical and electronic facilities to deposit and withdraw depository-eligible securities and manage their related ledger positions (securities accounts). CDS also provides electronic clearing services both domestically and internationally, allowing customers to report, confi rm and settle securities trade transactions.
Central BankA body established by a national Government to regulate currency and monetary policy on a nationalinternational level. In Canada, it is the Bank of Canada; in the United States, the Federal Reserve Board; in the U.K., the Bank of England.
ChartingThe use of charts and patterns to forecast buy and sell decisions. See also Technical Analysis.
Chinese WallsPolicies implemented to separate and isolate persons within a fi rm who make investment decisions from persons within a fi rm who are privy to undisclosed material information which may infl uence those decisions. For example, there should be separate fax machines for research departments and sales departments.
Class A and B StockShares that have different classes sometimes have different rights. Some may have superior claims over other classes or may have different voting rights. Class A stock is often similar to a participating preferred share with a prior claim over Class B for a stated amount of dividends or assets or both, but without voting rights; the Class B may have voting rights but no priority as to dividends or assets. Note that these distinctions do not always apply.
Clearing CorporationsA not-for-profi t service organization owned by the exchanges and their members for the clearance, settlement and issuance of options and futures. A clearing corporation provides a guarantee for all options and futures contracts it clears, by becoming the buyer to every seller and the seller to every buyer.
Clone FundGenerally a fund that tries to mimic the performance and/or the objectives of a successful existing fund within a family of funds. A common example of a clone fund is when a fund company issues an RRSP version of a foreign equity fund, consisting of derivatives managed in a way that duplicates the returns of the underlying fund.
© CSI GLOBAL EDUCATION INC. (2010)
CANADIAN SECURITIES COURSEG•8
Closed-End FundShares in closed-end investment companies are readily transferable in the open market and are bought and sold like other shares. Capitalization is fi xed. See also Investment Company.
Closet IndexingA portfolio strategy whereby the fund manager does not replicate the market exactly but sticks fairly close to the market weightings by industry sector, country or region or by the average market capitalization.
Coincident IndicatorsStatistical data that, on average, change at approximately the same time and in the same direction as the economy as a whole.
Collateral Trust BondA bond secured by stocks or bonds of companies controlled by the issuing company, or other securities, which are deposited with a trustee.
Commercial PaperAn unsecured promissory note issued by a corporation or an asset-backed security backed by a pool of underlying fi nancial assets. Issue terms range from less than three months to one year. Most corporate paper trades in $1,000 multiples, with a minimum initial investment of $25,000. Commercial paper may be bought and sold in a secondary market before maturity atprevailing market rates.
CommissionThe fee charged by a stockbroker for buying or selling securities as agent on behalf of a client.
CommodityA product used for commerce that is traded on an organized exchange. A commodity could be an agricultural product such as canola or wheat, or a natural resource such as oil or gold. A commodity can be the basis for a futures contract.
Common StockSecurities representing ownership in a company. They carry voting privileges and are entitled to the receipt of dividends, if declared. Also called common shares.
Competitive TenderA distribution method used in particular by the Bank of Canada in distributing new issues of government marketable bonds. Bids are requested from primary
distributors and the higher bids are awarded the securities for distribution. See also Non-Competitive Tender.
Compound InterestInterest earned on an investment at periodic intervals and added to the amount of the investment; future interest payments are then calculated and paid at the original rate but on the increased total of the investment. In simple terms, interest paid on interest.
Confi rmationA printed acknowledgement giving details of a purchase or sale of a security which is normally mailed to a client by the broker or investment dealer within 24 hours of an order being executed. Also called a contract.
ConglomerateA company directly or indirectly operating in a variety of industries, usually unrelated to each other. Conglomerates often acquire outside companies through the exchange of their own shares for the shares of the majority owners of the outside companies.
Consolidated Financial StatementsA combination of the fi nancial statements of a parent company and its subsidiaries, presenting the fi nancial position of the group as a whole.
ConsolidationSee Reverse Split.
Constrained Share CompaniesInclude Canadian banks, trust, insurance, broadcasting and communication companies having constraints on the transfer of shares to persons who are not Canadian citizens or not Canadian residents.
Consumer Price Index (CPI)Price index which measures the cost of living by measuring the prices of a given basket of goods. The CPI is often used as an indicator of infl ation.
Continuation PatternA chart formation indicating that the current trend will continue.
Continuous DisclosureIn Ontario, a reporting issuer must issue a press release as soon as a material change occurs in its affairs and, in any event, within ten days. See also Timely Disclosure.
Contract HolderThe owner of a segregated fund contract.
ContractionRepresents a downturn in the economy and can lead to a recession if prolonged.
Contributed SurplusA component of shareholders’ equity which originates from sources other than earnings, such as the initial sale of stock above par value.
Contributions in KindTransferring securities into an RRSP. The general rules are that when an asset is transferred there is a deemed disposition. Any capital gain would be reported and taxes paid. Any capital losses that result cannot be claimed.
Conversion PriceThe dollar value at which a convertible bond or security can be converted into common stock.
Conversion PrivilegeThe right to exchange a bond for common shares on specifi cally determined terms.
Conversion RatioThe number of common shares for which a convertible security can be exchanged. Convertible preferreds and debentures would have a stated number outlined in their prospectus or indenture as to the exchange rate. For example, the conversion ratio on a bond may be 25. This means that the bond could be exchanged for 25 common shares. If the conversion ratio is divided into par value, the result is called the conversion price.
ConvertibleA bond, debenture or preferred share which may be exchanged by the owner, usually for the common stock of the same company, in accordance with the terms of the conversion privilege. A company can force conversion by calling in such shares for redemption if the redemption price is below the market price.
Convertible ArbitrageA strategy that looks for mispricing between a convertible security and the underlying stock. A typical convertible arbitrage position is to be long the convertible bond and short the common stock of the same company.
ConvexityA measure of the rate of change in duration over changes in yields. Typically, a bond will rise in price more if the yield change is

© CSI GLOBAL EDUCATION INC. (2010)
GLOSSARY G•9
negative than it will fall in price if the yield change is positive.
Corporate NoteAn unsecured promise made by the borrower to pay interest and repay the principal at a specifi c date.
Corporation or CompanyA form of business organization created under provincial or federal statutes which has a legal identity separate from its owners. The corporation’s owners (shareholders) have no personal liability for its debts. See also Limited Liability.
CorrelationA measure of the relationship between two or more securities. If two securities mirror each other’s movements perfectly, they are said to have a positive one (+1) correlation. Combining securities with high positive correlations does not reduce the risk of a portfolio. Combining securities that move in the exact opposite direction from each other are said to have perfect negative one (-1) correlation. Combining two securities with perfect negative correlation reduces risk. Very few, if any, securities have a perfect negative correlation. However, risk in a portfolio can be reduced if the combined securities have low positive correlations.
Correlation Coeffi cientA measure of the relationship between the returns of two securities or two classes of securities.
Cost Accounting MethodUsed when a company owns less than 20% of a subsidiary.
Cost of Goods SoldAn earnings statement account representing the cost of buying raw materials that go directly into producing fi nished goods.
Cost-Push Infl ationA type of infl ation that develops due to an increase in the costs of production. For example, an increase in the price of oil may contribute to higher input costs for a company and could lead to higher infl ation.
Country BanksA colloquial term for non-bank lenders who provide short-term sources of credit for investment dealers; e.g., corporations, insurance companies and other institutional short-term investors, none of whom is
under the jurisdiction of the Bank Act. See also Purchase and Resale Agreement.
Coupon RateThe rate of interest that appears on the certifi cate of a bond. Multiplying the coupon rate times the principal tells the holder the dollar amount of interest to be paid by the issuer until maturity. For example, a bond with a principal of $1,000 and a coupon of 10% would pay $100 in interest each year. Coupon rates remain fi xed throughout the term of the bond. See also Yield.
CovenantA pledge in a bond indenture indicating the fulfi lment of a promise or agreement by the company issuing the debt. An example of a covenant may include the promise not to issue any more debt.
CoverBuying a security previously sold short. See also Short Sale.
Covered WriterThe writer of an option who also holds a position that is equivalent to, but on the opposite side of the market from the short option position. In some circumstances, the equivalent position may be in cash, a convertible security or the underlying security itself. See also Naked Writer.
Cross on the BoardAlso called a put-through or contra order. When a broker has both an order to sell and an order to buy the same stock at the same price, a cross is allowed on the exchange fl oor without interfering with the limits of the prevailing market.
CUBCanadian Unlisted Board – a web-based trade reporting system for unlisted securities.
Cum DividendWith dividend. If you buy shares quoted cum dividend, i.e., before the ex dividend date, you will receive an upcoming already-declared dividend. If shares are quoted ex-dividend (without dividend) you are not entitled to the declared dividend.
Cum RightsWith rights. Buyers of shares quoted cum rights, i.e., before the ex-rights date, are entitled to forthcoming already-declared rights. If shares are quoted ex rights
(without rights) the buyer is not entitled to receive the declared rights.
Cumulative PreferredA preferred stock having a provision that if one or more of its dividends are not paid, the unpaid dividends accumulate in arrears and must be paid before any dividends may be paid on the company’s common shares.
Current AccountAccount that refl ects all payments between Canadians and foreigners for goods, services, interest and dividends. Along with the capital account it is a component of the balance of payments.
Current AssetsCash and assets which in the normal course of business would be converted into cash, usually within a year, e.g. accounts receivable, inventories. A balance sheet category.
Current LiabilitiesMoney owed and due to be paid within a year, e.g. accounts payable. A balance sheet category.
Current RatioA liquidity ratio that shows a company’s ability to pay its current obligations from current assets. A current ratio of 2:1 is the generally accepted standard. See also Quick Ratio.
Current YieldThe annual income from an investment expressed as a percentage of the investment’s current value. On stock, calculated by dividing yearly dividend by market price; on bonds, by dividing the coupon by market price. See also Yield.
CUSIPCommittee on Uniform Security Identifi cation Procedures is the trademark for a standard system of securities identifi cation (i.e., CUSIP numbering system) and securities description (i.e., CUSIP descriptive system) that is used in processing and recording securities transactions in North America.
CustodianA fi rm that holds the securities belonging to a mutual fund or a segregated fund for safekeeping. The custodian can be either the insurance company itself, or a qualifi ed outside fi rm based in Canada.

© CSI GLOBAL EDUCATION INC. (2010)
CANADIAN SECURITIES COURSEG•10
Cyclical StockA stock in an industry that is particularly sensitive to swings in economic conditions. Cyclical Stocks tend to rise quickly when the economy does well and fall quickly when the economy contracts. In this way, cyclicals move in conjunction with the business cycle. For example, during periods of expansion auto stocks do well as individuals replace their older vehicles. During recessions, auto sales and auto company share values decline.
Cyclical UnemploymentThe amount of unemployment that rises when the economy softens, fi rms’ demand for labour moderates, and some fi rms lay off workers in response to lower sales. It drops when the economy strengthens again.
Day OrderA buy or sell order that automatically expires if it is not executed on the day it is entered. All orders are day orders unless otherwise specifi ed.
Dealer MarketA market in which securities are bought and sold over-the-counter in which dealers acts as principals when buying and selling securities for clients. Also referred to as the unlisted market.
Dealer MemberA stock brokerage fi rm or investment dealer which is a member of a stock exchange or the Investment Industry Regulatory Organization of Canada.
Dealer’s SpreadThe difference between the bid and ask prices on a security.
Death Benefi tThe amount that a segregated fund policy pays to the benefi ciary or the estate when the market value of the segregated fund is lower than the guaranteed amount on the death of the annuitant.
DebentureA certifi cate of indebtedness of a government or company backed only by the general credit of the issuer and unsecured by mortgage or lien on any specifi c asset. In other words, no specifi c assets have been pledged as collateral.
DebtMoney borrowed from lenders for a variety of purposes. The borrower typically pays
interest for the use of the money and is obligated to repay it at a set date.
Debt/Equity RatioA ratio that shows whether a company’s borrowing is excessive. The higher the ratio, the higher the fi nancial risk.
Debt RatiosFinancial ratios that show how well the company can deal with its debt obligations.
Declining IndustryAn industry moving from the maturity stage. It tends to grow at rates slower than the overall economy, or the growth rate actually begins to decline.
Deemed DispositionUnder certain circumstances, taxation rules state that a transfer of property has occurred, even without a purchase or sale, e.g., there is a deemed disposition on death or emigration from Canada.
DefaultA bond is in default when the borrower has failed to live up to its obligations under the trust deed with regard to interest, sinking fund payments or has failed to redeem the bonds at maturity.
Default RiskThe risk that a debt security issuer will be unable to pay interest on the prescribed date or the principal at maturity. Default risk applies to debt securities not equities since equity dividend payments are not contractual.
Defensive StockA stock of a company with a record of stable earnings and continuous dividend payments and which has demonstrated relative stability in poor economic conditions. For example, utility stock values do not usually change from periods of expansion to periods of recession since most individuals use a constant amount of electricity.
Deferred AnnuityThis type of contract, usually sold by life insurance companies, pays a regular stream of income to the benefi ciary or annuitant at some agreed-upon start date in the future. The original payment is usually a stream of payments made over time, ending prior to the beginning of the annuity payments. See also Annuity.
Deferred ChargesAn asset shown on a balance sheet representing payments made by the company for which the benefi t will extend to the company over a period of years. Similar to a prepaid expense except that the benefi t period is for a longer period. Deferred charges may include expenses incurred in issuing bonds, organizational expenses or research expenses.
Deferred Preferred SharesA type of preferred share that pays no dividend until a future maturity date.
Deferred Profi t Sharing Plan (DPSP)A trust arrangement whereby an employer distributes a certain percentage of company profi ts to his/her employees. It must be an arms length transaction, and employees are not eligible to make a contribution.
Deferred RevenueThe revenue recorded when a company receives payment for goods or services that it has not yet provided. For example, a prepaid subscription to a magazine.
Deferred Sales ChargeThe fee charged by a mutual fund or insurance company for redeeming units. It is otherwise known as a redemption fee or back-end load. These fees decline over time and are eventually reduced to zero if the fund is held long enough.
Defi ned Benefi t PlanA type of registered pension plan in which the annual payout is based on a formula. The plan pays a specifi c dollar amount at retirement using a predetermined formula.
Defi ned Contribution PlanA type of registered pension plan where the amount contributed is known but the dollar amount of the pension to be received is unknown. Also known as a money purchase plan.
Delayed FloaterA type of variable rate preferred share that entitles the holder to a fi xed dividend for a predetermined period of time after which the dividend becomes variable. Also known as a fi xed-reset or fi xed fl oater.
Delayed OpeningPostponement in the opening of trading of a security the result of a heavy infl ux of buy and/or sell orders.

© CSI GLOBAL EDUCATION INC. (2010)
GLOSSARY G•11
DelistRemoval of a security’s listing on a stock exchange.
DeliveryDelayed Delivery – A transaction in which there is a clear understanding that delivery of the securities involved will be delayed beyond the normal settlement period. Good Delivery – When a security that has been sold is in proper form to transfer title by delivery to the buyer. Regular Delivery – Unless otherwise stipulated, sellers of stock must deliver it on or before the third business day after the sale.
Demand Pull Infl ationA type of infl ation that develops when continued consumer demand pushes prices higher.
DemutualizationThe process by which insurance companies, owned by policy holders, reorganize into companies owned by shareholders. Policy holders become shareholders in an insurance company.
DepletionRefers to consumption of natural resources that are part of a company’s assets. Producing oil, mining and gas companies deal in products that cannot be replenished and as such are known as wasting assets. The recording of depletion is a bookkeeping entry similar to depreciation and does not involve the expenditure of cash.
Deposit-Based GuaranteeA maturity guarantee consisting of separate guarantees and guarantee dates for each of the deposits made in a segregated fund policy over time.
DepreciationSystematic charges against earnings to write off the cost of an asset over its estimated useful life because of wear and tear through use, action of the elements, or obsolescence. It is a bookkeeping entry and does not involve the expenditure of cash.
DerivativeA type of fi nancial instrument whose value is based on the performance of an underlying fi nancial asset, commodity, or other investment. Derivatives are available on interest rates, currency, stock indexes. For example, a call option on IBM is a derivative because the value of the call varies in relation to the performance of IBM stock. See also Options.
Direct BondsThis term is used to describe bonds issued by governments that are fi rsthand obligations of the government itself. See also Guaranteed Bonds.
Directional Hedge FundsA type of hedge fund that places a bet on the anticipated movements in the market prices of equities, fi xed-income securities, foreign currencies and commodities.
DirectorPerson elected by voting common shareholders at the annual meeting to direct company policies.
Directors’ CircularInformation sent to shareholders by the directors of a company that are the target of a takeover bid. A recommendation to accept or reject the bid, and reasons for this recommendation, must be included.
DisclosureOne of the principles of securities regulation in Canada. This principle entails full, true and plain disclosure of all material facts necessary to make reasoned investment decisions.
DiscountThe amount by which a preferred stock or bond sells below its par value.
Discount BrokersBrokerage house that buys and sells securities for clients at a greater commission discount than full-service fi rms.
Discount RateIn computing the value of a bond, the discount rate is the interest rate used in calculating the present value of future cash fl ows.
Discouraged WorkersIndividuals that are available and willing to work but cannot fi nd jobs and have not made specifi c efforts to fi nd a job within the previous month.
Discretionary AccountA securities account where the client has given specifi c written authorization to a partner, director or qualifi ed portfolio manager to select securities and execute trades for him. See also Managed Account and Wrap Account.
Disinfl ationA decline in the rate at which prices rise – i.e., a decrease in the rate of infl ation. Prices are still rising, but at a slower rate.
Disposable IncomePersonal income minus income taxes and any other transfers to government.
Diversifi cationSpreading investment risk by buying different types of securities in different companies in different kinds of businesses and/or locations.
DividendAn amount distributed out of a company’s profi ts to its shareholders in proportion to the number of shares they hold. Over the years a preferred dividend will remain at a fi xed annual amount. The amount of common dividends may fl uctuate with the company’s profi ts. A company is under no legal obligation to pay preferred or common dividends.
Dividend Discount ModelThe relationship between a stock’s current price and the present value of all future dividend payments. It is used to determine the price at which a stock should be selling based on projected future dividend payments.
Dividend Payout RatioA ratio that measures the amount or percentage of the company’s net earnings that are paid out to shareholders in the form of dividends.
Dividend Reinvestment PlanThe automatic reinvestment of shareholder dividends in more shares of the company’s stock.
Dividend Tax CreditA procedure to encourage Canadians to invest in preferred and common shares of taxable, dividend-paying Canadian corporations. The taxpayer pays tax based on grossing up (i.e., adding 4 5% to the amount of dividends actually received) and obtains a credit against federal and provincial tax based on the grossed up amount in the amount of 19%.

© CSI GLOBAL EDUCATION INC. (2010)
CANADIAN SECURITIES COURSEG•12
Dividend YieldA value ratio that shows the annual dividend rate expressed as a percentage of the current market price of a stock. Dividend yield represents the investor’s percentage return on investment at its prevailing market price.
Dollar Cost AveragingInvesting a fi xed amount of dollars in a specifi c security at regular set intervals over a period of time, thereby reducing the average cost paid per unit.
Domestic BondsBonds issued in the currency and country of the issuer. For example, a Canadian dollar-denominated bond, issued by a Canadian company, in the Canadian market would be considered a domestic bond.
Dow Jones Industrial Average (DJIA)A price-weighted average that uses 30 actively traded blue chip companies as a measure of the direction of the New York Stock Exchange.
DrawdownA cash management open-market operation pursued by the Bank of Canada to infl uence interest rates. A drawdown refers to the transfer of deposits to the Bank of Canada from the direct clearers, effectively draining the supply of available cash balances. See also Redeposit.
Due Diligence ReportWhen negotiations for a new issue of securities begin between a dealer and corporate issuer, the dealer normally prepares a due diligence report examining the fi nancial structure of the company.
DurationA measure of bond price volatility. The approximate percentage change in the price or value of a bond or bond portfolio for a 1% point change in interest rates. The higher the duration of a bond the greater its risk.
Dynamic Asset AllocationAn asset allocation strategy that refers to the systematic rebalancing, either by time period or weight, of the securities in the portfolio, so that they match the long-term benchmark asset mix among the various asset classes.
Earned IncomeIncome that is designated by Canada Revenue Agency for RRSP calculations.
Most types of revenues are included with the exception of any form of investment income and pension income.
Earnings or Income StatementA fi nancial statement which shows a company’s revenues and expenditures resulting in either a profi t or a loss during a fi nancial period.
Earnings Per Share (EPS)A value ratio that shows the portion of net income for a period attributable to a single common share of a company. For example, a company with $100 million in earnings and with 100 million common shareholders would report an EPS of $1 per share.
Economic IndicatorsStatistics or data series that are used to analyze business conditions and current economic activity. See also leading, lagging, and coincident indicators.
Economies of ScaleAn economic principle whereby the per unit cost of producing each unit of output falls as the volume of production increases. Typically, a company that achieves economies of scale lowers the average cost per unit through increased production since fi xed costs are shared over an increased number of goods.
Effi cient Market HypothesisThe theory that a stock’s price refl ects all available information and refl ects its true value.
Election PeriodWhen an investor purchases an extendible or retractable bond, they have a time period in which to notify the company if they want to exercise the option.
Elliot Wave TheoryA theory used in technical analysis based on the rhythms found in nature. The theory states that there are repetitive, predictable sequences of numbers and cycles found in nature similar to patterns of stock movements.
Embedded OptionA term used to describe the convertible, retractable or extendible features of some securities. These features can often be valued using the same techniques used to value options.
Emerging IndustriesBrand new industries in the early stages of growth. Often considered as speculative because they are introducing new products that may or may not be accepted and may face strong competition from other new entrants.
Enterprise Multiple (EM)A ratio used to measure a company’s overall value by comparing its enterprise value to its earnings before interest, taxes and amortization or EBITDA.
Enterprise Value (EV)Refl ects what it would cost to purchase a company as a whole. EV is calculated as the market value of the company’s common equity, preferred equity and debt less any cash or investments that it records on its balance sheet.
Equilibrium PriceThe price at which the quantity demanded equals the quantity supplied.
Equipment Trust Certifi cateA type of debt security that was historically used to fi nance “rolling stock” or railway boxcars. The cars were the collateral behind the issue and when the issue was paid down the cars reverted to the issuer. In recent times, equipment trusts are used as a method of fi nancing containers for the offshore industry. A security, more common in the U.S. than in Canada.
EquityOwnership interest in a corporation’s stock that represents a claim on its earnings and assets. See also Stock.
Equity Dividend SharesShares that trade like bonds and preferred shares, but can benefi t from increases in dividends paid on the underlying common shares. Also known as structured preferreds. See also Split Shares.
Equity IncomeA company’s share of an unconsolidated subsidiary’s earnings. The equity accounting method is used when a company owns 20% to 50% of a subsidiary.
Equity MethodAn accounting method used to determine income derived from a company’s investment in another company over which it exerts signifi cant infl uence.

© CSI GLOBAL EDUCATION INC. (2010)
GLOSSARY G•13
Escrowed or Pooled SharesOutstanding shares of a company which, while entitled to vote and receive dividends, may not be bought or sold unless special approval is obtained. Mining and oil companies commonly use this technique when treasury shares are issued for new properties. Shares can be released from escrow (i.e., freed to be bought and sold) only with the permission of applicable authorities such as a stock exchange and/or securities commission.
EurobondsBonds that are issued and sold outside a domestic market and typically denominated in a currency other than that of the domestic market. For example, a bond denominated in Canadian dollars and issued in Germany would be classifi ed as a Eurobond.
European OptionAn option that can only be exercised on a specifi ed date – normally the business day prior to expiration.
Event-Driven Hedge FundsA type of hedge fund that seeks to profi t from unique events such as mergers, acquisitions, stock splits or buybacks.
Ex-AnteA projection of expected returns – what investors expect to realize as a return.
Exchange Fund AccountA special federal government account operated by the Bank of Canada to hold and conduct transactions in Canada’s foreign exchange reserves on instructions from the Minister of Finance.
Exchange RateThe price at which one currency exchanges for another.
Exchange-Traded Funds (ETFs)Open-ended mutual fund trusts that hold the same stocks in the same proportion as those included in a specifi c stock index. Shares of an exchange-traded fund trade on major stock exchanges. Like index mutual funds, ETFs are designed to mimic the performance of a specifi ed index by investing in the constituent companies included in that index. Like the stocks in which they invest, shares can be traded throughout the trading day.
Ex-DividendA term that denotes that when a person purchases a common or preferred share,
they are not entitled to the dividend payment. Shares go ex-dividend two business days prior to the shareholder record date. See also Cum Dividend.
Exempt ListLarge professional buyers of securities, mostly fi nancial institutions, that are offered a portion of a new issue by one member of the banking group on behalf of the whole syndicate. The term exempt indicates that this group of investors is exempt from receiving a prospectus on a new issue as they are considered to be sophisticated and knowledgeable.
Exempt MarketAn unregulated market for sophisticated participants in government bonds, corporate issues, commercial paper, and other structured products. A prospectus has not been required to raise money privately from private investors (largely institutions, but also individuals) and registration with a securities commission for those so dealing has not been needed.
ExerciseThe process of invoking the rights of the option or warrant contract. It is the holder of the option who exercises his or her rights. See also Assignment.
Exercise NoticeThe instructions tendered by the option holder, through the investment dealer, which states the holder’s decision to activate the rights given in the option contract. Once tendered, it is irrevocable. The holder of a call will buy the underlying security while the holder of a put will sell the underlying security.
Exercise PriceThe price at which a derivative can be exchanged for a share of the underlying security (also known as subscription price). For an option, it is the price at which the underlying security can be purchased, in the case of a call, or sold, in the case of a put, by the option holder. Synonymous with strike price.
ExpansionA phase of the business cycle characterized by increasing corporate profi ts and hence increasing share prices, an increase in the demand for capital for business expansion, and hence an increase in interest rates.
Expectations TheoryA theory stating that the yield curve is shaped by a market consensus about future interest rates.
Expiration DateThe date on which certain rights or option contracts cease to exist. For equity options, this date is usually the Saturday following the third Friday of the month listed in the contract. This term can also be used to describe the day on which warrants and rights cease to exist.
Ex-PostThe rate of return that was actually received. This historic data is used to measure actual performance.
Ex-RightsA term that denotes that the purchaser of a common share would not be entitled to a rights offering. Common shares go ex-rights two business days prior to the shareholder of record date.
Extendible Bond or DebentureA bond or debenture with terms granting the holder the option to extend the maturity date by a specifi ed number of years.
Extension DateFor extendible bonds the maturity date of the bond can be extended so that the bond changes from a short-term bond to a long- term bond.
Extraordinary ItemsAn event not typical of normal business activity and do not occur on a regular basis. For example, a company may write off an underperforming division or it may sell a large amount of real estate in a given fi scal year. The results of these special gains or losses are included as an extraordinary item on the earnings statement.
Face ValueThe value of a bond or debenture that appears on the face of the certifi cate. Face value is ordinarily the amount the issuer will pay at maturity. Face value is no indication of market value.
Factors of ProductionThe resources that consumers, fi rms, and governments use to produce goods and services and include labour, natural resources, entrepreneurship and capital.

© CSI GLOBAL EDUCATION INC. (2010)
CANADIAN SECURITIES COURSEG•14
Fee-Based AccountsA type of account that bundles various services into a fee based on the client’s assets under management, for example, 1% to 3% of client assets.
Fiduciary ResponsibilityThe responsibility of an investment advisor, mutual fund salesperson or fi nancial planner to always put the client’s interests fi rst. The fi duciary is in a position of trust and must act accordingly.
Final GoodA fi nished product, one that is purchased by the ultimate end user.
Final ProspectusThe prospectus which supersedes the preliminary prospectus and is accepted for fi ling by applicable provincial securities commissions. The fi nal prospectus shows all required information pertinent to the new issue and a copy must be given to each fi rst-time buyer of the new issue.
Finance or Acceptance Company PaperShort-term negotiable debt securities similar to commercial paper, but issued by fi nance companies.
Financial IntermediaryAn institution such as a bank, life insurance company, credit union or mutual fund which receives cash, which it invests, from suppliers of capital.
Financial RiskThe additional risk placed on the common shareholders from a company’s decision to use debt to fi nance its operations.
FinancingThe purchase for resale of a security issue by one or more investment dealers. The formal agreement between the investment dealer and the corporation issuing the securities is called the underwriting agreement. A term synonymous with underwriting.
Firm Bid – Firm OfferAn undertaking to buy (fi rm bid) or sell (fi rm offer) a specifi ed amount of securities at a specifi ed price for a specifi ed period of time, unless released from this obligation by the seller in the case of a fi rm bid or the buyer in the case of a fi rm offer.
First-In-First-Out (FIFO)Inventory items acquired earliest are sold fi rst.
First Mortgage BondsThe senior securities of a company as they constitute a fi rst charge on the company’s assets, earnings and undertakings before unsecured current liabilities are paid.
Fiscal AgentAn investment dealer appointed by a company or government to advise it in fi nancial matters and to manage the underwriting of its securities.
Fiscal PolicyThe policy pursued by the federal government to infl uence economic growth through the use of taxation and government spending to smooth out the fl uctuations of the business cycle.
Fiscal YearA company’s accounting year. Due to the nature of particular businesses, some companies do not use the calendar year for their bookkeeping. A typical example is the department store that fi nds December 31 too early a date to close its books after the Christmas rush and so ends its fi scal year on January 31.
Fixed AssetA tangible long-term asset such as land, building or machinery, held for use rather than for processing or resale. A balance sheet category.
Fixed Exchange Rate Regime A country whose central bank maintains the domestic currency at a fi xed level against another currency or a composite of other currencies.
Fixed-Floater PreferredSee Delayed Floater.
Fixed-Income SecuritiesSecurities that generate a predictable stream of interest or dividend income, such as bonds, debentures and preferred shares
Fixed-Reset Preferred See Delayed Floater.
FlatMeans that the quoted market price of a bond or debenture is its total cost (as opposed to an accrued interest transaction). Bonds and debentures in default of interest trade fl at.
Floating Exchange RateA country whose central bank allows market forces alone to determine the value of its currency, but will intervene if it thinks the move in the exchange rate is excessive or disorderly.
Floating RateA term used to describe the interest payments negotiated in a particular contract. In this case, a fl oating rate is one that is based on an administered rate, such as the Prime Rate. For example, the rate for a particular note may be 2% over Prime. See also Fixed Rate.
Floating-Rate DebenturesA type of debenture that offers protection to investors during periods of very volatile interest rates. For example, when interest rates are rising, the interest paid on fl oating rate debentures is adjusted upwards every six months.
Floor TraderEmployee of a member of a stock exchange, who executes buy and sell orders on the fl oor (trading area) of the exchange for the fi rm and its clients.
Forced ConversionWhen a company’s stock rises in value above the conversion price a company may force the convertible security holder to exchange the security for stock by calling back the security. Faced with receiving a lower call price (par plus a call premium) or higher valued shares the investor is forced to convert into common shares.
Foreign BondsIf a Canadian company issues debt securities in another country, denominated in that foreign country’s currency, the bond is known as a foreign bond. A bond issued in the U.S. payable in U.S. dollars is known as a foreign bond or a “Yankee Bond.” See also Eurobond.
Foreign Exchange Rate RiskThe risk associated with an investment in a foreign security or any investment that pays in a denomination other than Canadian dollars, the investor is subject to the risk that the foreign currency may depreciate in value.
© CSI GLOBAL EDUCATION INC. (2010)
GLOSSARY G•15
Foreign PayA Canadian debt security issued in Canada but pays interest and principle in a foreign currency is known as a foreign pay bond. This type of security allows Canadians to take advantage of possible shifts in currency values.
ForwardA forward contract is similar to a futures contract but trades on an OTC basis. The seller agrees to deliver a specifi ed commodity or fi nancial instrument at a specifi ed price sometime in the future. The terms of a forward contract are not standardized but are negotiated at the time of the trade. There may be no secondary market.
Frictional UnemploymentUnemployment that results from normal labour turnover, from people entering and leaving the workforce and from the ongoing creation and destruction of jobs.
Front-End LoadA sales charge applied to the purchase price of a mutual fund when the fund is originally purchased.
Front RunningMaking a practice, directly or indirectly, of taking the opposite side of the market to clients, or effecting a trade for the advisor’s own account prior to effecting a trade for a client.
Full EmploymentThe level of unemployment due solely to both frictional and structural factors, or when cyclical unemployment is zero.
Fully Diluted Earnings Per ShareEarnings per common share calculated on the assumption that all convertible securities are converted into common shares and all outstanding rights, warrants, options and contingent issues are exercised.
Fundamental AnalysisSecurity analysis based on fundamental facts about a company as revealed through its fi nancial statements and an analysis of economic conditions that affect the company’s business. See also Technical Analysis.
Funded DebtAll outstanding bonds, debentures, notes and similar debt instruments of a company not due for at least one year.
Future Income TaxesIncome tax that would otherwise be payable currently, but which is deferred by using larger allowable deductions in calculating taxable income than those used in calculating net income in the fi nancial statements. An acceptable practice, it is usually the result of timing differences and represents differences in accounting reporting guidelines and tax reporting guidelines.
FuturesA contract in which the seller agrees to deliver a specifi ed commodity or fi nancial instrument at a specifi ed price sometime in the future. A futures contract is traded on a recognized exchange. Unlike a forward contract, the terms of the futures contract are standardized by the exchange and there is a secondary market. See also Forwards.
GAAPAcronym for Generally Accepted Accounting Principles which are conventions, procedures and guidelines for accounting practices.
Good Delivery FormWhen a security is sold it must be delivered to the broker properly endorsed, not mutilated and with (if any) coupons attached. To avoid these diffi culties and as a general practice most securities are held in street form with the broker.
Good Faith MoneyA deposit of money by the buyer or seller of a futures product which acts as a fi nancial guarantee as to the fulfi lment of the contractual obligations of the futures contract. Also called a performance bond or margin.
Good Through OrderAn order to buy or sell that is good for a specifi ed number of days and then is automatically cancelled if it has not been fi lled.
Good Till Cancelled OrderAn order that is valid from the date entered until the close of business on the date specifi ed in the order. If the order has not been fi lled by the close of the market on that date, it is cancelled. This type of order can be cancelled or changed at any time.
GoodwillGenerally understood to represent the value of a well-respected business – its name, customer relations, employee relations,
among others. Considered an intangible asset on the balance sheet.
Government Securities DistributorsTypically an investment dealer or bank that is authorized to bid at Government of Canada debt auctions.
GreensheetHighlights for the fi rm’s sales representatives the salient features of a new issue, both pro and con in order to successfully solicit interest to the general public. Dealers prepare this information circular for in-house use only.
Grey MarketA colloquialism used to describe the unlisted if, as, and when market for newly issued but as of yet, unlisted securities. It is an over-the-counter market.
Gross Domestic Product (GDP)The value of all goods and services produced in a country in a year.
Gross Profi t MarginA profi tability ratio that shows the company’s rate of profi t after allowing for cost of goods sold.
Growth StockCommon stock of a company with excellent prospects for above-average growth; a company which over a period of time seems destined for above-average expansion.
Guaranteed AmountThe minimum amount payable under death benefi ts or maturity guarantees provided for under the terms of the segregate fund contract.
Guaranteed BondsBonds issued by a crown corporation but guaranteed by the applicable government as to interest and principal payments.
Guaranteed Income Supplement (GIS)A pension payable to OAS recipients with no other or limited income.
Guaranteed Investment Certifi cate (GIC)A deposit instrument most commonly available from trust companies, requiring a minimum investment at a predetermined rate of interest for a stated term. Generally nonredeemable prior to maturity but there can be exceptions.

© CSI GLOBAL EDUCATION INC. (2010)
CANADIAN SECURITIES COURSEG•16
Guaranteed Minimum Withdrawal Benefi t Plans (GMWB)A GMWB plan is similar to a variable annuity. With a GMWB, the client purchases the plan, and the GMWB option gives the planholder the right to withdraw a certain fi xed percentage (7% is typical) of the initial deposit every year until the entire principal is returned, no matter how the fund performs.
Halt in TradingA temporary halt in the trading of a security to allow signifi cant news to be reported and widely disseminated. Usually the result of a pending merger or a substantial change in dividends or earnings.
Hedge FundsLightly regulated pools of capital in which the hedge fund manager invests a signifi cant amount of his or her own capital into the fund and whose offering memorandum allows for the fund to execute aggressive strategies that are unavailable to mutual funds such as short selling.
HedgingA protective manoeuvre; a transaction intended to reduce the risk of loss from price fl uctuations.
High SalingDeliberately causing the last sale for the day in a security to be higher than warranted by the prevailing market conditions (also referred to as window dressing).
High Water MarkUsed in the context of how a hedge fund manager is compensated. The high water mark sets the bar above which the fund manager is paid a portion of the profi ts earned for the fund.
Holding Period ReturnA transactional rate of return measure that takes into account all cash fl ows and increases or decreases in a security’s value for any time frame. Time frames can be greater or less than a year.
HypothecateTo pledge securities as collateral for a loan. Referred to as collateral assignment or hypotec in Québec for segregated funds.
ICE Futures Canada (formerly the Winnipeg Commodity Exchange)An exchange that trades agricultural futures and options exclusively.
Income BondGenerally, an income bond promises to repay principal but to pay interest only when earned. In some cases, unpaid interest on an income bond may accumulate as a claim against the company when the bond matures.
Income SplittingA tax planning strategy whereby the higher-earning spouse transfers income to the lower-earning spouse to reduce taxable income.
Income StatementSee Earnings Statement.
Income Tax Act (ITA)The legislation dictating the process and collection of federal tax in Canada, administered by Canada Revenue Agency.
Income TrustsA type of investment trust that holds investments in the operating assets of a company. Income from these operating assets fl ows through to the trust, which in turn passes on the income to the trust unitholders.
IndexA measure of the market as measured by a basket of securities. An example would be the S&P/TSX Composite Index or the S&P 500. Fund managers and investors use a stock index to measure the overall direction and performance of the market.
Index-Linked GICsA hybrid investment product that combines the safety of a deposit instrument with some of the growth potential of an equity investment. They have grown in popularity, particularly among conservative investors who are concerned with safety of capital but want yields greater than the interest on standard interest bearing GICs or other term deposits.
IndexingA portfolio management style that involves buying and holding a portfolio of securities that matches, closely or exactly, the composition of a benchmark index.
Individual variable insurance contract (IVIC)The term used in the IVIC Guidelines to describe a segregated fund contract.
Infl ationA generalized, sustained trend of rising prices.
Infl ation RateThe rate of change in prices. See also Consumer Price Index.
Infl ation Rate RiskThe risk that the value of fi nancial assets and the purchasing power of income will decline due to the impact of infl ation on the real returns produced by those fi nancial assets.
Information CircularDocument sent to shareholders with a proxy, providing details of matters to come before a shareholders’ meeting.
Initial Public Offering (IPO)A new issue of securities offered to the public for investment for the very fi rst time. IPOs must adhere to strict government regulations as to how the investments are sold to the public.
Initial Sales ChargeA commission paid to the fi nancial adviser at the time that the policy is purchased. This type of sales charge is also known as an acquisition fee or a front-end load.
InsiderAll directors and senior offi cers of a corporation and those who may also be presumed to have access to nonpublic or inside information concerning the company; also anyone owning more than 10% of the voting shares in a corporation. Insiders are prohibited from trading on this information.
Insider ReportA report of all transactions in the shares of a company by those considered to be insiders of the company and submitted each month to securities commissions.
Instalment DebenturesA bond or debenture issue in which a predetermined amount of principal matures each year.
Instalment ReceiptsA new issue of stock sold with the obligation that buyers will pay the issue price in a specifi ed series of instalment payments instead of one lump sum payment. Also known as Partially Paid Shares.
Institutional ClientA legal entity that represents the collective fi nancial interests of a large group. A

© CSI GLOBAL EDUCATION INC. (2010)
GLOSSARY G•17
mutual fund, insurance company, pension fund and corporate treasury are just a few examples.
Insured Asset AllocationAn asset allocation strategy whereby there is a base portfolio value below which the portfolio is not allowed to drop.
Intangible AssetAn asset having no physical substance (e.g., goodwill, patents, franchises, copyrights).
Integrated Asset AllocationAn asset allocation strategy that refers to an all-encompassing strategy that includes consideration of capital market expectations and client risk tolerance.
InterestMoney charged by a lender to a borrower for the use of his or her money.
Interest Coverage RatioA debt ratio that tests the ability of a company to pay the interest charges on its debt and indicates how many times these charges are covered based upon earnings available to pay them.
Interest Rate RiskThe risk that changes in interest rates will adversely affect the value of an investor’s portfolio. For example, a portfolio with a large holding of long-term bonds is vulnerable to signifi cant loss from changes in interest rates.
International Monetary Fund (IMF)Entity whose purpose is to promote cooperation and collaboration on international monetary and trade issues.
Interval FundsA type of mutual fund that has the fl exibility to buy back its outstanding shares periodically. Also known as closed-end discretionary funds.
In-the-MoneyA call option is in-the-money if its strike price is below the current market price of the underlying security. A put option is in-the-money if its strike price is above the current market price of the underlying security. The in-the-money amount is the option’s intrinsic value.
Intrinsic ValueThat portion of a warrant or call option’s price that represents the amount by which the market price of a security exceeds the price at which the warrant or call option
may be exercised (exercise price). Considered the theoretical value of a security (i.e., what a security should be worth or priced at in the market).
InventoryThe goods and supplies that a company keeps in stock. A balance sheet item.
Inventory Turnover RatioCost of goods sold divided by inventory. The ratio may also be expressed as the number of days required to sell current inventory by dividing the ratio into 365.
InvestmentThe use of money to make more money, to gain income or increase capital or both.
Investment Advisor (IA)An individual licensed to transact in the full range of securities. IAs must be registered in by the securities commission of the province in which he or she works. The term refers to employees of SRO member fi rms only. Also known as a Registrant or Registered Representative (RR).
Investment Company, or FundA company which uses its capital to invest in other companies. There are two principal types: closed-end and open-end or mutual fund. Shares in closed-end investment companies are readily transferable in the open market and are bought and sold like other shares. Capitalization is fi xed. Open-end funds sell their own new shares to investors, buy back their old shares, and are not listed. Open-end funds are so-called because their capitalization is not fi xed; they normally issue more shares or units as people want them.
Investment CounsellorA professional engaged to give investment advice on securities for a fee.
Investment DealerA person or company that engages in the business of trading in securities in the capacity of an agent or principal and is a member of IIROC.
Investment Industry Association of Canada (IIAC)A member-based professional association that represents the interests of market participants.
Investment Industry Regulatory Organization of Canada (IIROC) The Canadian investment industry’s national self-regulatory organization. IIROC carries out its regulatory responsibilities through setting and enforcing rules regarding the profi ciency, business and fi nancial conduct of dealer fi rms and their registered employees and through setting and enforcing market integrity rules regarding trading activity on Canadian equity marketplaces.
Investment Policy StatementThe agreement between a portfolio manager and a client that provides the guidelines for the manager.
InvestorOne whose principal concern is the minimization of risk, in contrast to the speculator, who is prepared to accept calculated risk in the hope of making better-than-average profi ts, or the gambler, who is prepared to take even greater risks.
Irrevocable Benefi ciaryA benefi ciary whose entitlements under the segregated fund contract cannot be terminated or changed without his or her consent.
IssueAny of a company’s securities; the act of distributing such securities.
Issued SharesThat part of authorized shares that have been sold by the corporation and held by the shareholders of the company.
Issuer BidAn offer by an issuer to security holders to buy back any of its own shares or other securities convertible into its shares.
JitneyThe execution and clearing of orders by one member of a stock exchange for the account of another member. Example: Broker A is a small fi rm whose volume of business is not suffi cient to maintain a trader on the fl oor of the exchange. Instead it gives its orders to Broker B for execution and clearing and pays a reduced percentage of the normal commission.
Junior Bond IssueA corporate bond issue, the collateral for which has been pledged as security for other more senior debt issues and is therefore subject to these prior claims.
© CSI GLOBAL EDUCATION INC. (2010)
CANADIAN SECURITIES COURSEG•18
Junior DebtOne or more junior bond issues.
Keynesian EconomicsEconomic policy developed by British economist John Maynard Keynes who proposed that active government intervention in the market was the only method of ensuring economic growth and prosperity. See also Monetarism.
Know Your Client Rule (KYC)The cardinal rule in making investment recommendations. All relevant information about a client must be known in order to ensure that the registrant’s recommendations are suitable.
Labour ForceThe sum of the population aged 15 years and over who are either employed or unemployed.
Labour Sponsored Venture Capital Corporations (LSVCC)LSVCCs are investment funds, sponsored by labour organizations, that have a specifi c mandate to invest in small to medium-sized businesses. To encourage this mandate, governments offer generous tax credits to investors in LSVCCs.
Lagging IndicatorsA selection of statistical data, that on average, indicate highs and lows in the business cycle behind the economy as a whole. These relate to business expenditures for new plant and equipment, consumers’ instalment credit, short-term business loans, the overall value of manufacturing and trade inventories.
Large Value Transfer System (LVTS)A Canadian Payments Association electronic system for the transfer of large value payments between participating fi nancial institution.
Leading IndicatorsA selection of statistical data that, on average, indicate highs and lows in the business cycle ahead of the economy as a whole. These relate to employment, capital investment, business starts and failures, profi ts, stock prices, inventory adjustment, housing starts and certain commodity prices.
LEAPSLong Term Equity Anticipation Securities are long-term (2-3 year) option contracts.
LeverageThe effect of fi xed charges (i.e., debt interest or preferred dividends, or both) on per-share earnings of common stock. Increases or decreases in income before fi xed charges result in magnifi ed percentage increases or decreases in earnings per common share. Leverage also refers to seeking magnifi ed percentage returns on an investment by using borrowed funds, margin accounts or securities which require payment of only a fraction of the underlying security’s value (such as rights, warrants or options).
LiabilitiesDebts or obligations of a company, usually divided into current liabilities—those due and payable within one year—and long-term liabilities—those payable after one year. A balance sheet category.
Liability TradersHave the responsibility to manage a dealer’s trading capital to encourage market fl ows and facilitate the client orders that go into the market, while aiming to lose as little of that capital as possible. Liability traders can be considered those who set the direction for agency traders. Whereas agency traders have formal client responsibilities, liability traders have lighter responsibilities or none at all.
Life CycleA model used in fi nancial planning that tries to link age with investing. The underlying theory is that an individual’s asset mix will change, as they grow older. However the life cycle is not a substitute for the “know your client rule”.
Limit OrderA client’s order to buy or sell securities at a specifi c price or better. The order will only be executed if the market reaches or betters that price.
Limited LiabilityThe word limited at the end of a Canadian company’s name implies that liability of the company’s shareholders is limited to the money they paid to buy the shares. By contrast, ownership by a sole proprietor or partnership carries unlimited personal legal responsibility for debts incurred by the business.
Limited PartnershipA type of partnership whereby a limited partner cannot participate in the daily
business activity and liability is limited to the partner’s investment.
Liquidity1. The ability of the market in a particular security to absorb a reasonable amount of buying or selling at reasonable price changes. 2. A corporation’s current assets relative to its current liabilities; its cash position.
Liquidity Preference TheoryA theory that tries to explain the shape of the yield curve. It postulates that investors want to invest for the short-term because they are risk averse. Borrowers, however, want long-term money. In order to entice investors to invest long-term, borrowers must offer higher rates for longer-term money. This being the case, the yield curve should slope upwards refl ecting the higher rates for longer borrowing periods.
Liquidity RatiosFinancial ratios that are used to judge the company’s ability to meet its short-term commitments. See Current Ratio.
Liquidity RiskThe risk that an investor will not be able to buy or sell a security quickly enough because buying or selling opportunities are limited.
Listed StockThe stock of a company which is traded on a stock exchange.
Listing AgreementA stock exchange document published when a company’s shares are accepted for listing. It provides basic information on the company, its business, management, assets, capitalization and fi nancial status.
LoadThe portion of the offering price of shares of most open-end investment companies (mutual funds) which covers sales commissions and all other costs of distribution.
London InterBank Offered Rate (LIBOR)The rate of interest charged by large international banks dealing in Eurodollars to other large international banks.
Long PositionSignifi es ownership of securities. “I am long 100 BCE common” means that the speaker owns 100 common shares of BCE Inc.

© CSI GLOBAL EDUCATION INC. (2010)
GLOSSARY G•19
Long-Term BondA bond with greater than 10 years remaining to maturity.
MacroeconomicsMacroeconomics focuses on the performance of the economy as a whole. It looks at the broader picture and to the challenges facing society as a result of the limited amounts of natural resources, human effort and skills, and technology.
Major TrendUnderlying price trend prevailing in a market despite temporary declines or rallies.
Managed AccountAn account whereby a licensed portfolio manager has the discretion to decide and execute suitable investment decisions on behalf of clients.
Managed ProductA pool of capital gathered to buy securities according to a specifi c investment mandate. The pool seeds a fund managed by an investment professional that is paid a management fee to carry out the mandate.
Management Expense RatioThe total expense of operating a mutual fund expressed as a percentage of the fund’s net asset value. It includes the management fee as well as other expenses charged directly to the fund such as administrative, audit, legal fees etc., but excludes brokerage fees. Published rates of return are calculated after the management expense ratio has been deducted.
Management FeeThe fee that the manager of a mutual fund or a segregated fund charges the fund for managing the portfolio and operating the fund. The fee is usually set as fi xed percentage of the fund’s net asset value.
Managers’ Discussion and Analysis (MD&A)A document that requires management of an issuer to discuss the dynamics of its business and to analyze its fi nancial statements with the focus being on information about the issuer’s fi nancial condition and operations with emphasis on liquidity and capital resources.
MarginThe amount of money paid by a client when he or she uses credit to buy a security. It is the difference between the market
value of a security and the amount loaned by an investment dealer.
Margin AgreementA contract that must be completed and signed by a client and approved by the fi rm in order to open a margin account. This sets out the terms and conditions of the account.
Margin CallWhen an investor purchases an account on margin in the expectation that the share value will rise, or shorts a security on the expectation that share price will decline, and share prices go against the investor, the brokerage fi rm will send out a margin call requiring that the investor add additional funds or marketable securities to the account to protect the broker’s loan.
Marginal Tax RateThe tax rate that would have to be paid on any additional dollars of taxable income earned
MarketAny arrangement whereby products and services are bought and sold, either directly or through intermediaries.
Market CapitalizationThe dollar value of a company based on the market price of its issued and outstanding common shares. It is calculated by multiplying the number of outstanding shares by the current market price of a share.
Market CorrectionA price reversal that typically occurs when a security has been overbought or oversold in the market.
Market MakerA trader employed by a securities fi rm who is authorized and required, by applicable self-regulatory organizations (SROs), to maintain reasonable liquidity in securities markets by making fi rm bids or offers for one or more designated securities.
Market OrderAn order placed to buy or sell a security immediately at the best current price.
Market RiskThe non-controllable or systematic risk associated with equities.
Market Segmentation TheoryA theory on the structure of the yield curve. It is believed that large institutions
shape the yield curve. The banks prefer to borrow short term while the insurance industry, with a longer horizon, prefers long-term money. The supply and demand of the large institutions shapes the curve.
Market TimingDecisions on when to buy or sell securities based on economic factors, such as the strength of the economy and the direction of interest rates, or based on stock price movements and the volume of trading through the use of technical analysis.
MarketabilityA measure of the ability to buy and sell a security. A security has good marketability if there is an active secondary market in which it can be easily bought and sold at a fair price.
Marketable BondsBonds for which there is a ready market (i.e., clients will buy them because the prices and features are attractive).
Marking-to-MarketThe process in the futures market in which the daily price changes are paid by the parties incurring losses to the parties earning profi ts.
Married Put or a Put HedgeThe purchase of an underlying asset and the purchase of a put option on that underlying asset.
Material ChangeA change in the affairs of a company that is expected to have a signifi cant effect on the market value of its securities.
Mature IndustryAn industry that experiences slower, more stable growth rates in earnings and sales than growth or emerging industries, for example.
MaturityThe date on which a loan or a bond or debenture comes due and is to be paid off.
Maturity DateThe date at which the contract expires, and the time at which any maturity guarantees are based. Segregated fund contracts normally mature in 10 years, although companies are allowed to set longer periods. Maturities of less than 10 years are permitted only for funds such as protected mutual funds, which are regulated as securities and are not segregated funds.
© CSI GLOBAL EDUCATION INC. (2010)
CANADIAN SECURITIES COURSEG•20
Maturity GuaranteeThe minimum dollar value of the contract after the guarantee period, usually 10 years. This amount is also known as the annuity benefi t.
Medium-Term BondA bond with 5 to 10 years remaining to maturity.
MicroeconomicsAnalyzes the market behaviour of individual consumers and fi rms, how prices are determined, and how prices determine the production, distribution, and use of goods and services.
MonetaristsSchool of economic theory which states that the level of prices as well as economic output is determined by an economy’s money supply. This school of thought believes that control of the money supply is more vital to economic prosperity than the level of government spending, for example. See also Keynesian Policy.
Monetary AggregatesAn aggregate that measures the quantity of money held by a country’s households, fi rms and governments. It includes various forms of money or payment instruments grouped according to their degree of liquidity, such as M1, M2 or M3.
Monetary PolicyEconomic policy designed to improve the performance of the economy by regulating money supply and credit. The Bank of Canada achieves this through its infl uence over short-term interest rates.
Money MarketThat part of the capital market in which short-term fi nancial obligations are bought and sold. These include treasury bills and other federal government securities, and commercial paper, and bankers’ acceptances and other instruments with one year or less left to maturity. Longer term securities, when their term shortens to the limits mentioned, are also traded in the money market.
Money Purchase Plan (MPP)A type of Registered Pension Plan; also called a Defi ned Contribution Plan. In this type of plan, the annual payout is based on the contributions to the plan and the amounts those contributions have earned over the years preceding retirement. In
other words, the benefi ts are not known but the contributions are.
Montréal Exchange (ME)See Bourse de Montréal.
MortgageA contract specifying that certain property is pledged as security for a loan.
Mortgage-Backed SecuritiesBonds that claim ownership to a portion of the cash fl ows from a group or pool of mortgages. They are also known as mortgage pass-through securities. A servicing intermediary collects the monthly payments from the issuers and, after deducting a fee, passes them through (i.e., remits them) to the holders of the security. The MBS provides liquidity in an otherwise illiquid market. Every month, holders receive a proportional share of the interest and principal payments associated with those mortgages.
Mortgage BondA bond issue secured by a mortgage on the issuer’s property.
Moving AverageThe average of security or commodity prices calculated by adding the closing prices for the underlying security over a pre-determined period and dividing the total by the time period selected.
Moving Average Convergence-Divergence (MACD)A technical analysis tool that takes the difference between two moving averages and then generates a smoothed moving average on the difference (the divergence) between the two moving averages.
Multi-Disciplinary AccountsFee-based accounts that are an evolution of separately managed accounts. With multi-disciplinary accounts, separate models are combined into one overall portfolio model in a single account.
Multi-Manager AccountsA type of fee-based account that offers clients and their advisors more choice in terms of product and services. Often, clients are aligned with two or more portfolio models and each portfolio model is a component of the client’s greater diversifi ed holdings.
MultipleA colloquial term for the Price/Earnings ratio of a company’s common shares.
Mutual FundAn investment fund operated by a company that uses the proceeds from shares and units sold to investors to invest in stocks, bonds, derivatives and other fi nancial securities. Mutual funds offer investors the advantages of diversifi cation and professional management and are sold on a load or no load basis. Mutual fund shares/units are redeemable on demand at the fund’s current net asset value per share (NAVPS).
Mutual Fund Dealers Association (MFDA)The Self-Regulatory Organization (SRO) that regulates the distribution (dealer) side of the mutual fund industry in Canada.
Mutual Fund WrapsAre established with a selection of individual funds managed within a client’s account. Mutual fund wraps differ from funds of funds. The client holds the actual funds within their account, as opposed to a fund that simply invests in other funds. In most cases, a separate account is established for the client and the selected funds are held inside that dedicated account.
Naked WriterA seller of an option contract who does not own an offsetting position in the underlying security or a suitable alternative.
NASDAQAn acronym for the National Association of Securities Dealers Automated Quotation System. NASDAQ is a computerized system that provides brokers and dealers with price quotations for securities traded OTC.
National DebtThe accumulation of total government borrowing over time .It is the sum of past defi cits minus the sum of past surpluses.
National PoliciesThe Canadian Securities Administrators have developed a number of policies that are applicable across Canada. These coordinated efforts by the CSA are an attempt to create a national securities regulatory framework. Copies of policies are available from each provincial regulator.
© CSI GLOBAL EDUCATION INC. (2010)
GLOSSARY G•21
National Do Not Call List (DNCL)The Canadian Radio-television and Telecommunications Commission (CRTC) has established Rules that telemarketers and organizations that hire telemarketers must follow. The DNCL Rules prohibit telemarketers and clients of telemarketers from calling telephone numbers that have been registered on the DNCL for more than 31 days.
National Registration Database (NRD)A web-based system that permits mutual fund salespersons and investment advisors to fi le applications for registration electronically.
Natural Unemployment RateAlso called the full employment unemployment rate or the nonaccelerating infl ation rate of unemployment (NAIRU). At this level of unemployment, the economy is thought to be operating at close to its full potential or capacity.
Near BanksSee Country Banks.
Negative Pledge ProvisionA protective provision written into the trust indenture of a company’s debenture issue providing that no subsequent mortgage bond issue may be secured by all or part of the company’s assets, unless at the same time the company’s debentures are similarly secured.
NegotiableA certifi cate that is transferable by delivery and which, in the case of a registered certifi cate, has been duly endorsed and guaranteed.
Negotiated OfferA term describing a particular type of fi nancing in which the investment dealer negotiates with the corporation on the issuance of securities. The details would include the type of security to be issued, the price, coupon or dividend rate, special features and protective provisions.
Net Asset ValueFor a mutual fund, net asset value represents the market value of the fund’s share and is calculated as total assets of a corporation less its liabilities. Net asset value is typically calculated at the close of each trading day. Also referred to as the book value of a company’s different classes of securities.
Net Carrying Amount (Net Book Value of the Assets)The value of capital assets recorded on the balance sheet less accumulated depreciation or amortization.
Net ChangeThe change in the price of a security from the closing price on one day to the closing price on the following trading day. In the case of a stock which is entitled to a dividend one day, but is traded ex-dividend the next, the dividend is not considered in computing the change. The same applies to stock splits. A stock selling at $100 the day before a two-for-one split and trading the next day at $50 would be considered unchanged. The net change is ordinarily the last fi gure in a stock price list. The mark +1.10 means up $1.10 a share from the last sale on the previous day the stock traded.
Net EarningsThat part of a company’s profi ts remaining after all expenses and taxes have been paid and out of which dividends may be paid.
Net Profi t MarginA profi tability ratio that indicates how effi ciently the company is managed after taking into account both expenses and taxes.
New Account Application Form (NAAF)A form that is fi lled out by the client and the IA at the opening of an account. It gives relevant information to make suitable investment recommendations. The NAAF must be completed and approved before any trades are put through on an account.
New IssueAn offering of stocks or bonds sold by a company for the fi rst time. Proceeds may be used to retire outstanding securities of the company, to purchase fi xed assets or for additional working capital. New debt issues are also offered by government bodies.
New York Stock Exchange (NYSE)Oldest and largest stock exchange in North America with more than 1,600 companies listed on the exchange.
NEXA new and separate board of the TSX Venture Exchange that provides a trading forum for companies that have fallen below the Venture Exchange’s listing standards. Companies that have low levels of business activity or who do not carry on active
business will trade on the NEX board, while companies that are actively carrying on business will remain with the main TSX Venture Exchange stock list.
No Par Value (n.p.v.)Indicates a common stock has no stated face value.
Nominal GDPGross domestic product based on prices prevailing in the same year not corrected for infl ation. Also referred to as current dollar or chained dollar GDP.
Nominal RateThe quoted or stated rate on an investment or a loan. This rate allows for comparisons but does not take into account the effects of infl ation.
NomineeA person or fi rm (bank, investment dealer, CDS) in whose name securities are registered. The shareholder, however, retains the true ownership of the securities.
Non-Client and Professional OrdersA type of order for the account of partners, directors, offi cers, major shareholders, IAs and employees of member fi rms that must be marked “PRO” , “N-C” or “Emp”, in order to ensure that client orders are given priority for the same securities.
Non-Competitive TenderA method of distribution used in particular by the Bank of Canada for Government of Canada marketable bonds. Primary distributors are allowed to request bonds at the average price of the accepted competitive tenders. There is no guarantee as to the amount, if any, received in response to this request.
Non-Controlling Interest1. The equity of the shareholders who do not hold controlling interest in a controlled company; 2. In consolidated fi nancial statements (i) the item in the balance sheet of the parent company representing that portion of the assets of a consolidated subsidiary considered as accruing to the shares of the subsidiary not owned by the parent; and (ii) the item deducted in the earnings statement of the parent and representing that portion of the subsidiary’s earnings considered as accruing to the subsidiary’s shares not owned by the parent. Also referred to as minority interest.

© CSI GLOBAL EDUCATION INC. (2010)
CANADIAN SECURITIES COURSEG•22
Non-CumulativeA preferred dividend that does not accrue or accumulate if unpaid.
Non-Trading EmployeesEmployees of securities fi rms who are not primarily engaged in sales may occasional accept orders from the public. Such employees are designated as Non-Trading Employees and may be exempt from registration by the administrator.
Odd LotA number of shares which is less than a standard trading unit. Usually refers to a securities trade for less than 100 shares, sometimes called a broken lot. Trading in less than 100 shares typically incurs a higher per share commission.
Of RecordOn the company’s books or records. If, for example, a company announces that it will pay a dividend on January 15 to shareholders of record, every shareholder whose name appears on the company’s books on that date will be sent a dividend cheque from the company.
OfferThe lowest price at which a person is willing to sell; as opposed to bid which is the highest price at which one is willing to buy.
Offering MemorandumThis document is prepared by the dealer involved in a new issue outlining some of the salient features of the new issue, but not the price or other issue-specifi c details. It is used as a pre-marketing tool in assessing the market for the issue as well as for obtaining expressions of interest.
Offering PriceThe price that an investor pays to purchase shares in a mutual fund. The offering price includes the charge or load that is levied when the purchase is made.
Offsetting TransactionA futures or option transaction that is the exact opposite of a previously established long or short position.
Off-the-BoardThis term may refer to transactions over-the-counter in unlisted securities, or, in a special situation, to a transaction involving a block of listed shares which is not executed on a recognized stock exchange.
Offi ce of the Superintendent of Financial Institutions (OSFI)The federal regulatory agency whose main responsibilities regarding insurance companies and segregated funds are to ensure that the companies issuing the funds are fi nancially solvent.
Offi cersCorporate employees responsible for the day-to-day operation of the business.
Old Age Security (OAS)A government pension plan payable at age 65 to all Canadian citizens and legal residents.
Ombudsman for Banking Services and Investments (OBSI)An independent organization that investigates customer complaints against fi nancial services providers.
Open-End FundSee Mutual Fund.
Open InterestThe total number of outstanding option contracts for a particular option series. An opening transaction would increase open interest, while a closing transaction would decrease open interest. It is used as one measure of an option class’s liquidity.
Open Market OperationsMethod through which the Bank of Canada infl uences interest rates by trading securities with participants in the money market.
Open OrderAn order usually entered at a specifi ed price (perhaps at the market) to buy or sell a security that is held open until executed or cancelled.
Opening TransactionAn option transaction that is considered the initial or primary transaction. An opening transaction creates new rights for the buyer of an option, or new obligations for a seller. See also Closing Transaction.
Operating BandThe Bank of Canada’s 50-basis-point range for the overnight lending rate. The top of the band, the Bank Rate, is the rate charged by the Bank on LVTS advances to fi nancial institutions. The bottom of the band is the rate paid by the Bank on any LVTS balances held overnight by those institutions. The middle of the operating band is the target for the overnight rate.
Operating Cash Flow RatioA liquidity ratio that shows how well liabilities to be paid within one year are covered by the cash fl ow generated by the company’s operating activities.
Operating IncomeThe income that a company records from its main ongoing operations.
Operating Performance RatiosA type of ratio that illustrates how well management is making use of company resources.
Operating Profi t MarginA profi tability ratio that is a stringent measure of a company’s ability to manage its resources effectively.
OptionA right to buy or sell specifi c securities or properties at a specifi ed price within a specifi ed time. See Put Options and Call Options.
Option PremiumThe amount paid to enter into an option contract, paid by the buyer to the seller or writer of the contract.
Option WriterThe seller of the option who may be obligated to buy (put writer) or sell (call writer) the underlying interest if assigned by the option buyer.
OscillatorA technical analysis indicator used when a stock’s chart is not showing a defi nite trend in either direction. When the oscillator reading reaches an extreme value in either the upper or lower band, this suggest that the current price move has gone too far. This may indicate that the price move is overextended and vulnerable.
Out-of-the-MoneyA call option is out-of-the-money if the market price of the underlying security is below its strike price. A put option is out-of-the-money if the market price of the underlying security is above the strike price.
Output GapThe difference between the actual level of output and the potential level of output when the economy is using all available resources of capital and labour.
Outstanding SharesThat part of issued shares which remains outstanding in the hands of investors.

© CSI GLOBAL EDUCATION INC. (2010)
GLOSSARY G•23
Over-Allotment OptionAn activity used to stabilize the aftermarket price of a recently issued security. If the price increases above the offer price, dealers can cover their short position by exercising an overallotment option (also referred to as a green shoe option) by either increasing demand in the case of covering a short position or increasing supply in the case of over-allotment option exercise.
OvercontributionAn amount made in excess to the annual limit made to an RRSP. An overcontribution in excess of$2,000 is penalized at a rate of 1% per month.
Overlay ManagerThe overlay manager works with advisors in servicing clients. This is not a referral but a partnership, in which the advisor retains the client’s assets. The service incorporates the existing trusted relationship of the advisor, whom the client has become comfortable dealing with.
OverrideIn an underwriting, the additional payment the Financing Group receives over and above their original entitlement for their services as fi nancial advisors and syndicate managers or leads.
Over-the-Counter (OTC)A market for securities made up of securities dealers who may or may not be members of a recognized stock exchange. Over-the-counter is mainly a market conducted over the telephone. Also called the unlisted, inter-dealer or street market. NASDAQ is an example of an over-the- counter market.
Paper Profi tAn unrealized profi t on a security still held. Paper profi ts become realized profi ts only when the security is sold. A paper loss is the opposite to this.
Par ValueThe stated face value of a bond or stock (as assigned by the company’s charter) expressed as a dollar amount per share. Par value of a common stock usually has little relationship to the current market value and so no par value stock is now more common. Par value of a preferred stock is signifi cant as it indicates the dollar amount of assets each preferred share would be entitled to should the company be liquidated.
Pari PassuA legal term meaning that all securities within a series have equal rank or claim on earnings and assets. Usually refers to equally ranking issues of a company’s preferred shares.
Participating FeaturePreferred shares which, in addition to their fi xed rate of prior dividend, share with the common in further dividend distributions and in capital distributions above their par value in liquidation.
Participating OrganizationsA fi rm entitled to trade through the Toronto Stock Exchange or TSX Venture Exchange. The equivalent term on the Bourse de Montréal is Approved Participant.
Participation RateThe share of the working-age population (15 and older) that is in the labour market, either working or looking for work.
PartnershipA form of business organization that involves two or more people contributing to the business and legislated under the federal Partnership Act.
Past Service Pension Adjusted (PSPA)An employer may increase a member’s pension by the granting of additional past service benefi ts to an employee in a defi ned benefi t plan. Plan members who incur a PSPA will have their RRSP contribution room reduced by the amount of this adjustment.
Payback PeriodThe time that it takes for a convertible security to recoup its premium through its higher yield, compared with the dividend that is paid on the stock.
Peer GroupA group of managed products (particularly mutual funds) with a similar investment mandate.
Penny StocksLow-priced speculative issues selling at less than $1 a share. Frequently used as a term of disparagement, although some penny stocks have developed into investment calibre issues.
Pension Adjustment (PA)The amount of contributions made or the value of benefi ts accrued to a member of an
employer-sponsored retirement plan for a calendar year. The PA enables the individual to determine the amount that may be contributed to an RRSP that would be in addition to contributions into a Registered Pension Plan.
Performance BondsWhat is often required upon entry into a futures contract giving the parties to a contract a higher level of assurance that the terms of the contract will eventually be honoured. The performance bond is often referred to as margin.
Permitted ClientAn entity sophisticated or large enough that the provisions of National Instrument 33-103 are not required. A permitted client may include a Canadian bank, a trust company, a person or company registered as an adviser or dealer (subject to a few exceptions), a pension fund; any level of government (federal, provincial or municipal), or an investment fund advised by a registered portfolio manager.
Perpetual BondsA unique type of debt security that has no maturity date.
Personal Disposable IncomeThe amount of personal income an individual has after taxes. The income that can be spent on necessities, nonessential goods and services, or that can be saved.
Phillips CurveA graph showing the relationship between infl ation and unemployment. The theory states that unemployment can be reduced in the short run by increasing the price level (infl ation) at a faster rate. Conversely, infl ation can be lowered at the cost of possibly increased unemployment and slower economic growth.
Piggyback WarrantsA second series of warrants acquired upon exercise of primary warrants sold as part of a unit.
PointRefers to security prices. In the case of shares, it means $1 per share. In the case of bonds and debentures, it means 1% of the issue’s par value, which is almost universally 100. On a $1,000 bond, one point represents 1% of the face value of the bond or $10. See Basic point

© CSI GLOBAL EDUCATION INC. (2010)
CANADIAN SECURITIES COURSEG•24
Policy-Based GuaranteeA maturity guarantee based on the date when the policy was fi rst issued. This type of guarantee may involve restrictions on the size of and date of subsequent deposits.
Political RiskThe risk associated with a government introducing unfavourable policies making investment in the country less attractive. Political risk also refers to the general instability associated with investing in a particular country.
Pooled AccountA type of managed product structure whereby by investors’ funds are gathered into a legal structure, usually a trust or corporation. An investor’s claim to the pool’s returns is proportional to the number of shares or units the investor owns. The pools are often open-ended, which means units are issued when there are net cash infl ows to the fund, or units are redeemed when there are net cash outfl ows.
Pooling of InterestOccurs when a company issues treasury shares for the assets of another company so that the latter becomes a division or subsidiary of the acquiring company. Subsequent accounts of the parent company are set up to include the retained earnings and assets at book value (subject to certain adjustments) of the acquired company.
PortfolioHoldings of securities by an individual or institution. A portfolio may contain debt securities, preferred and common stocks of various types of enterprises and other types of securities.
Potential OutputThe maximum amount of output the economy is capable of producing during a given period when all of its available resources are employed to their most effi cient use.
Preemptive Rights ClauseA term in a company’s charter that states that if a company wishes to issue additional new shares they must give the “right of fi rst refusal” to the existing shareholders. This allows the existing shareholders to maintain their proportionate interest.
Preferred Dividend Coverage RatioA type of profi tability ratio that measures the amount of money a fi rm has available
to pay dividends to their preferred shareholders.
Preferred SharesA class of share capital that entitles the owners to a fi xed dividend ahead of the company’s common shares and to a stated dollar value per share in the event of liquidation. Usually do not have voting rights unless a stated number of dividends have been omitted. Also referred to as preference shares.
Preliminary ProspectusThe initial document released by an underwriter of a new securities issue to prospective investors.
PremiumThe amount by which a preferred stock or debt security may sell above its par value. In the case of a new issue of bonds or stocks, the amount the market price rises over the original selling price. Also refers to that part of the redemption price of a bond or preferred share in excess of face value, par value or market price. In the case of options, the price paid by the buyer of an option contract to the seller.
Prepaid ExpensesPayments made by the company for services to be received in the near future. For example, rents, insurance premiums and taxes are sometimes paid in advance. A balance sheet item.
Prepayment RiskThe risk that the issuer of a bond might prepay or redeem early some or all principal outstanding on the loan or mortgage.
Prescribed RateA quarterly interest rate set out, or prescribed by Canada Revenue Agency under attribution rules. The rate is based on the Bank of Canada rate.
Present ValueThe current worth of a sum of money that will be received sometime in the future.
Price-Earnings (P/E) RatioA value ratio that gives investors an idea of how much they are paying for a company’s earnings. Calculated as the current price of the stock divided current earnings per share.
Primary Distribution or Primary Offering of a New IssueThe original sale of any issue of a company’s securities.
Primary MarketThe market for new issues of securities. The proceeds of the sale of securities in a primary market go directly to the company issuing the securities. See also Secondary Market.
Prime RateThe interest rate chartered banks charge to their most credit-worthy borrowers.
PrincipalThe person for whom a broker executes an order, or a dealer buying or selling for its own account. The term may also refer to a person’s capital or to the face amount of a bond.
Principal Protected NoteA debt-like instrument with a maturity date whereby the issuer agrees to repay investors the amount originally invested (the principal) plus interest. The interest rate is tied to the performance of an underlying asset, such as a portfolio of mutual funds or common stocks, a market index, a hedge fund or a portfolio of hedge funds. PPNs guarantee only the return of the principal.
Private EquityThe fi nancing of fi rms unwilling or unable to fi nd capital using public means—for example, via the stock or bond markets.
Private Family Offi ceAn extension of the advisor’s client servicing approach. In this approach, instead of having only one advisor, a team of professionals handles all of an affl uent client’s fi nancial affairs within one central location.
Private PlacementThe underwriting of a security and its sale to a few buyers, usually institutional, in large amounts.
Pro FormaA term applied to a document drawn up after giving effect to certain assumptions or contractual commitments not yet completed. For example, an issuer of new securities is required to include in the prospectus a statement of its capitalization on a pro forma basis after giving effect to the new fi nancing.

© CSI GLOBAL EDUCATION INC. (2010)
GLOSSARY G•25
Pro RataIn proportion to. For example, a dividend is a pro rata payment because the amount of dividend each shareholder receives is in proportion to the number of shares he or she owns.
ProbateA provincial fee charged for authenticating a will. The fee charged is usually based on the value of the assets in an estate rather than the effort to process the will.
ProductivityThe amount of output per worker used as a measure of effi ciency with which people and capital are combined in the output of the economy. Productivity gains lead to improvements in the standard of living, because as labour, capital, etc. produce more, they generate greater income.
Profi tability RatiosFinancial ratios that illustrate how well management has made use of the company’s resources.
Program TradingA sophisticated computerized trading strategy whereby a portfolio manager attempts to earn a profi t from the price spreads between a portfolio of equities similar or identical to those underlying a designated stock index, e.g., the Standard & Poor 500 Index, and the price at which futures contracts (or their options) on the index trade in fi nancial futures markets. Also refers to switching or trading blocks of securities in order to change the asset mix of a portfolio.
ProspectusA legal document that describes securities being offered for sale to the public. Must be prepared in conformity with requirements of applicable securities commissions. See also Red Herring and Final Prospectus.
Protected FundsA fund legally structured as a mutual fund trust and not governed by insurance legislation. This type of segregated fund can be sold by registered mutual fund salespeople at bank branches and by individual fi nancial advisors who lack life insurance licenses.
ProxyWritten authorization given by a shareholder to someone else, who need not be a shareholder, to represent him or her and
vote his or her shares at a shareholders’ meeting.
Prudent Man RuleAn investment standard. In some provinces, the law requires that a fi duciary, such as a trustee, may invest funds only in a list of securities designated by the province or the federal government. In other provinces, the trustee may invest in a security if it is one that an ordinary prudent person would buy if he were investing for the benefi t of other people for whom he felt morally bound to provide. Most provinces apply the two standards.
Public FloatThat part of the issued shares that are outstanding and available for trading by the public, and not held by company offi cers, directors, or investors who hold a controlling interest in the company. A company’s public fl oat is different from its outstanding shares as it also excludes those shares owned in large blocks by institutions.
Purchase FundA fund set up by a company to retire through purchases in the market a specifi ed amount of its outstanding preferred shares or debt if purchases can be made at or below a stipulated price. See also Sinking Fund.
Pure InsuranceSee Term Insurance.
Put OptionA right to sell the stock at a stated price within a given time period. Those who think a stock may go down generally purchase puts. See also Call Option.
Quantitative AnalysisThe study of economic and stock valuation patterns in order to identify and profi t from any anomalies.
Quick RatioA more stringent measure of liquidity compared with the current ratio. Calculated as current assets less inventory divided by current liabilities. By excluding inventory, the ratio focuses on the company’s more liquid assets.
Quotation or QuoteThe highest bid to buy and the lowest offer to sell a security at a given time. Example: A quote of 45.40–45.50 means that 45.40 is the highest price a buyer will pay and 45.50 the lowest price a seller will accept.
Quotation and Trade Reporting Systems (QTRS)Recognized stock markets that operate in a similar manner to exchanges and provide facilities to users to post quotations and report trades.
RallyA brisk rise in the general price level of the market or in an individual stock.
Random Walk TheoryThe theory that stock price movements are random and bear no relationship to past movements.
Rate of ReturnSee Yield.
Rational ExpectationsSchool of economic theory which argues that investors are rational thinkers and can make intelligent economic decisions after evaluating all available information.
Real Estate Investment Trust (REIT)An investment trust that specializes in real estate related investments including mortgages, construction loans, land and real estate securities in varying combinations. A REIT invests in and manages a diversifi ed portfolio of real estate.
Real GDPGross Domestic Product adjusted for changes in the price level. Also referred to as constant dollar GDP.
Real Interest RateThe nominal rate of interest minus the percentage change in the Consumer Price Index (i.e., the rate of infl ation).
Record DateThe date on which a shareholder must offi cially own shares in a company to be entitled to a declared dividend. Also referred to as the date of record.
Red Herring ProspectusA preliminary prospectus so called because certain information is printed in red ink around the border of the front page. It does not contain all the information found in the fi nal prospectus. Its purpose: to ascertain the extent of public interest in an issue while it is being reviewed by a securities commission.
RedemptionThe purchase of securities by the issuer at a time and price stipulated in the terms of the securities. See also Call Feature.
© CSI GLOBAL EDUCATION INC. (2010)
CANADIAN SECURITIES COURSEG•26
Redemption PriceThe price at which debt securities or preferred shares may be redeemed, at the option of the issuing company.
RedepositAn open-market cash management policy pursued by the Bank of Canada. A redeposit refers to the transfer of funds from the Bank to the direct clearers (an injection of balances) that will increase available funds. See also Drawdown.
Registered Education Savings Plans (RESPs)A type of government sponsored savings plan used to fi nance a child’s post secondary education.
Registered Pension Plan (RPP)A trust registered with Canada Revenue Agency and established by an employer to provide pension benefi ts for employees when they retire. Both employer and employee may contribute to the plan and contributions are tax-deductible. See also Defi ned Contribution Plan and Defi ned Benefi t Plan.
Registered Retirement Income Fund (RRIF)A tax deferral vehicle available to RRSP holders. The planholder invests the funds in the RRIF and must withdraw a certain amount each year. Income tax would be due on the funds when withdrawn.
Registered Retirement Savings Plan (RRSP)An investment vehicle available to individuals to defer tax on a specifi ed amount of money to be used for retirement. The holder invests money in one or more of a variety of investment vehicles which are held in trust under the plan. Income tax on contributions and earnings within the plan is deferred until the money is withdrawn at retirement. RRSPs can be transferred into Registered Retirement Income Funds upon retirement.
Registered SecurityA security recorded on the books of a company in the name of the owner. It can be transferred only when the certifi cate is endorsed by the registered owner. Registered debt securities may be registered as to principal only or fully registered. In the latter case, interest is paid by cheque rather than by coupons attached to the certifi cate. See also Bearer Security.
RegistrarUsually a trust company appointed by a company to monitor the issuing of common or preferred shares. When a transaction occurs, the registrar receives both the old cancelled certifi cate and the new certifi cate from the transfer agent and records and signs the new certifi cate. The registrar is, in effect, an auditor checking on the accuracy of the work of the transfer agent, although in most cases the registrar and transfer agent are the same trust company.
Regular DeliveryThe date a securities trade settles – i.e., the date the seller must deliver the securities. See also Settlement Date.
Regular DividendsA term that indicates the amount a company usually pays on an annual basis.
Reinvestment RiskThe risk that interest rates will fall causing the cash fl ows on an investment, assuming that the cash fl ows are reinvested, to earn less than the original investment. For example, yield to maturity assumes that all interest payments received can be reinvested at the yield to maturity rate. This is not necessarily true. If interest rates in the market fall the interest would be reinvested at a lower rate. Reinvestment risk recognizes this risk.
Relative Strength GraphShows the relative strength of a stock compared to the action of the market as a whole. The price of the stock is calculated as a ratio of some market performance series such as the Dow Jones Industrial Average.
Relative Value Hedge FundsA type of hedge fund that attempts to profi t by exploiting irregularities or discrepancies in the pricing of related stocks, bonds or derivatives.
Reporting IssuerUsually, a corporation that has issued or has outstanding securities that are held by the public and is subject to continuous disclosure requirements of securities administrators.
ReserveAn amount set aside from retained earnings to provide for the payment of contingencies, retirement of preferred stock, or other necessary payouts.
ResetA contract provision which allows the segregated fund contract holder to lock in the current market value of the fund and set a new maturity date 10 years after the reset date. Depending on the contract, the reset dates may be chosen by the contract holder or be triggered automatically.
Resistance LevelThe opposite of a support level. A price level at which the security begins to fall as the number of sellers exceeds the number of buyers of the security.
Restricted SharesShares that participate in a company’s earnings and assets (in liquidation), as common shares do, but generally have restrictions on voting rights or else no voting rights.
Retail InvestorIndividual investors who buy and sell securities for their own personal accounts, and not for another company or organization. They generally buy in smaller quantities than larger institutional investors.
Retained EarningsThe cumulative total of annual earnings retained by a company after payment of all expenses and dividends. The earnings retained each year are reinvested in the business.
Retained Earnings StatementA fi nancial statement that shows the profi t or loss in a company’s most recent year.
RetractableA feature which can be included in a new debt or preferred issue, granting the holder the option under specifi ed conditions to redeem the security on a stated date – prior to maturity in the case of a bond.
Return ForecastingThe prediction of rates of return for each of the three major asset classes as part of the asset allocation process.
Return on EquityA profi tability ratio expressed as a percentage representing the amount earned on a company’s common shares. Return on equity tells the investor how effectively their money is being put to use.

© CSI GLOBAL EDUCATION INC. (2010)
GLOSSARY G•27
Return on Invested CapitalA profi tability ratio that shows the amount earned on a company’s total capital – the sum of its common and preferred shares and long-term debt. It is a useful measure of management effi ciency.
Reversal PatternsFormations that usually precede a sizeable advance or decline in stock prices.
Reverse SplitA process of retiring old shares with fewer shares. For example, an investor owns 1,000 shares of ABC Inc. pre split. A 10 for 1 reverse split or consolidation reduces the number held to 100. Results in a higher share price and fewer shares outstanding.
Revocable Benefi ciaryA benefi ciary whose entitlements under the segregated fund contract can be terminated or changed without his or her consent.
RightA short-term privilege granted to a company’s common shareholders to purchase additional common shares, usually at a discount, from the company itself, at a stated price and within a specifi ed time period. Rights of listed companies trade on stock exchanges from the ex-rights date until their expiry.
Right of Action for DamagesMost securities legislation provides that those who sign a prospectus may be liable for damages if the prospectus contains a misrepresentation. This right extends to experts e.g., lawyers, auditors, geologists, etc., who report or give opinions within the text of the document.
Right of RedemptionA mutual fund’s shareholders have a continuing right to withdraw their investment in the fund simply by submitting their shares to the fund itself and receiving in return the dollar amount of their net asset value. This characteristic is the hallmark of mutual funds. Payment for the securities that have been redeemed must be made by the fund within three business days from the determination of the net asset value.
Right of RescissionThe right of a purchaser of a new issue to rescind the purchase contract within the applicable time limits if the prospectus contained an untrue statement or omitted a material fact.
Right of WithdrawalThe right of a purchaser of a new issue to withdraw from the purchase agreement within two business days after receiving the prospectus.
Risk-AverseDescriptive term used for an investor unable or unwilling to accept the probability or chance of losing capital. See also Risk-Tolerant.
Risk-Free RateThe rate of return an investor would receive if he or she invested in a risk free investment, such as a treasury bill.
Risk PremiumA rate that has to be paid in addition to the risk free rate (T-bill rate) to compensate investors for choosing securities that have more risk than T-Bills.
Risk-TolerantDescriptive term used for an investor willing and able to accept the probability of losing capital. See also Risk-Averse.
Sacrifi ce RatioDescribes the extent to which Gross Domestic Product must be reduced with increased unemployment to achieve a 1% decrease in the infl ation rate.
Sale and Repurchase Agreements (SRAs)An open-market operation by the Bank of Canada to offset undesired downward pressure on overnight fi nancing costs.
SeatA traditional term for membership on a stock exchange.
SECThe Securities and Exchange Commission, a federal body established by the United States Congress, to protect investors in the U.S. In Canada there is no national regulatory authority; instead, securities legislation is provincially administered.
Secondary IssueRefers to the redistribution or resale of previously issued securities to the public by a dealer or investment dealer syndicate. Usually a large block of shares is involved (e.g., from the settlement of an estate) and these are offered to the public at a fi xed price, set in relationship to the stock’s market price.
Secondary MarketThe market where securities are traded through an exchange or over-the-counter subsequent to a primary offering. The proceeds from trades in a secondary market go to the selling dealers and investors, rather than to the companies that originally issued the shares in the primary market.
Securities Paper certifi cates or electronic records that evidence ownership of equity (stocks) or debt obligations (bonds).
Securities ActsProvincial Acts administered by the securities commission in each province, which set down the rules under which securities may be issued and traded.
Securities AdministratorA general term referring to the provincial regulatory authority (e.g., Securities Commission or Provincial Registrar) responsible for administering a provincial Securities Act.
Securities Eligible for Reduced MarginSecurities which demonstrate suffi ciently high liquidity and low price volatility based on meeting specifi c price risk and liquidity risk measures.
SecuritizationRefers in a narrow sense to the process of converting loans of various sorts into marketable securities by packaging the loans into pools. In a broader sense, refers to the development of markets for a variety of debt instruments that permit the ultimate borrower to bypass the banks and other deposit-taking institutions and to borrow directly from lenders.
Segregated FundsInsurance companies sell these funds as an alternative to conventional mutual funds. Like mutual funds, segregated funds offer a range of investment objectives and categories of securities e.g. equity funds, bond funds, balanced funds etc. These funds have the unique feature of guaranteeing that, regardless of how poorly the fund performs, at least a minimum percentage (usually 75% or more) of the investor’s payments into the fund will be returned when the fund matures.
© CSI GLOBAL EDUCATION INC. (2010)
CANADIAN SECURITIES COURSEG•28
Self-Directed RRSPA type of RRSP whereby the holder invests funds or contributes certain acceptable assets such as securities directly into a registered plan which is usually administered for a fee by a Canadian fi nancial services company.
Self-Regulatory Organization (SRO) An organization recognized by the Securities Administrators as having powers to establish and enforce industry regulations to protect investors and to maintain fair, equitable, and ethical practices in the industry and ensure conformity with securities legislation. Canadian SROs include the Investment Industry Regulatory Organization of Canada and, the Mutual Fund Dealers Association.
Selling GroupInvestment dealers or others who assist a banking group in marketing a new issue of securities without assuming fi nancial liability if the issue is not entirely sold. The use of a selling group widens the distribution of a new issue.
Sentiment IndicatorsMeasure investor expectations or the mood of the market. These indicators measure how bullish or bearish investors are.
Separately Managed AccountA managed product structure whereby individual accounts are created for each investor. In either case, an investment manager is guided by an investment mandate.
Serial Bond or DebentureSee Instalment Debenture.
Settlement DateThe date on which a securities buyer must pay for a purchase or a seller must deliver the securities sold. For most securities, settlement must be made on or before the third business day following the transaction date.
Shareholders’ EquityA balance sheet item that represents the excess of the company’s assets over its liabilities and shows shareholder’s interest in the company. Also referred to as net worth as it represents the ownership interest of common and preferred shareholders in a company.
Short-Form Prospectus Distribution SystemThis system allows reporting issuers to issue a short-form prospectus that contains only information not previously disclosed to regulators. The short form prospectus contains by reference the material fi led by the corporation in the Annual Information Form.
Short PositionCreated when an investor sells a security that he or she does not own. See also short sale.
Short SaleThe sale of a security which the seller does not own. This is a speculative practice done in the belief that the price of a stock is going to fall and the seller will then be able to cover the sale by buying it back later at a lower price, thereby making a profi t on the transactions. It is illegal for a seller not to declare a short sale at the time of placing the order. See also Margin.
Short-Term BondA bond with greater than one year but less than fi ve years to maturity.
Short-Term DebtCompany borrowings repayable within one year that appear in the current liabilities section of the balance sheet. The most common short-term debt items are: bank advances or loans, notes payable and the portion of funded debt due within one year.
Single-Manager AccountA type of fee-based account that is directed by a single portfolio manager who focuses considerable time and attention on the selection of securities, the sectors to invest in and the optimal asset allocation.
Simplifi ed ProspectusA condensed prospectus distributed by mutual fund companies to purchasers and potential purchasers of fund units or shares.
Sinking FundA fund set up to retire most or all of a debt or preferred share issue over a period of time. See also Purchase Fund.
Small CapReference to smaller growth companies. Small cap refers to the size of the capitalization or investments made in the company. A small cap company has been defi ned as a company with an outstanding stock value of under $500 million. Small
cap companies are considered more volatile than large cap companies.
Soft LandingDescribes a business cycle phase when economic growth slows sharply but does not turn negative, while infl ation falls or remains low.
Soft Retractable Preferred SharesA type of retractable preferred share where the redemption value may be paid in cash or in common shares, generally at the election of the issuer.
Sole ProprietorshipA form of business organization that involves one person running a business whereby the individual is taxed on earnings at their personal income tax rate.
SPDRsAn acronym for the Standard & Poor Depository Receipts (a type of derivative). These mirror the S&P 500 Index. They are referred to as “Spiders”.
Special Purchase and Resale Agreements (SPRAs)An open-market operation used by the Bank of Canada to relieve undesired upward pressure on overnight fi nancing rates.
SpeculatorOne who is prepared to accept calculated risks in the marketplace. Objectives are usually short to medium-term capital gain, as opposed to regular income and safety of principal, the prime objectives of the conservative investor.
S&P/TSX Composite IndexA benchmark used to measure the performance of the broad Canadian equity market.
Split SharesA security that has been created to divide (or split) the investment attributes of an underlying portfolio of common shares into separate components that satisfy different investment objectives. The preferred shares receive the majority of the dividends from the common shares held by the split share corporation. The capital shares receive the majority of any capital gains on the common shares.

© CSI GLOBAL EDUCATION INC. (2010)
GLOSSARY G•29
Spot PriceThe market price of a commodity or fi nancial instrument that is available for immediate delivery.
Spousal RRSPA special type of RRSP to which one spouse contributes to a plan registered in the benefi ciary spouse’s name. The contributed funds belong to the benefi ciary but the contributor receives the tax deduction. If the benefi ciary removes funds from the spousal plan in the year of the contribution or in the subsequent two calendar years, the contributor must pay taxes on the withdrawn amount.
SpreadThe gap between bid and ask prices in the quotation for a security. Also a term used in option trading.
SROShort for self-regulatory organization such as the Investment Industry Regulatory Organization of Canada.
Standard DeviationA statistical measure of risk. The larger the standard deviation, the greater the volatility of returns and therefore the greater the risk.
Standard Trading UnitA regular trading unit which has uniformly been decided upon by the stock exchanges, in most cases it is 100 shares, but this can vary depending on the price of the stock.
Statement of Cash FlowA fi nancial statement which provides information as to how a company generated and spent its cash during the year. Assists users of fi nancial statements in evaluating the company’s ability to generate cash internally, repay debts, reinvest and pay dividends to shareholders.
Statement of Material FactsA document presenting the relevant facts about a company and compiled in connection with an underwriting or secondary distribution of its shares. It is used only when the shares underwritten or distributed are listed on a recognized stock exchange and takes the place of a prospectus in such cases.
StockOwnership interest in a corporation’s that represents a claim on its earnings and assets.
Stock DividendA pro rata payment to common shareholders of additional common stock. Such payment increases the number of shares each holder owns but does not alter a shareholder’s proportional ownership of the company.
Stock ExchangeA marketplace where buyers and sellers of securities meet to trade with each other and where prices are established according to laws of supply and demand.
Stock Savings PlanSome provinces allow individual residents of the particular province a deduction or tax credit for provincial income tax purposes on investments made in certain prescribed vehicles. The credit or deduction is a percentage fi gure based on the value of investment.
Stock SplitAn increase in a corporation’s number of shares outstanding without any change in the shareholders’ equity or market value. When a stock reaches a high price making it illiquid or diffi cult to trade, management may split the stock to get the price into a more marketable trading range. For example, an investor owns one standard trading unit of a stock that now trades at $70 each (portfolio value is $7,000). Management splits the stock 2:1. The investor would now own 200 new shares at a market value, all things being equal, of $35 each, for a portfolio value of $7,000.
Stop Buy OrdersAn order to buy a security only after it has reached a certain price. This may be used to protect a short position or to ensure that a stock is purchased while its price is rising. According to TSX rules these orders become market orders when the stop price is reached.
Stop Loss OrdersThe opposite of a stop buy order. An order to sell a security after its price falls to a certain amount, thus limiting the loss or protecting a paper profi t. According to TSX rules these orders become market orders when the stop price is reached.
Stop OrdersOrders that are used to buy or sell after a stock has reached a certain price. See Stop Buy Orders, Stop Loss Orders.
Strategic Asset AllocationAn asset allocation strategy that rebalances investment portfolios regularly to maintain a consistent long-term mix.
Street NameSecurities registered in the name of an investment dealer or its nominee, instead of the name of the real or benefi cial owner, are said to be “in street name.” Certifi cates so registered are known as street certifi cates.
Strike PriceThe price, as specifi ed in an option contract, at which the underlying security will be purchased in the case of a call or sold in the case of a put. See also Exercise Price.
Strip Bonds or Zero Coupon BondsUsually high quality federal or provincial government bonds originally issued in bearer form, where some or all of the interest coupons have been detached. The bond principal and any remaining coupons (the residue) then trade separately from the strip of detached coupons, both at substantial discounts from par.
Structural UnemploymentAmount of unemployment that remains in an economy even when the economy is strong. Also known as the natural unemployment rate, the full employment unemployment rate, or the non-accelerating infl ation rate of unemployment (NAIRU).
Structured PreferredsSee Equity Dividend Shares.
Structured ProductA passive investment vehicle fi nancially engineered to provide a specifi c risk and return characteristic. The value of a structured product tracks the returns of reference security known as an underlying asset. Underlying assets can consist of a single security, a basket of securities, foreign currencies, commodities or an index.
Subordinate DebentureA type of junior debenture. Subordinate indicates that another debenture ranks ahead in terms of a claim on assets and profi ts.
Subscription or Exercise PriceThe price at which a right or warrant holder would pay for a new share from the company. With options the equivalent would be the strike price.
© CSI GLOBAL EDUCATION INC. (2010)
CANADIAN SECURITIES COURSEG•30
SubsidiaryCompany which is controlled by another company usually through its ownership of the majority of shares.
SuitabilityA registrant’s major concern in making investment recommendations. All information about a client and a security must be analyzed to determine if an investment is suitable for the client in accounts where a suitability exemption does not apply.
Superfi cial LossesOccur when an investment is sold and then repurchased at any time in a period that is 30 days before or after the sale.
Supply-Side EconomicsAn economic theory whereby changes in tax rates exert important effects over supply and spending decisions in the economy. According to this theory, reducing both government spending and taxes provides the stimulus for economic expansion.
Support LevelA price level at which a security stops falling because the number of investors willing to buy the security is greater than the number of investors wishing to sell the security.
Surrender ValueThe cash value of an insurance contract as of the date that the policy is being redeemed. This amount is equal to the market value of the segregated fund, less any applicable sales charges or administrative fees.
Suspension of TradingAn interruption in trading imposed on a company if their fi nancial condition does not meet an exchange’s requirements for continued trading or if the company fails to comply with the terms of its listing agreement.
SwapAn over-the-counter forward agreement involving a series of cash fl ows exchanged between two parties on specifi ed future dates.
SweetenerA feature included in the terms of a new issue of debt or preferred shares to make the issue more attractive to initial investors. Examples include warrants and/or common shares sold with the issue as a unit or a
convertible or extendible or retractable feature.
SyndicateA group of investment dealers who together underwrite and distribute a new issue of securities or a large block of an outstanding issue.
System for Electronic Disclosure by Insiders (SEDI)SEDI facilitates the fi ling and public dissemination of insider reports in electronic format via the Internet.
System for Electronic Document Analysis and Retrieval (SEDAR)SEDAR facilitates the electronic fi ling of securities information as required by the securities regulatory agencies in Canada and allows for the public dissemination of information collected in the fi ling process
Systematic RiskA non-controllable, non-diversifi able risk that is common to all investments within a given asset class. With equities it is called market risk, with fi xed income securities it would be interest rate risk.
Systematic Withdrawal PlanA plan that enables set amounts to be withdrawn from a mutual fund or a segregated fund on a regular basis.
T3 FormReferred to as a Statement of Trust Income Allocations and Designations. When a mutual fund is held outside a registered plan, unitholders of an unincorporated fund is sent a T3 form by the respective fund.
T4 FormReferred to as a Statement of Remuneration Paid. A T4 form is issued annually by employers to employees reporting total compensation for the calendar year. Employers have until the end of February to submit T4 forms to employees for the previous calendar year.
T5 FormReferred to as a Statement of Investment Income. When a mutual fund is held outside a registered plan, shareholders are sent a T3 form by the respective fund.
Tactical Asset AllocationAn asset allocation strategy that involves adjusting a portfolio to take advantage of perceived ineffi ciencies in the prices of
securities in different asset classes or within sectors.
Takeover BidAn offer made to security holders of a company to purchase voting securities of the company which, with the offeror’s already owned securities, will in total exceed 20% of the outstanding voting securities of the company. For federally incorporated companies, the equivalent requirement is more than 10% of the outstanding voting shares of the target company.
Tax Free Savings Account (TFSA)A savings vehicle whereby income earned within a TFSA will not be taxed in any way throughout an individual’s lifetime. In addition, there are no restrictions on the timing or amount of withdrawals from a TFSA, and the money withdrawn can be used for any purpose.
Tax Loss SellingSelling a security for the sole purpose of generating a loss for tax purposes. There may be times when this strategy is advantageous but investment principles should not be ignored.
T-BillsSee Treasury bills.
Technical AnalysisA method of market and security analysis that studies investor attitudes and psychology as revealed in charts of stock price movements and trading volumes to predict future price action.
Term InsuranceA type of insurance policy that pays a death benefi t if the insured dies within the given contracted period. It is sometimes called pure insurance as it does not have a savings component and is put in place strictly for insurance purposes.
Term to MaturityThe length of time that a segregated fund policy must be held in order to be eligible for the maturity guarantee. Normally, except in the event of the death of the annuitant, the term to maturity of a segregated-fund policy is 10 years.
Thin MarketA market in which there are comparatively few bids to buy or offers to sell or both. The phrase may apply to a single security or to the entire stock market. In a thin market, price fl uctuations between transactions are

© CSI GLOBAL EDUCATION INC. (2010)
GLOSSARY G•31
usually larger than when the market is liquid. A thin market in a particular stock may refl ect lack of interest in that issue, or a limited supply of the stock.
Tilting Yield CurveThe yield curve that results from a decline in long-term bond yields while short-term rates are rising.
Time to ExpiryThe number of days or months or years until expiry of an option or other derivative instrument.
Time ValueThe amount, if any, by which the current market price of a right, warrant or option exceeds its intrinsic value.
Time-Weighted Rate of Return (TWRR)A measure of return calculated by averaging the return for each subperiod in which a cash fl ow occurs into a return for a reporting period.
Timely DisclosureAn obligation imposed by securities administrators on companies, their offi cers and directors to release promptly to the news media any favourable or unfavourable corporate information which is of a material nature. Broad dissemination of this news allows non-insiders to trade the company’s securities with the same knowledge about the company as insiders themselves. See also Continuous Disclosure.
Tombstone AdvertisementsA written advertisement placed by the investment bankers in a public offering of securities as a matter of record once the deal has been completed.
Top-Down ApproachA type of fundamental analysis. First, general trends in the economy are analyzed. This information is then combined with industries and companies within those industries that should benefi t from the general trends identifi ed.
Toronto Stock Exchange (TSX)The largest stock exchange in Canada with over 1,700 companies listed on the exchange.
Trade-Weighted Exchange RateRate produced by the Bank of Canada that measures the Canadian dollar’s movements against ten major currencies.
Trading UnitDescribes the size or the amount of the underlying asset represented by one option contract. In North America, all exchange-traded options have a trading unit of 100 shares.
Trailer FeeFee that a mutual fund manager may pay to the individual or organization that sold the fund for providing services such as investment advice, tax guidance and fi nancial statements to investors. The fee is paid annually and continues for as long as the investor holds shares in the fund.
Transaction DateThe date on which the purchase or sale of a security takes place.
Transfer AgentAn agent, usually a trust company, appointed by a corporation to maintain shareholder records, including purchases, sales, and account balances. The transfer agent may also be responsible for distributing dividend cheques.
Treasury BillsShort-term government debt issued in denominations ranging from $1,000 to $1,000,000. Treasury bills do not pay interest, but are sold at a discount and mature at par (100% of face value). The difference between the purchase price and par at maturity represents the lender’s (purchaser’s) income in lieu of interest. In Canada, such gain is taxed as interest income in the purchaser’s hands.
Treasury SharesAuthorized but unissued stock of a company or previously issued shares that have been re-acquired by the corporation. The amount still represents part of those issued but is not included in the number of shares outstanding. These shares may be resold or used as part of the option package for management. Treasury shares do not have voting rights nor are they entitled to dividends.
TrendShows the general movement or direction of securities prices. The long-term price or trading volume of a particular security is either up, down or sideways.
Trust Deed (Bond Contract)This is the formal document that outlines the agreement between the bond issuer and the bondholders. It outlines such things as the coupon rate, if interest is paid semi-annually and when, and any other terms and conditions between both parties.
TrusteeFor bondholders, usually a trust company appointed by the company to protect the security behind the bonds and to make certain that all covenants of the trust deed relating to the bonds are honoured. For a segregated fund, the trustee administers the assets of a mutual fund on behalf of the investors.
TSX Venture ExchangeCanada’s public venture marketplace, the result of the merger of the Vancouver and Alberta Stock Exchanges in 1999.
Two-Way SecurityA security, usually a debenture or preferred share, which is convertible into or exchangeable for another security (usually common shares) of the same company. Also indirectly refers to the possibility of profi ting in the future from upward movements in the underlying common shares as well as receiving in the interim interest or dividend payments.
Underlying SecurityThe security upon which a derivative contract, such as an option, is based. For example, the ABC June 35 call options are based on the underlying security ABC.
UnderwritingThe purchase for resale of a security issue by one or more investment dealers or underwriters. The formal agreements pertaining to such a transaction are called underwriting agreements.
Unemployment RateThe percentage of the work force that is looking for work but unable to fi nd jobs.
Unifi ed Managed AccountA type of fee-based account that includes the same benefi ts as multi-disciplinary accounts. Enhancements include performance reports from the respective sub-advisors, outlining distinct models contained within the single custody account.

© CSI GLOBAL EDUCATION INC. (2010)
CANADIAN SECURITIES COURSEG•32
UnitTwo or more corporate securities (such as preferred shares and warrants) offered for sale to the public at a single, combined price.
Unit ValueThe value of one unit of a segregated fund. The units have no legal status, and are simply an administrative convenience used to determine the income attributable to contract holders and the level of benefi ts payable to benefi ciaries.
Universal Market Integrity Rules (UMIR)A common set of trading rules that are applied in all markets in Canada. UMIR are designed to promote fair and orderly markets.
UnlistedA security not listed on a stock exchange but traded on the over-the-counter market.
Unlisted MarketSee also dealer market.
Valuation DayThe day on which the assets of a segregated fund are valued, based on its total assets less liabilities. Most funds are valued at the end of every business day.
Value ManagerA manager that takes a research intensive approach to fi nding undervalued securities.
Value RatiosFinancial ratios that show the investor the worth of the company’s shares or the return on owning them.
Variable Rate PreferredsA type of preferred share that pays dividends in amounts that fl uctuate to refl ect changes in interest rates. If interest rates rise, so will dividend payments, and vice versa.
VarianceAnother measure of risk often used interchangeably with volatility. The greater the variance of possible outcomes the greater the risk.
VestedThe employee’s right to the employer contributions made on his or her behalf during the employee’s period of enrollment.
VolatilityA measure of the amount of change in the daily price of a security over a specifi ed period of time. Usually given as the standard deviation of the daily price changes of that security on an annual basis.
Voting RightThe stockholder’s right to vote in the affairs of the company. Most common shares have one vote each. Preferred stock usually has the right to vote only when its dividends are in arrears. The right to vote may be delegated by the shareholder to another person. See also Proxy.
Voting TrustAn arrangement to place the control of a company in the hands of certain managers for a given period of time, or until certain results have been achieved, by shareholders surrendering their voting rights to a trustee for a specifi ed period of time.
Waiting PeriodThe period of time between the issuance of a receipt for a preliminary prospectus and receipt for a fi nal prospectus from the securities administrators.
WarrantA certifi cate giving the holder the right to purchase securities at a stipulated price within a specifi ed time limit. Warrants are usually issued with a new issue of securities as an inducement or sweetener to investors to buy the new issue.
Working CapitalCurrent assets minus current liabilities. This fi gure is an indication of the company’s ability to meet its short-term debts.
Working Capital RatioCurrent assets of a company divided by its current liabilities.
Wrap AccountAlso known as a wrap fee program. A type of fully discretionary account where a single annual fee, based on the account’s total assets, is charged, instead of commissions and advice and service charges being levied separately for each transaction. The account is then managed separately from all other wrap accounts, but is kept consistent with a model portfolio suitable to clients with similar objectives.
WriterThe seller of either a call or put option. The option writer receives payment, called a premium. The writer in then obligated to buy (in the case of a put) or sell (in the case of a call) the underlying security at a specifi ed price, within a certain period of time, if called upon to do so.
Yield – Bond & StockReturn on an investment. A stock yield is calculated by expressing the annual dividend as a percentage of the stock’s current market price. A bond yield is more complicated, involving annual interest payments plus amortizing the difference between its current market price and par value over the bond’s life. See also Current Yield.
Yield CurveA graph showing the relationship between yields of bonds of the same quality but different maturities. A normal yield curve is upward sloping depicting the fact that short-term money usually has a lower yield than longer-term funds. When short-term funds are more expensive than longer term funds the yield curve is said to be inverted.
Yield to MaturityThe rate of return investors would receive if they purchased a bond today and held it to maturity. Yield to maturity is considered a long term bond yield expressed as an annual rate.
Yield SpreadThe difference between the yields on two debt securities, normally expressed in basis points. In general, the greater the difference in the risk of the two securities, the larger the spread.
Zero Coupon BondsSee Strip Bonds.

© CSI GLOBAL EDUCATION INC. (2010) Web•1
Selected Web Sites
If you are connected to the Internet, you have access to all kinds of fi nancial information. This list is far from complete. Many of these sites will have links to other related sites. Remember to type the site “address” exactly as listed. Some sites track usage by asking you for a password. Do not confuse the need to register and provide a password with the necessity to become a subscriber. Some sites offer a limited amount of information for free and require you to register and pay a fee before you can access more detailed information.

SELECTED WEB SITES Web•3
© CSI GLOBAL EDUCATION INC. (2010)
BANKING
Canadian Bankers Association: www.cba.ca
GOVERNMENT SOURCES
Bank of Canada: www.bankofcanada.ca or www.banqueducanada.ca
Canada Revenue Agency: www.cra-arc.gc.ca
Financial Industry Regulatory Authority: www.finra.org
Industry Canada: www.ic.gc.ca
Office of the Superintendent of Financial Institutions: www.osfi-bsif.gc.ca
Statistics Canada: www.statcan.ca
U.S. Securities and Exchange Commission: www.sec.gov
HEDGE FUNDS
Canadian Hedge Fund Watch: www.canadianhedgewatch.com/
Credit Suisse Tremont Hedge Index: www.hedgeindex.com
Greenwich Alternative Investments: www.greenwichai.com/
Hedge Fund Association: www.thehfa.org/
Hedge Fund Centre: www.hedgefundcenter.com/
HedgeFund Intelligence: www.hedgefundintelligence.com/
INSURANCE
Financial Advisors Association of Canada (ADVOCIS): www.advocis.com
Insurance Canada: www.insurance-canada.ca
BANKING
GOVERNMENT SOURCES
HEDGE FUNDS
INSURANCE

CANADIAN SECURITIES COURSEWeb•4
© CSI GLOBAL EDUCATION INC. (2010)
INVESTMENT ORGANIZATIONS
Canadian Deposit Insurance Corporation: www.cdic.ca
Canadian Derivatives Clearing Corporation: www.cdcc.ca
Canadian Investor Protection Fund (CIPF): www.cipf.ca
Canadian Society of Technical Analysts: www.csta.org
CDS Clearing and Depository Services Inc: www.cds.ca
CSI Global Education Inc.: www.csi.ca
EDGAR: www.edgar-online.com
International Organization of Securities Commissions: www.iosco.org
Investment Industry Regulatory Organization of Canada: www.iiroc.ca
Mutual Fund Dealers Association of Canada: www.mfda.ca
North American Securities Administrators Association: www.nasaa.org
System for Electronic Document Analysis and Retrieval: www.sedar.com
World Federation of Exchanges: www.world-exchanges.org
INVESTOR SERVICES
Advice for Investors: www.adviceforinvestors.com
BigCharts: www.bigcharts.com
Globeinvestor: www.globeinvestor.com
Investorwords: www.investorwords.com
Investopedia: www.investopedia.com
iShares: ca.ishares.com
Quicken Financial Network: www.quicken.ca
Stockhouse: www.stockhouse.ca
Yahoo Finance: www.ca.finance.yahoo.com
INVESTMENT ORGANIZATIONS
INVESTOR SERVICES
SELECTED WEB SITES Web•5
© CSI GLOBAL EDUCATION INC. (2010)
MUTUAL FUNDS
Fund Library: www.fundlibrary.com
Globefund: www.globefund.com
Investment Counsel: www.investment.com
Investment Funds Institute of Canada: www.ific.ca
NEWS ORGANIZATIONS AND PUBLICATIONS
Canada Newswire: www.newswire.ca
Canoe (Canadian Online Explorer): www.canoe.ca
Financial Post: www.nationalpost.com
Globe and Mail: www.theglobeandmail.com
Moneysense: www.moneysense.ca
PROVINCIAL SECURITIES ADMINISTRATORS
Alberta: www.albertasecurities.com
British Columbia: www.bcsc.bc.ca
Manitoba: www.msc.gov.mb.ca
Ontario: www.osc.gov.on.ca
Québec: www.lautorite.qc.ca
New Brunswick: www.nbsc-cvmnb.ca/nbsc
Newfoundland and Labrador: www.gs.gov.nl.ca
Northwest Territories: www.justice.gov.nt.ca/securitiesregistry
Nova Scotia: www.gov.ns.ca/nssc
Prince Edward Island: www.gov.pe.ca/securities
Saskatchewan: www.sfsc.gov.sk.ca
Territory of Nunavut: www.gov.nu.ca
Yukon: www.community.gov.yk.ca/corp/secureinvest.html
MUTUAL FUNDS
NEWS ORGANIZATIONS AND PUBLICATIONS
PROVINCIAL SECURITIES ADMINISTRATORS
CANADIAN SECURITIES COURSEWeb•6
© CSI GLOBAL EDUCATION INC. (2010)
STOCK EXCHANGES
The American Stock Exchange: www.amex.com
CBOE: www.cboe.com
CNQ: www.cnq.ca
Bourse de Montréal: www.m-x.ca
Ice Futures Canada: www.theice.com/homepage.jhtml
Nasdaq: www.nasdaq.com
New York Stock Exchange: www.nyse.com
Toronto Stock Exchange: www.tmx.com
TSX Venture Exchange: www.tmx.com
TAXATION
Canada Revenue Agency: www.cra-arc.gc.ca
Canadian Tax Foundation: www.ctf.ca
Ernst & Young (Canada): www.ey.com/Home
KPMG: www.kpmg.ca
PricewaterhouseCoopers: www.pwc.com
STOCK EXCHANGES
TAXATION

© CSI GLOBAL EDUCATION INC. (2010) Ind•1
Index


INDEX Ind•3
© CSI GLOBAL EDUCATION INC. (2010)
IndexA
Accounting practices, 14•9Accounts payable, 12•11Accounts receivable, 12•6Accredited investors, 21•6Accrued interest, 6•10, 6•13, 6•17,
7•25 to 7•27Acid test, quick ratio, 14•14Active investment, 19•10 to 19•11Adjusted cost base:calculating, 19•14convertible securities, 25•13 disposition of shares, 25•12 to
25•13 identical shares, 25•12 shares with warrants or rights,
25•13Administration department, 2•12Advance-decline line, 13•27After-market stabilization, 11•29 to
11•30After-tax return on common equity,
14•25After-tax return on invested capital,
14•26Agency agreement, 11•26Agency traders, 27•12Agents, 2•13, 2•14 All or none (AON) orders, 9•17Allocation, segregated funds and
mutual funds, 20•13Alpha, 15•19, 15•32 Alternate Minimum Tax (AMT),
25•16Alternative trading systems (ATSs),
1•18American-style option , 10•15AMEX Market Value Index, 8•30 Amortization, 12•8 to 12•9, 12•16Analyst, 27•8Annual information form (AIF),
18•20 Annuitant, segregated fund, 20•5Annuities, deferred or immediate,
25•22 to 25•23Any part orders, 9•17Approved participants, 1•13Arbitration, 3•12Argonaut Fund, 21•19Arrears, 8•17 to 8•18Ask, 1•11
Asset allocation, 15•5, 15•12 to 15•13, 16•17 to 16•24
asset mix, 16•17 to 16•18 balancing asset classes, 16•19 to
16•20 dynamic, 16•22 integrated, 16•23 strategic, 16•20 to 16•21 tactical, 16•23Asset-backed commercial paper
(ABCP), 24•19, 24•20 roll-over risk, 24•19Asset-backed securities, 24•18 special purpose vehicle (SPV),
24•17 tranches, 24•18 to 24•19Asset class timing, 16•7 to 16•8Asset classes, 15•12 balancing, 16•20 cash, 16•5 equities, 16•6 fi xed-income products, 16•5 to
16•6 other asset classes, 16•6Asset coverage ratios, 14•15 to
14•16Asset mix, developing, 16•6 to
16•13Assets, 12•5, 12•6 to 12•11 amortization and depletion, 12•8
to 12•9 capitalization, 12•10 current, 12•6 to 12•7 deferred charges, 12•10 intangible, 12•10 to 12•11 miscellaneous, 12•7 property, plant and equipment,
12•7 Assigned on an option, 10•16,
10•22, 10•24, 10•25Assuris, 20•17 to 20•18At-the-money, 10•17Attribution rules, 25•26Auction market, 1•11 to 1•16Audit, 12•22 to 12•23Auditor’s report, 12•22 to 12•23 sample, 14•42Authorized shares, 11•17 to 11•18Automatic stabilizers, 5•10Autorité des marchés fi nanciers
(AMF), 3•7
Average cost method, 12•7Averages. See Stock average
B
Back-end loads, 18•11, 18•12 to 18•13
Balance of payments, 4•34 to 4•37 capital account, 4•34to 4•37 current account, 4•34 to 4•36Balance sheet, 12•5 to 12•13 sample, 14•41Balance sheet analysis, 14•6 to 14•8 capital structure, 14•7 leverage, 14•7 to 14•8Bank Act, 2•15 revisions, 2•9, 2•17 Bank of Canada, 4•25, 5•11 to
5•17, 13•8 to 13•12 advisor to the Government, 5•12 bank notes, 5•11 cash management, 5•16 to 5•17 debt management, 5•12 drawdowns and redeposits, 5•17 duties and role, 5•11 fi scal agent, 5•11 to 5•12 functions, 5•11 to 5•12 interest rates, 4•25 to 4•27 lender of last resort, 5•14 monetary policy,4•25, 5•13 to
5•17 open market, 5•14 to 5•16Bank rate, 5•14, 5•16Banker’s acceptance, 6•25Banking group agreement, 11•26Bankruptcy, segregated funds, 20•9,
20•10 to 20•11Basis points, 5•14Bearer bonds, 7•25Benchmark for portfolio managers,
16•32Benchmark index for funds, 19•22Benefi cial owner, 3•21Benefi ciary, segregated fund, 20•6Beta: individual stocks, 15•12, 15•31 portfolio, 15•18 to 15•19, 15•32Bid, 1•11Blue-chip shares, 13•16Blue skyed issue, 11•25Bond index fund, 7•27
CANADIAN SECURITIES COURSE
© CSI GLOBAL EDUCATION INC. (2010)
Ind•4
Bond market, 13•9Bond pricing principles, 7•5 to 7•11 discount rate, 7•6 fair price, calculating, 7•7 to
7•10 income stream, present value, 7•8
to 7•10 present value (PV), 7•5 to 7•6,
7•7 to 7•10 principal, present value, 7•8 to
7•10 term structure of interest rates,
7•14 to 7•17 yield calculations, 7•12 to 7•14Bond pricing properties, 7•17 to
7•22 coupon rate, 7•6, 7•19 to 7•25 duration, 7•20 to 7•22 interest rates, 7•17 to 7•22 term of maturity, 7•18 yield changes, 7•19 to 7•20Bond quote, 6•26 to 6•29Bond rating services, 6•27 to 6•29Bond residue, 6•23Bond switches, 7•22 to 7•24Bond trading, 7•24 to 7•27 accrued interest, 7•25 to 7•27 clearing and settlement, 7•25 settlement periods, 7•24 to 7•25Bonds, 1•9 to 1•10, 6•7 to 6•29,
7•2 to 7•27 accrued interest, 6•10, 6•13,
6•17, 7•24 to 7•26 advantages and disadvantages for
issuer, 11•21 call features, 6•10 to 6•11 call protection period, 6•11 Canada Premium Bonds (CPBs),
6•18 Canada Savings Bonds (CSBs),
6•17 to 6•18 Canada yield call, 6•11 convertible, see Convertible
bonds corporate, see Corporate bonds coupon rate, 6•7 credit quality, 16•16 to 16•17 denominations, 6•8 direct, 11•16 discount, 6•8 discount rate, 7•6 distinguished from debentures,
1•9 to 1•10, 6•7 domestic, 6•23 election period, 6•12 Eurobonds, 6•24 extendible or retractable, 6•12 face value, 6•8 foreign, 6•24
Government of Canada, 6•16 to 6•18, 11•14 to 11•15
guaranteed, 6•19 to 6•20, 11•16 indexes, 7•27 to 7•28 index-linked notes, 6•8 liquid, negotiable, and
marketable, 6•9 to 6•10 municipal, 6•20 to 6•21, 11•16 par value, 6•8 premium, 6•8 present value, 7•5 to 7•10 pricing principles, see Bond
pricing principles pricing properties, see Bond
pricing properties protective provisions, 6•15,
11•21 provincial government, 6•18 to
6•20, 11•16 purchase fund, 6•11 to 6•12 quoted yield, 6•8 quotes and ratings, 6•27 to 6•29 redeemable, 6•10 to 6•11 sinking fund, 6•11 to 6•12, 6•15 strip, 6•23 tax-deductibility of income
payments, 6•6 term to maturity, 6•9 trading, see Bond trading trust deed, 6•7 yield calculations, 7•12 to 7•14 yield spread, 6•11 yield to maturity, 7•11 to 7•13Book-based format for bonds, 7•25Book value, 12•5, 14•33 to 14•34Bottom-up investment approach,
16•13 to 16•14Bought deal, 11•25 to 11•26Bourse de Montréal, 1•12, 10•6,
10•10, 10•17, 10•28Broker dealer, 27•4Broker of record, 11•20Bucketing, 3•17Budget, federal, 1•8, 5•7 to 5•8,
5•18Budget defi cit, 1•8, 5•7, 5•18Budget surplus, 1•8, 5•7, 5•9Business cycle, 4•15 to 4•21 economic indicators, 4•18 to
4•20 identifying recessions, 4•20 phases, 4•16 to 4•18Business risk, 15•10Business trusts, 22•6, 22•8 Buy-and-hold approach, 15•25Buy and sell orders, 9•16 to 9•18
C
CAC 40 Share Price Index, 8•31Caisses populaires, 2•18Call options, 10•5, 10•14 buying call options, 10•19 to
10•21 distinguished from rights and
warrants, 10•33 to 10•36 writing call options, 10•21 to
10•22Call protection period, 6•11Callable bonds, 6•10 to 6•11Callable preferreds, 8•18 Canada Business Corporations Act
(CBCA), 11•9Canada Deposit Insurance
Corporation (CDIC), 3•5 to 3•6, 6•26, 21•18
Canada Education Savings Grant (CESG), 25•25
Canada Investment and Savings (CIS), 5•12
Canada Pension Plan (CPP), 2•25 to 2•26
Canada Premium Bonds (CPBs), 6•18
Canada Savings Bonds (CSBs), 6•17 to 6•18
compound interest bond, 6•17 payroll savings plan, 6•18 real return bonds (RRBs), 6•18 regular interest bond, 6•17 tender system, 11•14 to 11•15Canada yield call, 6•11Canadian bond indexes, 7•27 to
7•28Canadian Derivatives Clearing
Corporation (CDCC), 10•7Canadian Investor Protection Fund
(CIPF), 3•9 to 3•11Canadian Life and Health Insurance
Association Inc. (CLHIA), 20•17Canadian National Stock Exchange
(CNSX), 1•12, 1•16, 1•18Canadian Originated Preferred
Securities (COPrS), 24•17Canadian Payments Association
(CPA), 5•14Canadian Public Accountability
Board (CPAB), 12•23 to 12•24Canadian Securities Administrators
(CSA), 3•7Canadian Securities Course (CSC),
3•13Canadian Trading and Quotation
System (CNQ), 1•12Canadian Unlisted Board Inc.
(CUB), 1•18
INDEX Ind•5
© CSI GLOBAL EDUCATION INC. (2010)
CanDeal, 1•19CanPX, 1•19Capital, 1•5 to 1•9, 4•7, 12•13 characteristics, 1•5 to 1•6 need for, 1•6 sources, 1•6 to 1•7 users, 1•8 to 1•9Capital account, 4•34 to 4•37Capital assets. See Property, plant
and equipmentCapital gains, tax treatment, 8•12Capital losses, tax treatment, 8•12,
25•14 to 25•16Capital Pool Company (CPC),
11•31 to 11•32Capital ratios, percentage of total,
14•16 to 14•17Capital stock, 11•17, 11•37Capital structure, 14•7, 14•17 Capitalizing, 12•10Carrying charge, 25•10Cash, 12•6Cash accounts, 9•5 to 9•6 free credit balances, 9•5 to 9•6 rules, 9•5Cash fl ow, 14•14, 14•18 to 14•19Cash fl ow statement, 12•19 to
12•21 change in cash fl ow, 12•21 fi nancing activities, 12•21 investing activities, 12•21 operating activities, 12•20 to
12•21 sample, 14•42 supplemental information, 12•21Cash fl ow/total debt ratio, 14•18 to
14•19, 14•45 to 14•46Cash management, 5•16 to 5•17Cash-secured put write, 10•24 to
10•25Cash-settled futures, 10•27 to 10•28CBID, 1•19CDS Clearing and Depository
Services, Inc. (CDS), 2•14, 7•25Chairman of the board, 11•13Chart analysis, 13•21 to 13•24 continuation patterns, 13•23 to
13•24 head-and-shoulders formation,
13•22 to 13•23 neckline, 13•22 resistance level, 13•22 reversal patterns, 13•22 support level, 13•22 symmetrical triangle, 13•23 to
13•24Chartered banks, 2•16 to 2•18 Bank Act, 2•16, 2•18 Schedule I banks, 2•16 to 2•17
Schedule II banks, 2•17 Schedule III banks, 2•17 trends, 2•18Chinese walls, 2•17Clearing and Depository Services,
Inc. (CDS), 2•15, 7•24, 8•5Clearing corporation, 10•7 Clearing system for securities, 2•15Client scenarios, 26•27 to 26•33Clients, working with: communicating and educating,
26•7 to 26•8 gathering information, 26•6 to
26•7 identifying problems and
constraints, 26•8 to 26•9Clone funds, 18•23Closed-end discretionary funds,
22•4Closed-end funds, 2•22, 22•4 to
22•5 advantages, 22•4 to 22•5 disadvantages, 22•5Closet indexing, 19•11Code of ethics, 26•12 to 26•13Coincident indicators, 4•19Collateral trust bond, 6•22Collateral trust note, 6•23Commercial paper, 6•25Commodities, 10•9Commodity futures, 10•26Commodity pools, 21•7, 21•20Common shares, 1•10, 8•5 to 8•15 benefi ts of ownership, 1•10, 8•5
to 8•6 capital appreciation, 8•6 dividends, 8•6 to 8•9 equity fi nancing, 11•17 to 11•19 pros and cons for issuer, 11•21 reading stock quotations, 8•14 restricted, 8•10 to 8•11 stock split, 8•12 to 8•14 tax treatment, 8•11 to 8•12 voting rights, 8•10 to 8•11Communication with clients, 26•7
to 26•8Company analysis: defi ned, 14•5 fi nancial statements, 14•9 to
14•11 overview, 14•5 to 14•9 preferred share investment
quality, 14•34 to 14•38 ratio analysis, 14•12 to 14•34, see
also Ratios sample company analysis, 14•44
to 14•52 sample fi nancial statements,
14•40 to 14•43
Competitive tender, 11•14 to 11•15Composite leading indicator, 4•19Conduct and Practices Handbook,
2•11, 3•12, 3•13Conduct in accordance with
securities acts, 26•19 to 26•20Confi dentiality, 26•20Confi rmation, sale of shares, 9•15Confi rmation contract, bonds, 7•26
to 7•27Confl icts of interest, 3•15Consolidated method of accounting,
12•12Consolidations, 8•13 to 8•14Constant proportion portfolio
insurance (CPPI), 24•7 to 24•8Consumer loan companies, 2•26Consumer Price Index (CPI),4•29Continuation patterns, 13•23 to
13•24Continuous disclosure, 3•18 to
3•20, 11•25Contract holder, segregated funds,
19•5Contraction, 4•17Contrarian investors, 13•26Contributed surplus, 12•13Contribution in kind, 25•20Conversion price, 6•13Conversion privilege, 6•13Convertible arbitrage strategy, 21•15
to 21•16Convertible bonds, 6•13 to 6•14 characteristics, 6•13 forced conversion, 6•14 market performance, 6•14 to
6•15Convertible preferreds, 8•19 to 8•23 example, 8•20 features, 8•21 selecting, 8•21 to 8•23Corporate bonds, 6•21 to 6•25 collateral trust bond, 6•22 corporate note, 6•23 domestic bonds, 6•23 equipment trust certifi cate, 6•22 Eurobonds, 6•24 fl oating-rate securities, 6•22 foreign bonds, 6•24 mortgage bond, 6•21 to 6•22 preferred debentures, 6•24 protective provisions, 6•15,
11•21 secured note, 6•23 strip bonds, 6•23 subordinated debentures, 6•22Corporate note, 6•23 Corporate treasury department,
27•4

CANADIAN SECURITIES COURSE
© CSI GLOBAL EDUCATION INC. (2010)
Ind•6
Corporations, 11•6 to 11•13 advantages and disadvantages,
11•7 to 11•8 by-laws, 11•9 to 11•10 directors, 11•12 fi nancing, see Financing,
corporations offi cers, 11•13 private or public, 11•9 shareholders. See Shareholders structure, 11•11 to 11•12 voting and control, 11•10 to
11•11Correlation, 15•15 to 15•17 hedge funds, 20•8Cost method for equity income,
12•18Cost of goods sold, 12•15, 14•6Cost-push infl ation,4•32Country risk evaluation, 1•5 to 1•6Coupon rate on bond, 6•7, 7•6,
7•19 to 7•21Covenants, 11•21 Covered call writing, 10•21, 10•22Covered put wriring, 10•24Credit Assessment, 14•35 to 14•36Credit quality, bonds, 16•16Credit unions, 2•18 deposit insurance, 3•6Creditor protection, segregated
funds, 19•10 to 19•11Cum dividend, 8•9Cum rights, 10•35, 10•33, 10•35Current account, 4•34 to 4•37 exchange rate and,4•38Current assets, 12•6 to 12•7Current liabilities, 12•11 Current ratio, 14•13Cycle analysis, 13•26 to 13•27Cyclical industries, 13•16 Cyclical unemployment, 4•23
D
Daily valuation method, 19•21DAX Index, 8•31Day orders, 9•17Dealer, 11•19 to 11•22 advice on protective provisions,
11•21 advice on security design, 11•20 broker of record, 11•20 new issue, 11•19 to 11•20Dealer markets, 1•17 to 1•19Death benefi t, segregated fund, 20•8
to 20•9Debentures, 1•9 to 1•10, 6•7,
11•21
Debt, 1•8 to 1•9 national debt, 5•7, 5•9 to 5•10,
5•18Debt/equity ratio, 14•18Debt fi nancing, 11•19Debt instruments, 1•9 to 1•10. See
also Bonds; DebenturesDebt management, and Bank of
Canada, 5•12 Decision makers in economy, 4•7Declining industries, 13•15Declining-balance method, 12•8 to
12•9Dedicated short bias, 21•20Deemed disposition, 25•19Default risk, 10•7, 15•11Defensive industries, 13•16 to
13•17Deferred annuity, 25•22 to 25•23Deferred charges, 12•10 Deferred preferred shares, 8•23Deferred revenue, 12•12Deferred sales charge, 18•12 to
18•13Defi ned benefi t plan (DBP), 25•17,
25•18 Defi ned contribution plan (DCP),
25•17, 25•18Defl ation,4•33Delayed fl oaters, 8•22Delayed opening, 11•35Delisting, 11•35Demand and supply, 4•7 to 4•9Demand-pull infl ation,4•32Demutualization, 2•20Depletion, 12•9Depreciation, 12•8Derivatives, 1•10 to 1•11, 1•17,
10•3 to 10•37, 15•14 clearing corporation, 10•7 commodities, 10•9 corporations and businesses,
10•12 to 10•13 dealers, 10•14 default risk, 10•7 defi ned, 10•5 exchange-traded, 10•6 exchange-traded vs OTC, 10•6
to 10•8 expiration date, 10•5 fi nancial, 10•9 to 10•10 forwards, 10•5 futures, see Futures hedging, 10•12 to 10•13 investors, individual, 10•10 to
10•11 investors, institutional, 10•11 to
10•12 mutual funds, use by, 18•23
options, see Options over-the-counter (OTC), 10•6 to
10•8 performance bond, 10•5 reasons for use of, 10•10 regulation, 10•8 underlying assets, 10•5, 10•9 to
10•10 zero-sum game, 10•6Direct bonds, 11•16Directors’ circular, 3•22Directors of a corporation, 11•12Disclosure: continuous, 3•18 to 3•19, 11•25 early warning, 3•22 full, true and plain, 3•13Discount rate on bond, 7•6Discouraged workers, 4•23Discretionary accounts, 23•7 to
23•8Disinfl ation, 4•32 to 4•33Disposition: of debt securities, 25•13 to 25•14 of shares, 25•12 to 25•13Distressed debt, 1•20Distressed securities strategy, 21•17Diversifi cation, 15•11, 15•13,
15•14, 15•15, 5•17, 15•18Dividend Discount Model (DDM),
13•18 to 13•19, 16•10 to 16•12Dividend payments, in company
analysis, 14•6, 14•35Dividend payout ratios, 14•27 to
14•28Dividend record, 14•6Dividend record date, 8•8Dividend reinvestment plan, 8•9Dividend tax credit, 8•11, 8•17Dividend yield, 14•30Dividends, 8•6 to 8•9 cum, 8•9 declaring and claiming, 8•7 ex-dividend, 8•8 open orders, and, 8•9 preferred, 8•15 to 8•16 regular and extra, 8•7 reinvestment plans, 8•9 stock, 8•9Dollar cost averaging, 8•9Domestic bonds, 6•23Dominion Bond Rating Service
(DBRS), 6•27, 14•35Dow Jones Industrial Average
(DJIA), 8•24, 8•28 to 8•29Drawdown, 5•17Due diligence: corporate fi nancing report, 11•19 hedge funds, 21•13 to 21•14Duration of bond, 7•20 to 7•22

INDEX Ind•7
© CSI GLOBAL EDUCATION INC. (2010)
Duty of care, 26•14 to 26•15Dynamic asset allocation, 16•22 to
16•23
E
Early redemption fee, 18•13Early warning disclosure, 3•23Earnings before interest and taxes
(EBIT), 12•17Earnings before interest, taxes,
depreciation and amortization (EBITDA),
14•32Earnings per common share (EPS),
14•28 to 14•30Earnings statement, 12•14 to 12•18 creditors’ section, 12•17 non-operating section, 12•16 to
12•17 operating section, 12•15 to
12•16 owners’ section, 12•17 to 12•18 sample, 14•42 structure of, 12•14 to 12•15 Earnings statement analysis, 14•5
to 14•6Economic cycles, 16•8 to 16•13 equity cycles and, 16•8 to 16•12 industry rotation and, 16•12 to
16•13 see also Business cycleEconomic growth, 4•9 to 4•15 effect of interest rates,4•26 industrialized countries, 4•13 to
4•14 measuring GDP, 4•10 to 4•12 productivity and growth, 4•13 to
4•15Economic indicators, 4•18 to 4•20Economic slowdown, 4•19, 4•21Economic theories, 5•5 to 5•6 Keynesian economics, 5•5 to 5•6 monetarist theory, 5•6 rational expectations theory, 5•5 supply-side economics, 5•6Economies of scale, 13•13 to 13•14Effi cient market hypothesis, 13•6Election period, 6•12Electronic trading systems, 1•19Elliott Wave Theory, 13•27Emerging growth industries, 13•14Emerging markets hedge funds,
21•20Endowment, 27•6Enterprise Multiple (EM), 14•32 to
14•33Enterprise value (EV), 14•32Entrepreneurship, 4•7
Equilibrium price, 4•9Equipment trust certifi cate, 6•22Equities. See Equity fi nancing Equitized income products. See
Income trusts Equity capital, 11•17Equity cycles, 16•6, 16•7 Dividend Discount Model
(DDM) and, 16•10 to 16•12 economic cycles and, 16•8 to
16•10 industry rotation, 16•12 to
16•13Equity fi nancing, 1•10, 11•17 to
11•19 see also Common shares;
Preferred sharesEquity income, 12•18 Equity index derivatives, 10•9Equity market-neutral strategy,
21•15Equity value per common share,
14•33, 14•34Equity value per preferred share,
14•33 Equity value ratios, 14•33 to 14•34Escrowed shares, 11•31Ethical trading, 3•16 to 3•17Ethics, 26•12 to 26•20 Code of Ethics, 26•12 to 26•13 investment constraint, 15•25 Standards of Conduct, 26•13 to
26•20Eurobonds, 6•24European-style option, 10•15Ex rights, 10•33, 10•34Ex-ante return, 15•7Exchange offering prospectus, 11•30Exchange rate, 4•37 to 4•39 Canadian dollar and, 4•37 determinants, 4•38 to 4•39 fi xed and fl oating, 4•39 foreign exchange risk, 15•10Exchange-trade fund (ETF) wraps,
23•9 to 23•10Exchange-traded funds (ETFs),
10•9, 22•9 to 22•12Ex-dividend, 8•7 to 8•8Ex-dividend date, 8•8Exercise rights on an option, 10•5,
10•16Exercise price, 10•14Expansion phase of business cycle,
4•16Expectations theory, 7•16Expected return: individual stock, 15•6 to 15•8 portfolio, 15•14
Expenditure approach to GDP, 4•10 to 4•11
Expiration date on derivatives, 10•5Ex-post return, 15•7Extendible bonds, 6•12Extension date, 6•12External events, 13•7Extra dividend, 8•7Extraordinary items, 12•18
F
Face value of bond, 6•8Factors of production, 4•7F-class fund, 18•15Federal budget, 1•8, 5•7 to 5•8,
5•18Fee-based accounts, 23•4 to 23•13 advantages and disadvantages,
23•6 to 23•7 discretionary accounts, 23•7 to
23•8 managed accounts, 23•5 to 23•6,
23•8 to 23•12 multi-manager accounts, 23•10
to 23•12 multi-disciplinary accounts,
23•12 mutual fund wraps, 23•11 overlay manager, 23•10 to 23•11,
23•12 separately managed accounts,
23•11 to 23•12 unifi ed managed accounts, 23•11
to 23•12 non-managed accounts, 23•6 private family offi ce, 23•13 single-manager accounts, 23•8 to
23•10 ETF wrap, 23•9 to 23•10 proprietary managed program,
23•9 Fiduciary obligation, 3•16, 26•18FIFO (fi rst-in-fi rst-out), 12•6, 12•7Final good, 4•10Final prospectus, 11•23 to 11•25Financial derivatives, 10•9 to 10•10 currencies, 10•10 equity index, 10•9 interest rates, 10•10Financial futures, 10•26, 10•28Financial institutions, 2•8 to 2•9 distribution of mutual funds,
18•26 to 18•27 growth rates, 2•9Financial instruments, 1•9 to 1•11 debt instruments, 1•9 to 1•10,
see also Bonds; Debentures
CANADIAN SECURITIES COURSE
© CSI GLOBAL EDUCATION INC. (2010)
Ind•8
derivatives and others, 1•10 to 1•11, see also Derivatives
equity, 1•10, 11•17 to 11•19, see also Common shares; Preferred shares
investment funds, 1•10, 2•22, see also Closed-end funds; Mutual funds
Financial leverage, 6•6Financial markets, trends, 1•21Financial planning aids, 26•10 to
26•11Financial planning process, 26•6 to
26•10 client interview, 26•6 data gathering, 26•6 to 26•8 determining goals and objectives,
26•6, 26•7 to 26•8 noting problems and constraints,
26•8 to 26•9 plan development and
implementation, 26•9 reviews and revisions, 26•9 to
26•10Financial planning pyramid, 26•11Financial ratios, 14•12 to 14•34 liquidity ratios, 14•12, 14•13 to
14•15 operating performance ratios,
14•12, 14•22 to 14•27 risk analysis ratios, 14•12, 14•15
to 14•22 value ratios, 14•12, 14•27 to
14•34Financial statements, 3•19, 12•2 to
12•29, 14•9 to 14•11 external comparisons, 14•11 interpreting, 14•9 to 14•11 notes to, 12•22, 14•9 to 14•10 specimen, 12•26 to 12•29, 14•40
to 14•43 trends, 14•10 to 14•11Financing, corporations, 1•8, 11•16
to 11•35 after-market stabilization, 11•29
to 11•30 bought deal, 11•25 to 11•26 corporate fi nancing process,
11•19 to 11•30 dealer, choosing, 11•19 to 11•20 debt fi nancing, 11•19 decisions involved, 11•17 delisting, 11•35 due diligence report, 11•19 equity fi nancing, 11•17 to 11•19 fi nancing alternatives, 11•19 listing, pros and cons, 11•32,
11•33 listing procedure, 11•34
method of offering, 11•22 to 11•23
negotiated offering, 11•17 primary or secondary offering,
11•22 to 11•23 private placement, 11•22 prospectus, see Prospectus public offerings, 11•22 to 11•29,
11•30 to 11•32 security types, pros and cons,
11•21 step-by-step summary, 11•27 to
11•29 withdrawing trading privileges,
11•34 to 11•35Financing, federal government, 1•8,
6•16 to 6•18 Bank of Canada, 11•14 Canada Premium Bonds (CPBs),
6•18 Canada Savings Bonds (CSBs),
6•17 to 6•18 competitive tender system, 11•14
to 11•15 government securities
distributors, 11•14 marketable bonds, 6•16 motives, 11•14 non-competitive tender, 11•14,
11•15 primary dealers, 11•14 transparency, 11•15 treasury bills (T-bills), 6•16,
7•11, 15•10, 15•22Financing, individuals, 1•8Financing, municipal government,
1•9, 6•20 to 6•21Financing, provincial government,
1•8 to 1•9 bonds, 6•18 to 6•20, 11•16 syndicate, 11•16First mortgage bonds, 6•21 to 6•22Fiscal agent, 11•13, 11•16 Bank of Canada as, 5•12Fiscal policy, 5•6 to 5•10, 13•7 to
13•8 effects on the economy, 5•9 to
5•10Fiscal year, 25•6Fixed-dollar withdrawal plan, 19•16
to 19•17Fixed exchange rate,4•39Fixed fl oaters, 8•22Fixed-income arbitrage strategy,
21•16 to 21•17Fixed-income securities, 1•9, 6•6 to
6•7, 15•12Fixed-period withdrawal plan,
19•17
Fixed-reset feature, 8•22Floating exchange rate,4•39Floating-rate preferreds, 8•22Floating-rate securities, 6•7, 6•22Flow of funds, 13•10 to 13•11 Forced conversion, 6•14Forecasting, 16•25 to 16•28 cash or equivalents, 16•29 equities, 16•25 to 16•27 fi xed-income securities, 16•27 to
16•28 returns, 16•25Foreign bonds, 6•24Foreign currency translation
adjustment, 12•13Foreign exchange risk, 15•10Foreign investment in Canada, 1•7Foreign-pay preferreds, 8•23Forward agreement, 10•27Forwards, 10•5, 10•26 to 10•27Free credit balances, 9•5 to 9•6Frictional unemployment, 4•23Friedman, Milton, 5•6Front-end loads, 18•11, 18•12Front running, 3•17FTSE 100 Index, 8•31Full employment rate,4•24Fund management styles, 19•10 to
19•12 active investment, 19•10 to
19•11 indexing, 19•11 multi-manager, 19•11 to 19•12 passive investment strategy,
19•10 see also Management styleFundamental analysis, 13•5Fundamental industry analysis,
13•12 to 13•18Fundamental macroeconomic
analysis, 13•7 to 13•12Fundamental valuation models,
13•18 to 13•20 dividend discount model
(DDM), 13•18 to 13•19 price-earnings (P/E) ratio, 13•19
to 13•20Funds of hedge funds (FoHF),
21•21 to 21•22 advantages, 21•21 to 21•22 disadvantages, 21•22 types, 21•21Future income tax, 12•11, 14•17Futures, 10•9, 10•11 to 10•12,
10•26 to 10•32 commodities, 10•9, 10•26,
10•28 fi nancials, 10•9 to 10•10, 10•26 exchanges, 10•28 to 10•29

INDEX Ind•9
© CSI GLOBAL EDUCATION INC. (2010)
Futures Canada. See ICE Futures Canada
Futures contract, 10•26, 10•27, 10•28
Futures strategies, 10•30 to 10•32 buying futures to manage risk,
10•30 buying futures to speculate,
10•30 corporations, 10•31 to 10•32 selling futures to manage risk,
10•31 selling futures to speculate, 10•31 simpler than options, 10•30 temporary switches, 10•11 to
10•12
G
General partnership, 11•6Generally Accepted Accounting
Principles (GAAP), 12•23German DAX Index, 8•31Global bond indexes, 7•28 Global macro strategy, 21•19Good through orders, 9•17Good till cancelled (GTC) orders,
9•17Good-faith deposit, 10•5Goodwill, 12•10Government debt, 5•7, 5•9 to 5•10,
5•18, 13•8Government fi nancing. See
Financing, federal government Government policy challenges, 5•17
to 5•18Government securities distributors,
11•14Government spending, 5•9, 13•7
to 13•8Green shoe option, 11•29Greensheet, 11•24Grey market, 11•32Gross domestic product (GDP): defi ned, 4•10 measuring, 4•10 to 4•12 real and nominal, 4•11Gross operating profi t, 12•15 to
12•16Gross profi t margin ratio, 14•22Growth. See Economic growth Growth accounting, 4•15Growth capital, 1•19Growth industries, 13•14 to 13•15Growth investing, 16•13 to 16•14Growth securities, 15•12Guaranteed bonds, 6•19 to 6•20,
11•16
Guaranteed Investment Certifi cates (GICs), 6•26 to 6•27
Guaranteed minimum withdrawal benefi t (GMWB) plan, 20•18 to 20•19
H
Halt in trading, 11•35Head-and-shoulders formation,
13•22 to 13•23Hedge fund strategies, 21•14 to
21•20 directional, 21•15, 21•18 to
21•20 dedicated short-bias, 21•20 emerging markets, 21•20 global macro, 21•19 long/short equity, 21•18 to
21•19 managed futures, 21•20 event-driven, 21•15, 21•17 distressed securities, 21•17 high-yield bond, 21•17 merger or risk arbitrage, 21•17 relative value, 21•14 to 21•17 convertible arbitrage, 21•15 to
21•16 equity market-neutral, 21•15 fi xed-income arbitrage, 21•16 to
21•17Hedge funds, 16•6, 21•2 to 21•24 benefi ts, 21•9 to 21•10 defi ned, 21•5 due diligence, 21•13 to 21•14 funds of hedge funds (FoHF),
21•21 to 21•22 history, 21•7 to 21•8 institutional investors, 21•6,
27•5 to 27•6 mutual funds, compared with,
21•5 to 21•6 principal-protected notes (PPNs),
see Principal-protected notes (PPNs)
retail investors, 21•7 risks of investing, 21•10 to 21•13 size of the market, 21•8 strategies, see Hedge fund
strategies tracking performance, 21•8 who can invest?, 21•6 to 21•7Hedging, 10•12 to 10•13 defi ned, 10•12 derivatives, 10•12 to 10•13 hedge funds, see Hedge funds legal question, 10•13High-water mark, 21•11 to 21•12High-yield bond strategy, 21•17
High-yield securities. See Income trusts
Historical returns, 15•8 to 15-9, 15•13
Holding period return, 15•7
I
ICE Futures Canada, 1•12, 10•6, 10•7, 10•17, 10•28
Immediate annuities, 25•22Incentive fees, 21•11Income approach to GDP, 4•10 to
4•11Income splitting, 25•26Income taxes, 25•2 to 25•27 borrowed funds, 25•10 calculating, 25•6, 25•7 capital dividend, 25•9 capital gains and losses, 25•6,
25•9, 25•11 to 25•16 carrying charges, 25•10 debt securities, 25•13 to 25•14 dividends, 25•8 to 25•9 federal and provincial, 25•5 future, 12•11, 14•17 interest income, 25•7 marginal tax rate, 25•7 minimizing taxable investment
income, 25•9 minimum tax, 25•16 payment, 25•7 share dispositions, 25•12 to
25•13 strip bonds and T-bills, 25•8 superfi cial losses, 25•15 to 25•16 system in Canada, 25•5 to 25•6 tax deferral, see Tax deferral plans tax loss sale, 25•16 tax planning, see Tax planning tax rates, 25•7 taxation year, 25•6 types of income, 25•6Income trusts, 22•6 to 22•8 business trusts, 22•8 real estate investment trusts
(REITs), 22•7 royalty or resource trusts, 22•7 to
22•8 taxation, 22•6 to 22•7 three primary categories, 22•6Incorporation, 11•6 to 11•9 advantages and disadvantages,
11•7 to 11•8 jurisdiction, 11•9 procedure, 11•6 to 11•7Index funds, 19•9 to 19•10

CANADIAN SECURITIES COURSE
© CSI GLOBAL EDUCATION INC. (2010)
Ind•10
Indexes: hedge funds, 21•8 stocks, see Stock indexesIndexing: mutual fund management style,
19•11 portfolio management style,
16•24 Index-linked GICs, 24•11 to 24•13Index-linked notes, 6•8Indirect investment, 1•5Individual variable insurance
contract (IVIC), 20•5 see also Segregated fundsIndustry analysis, 13•12 to 13•18 competitive forces, 13•15 to
13•16 product or service, 13•12 to
13•14 stage of growth, 13•14 to 13•15 stock characteristics, 13•16 to
13•18Industry rotation, 16•12 to 16•13Infl ation, 4•29 to 4•32, 13•11 to
13•12 causes, 4•31 to 4•32 costs, 4•30 to 4•31 differentials,4•38 impact, 13•11 to 13•12Infl ation rate: real interest rate, and, 4•27 real rate of return, and, 7•14 to
7•15 risk, 15•10Information circular, 11•11Information gathering, on clients,
26•6 to 26•10Initial public offering (IPO), 11•13,
11•22 to 11•23Insider trading, 3•23 to 3•24Insider
reporting, 3•24Insiders, defi ned, 3•23 to 3•24Instalment debentures, 1•9, 6•20Institutional clients: corporate treasuries, 27•4 defi nition, 1•7 endowments, 27•6 hedge funds, 27•5 to 27•6 insurance companies, 27•5 mutual funds, 27•5 pension funds, 27•5 permitted clients, 27•7 suitability standards, 27•7 to
27•8 trusts, 27•6Institutional salesperson, 27•8 to
27•9 Institutional securities fi rms, 2•9
Institutional traders, 27•9, 27•12 to 27•13
Insurance Companies Act (Ontario), 20•17
Insurance Companies Act (Canada), 2•20
Insurance industry, 2•19 to 2•20 life insurance companies, 2•19 to
2•20 products and services, 2•19 to
2•20 property and casualty insurance,
2•19 regulation, 2•20 trends, 2•20Intangible assets, 12•10, 12•11Integrated asset allocation, 16•23Integrated fi rms, 2•9Interest coverage ratios, 14•19 to
14•21Interest rate, 4•25 to 4•27 bond prices and, 7•17 differentials,4•38 effect on economy,4•26 expectations, 4•26 to 4•27 factors, 4•25 to 4•26 forecasting, 16•27 to 16•28 nominal and real, 4•27 term structure, 7•14 to 7•16 Interest rate anticipation, 16•17 Interest rate risk, 15•10International Financial Reporting
Standards (IFRS) 12•23Interval funds, 22•4In-the-money, 10•16Intrinsic value: of options, 10•16 of rights, 10•34 to 10•35 of warrants, 10•36, 10•37Inventories, 12•6 to 12•7Inventory turnover ratio, 14•25 to
14•27Invested capital, 14•16 to 14•17Investigations, 3•23Investment advisors (IAs), 1•11,
3•13 registration and training, 3•13Investment banker, 27•9Investment constraints, 15•24 to
15•26 legal, 15•25 liquidity, 15•24 tax requirements, 15•24 to 15•25 time horizon, 15•24 unique circumstances, 15•25 to
15•26Investment dealers, 2•8
Investment funds, 1•10, 2•21. See also Closed-end funds; Mutual
fundsInvestment Funds Standards
Committee (IFSC), 19•23Investment Industry Association of
Canada (IIAC), 3•8 to 3•9 Investment Industry Regulatory
Organization of Canada (IIROC), 1•16, 1•18, 3•7 to 3•8, 3•13, 3•24
Investment objectives, 15•21 to 15•24
growth of capital, 15•23 income, 15•22 to 15•23 managing objectives, 15•27 marketability, 15•23 safety of principal, 15•22 tax minimization, 15•24Investment policy design: asset allocation, see Asset
allocation constraints, see Investment
constraints objectives, see Investment
objectives overview of portfolio
management, 15•19 portfolio risk and return, 15•12
to 15•19Investment policy statement, 15•27 sample, 15•28 to 15•30Investment representatives (IRs),
3•14Investors’ rights, 3•19 to 3•20Irrevocable designation of
benefi ciary, 20•6Issued shares, 11•18
J
Jones, Alfred, 21•7 to 21•8
K
Keynes, John Maynard, 5•5Keynesian economics, 5•5 to 5•6,
5•19Know your client, 3•15, 26•14Krugman, Paul, 21•16
L
Labour force, 4•21Labour Force Survey, 4•22Labour market in Canada, 4•21 to
4•25 participation rate, 4•22

INDEX Ind•11
© CSI GLOBAL EDUCATION INC. (2010)
unemployment rate, 4•22 to 4•24
Labour-sponsored venture capital corporation (LSVCC), 18•15 to 18•16
advantages, 18•15 to 18•16 disadvantages, 18•16Laddering, 16•6Lagging indicators, 4•20Large Value Transfer System
(LVTS), 5•16 to 5•17Laws of Demand and Supply, 4•8Leading indicators, 4•18 to 4•19Legislation, federal: Bank Act, 2•16, 2•18 Bank of Canada Act, 5•12 Bankruptcy and Insolvency Act,
20•10 Cooperative Credit Associations
Act, 2•19 Insurance Companies Act, 2•20 Trust and Loan Companies Act,
2•19Lender of last resort, 5•14Leverage options, 10•20 to 10•21 warrants, 10•37Liabilities, 12•5, 12•11 to 12•12 current, 12•11 deferred revenue, 12•12 income taxes, future, 12•11 long-term debt, 12•12 non-controlling interest, 12•11
to 12•12 other, 12•12 Liability traders, 27•12 to 27•13Life cycle theory, 26•10 to 26•11Life expectancy-adjusted withdrawal
plan, 19•18Life insurance companies, 2•19 to
2•20LIFO (last-in-fi rst-out), 12•6, 12•7Limit orders, 9•17Limited partnership, 11•6 hedge funds, 21•6Liquid bonds, 6•9Liquidity, 1•12 common shares, 14•8 hedge funds, 21•11 portfolio management, 15•23Liquidity preference theory, 7•16Liquidity ratios, 14•12, 14•13 to
14•15 current ratio (working capital),
14•13 operating cash fl ow, 14•14 to
14•15 quick ratio (acid test), 14•14Liquidity risk, 15•10
Listed private equity, 22•12 to 22•15
Listing agreement, 11•34Loan companies, 2•22Lockup, 21•11Long margin accountants, 9•6 to
9•8Long position, 9•5Long/short equity strategy, 21•18
to 21•19Long Term Capital Management
(LTCM), 21•16 to 21•17Long-Term Equity AnticiPation
Securities (LEAPS), 10•15Long-term debt, 12•12
M
Macroeconomic analysis, 13•7 to 13•12
external events, 13•7 fi scal policy impact, 13•7 to 13•8 fl ow of funds impact, 13•10 to
13•11 infl ation impact, 13•11 to 13•12 monetary policy impact, 13•8 to
13•9Macroeconomics, 4•6Managed accounts, 23•5 to 23•6,
23•8 to 23•12Managed futures funds, 21•20Managed products, 17•4 to 17•5 advantages, 17•6 to 17•7 changing compensation models,
17•12 compared with structured
products, 17•6 to 17•8 disadvantages, 17•7 to 17•8 evolving market, 17•11 to 17•12 risks, 17•9 types, 17•10Management expense ratio (MER),
18•14 to 18•15 labour-sponsored funds, 18•16Management of securities fi rm, 2•10
to 2•11Management styles, 16•13 to 16•17 equity managers, 16•13 to 16•16 fi xed-income managers, 16•16 to
16•17Margin, 9•6, 9•7 Margin Account Agreement Form,
9•6Margin accounts, 9•5, 9•6 to 9•8 examples of margin transactions,
9•7 to 9•8 long positions, 9•6 to 9•8 risks, 9•8Margin call, 9•7
Marginal tax rate, 25•7Market, 4•7Market capitalization, 1•14, 11•18Market equilibrium, 4•8 to 4•9Market ineffi ciencies, 13•6 to 13•7Market makers, 1•17Market orders, 9•16 to 9•17Market ratios. See Value ratiosMarket segmentation theory, 7•17Market theories, 13•6 to 13•7Market timing, 15•13, 15•25 to
15•26Marketable bonds, 6•10, 6•16Marking-to-market, 10•28Material change, 3•18 to 3•19Material fact, 11•23Mature industries, 13•15 Maturity date, 6•6, 6•9Maturity guarantees, 20•6 to 20•8 tax treatment, 20•15 to 20•16Merger arbitrage strategy, 21•17MFDA Investor Protection
Corporation (IPC), 3•11Microeconomics, 4•6Minimum tax, 25•16Miscellaneous assets, 12•7Modifi ed Dietz method, 19•21Monetarist theory, 5•6, 5•19Monetary aggregates, 4•28 to 4•29Monetary policy, 5•13 to 5•17,
13•8 to 13•9 bond market, 13•9 goal, 5•13 government debt, 13•8 implementing policy, 5•13 to
5•14 open market operations, 5•14 to
5•16 yield curve, 13•9Money, 4•28 to 4•29 medium of exchange,4•28 store of value,4•28 unit of account,4•28Money market funds, 19•5 to 19•6Money purchase plan (MPP),
25•17, 25•18Monitoring, 14•9, 16•24 to 16•30 client objectives, 16•24 economy, 16•25 to 16•30 markets, 16•24Montreal Exchange (MX), 1•12Moody’s Canada Inc., 6•27Mortgage, 6•21Mortgage-backed securities, 24•20
to 24•23 pass-through securities, 24•20 prepayment risk, 24•21, 24•22Mortgage bond, 6•21 to 6•22 Moving average, 13•24 to 13•25

CANADIAN SECURITIES COURSE
© CSI GLOBAL EDUCATION INC. (2010)
Ind•12
Moving average convergence-divergence (MACD), 13•26
Multi-disciplinary accounts, 23•12Multi-manager accounts, 23•10 to
23•12Multi-manager style, 19•11 to
19•12Municipal securities, 6•20 to 6•21,
11•16Mutual Fund Dealers Association
(MFDA), 3•9, 18•17 Investor Protection Corporation
(MFDA IPC), 3•11Mutual Fund Fee Impact Calculator,
18•11Mutual fund wraps, 23•11Mutual funds, 1•10, 18•2 to 18•27,
19•2 to 19•24 advantages, 18•5 to 18•7 annual information form (AIF),
18•20 asset allocation, 19•7 balanced funds, 19•6 to 19•7 bond, 19•6 cash and equivalent, 19•5 to
19•6 charges, 18•11 to 18•15 comparing fund types, 19•10 corporations, 18•9 custodians, 18•9 derivatives, use of, 18•23 directors, 18•9 disadvantages, 18•7 distributors, 18•8 to 18•13,
18•17, 18•13, 18•21, 18•24, 18•25, 18•28
dividend funds, 19•8 equity funds, 19•7 to 19•8 ethical conduct, 18•17 F-class, 18•15 fi nancial institutions as
distributors, 18•26 to 18•27 fi nancial statements, 18•18,
18•20 fi xed-income, 19•6 guidelines and restrictions, 18•22
to 18•25 index funds, 19•6 to 19•10 labour-sponsored funds, 18•15 to
18•16 load funds, 18•11 to 18•13 management fees, 18•14 to
18•15, 18•19 management style, see Fund
management styles; Management styles
managers, 18•9 money market, 19•5 to 19•6
National Instrument 81-101 (NI 81-101), 18•17 to 18•18
National Instrument 81-102 (NI 81-102), 18•10, 18•17 to 18•18
National Registration Database, 3•15, 18•21 to 18•22
net asset value per share (NAVPS), 18•5
net purchases, 13•10 open-end trust, 18•8 organization, 18•9 to 18•10 performance, see Performance of
funds pricing, 18•10 to 18•11 prohibited management
practices, 18•22 to 18•23 prohibited selling practices,
18•23 to 18•25 real estate funds, 19•9 redemption, 19•12 to 19•18 registrar, 18•9 registration, 18•21 to 18•22 regulations, 18•16 to 18•27 regulatory organizations, 18•17 reinvesting distributions, 19•14
to 19•15 requirements, general, 18•18 restrictions, 18•22 to 18•25 risk, 19•23 to 19•24 risk and return for different
types, 19•10 sales communications, 18•25 segregated funds, compared with,
20•11 to 20•12 simplifi ed prospectus, 18•18 to
18•19 specialty funds, 19•9 structure of mutual funds, 18•8 suspension of redemptions,
19•18 taxes, 19•12 to 19•14 transfer agent, 18•9 trusts, 18•8 withdrawal plans, 19•15 to
19•18
N
NAIRU,4•24Naked call writing, 10•21, 10•22NASDAQ Composite Index, 8•30National debt, 5•7, 5•9 to 5•10,
5•18National Do Not Call List (DNCL),
3•16National Instrument 81-101 (NI
81-101), 18•17 to 18•18National Instrument 81-102 (NI
81-102), 18•10, 18•17 to 18•18
National Policies, 3•13National Registration Database
(NRD), 3•15, 18•21 to 18•22Natural unemployment rate,4•24Near-cash items, 15•12Neckline, 13•23Negotiable bonds, 6•9Negotiated offering, 11•17Net asset value per share (NAVPS),
18•10 change in, 19•19 to 19•20Net assets values of mutual and
segregated funds, 20•13 to 20•14Net book value, 12•7Net carrying amount, 12•7Net current assets, 14•13Net income, 12•18Net income before taxes (NIBT),
12•17Net operating profi t, 12•16Net profi t margin, 14•24Net return on common equity,
14•25Net return on invested capital,
14•24 to 14•25Net tangible assets, 14•15 to 14•16Net worth, 12•5New Account Application Form,
3•15, 15•21New York Stock Exchange (NYSE),
1•14, 1•15 indexes, 8•30NEX, 1•21, 11•32Nikkei Stock Average (225) Price
Index, 8•30No-load funds, 18•11No par value (n.p.v.) shares, 11•18,
11•19Nominal GDP, 4•11Nominal interest rate,4•27Nominal rate of return, 7•15, 15•9Nominee, 3•21Non-Accelerating Infl ation Rate of
Unemployment (NAIRU),4•24Non-callable preferred shares, 8•18Non-competitive tender, 11•14Non-controlling interest, 12•11 to
12•12, 12•17Non-operating income, 12•14 to
12•15Non-systematic risk, 15•11Non-trading employees, 3•14Notes to fi nancial statements,
12•22, 14•9 to 14•10Notional units, 20•5
INDEX Ind•13
© CSI GLOBAL EDUCATION INC. (2010)
O
Odd lot, 8•5Offer, 1•11Offering memorandum, 21•6Offering price: for mutual fund share or unit,
18•10 for rights, 10•33Offi ce of the Superintendent of
Financial Institutions (OSFI), 3•5, 20•17
Ombudsman for Banking Services and Investments (OBSI), 3•12 to 3•13
Open-end funds, 1•10, 2•22. See also Mutual funds
Open-end trust, 18•8Open interest, 10•18Open market operations, 5•14 to
5•16Open order, 8•9Operating cash fl ow ratio, 14•14 to
14•15Operating costs (amortization
excluded), 14•5 to 14•6Operating expenses (amortization
included), 12•15, 12•16Operating income, 12•14 to 12•15Operating performance ratios,
14•12, 14•22 to 14•27 after-tax return on invested
capital, 14•24 to 14•25 gross profi t margin, 14•22 inventory turnover, 14•25 to
14•27 net profi t margin, 14•24 operating profi t margin, 14•23 pre-tax profi t margin, 14•23 pre-tax return on invested capital,
14•24 return on common equity
(ROE), 14•25Operating profi t margin ratio,
14•23Option premium, 10•14Option strategies, 10•18 to 10•26 buying calls to manage risk,
10•21 buying calls to speculate, 10•19
to 10•21 buying puts to manage risk,
10•23 to 10•24 buying puts to speculate, 10•23 cash-secured put writing, 10•24
to 10•25 covered call writing, 10•21 naked call writing, 10•21 naked put writing, 10•25
strategies for corporations, 10•25 to 10•26
Options, 1•10, 10•14 to 10•26 American-style, 10•15 assignment, 10•16 at-the-money, 10•17 calls, 10•5, 10•14 defi ned, 10•5 equity, 10•9 European-style, 10•15 exchanges, 10•17 to 10•18 exercise price, 10•14 exercising, 10•16, 10•17 in-the-money, 10•16 intrinsic value, 10•16 leverage, 10•20 to 10•21 offsetting transaction, 10•15 opening transaction, 10•15 out-of-the-money, 10•17 premium, 10•5, 10•14, 10•15 puts, 10•5, 10•14, 10•16, 10•17 strategies, see Option strategies strike price, 10•14 time value, 10•16 to 10•17 trading unit, 10•15Oscillators, 13•26Out-of-the-money, 10•17Output gap,4•31Outstanding shares, 11•18Over-allotment option, 11•29Overlay manager, 23•10 to 23•11,
23•12Overnight rate, 5•13 to 5•14Override, 11•28 Over-the-counter (OTC)
markets,1•17 to 1•19 derivatives, 1•17, 10•6
P
Par value of bond, 6•8Par value shares, 11•18 to 11•19Pari passu, 8•15Participating organizations, 1•13Participating preferred shares, 8•23Participation rate, 4•22 Partnership, 11•6Passive management, 16•23 to
16•24, 19•10Past Service Pension Adjustment
(PSPA), 25•17Peak, 4•16Peer group, 19•22Pension Adjustment (PA), 25•17Pension plans, 2•22, 25•17 to 25•18Percentage of total capital ratios,
14•16 to 14•17Performance bond, 10•5
Performance of funds, 19•19 to 19•24
benchmark index, 19•22 complicating factors, 19•22 to
19•24 NAVPS, change in, 19•19, 19•20 peer group, 19•22 quotes, reading, 19•20 to 19•20 standard performance data,
19•21 to 19•22 time-weighted rate of return,
19•21Permitted client, 27•7Personal savings, 1•7Phillips curve, 4•32Point changes and percentage
changes, 8•27Political risk, 15•10Pooled account, 17•5Porter, Michael, 13•15Portfolio, designing, 15•5Portfolio funds, 20•19Portfolio management, 15•3 to
15•30, 16•2 to 16•34 asset allocation, see Asset
allocation developing an asset mix, 16•5 to
16•13 evaluating portfolio performance,
16•32 to 16•34 investment constraints, 15•24 to
15•26 investment objectives, 15•21 to
15•24 management styles, 16•13 to
16•17 manager’s checklist, 16•30 to
16•31 monitoring the economy, 16•25
to 16•30 monitoring markets and client,
16•24 overview of the process, 15•19 return and risk objectives, 15•20
to 15•21 risk and return, 15•12 to 15•19 risk tolerance, 15•28Potential GDP,4•31Pre-authorized contribution plan
(PAC), 18•6Preferred debentures, 6•24Preferred dividend coverage ratio,
14•21 to 14•22Preferred shares, 1•10, 8•15 to 8•23,
11•17, 14•34 to 14•37 advantages to investors, 8•17,
15•12 advantages to issuer, 8•17, 11•21 call feature, 8•18
CANADIAN SECURITIES COURSE
© CSI GLOBAL EDUCATION INC. (2010)
Ind•14
Canadian Originated Preferred Securities (COPrS), 24•17
common shares, vs., 8•17 convertible, 8•21 to 8•23 cumulative and non-cumulative,
8•17 to 8•18 debt issue, vs., 8•16 deferred, 8•23 disadvantages to issuer, 11•21 dividends, 8•15 to 8•16, 14•27 dividend tax credit, 8•11 to 8•12,
8•17 fl oating or variable rate, 8•22 foreign-pay, 8•23 investment quality assessment,
14•34 to 14•37 pari passu, 8•15 participating, 8•23 portfolio suitability, 14•37 preference as to assets, 8•15 preference share, 8•15 preferred shareholder, position of,
8•15 to 8•16 purchase or sinking fund, 8•18 to
8•19 rating, 14•35 to 14•36 reasons for purchasing, 8•17 retractable, 8•21 to 8•22 selecting, 14•36 straight, 8•19 variable or fl oating rate, 8•22 voting privileges, 8•18Preliminary prospectus, 11•23 to
11•24Prepaid expenses, 12•6Present value, 7•5 to 7•10President of a corporation, 11•13Pre-tax profi t margin, 14•23Pre-tax return on invested capital,
14•24Price-earnings (P/E) ratio, 13•19 to
13•20, 14•30 to 14•32Primary dealers, 11•14Primary distribution, 2•8, 2•13Primary market, 1•11, 1•23Primary offering of securities, 11•22Principal, 6•6Principal-protected notes (PPNs),
24•5 to 24•11 constant proportion portfolio
insurance (CPPI), 24•7 to 24•8 distributor, 24•6 guarantor, 24•5 hedge fund-linked notes, 24•5 index-linked notes, 24•5 manufacturer, 24•6 risks, 24•8 to 24•10
tax treatment, 24•10 to 24•11 zero-coupon bond plus call
option, 24•7, 24•8Principals, 2•12 to 2•14Private equity, 1•19 to 1•21 fi nancing by, 1•19 to 1•20 history, 1•20 listed private equity, 22•12 to
22•15 size of market, 1•20 to 1•21Private family offi ce, 23•13Private offering, 11•13Private placement, 11•22Private policy, 11•13Probate, bypassing with segregated
funds, 20•10Productivity, economic growth and,
4•13 to 4•15Professional (Pro) orders, 9•18Professionalism, 26•17 to 26•19Prohibited sales practices, 3•18Property and casualty insurance,
2•19, 2•20Property, plant and equipment,
12•7 to 12•9Proprietary Electronic Trading
Systems (PETS), 1•18Proprietary managed program, 23•9 Prospectus, 11•22, 11•23 to 11•26 fi nal, 11•24 to 11•25 preliminary, 11•24 red herring, 11•24 securities offered, description of,
11•23, 11•24 short form, 11•25 simplifi ed, 18•18 to 18•19Protected funds, 20•19 to 20•20Protective provisions, 6•16, 11•21Provincial bond, 6•18 to 6•20Provincial regulators, 3•6 to 3•7Proxy, 3•21, 11•11Public fl oat, 11•18Public offerings, 11•22 to 11•23Purchase fund, 6•11 to 6•12Put options, 10•5, 10•14, 10•16,
10•17
Q
Qualitative analysis, 14•8Quantitative analysis, 13•5 13•23
to 13•26Quantum Fund, 21•19Quick ratio (acid test), 14•14Quotation and trade reporting
systems (QTRS), 1•18
R
Random walk theory, 13•6Rate of return, 7•14 to 7•15, 15•6
to 15•10 ex-ante or ex-post, 15•7 historical, 15•8, 15•9, 15•13 nominal and real, 7•14 to 7•15,
15•9 portfolio, 15•14 risk-free, 15•9 to 15•10 single security, 15•7Rating services, 14•35 to 14•36Ratio withdrawal plan, 19•16Rational expectations hypothesis
(market), 13•6Rational expectations theory
(economics), 5•5, 5•19Ratios, 14•12 to 14•34 context, must be used in, 14•12 liquidity, see Liquidity ratios operating performance, see
Operating performance ratios price-earnings (P/E), 13•19 to
13•20, 14•30 to 14•32 risk analysis, see Risk analysis
ratios value, see Value ratiosReal estate investment trusts
(REITs), 22•6, 22•7Real GDP, 4•11Real interest rate, 4•27Real rate of return, 7•14 to 7•15,
15•9Real return bonds, 6•18Rebalancing, 16•20Recession, 4•17 identifying, 4•20Record date, 10•33Recovery phase, 4•17Red herring prospectus, 11•24Redeemable bond, 6•10Redeeming mutual fund units or
shares, 19•12 to 19•18 reinvesting distributions, 19•14
to 19•15 suspension of redemptions,
19•18 tax consequences, 19•12 to
19•14 types of withdrawal policy, 19•15
to 19•18 Redemption price, 18•10Redeposit, 5•17Registered bonds, 7•25Registered Education Savings Plan
(RESP), 25•24 to 25•25Registered Pension Plan (RPP),
25•17 to 25•18
INDEX Ind•15
© CSI GLOBAL EDUCATION INC. (2010)
Registered Retirement Income Fund (RRIF), 25•22
Registered Retirement Savings Plan (RRSP), 25•18 to 25•22
advantages and disadvantages, 25•21 to 25•22
contributions, 25•19 to 25•20 self-directed plans, 25•18 single vendor plans, 25•18 spousal, 25•20 termination, 25•21Registrar of mutual fund, 18•9Registration of dealers and advisors,
3•13 to 3•15Regular dividend, 8•7Reinvesting distributions, 19•14 to
19•15Reinvestment risk, 7•14Replacement risk of royalty trusts,
22•8Reporting issuer, 3•23, 3•24, 11•25Research associate, 27•8Research department, 2•11Reserve, 12•19Reset dates (segregated funds), 20•8,
20•17Resistance level, 13•22Resource trusts. See Royalty or
resource trustsRestricted shares, 8•10 to 8•11Retail securities fi rms, 2•9Retail investors, 1•7Retained earnings, 8•6, 12•13,
12•19Retained earnings statement, 12•19 sample, 14•42Retractable bonds, 6•12Retractable preferred, 8•21 to 8•22Retraction date, 6•12Return, 15•14, 15•20, 16•30 expected, 15•6, 15•14, 15•21,
16•25, 16•29 to 16•30 measuring portfolio returns,
16•32 to 16•34 portfolio, 15•12 to 15•13, 15•14 relationship with risk, 15•5 to
15•6, 15•20 to 15•21Return expectation summary, 16•30Return objective, 15•20Return on common equity (ROE),
13•17, 14•25Return on total equity, 13•17Reversal patterns, 13•22Reverse stock splits, 8•13 to 8•14Revocable designation of benefi ciary,
20•6Right of action for damages, 3•20Right of redemption, 19•15Right of rescission, 3•20
Right of withdrawal, 3•20Rights, 10•33 to 10•36 cum rights, 10•33, 10•35 ex rights, 10•33, 10•34 intrinsic value, 10•34 to 10•35 offering price, 10•33 reasons for issue, 10•33 record date, 10•33 secondary market, 10•33 statutory rights for investors,
3•19 to 3•20 trading rights, 10•35 to 10•36Risk, 15•5, 15•10 to 15•12, 15•15
to 15•19 measures of, 15•11 to 15•12 mutual funds, 19•23 to 19•24 portfolio, 15•14 to 15•19, 15•20
to 15•21, 16•33 reduction by diversifying, 15•11,
15•13, 15•14, 15•15 to 15•18 risk/return relationship, 15•9,
15•18, 15•20 to 15•21, 16•29 systematic and non-systematic,
15•11 types, 15•10 to 15•11Risk-adjusted rate of return, 16•33
to 16•34Risk analysis ratios, 14•12, 14•15
to 14•22 asset coverage, 14•15 to 14•16 cash fl ow/total debt, 14•18 to
14•19 debt/equity, 14•18 interest coverage, 14•19 to 14•21 percentage of total capital, 14•16
to 14•17 preferred dividend coverage,
14•21 to 14•22Risk categories, 15•21Risk-free rate of return, 15•9 to
15•10Risk objective, 15•20Risk and return relationship, 15•5,
15•9, 15•15 to 15•21Risk tolerance, 15•5, 15•20, 15•22,
15•25Royalty or resource trusts, 22•6,
22•7 to 22•8
S
S&P 500 Index, 8•29 to 8•30S&P/TSX Composite Index, 8•25
to 8•27S&P/TSX 60 Index, 8•28S&P/TSX Venture Composite
Index, 8•28Sacrifi ce ratio,4•32Safety of principal, 15•22
Sale and leaseback limitation, 6•15Sale and Repurchase Agreements
(SRAs), 5•15Sale of assets or merger (protection),
6•15Sales (in company analysis), 14•5Sales department in securities fi rm,
2•10Savings banks, 2•21Secondary market, 1•11, 2•13Secondary offering of securities,
11•23Sector rotation, 16•15 to 16•16Secured note, 6•23Secured term note, 6•23Securities and Exchange
Commission (SEC), 3•13Securities fi rms, 2•10 to 2•15 clearing system, 2•15 dealer, principal and agency
functions, 2•13 to 2•15 fi nancing, 2•13 National Registration Database,
3•15, 18•21 to 18•22 organization within, 2•10 to
2•12 registration, 3•13 to 3•14, 3•15 types, 2•10Securities industry, Canadian: overview, 2•5 to 2•8 trends, 2•15Securities legislation, 3•12 to 3•16SEDAR (System for Electronic
Document Analysis and Retrieval), 18•7
Segmented data, 12•22Segregated funds, 20•2 to 20•20 age restrictions, 20•7 Assuris, 20•17 to 20•18 bankruptcy, 20•9, 20•10 to
20•11 benefi ciaries, 20•6 costs, 20•10 creditor protection, 20•9 to
20•10 death benefi ts, 20•8 to 20•9 death benefi ts tax, 20•16 disclosure documents, 20•11 features, 20•5 GMWBs, 20•18 to 20•19 maturity guarantees, 20•6 to
20•8, 20•15 to 20•16 mutual funds, compared with,
20•11 to 20•12 net asset values, 20•13 to 20•14 OSFI’s key requirements, 20•17 owners and annuitants, 20•5 to
20•6 portfolio funds, 20•19

CANADIAN SECURITIES COURSE
© CSI GLOBAL EDUCATION INC. (2010)
Ind•16
probate, bypassing, 20•10 protected funds, 20•19 to 20•20 regulation, 20•17 to 20•18 reset dates, 20•8, 20•17 taxation, 20•12 to 20•16 withdrawals, 20•7Self-directed RRSP, 25•18Self-regulatory organizations
(SROs), 2•5, 3•7 to 3•9, 3•24 mutual funds, 18•18Selling Group, 11•26, 11•29Sentiment indicators, 13•26Separately managed accounts, 17•5,
23•11 to 23•12 Serial bond. 1•9, 6•20Settlement date, 9•5, 9•15Settlement procedures, 9•15Share capital, 11•17 to 11•18,
12•13 authorized shares, 11•17 to
11•18 issued shares, 11•18 outstanding shares, 11•18 par value or no par value, 11•18
to 11•19Shareholders, 11•9, 11•10 to 11•11 meetings, 11•9, 11•10 voting and control, 11•10 voting by proxy, 11•11Shareholders’ equity, 12•5, 12•13 Sharpe ratio, 16•33, 16•34Short position, 9•5, 11•29 Short form prospectus, 11•25 covering, 9•12Short selling, 9•9 to 9•13 dangers, 9•12 to 9•13 declaring a short sale, 9•12 margin requirements, 9•9 to
9•11 profi t or loss on, 9•11 time limit on, 9•12 Short-bias funds, 21•20Simplifi ed prospectus, 18•18 to
18•20Single-manager fee-based account,
23•8 to 23•10Sinking fund, 6•11 to 6•12, 6•15Small cap and mid-cap equity funds,
19•8Socially responsible funds, 19•9Soft landing, 4•20Soft retractable preferred, 8•21Sole proprietorship, 11•6, 11•7,
11•36Sophisticated investors, 21•6S&P 500, 8•29, to 8•30S&P/TSX 60 Index, 8•28S&P/TSX Composite Index, 8•25
to 8•27
criteria for inclusion, 8•26 Global Industry Classifi cation
Standard (GICS), 8•26 S&P/TSX Venture Composite
Index, 8•28Special Purchase and Resale
Agreements (SPRAs), 5•14 to 5•15
Specialty and sector funds, 19•9Specifi c risk, 15•11Speculative industries, 13•17Spending by governments, 5•7 to
5•8, 5•9, 5•13 Split shares, 24•14 to 24•16 capital shares, 24•14, 24•15 example, 24•15 preferred shares, 24•14, 24•15,
24•16 risks, 24•16 tax implications, 24•16Splitting income. 25•26Spousal RRSP, 25•20Spread traders, 16•17Standard & Poor’s Bond Rating
Service, 6•27 to 6•29, 14•35Standard deviation, 15•11 to 15•12 Standard trading units, 8•5, 8•14Standards of conduct, 26•13 to
26•20Stated value 11•19Statement of material facts, 11•30Stock average: contrasted with stock index, 8•24 Dow Jones Industrial Average
(DJIA), 8•24, 8•28 to 8•29 Nikkei Stock Average (225) Price
Index, 8•30Stock dividends, 8•9Stock exchange, 1•12 to 1•16 around the world, 1•14 to 1•15 Canadian exchanges, 1•12 to
1•16Stock indexes, 8•24 to 8•31 Canadian, 8•25 to 8•28 defi ned, 8•24 international, 8•30 to 8•31 U.S., 8•28 to 8•30 value-weighted, 8•24Stock quotations, reading, 8•14Stock savings plan, 8•11Stock split, 8•12 to 8•14Stop buy orders, 9•9, 9•18Stop loss orders, 9•18Straight preferreds, 8•19Straight-line method, 12•8 to 12•9Strategic asset allocation, 16•20 to
16•21Street certifi cates, 8•5
Street form, 3•21Strike price, 10•14Strip bonds, 6•22 income tax, 25•8Structural unemployment, 4•23 to
4•24Structured products, 17•5 advantages, 17•7 changing compensation models,
17•12 compared with managed
products, 17•6 to 17•8 disadvantages, 17•8 evolving market, 17•11 to 17•12 risks, 17•9 types, 17•10Subordinated debentures, 6•22Subscription price for rights, 10•33Superfi cial loss, 25•15 to 25•16Supply, 4•7 to 4•9Supply and demand, 4•7 to
4•9,4•31Supply-side economics, 5•6, 5•19Support level, 13•22Surplus, national budget, 1•7, 5•8,
5•9Suspensions in trading, 11•35Sweetener, 10•36Swiss Market Index, 8•31Switching fees, 18•13 to 18•14Symmetrical triangle patterns,
13•23 to 13•24Syndicate, 11•16Systematic risk, 15•11
T
T3 Form, 19•12T5 Form, 19•12Tactical asset allocation, 16•23Takeover bid circular, 3•22Takeover bids, 3•21 to 3•23Tax avoidance, 25•5Tax deferral plans, 25•17 to 25•25 deferred annuities, 25•22 to
25•23 Registered Education Savings
Plan (RESP), 25•24 to 25•25 Registered Pension Plan (RPP),
25•17 to 25•18 Registered Retirement Income
Fund (RRIF), 25•22 Registered Retirement Savings
Plan (RRSP), 25•18 to 25•22 Tax-Free Savings Account
(TFSA), 25•23 to 25•24Tax loss selling, 25•16

INDEX Ind•17
© CSI GLOBAL EDUCATION INC. (2010)
Tax planning, 25•26 to 25•27 discharging debts of family
member, 25•26 gift to children or parents, 25•27 income splitting, 25•26 loan to family member, 25•26 paying expenses, 25•26 splitting CPP benefi ts, 25•27 spousal RRSPs, 25•26Taxation: current and future taxes, 12•17 fi scal policy, and, 13•7 investment choices, and, 15•24
to 15•25 main types of taxes, 5•9Tax-Free Savings Account (TFSA),
25•23 to 25•24 T-bills. See Treasury bills (T-bills)Technical analysis, 13•5 to 13•6,
13•20 to 13•28 breadth of market, 13•27 chart analysis, 13•21 to 13•24 cycle analysis, 13•26 to 13•27 four main methods, 13•21 fundamental analysis, vs, 13•21 quantitative analysis, 13•24 to
13•26 sentiment indicators, 13•26 three assumptions, 13•20 volume changes, 13•26Temporary investments, 12•6Term deposits, 6•26Term structure of interest rates,
7•14, 7•17Term to maturity, 6•9, 16•16Terms of trade,4•39Tiger Management, 21•20Time horizon, 15•24Time value of option, 10•16Time-weighted rate of return, 19•21Timing of share transactions, 14•8
to 14•9TMX Group, 1•12, 1•13, 1•15,
1•16, 1•21Tombstone advertisement, 11•28Top-down investment approach,
16•15Toronto Stock Exchange (TSX),
1•12 to 1•14, 1•16, 1•19 market indexes, 8•25 to 8•28TSX Venture Exchange, 1•12, 1•13,
1•16, 1•19, 1•21Total Return Indexes, 8•27Trading and settlement procedures,
9•13 to 9•16 other transaction models, 9•15 to
9•16 settlement procedures, 9•15 trading procedures, 9•13 to 9•14
Trading department in securities fi rm, 2•11
Trading ex rights, 10•33Trading unit of option, 10•15Trailer fee, 18•13Training, investment advisors, 2•11,
3•13Tranches, 24•18 to 24•19Transfer agent for fund, 18•9Transparency, 11•15Treasury bills (T-bills), 6•16, 7•11,
15•10, 15•22, 25•8Treasury shares, 11•23Trend ratios, 14•10, 14•11Trend analysis, 14•10 to 14•11Trough, 4•17Trust companies, 2•18Trust deed: bond issue, 6•7, 6•13, 6•29,
6•30 mutual fund, 18•8 security, 11•21, 11•26, 11•27Trust Deed Restrictions, 11•21Trustee for voting trust, 11•11Trustworthiness, honesty and
fairness, 26•16 to 26•18TSX Venture Exchange, 1•12, 1•16
U
Underlying assets, 10•5, 10•9 to 10•10
Underwriting, 2•8, 2•13 to 2•14, 2•19, 11•13. See also Financing
“bought deal”, 11•25 to 11•26 insurance companies, 2•19 underwriting agreement, 11•26Underwriting/fi nancing department,
2•11Unemployment, 4•21 to 4•25 cyclical,4•23 frictional, 4•23 structural, 4•23 to 4•24Unemployment rate, 4•16, 4•21 to
4•25, 4•32 to 4•33 actual,4•24 natural, 4•24 to 4•25 rising trend, 4•18,4•24Unethical practices, 3•16 to 3•17Unifi ed managed account, 23•12Unique circumstances in policy
design, 15•25Universal Market Integrity Rules
(UMIR), 3•8Universe Bond Index, 726, 7•27
V
Value Line Composite Index, 8•30 Value managers, 16•14 to 16•15Value ratios, 14•27 to 14•34 dividend payout, 14•27 to 14•28 dividend yield, 14•30 earnings per common share
(EPS), 14•28 to 14•30 Enterprise Multiple (EM), 14•32
to 14•33 equity value, 14•33 to 14•34 price-earnings (P/E), 14•30 to
14•32 working capital ratio, 14•13Value-weighted index, 8•24Variable rate preferreds, 8•22Variable-rate securities, 6•22Variance, 15•11Venture capital, 1•19, 1•20Volatility in bond prices, 7•17 to
7•21 duration as a measure of, 7•20 to
7•22Volatility in stock prices, 15•18Voting rights, 8•10Voting trust, 11•11
W
Wages, 4•24Waiting period, 11•24Warrants, 10•36 to 10•37 intrinsic value, 10•36, 10•37 leverage, 10•37 time value, 10•36 to 10•37Wealth Management Essentials
course, 2•11, 3•13Window dressing, 3•17Winnipeg Commodity Exchange.
See ICE Futures CanadaWithdrawal plans from mutual
funds, 19•15 to 19•18Working capital ratio (current ratio),
14•13
Y
Yield, 7•6 current yield on a bond, 7•11,
7•13 impact of yield changes, 7•20 on a T-bill, 7•11Yield curve, 7•14 to 7•17, 13•9Yield spread, 6•11Yield to maturity (YTM), 7•6, 7•11
to 7•13 calculating YTM on a bond,
7•11 to 7•13

CANADIAN SECURITIES COURSE
© CSI GLOBAL EDUCATION INC. (2010)
Ind•18
Z
Zero coupon bond, 6•23, 22•9 plus call option, 24•7, 24•8