csa8200 communications signal analyzer tds8200 … documents/tektronix (tek... · wear eye...
TRANSCRIPT
����������071-1482-02
CSA8200 Communications Signal AnalyzerTDS8200 Digital Sampling OscilloscopeQuick Start User Manual
x


www.tektronix.com
CSA8200 Communications Signal AnalyzerTDS8200 Digital Sampling OscilloscopeQuick Start User Manual
Copyright © Tektronix. All rights reserved. Licensed software products are owned by Tektronix or its subsidiaries or
suppliers, and are protected by national copyright laws and international treaty provisions.
Tektronix products are covered by U.S. and foreign patents, issued and pending. Information in this publication supercedes
that in all previously published material. Specifications and price change privileges reserved.
TEKTRONIX, TEK, TEKPROBE, and FrameScan are registered trademarks of Tektronix, Inc.
Contacting Tektronix
Tektronix, Inc.
14200 SW Karl Braun Drive
P.O. Box 500
Beaverton, OR 97077
USA
For product information, sales, service, and technical support:
� In North America, call 1-800-833-9200.
� Worldwide, visit www.tektronix.com to find contacts in your area.

Warranty 2
Tektronix warrants that this product will be free from defects in materials and workmanship for a period of one (1)
year from the date of shipment. If any such product proves defective during this warranty period, Tektronix, at its
option, either will repair the defective product without charge for parts and labor, or will provide a replacement in
exchange for the defective product. Parts, modules and replacement products used by Tektronix for warranty work
may be new or reconditioned to like new performance. All replaced parts, modules and products become the
property of Tektronix.
In order to obtain service under this warranty, Customer must notify Tektronix of the defect before the expiration
of the warranty period and make suitable arrangements for the performance of service. Customer shall be
responsible for packaging and shipping the defective product to the service center designated by Tektronix, with
shipping charges prepaid. Tektronix shall pay for the return of the product to Customer if the shipment is to a
location within the country in which the Tektronix service center is located. Customer shall be responsible for
paying all shipping charges, duties, taxes, and any other charges for products returned to any other locations.
This warranty shall not apply to any defect, failure or damage caused by improper use or improper or inadequate
maintenance and care. Tektronix shall not be obligated to furnish service under this warranty a) to repair damage
resulting from attempts by personnel other than Tektronix representatives to install, repair or service the product;
b) to repair damage resulting from improper use or connection to incompatible equipment; c) to repair any
damage or malfunction caused by the use of non-Tektronix supplies; or d) to service a product that has been
modified or integrated with other products when the effect of such modification or integration increases the time
or difficulty of servicing the product.
THIS WARRANTY IS GIVEN BY TEKTRONIX WITH RESPECT TO THE PRODUCT IN LIEU OF ANY
OTHER WARRANTIES, EXPRESS OR IMPLIED. TEKTRONIX AND ITS VENDORS DISCLAIM ANY
IMPLIED WARRANTIES OF MERCHANTABILITY OR FITNESS FOR A PARTICULAR PURPOSE.
TEKTRONIX’ RESPONSIBILITY TO REPAIR OR REPLACE DEFECTIVE PRODUCTS IS THE SOLE AND
EXCLUSIVE REMEDY PROVIDED TO THE CUSTOMER FOR BREACH OF THIS WARRANTY.
TEKTRONIX AND ITS VENDORS WILL NOT BE LIABLE FOR ANY INDIRECT, SPECIAL, INCIDENTAL,
OR CONSEQUENTIAL DAMAGES IRRESPECTIVE OF WHETHER TEKTRONIX OR THE VENDOR HAS
ADVANCE NOTICE OF THE POSSIBILITY OF SUCH DAMAGES.

Table of Contents
CSA8200 & TDS8200 Series Quick Start User Manual i
Table of ContentsGeneral Safety Summary iii. . . . . . . . . . . . . . . . . . . . . . . . . . . . . . . . . . . . . . . . . . . . . . . . . . . . . . . . . . . . . . . . . . . . .
Preface v. . . . . . . . . . . . . . . . . . . . . . . . . . . . . . . . . . . . . . . . . . . . . . . . . . . . . . . . . . . . . . . . . . . . . . . . . . . . . . . . . .Documentation v. . . . . . . . . . . . . . . . . . . . . . . . . . . . . . . . . . . . . . . . . . . . . . . . . . . . . . . . . . . . . . . . . . . . . . . . .Conventions Used in this Manual vi. . . . . . . . . . . . . . . . . . . . . . . . . . . . . . . . . . . . . . . . . . . . . . . . . . . . . . . . . . . .
Key Features 1. . . . . . . . . . . . . . . . . . . . . . . . . . . . . . . . . . . . . . . . . . . . . . . . . . . . . . . . . . . . . . . . . . . . . . . . . . . . . .
Install Your Instrument 3. . . . . . . . . . . . . . . . . . . . . . . . . . . . . . . . . . . . . . . . . . . . . . . . . . . . . . . . . . . . . . . . . . . . . . .Standard Accessories 3. . . . . . . . . . . . . . . . . . . . . . . . . . . . . . . . . . . . . . . . . . . . . . . . . . . . . . . . . . . . . . . . . . . .Operating Considerations 4. . . . . . . . . . . . . . . . . . . . . . . . . . . . . . . . . . . . . . . . . . . . . . . . . . . . . . . . . . . . . . . . .
Mechanical 4. . . . . . . . . . . . . . . . . . . . . . . . . . . . . . . . . . . . . . . . . . . . . . . . . . . . . . . . . . . . . . . . . . . . . . . .Environmental 4. . . . . . . . . . . . . . . . . . . . . . . . . . . . . . . . . . . . . . . . . . . . . . . . . . . . . . . . . . . . . . . . . . . . . .Power Supply 4. . . . . . . . . . . . . . . . . . . . . . . . . . . . . . . . . . . . . . . . . . . . . . . . . . . . . . . . . . . . . . . . . . . . . .Input Connectors 4. . . . . . . . . . . . . . . . . . . . . . . . . . . . . . . . . . . . . . . . . . . . . . . . . . . . . . . . . . . . . . . . . . . .Certifications 4. . . . . . . . . . . . . . . . . . . . . . . . . . . . . . . . . . . . . . . . . . . . . . . . . . . . . . . . . . . . . . . . . . . . . . .
Installing Modules 5. . . . . . . . . . . . . . . . . . . . . . . . . . . . . . . . . . . . . . . . . . . . . . . . . . . . . . . . . . . . . . . . . . . . . . .Powering the Instrument On and Off 6. . . . . . . . . . . . . . . . . . . . . . . . . . . . . . . . . . . . . . . . . . . . . . . . . . . . . . . . . .Creating an Emergency Startup Disk 7. . . . . . . . . . . . . . . . . . . . . . . . . . . . . . . . . . . . . . . . . . . . . . . . . . . . . . . . .Adding a Second Monitor 8. . . . . . . . . . . . . . . . . . . . . . . . . . . . . . . . . . . . . . . . . . . . . . . . . . . . . . . . . . . . . . . . .Changing the Windows Language 10. . . . . . . . . . . . . . . . . . . . . . . . . . . . . . . . . . . . . . . . . . . . . . . . . . . . . . . . . . .
Getting Acquainted with Your Instrument 12. . . . . . . . . . . . . . . . . . . . . . . . . . . . . . . . . . . . . . . . . . . . . . . . . . . . . . . . . .Front Panel 12. . . . . . . . . . . . . . . . . . . . . . . . . . . . . . . . . . . . . . . . . . . . . . . . . . . . . . . . . . . . . . . . . . . . . . . . . . .Rear Panel 12. . . . . . . . . . . . . . . . . . . . . . . . . . . . . . . . . . . . . . . . . . . . . . . . . . . . . . . . . . . . . . . . . . . . . . . . . . . .Interface 13. . . . . . . . . . . . . . . . . . . . . . . . . . . . . . . . . . . . . . . . . . . . . . . . . . . . . . . . . . . . . . . . . . . . . . . . . . . . .Control Panel 14. . . . . . . . . . . . . . . . . . . . . . . . . . . . . . . . . . . . . . . . . . . . . . . . . . . . . . . . . . . . . . . . . . . . . . . . . .Display -- Single Graticule View 15. . . . . . . . . . . . . . . . . . . . . . . . . . . . . . . . . . . . . . . . . . . . . . . . . . . . . . . . . . . . .Display -- Multiple Views 15. . . . . . . . . . . . . . . . . . . . . . . . . . . . . . . . . . . . . . . . . . . . . . . . . . . . . . . . . . . . . . . . . .Accessing Online Help 16. . . . . . . . . . . . . . . . . . . . . . . . . . . . . . . . . . . . . . . . . . . . . . . . . . . . . . . . . . . . . . . . . . .
Inspect Your Instrument 18. . . . . . . . . . . . . . . . . . . . . . . . . . . . . . . . . . . . . . . . . . . . . . . . . . . . . . . . . . . . . . . . . . . . . .Verify Internal Diagnostics Pass 18. . . . . . . . . . . . . . . . . . . . . . . . . . . . . . . . . . . . . . . . . . . . . . . . . . . . . . . . . . . . .
Optimizing Measurement Accuracy 20. . . . . . . . . . . . . . . . . . . . . . . . . . . . . . . . . . . . . . . . . . . . . . . . . . . . . . . . . . . . . .Signal Path Compensation 20. . . . . . . . . . . . . . . . . . . . . . . . . . . . . . . . . . . . . . . . . . . . . . . . . . . . . . . . . . . . . . . .Perform Dark-Level and User Wavelength Gain Compensations 22. . . . . . . . . . . . . . . . . . . . . . . . . . . . . . . . . . . . . .
Acquisition 24. . . . . . . . . . . . . . . . . . . . . . . . . . . . . . . . . . . . . . . . . . . . . . . . . . . . . . . . . . . . . . . . . . . . . . . . . . . . . . .Setting Up Signal Input 24. . . . . . . . . . . . . . . . . . . . . . . . . . . . . . . . . . . . . . . . . . . . . . . . . . . . . . . . . . . . . . . . . . .Using Autoset 26. . . . . . . . . . . . . . . . . . . . . . . . . . . . . . . . . . . . . . . . . . . . . . . . . . . . . . . . . . . . . . . . . . . . . . . . . .Using Default Setup 26. . . . . . . . . . . . . . . . . . . . . . . . . . . . . . . . . . . . . . . . . . . . . . . . . . . . . . . . . . . . . . . . . . . . .Accessing the Setup Dialog Boxes 27. . . . . . . . . . . . . . . . . . . . . . . . . . . . . . . . . . . . . . . . . . . . . . . . . . . . . . . . . . .Changing the Acquisition Mode 28. . . . . . . . . . . . . . . . . . . . . . . . . . . . . . . . . . . . . . . . . . . . . . . . . . . . . . . . . . . . .Setting the Display Style 29. . . . . . . . . . . . . . . . . . . . . . . . . . . . . . . . . . . . . . . . . . . . . . . . . . . . . . . . . . . . . . . . . .
Triggers 30. . . . . . . . . . . . . . . . . . . . . . . . . . . . . . . . . . . . . . . . . . . . . . . . . . . . . . . . . . . . . . . . . . . . . . . . . . . . . . . . . .Triggering Concepts 30. . . . . . . . . . . . . . . . . . . . . . . . . . . . . . . . . . . . . . . . . . . . . . . . . . . . . . . . . . . . . . . . . . . . .
Trigger Event 30. . . . . . . . . . . . . . . . . . . . . . . . . . . . . . . . . . . . . . . . . . . . . . . . . . . . . . . . . . . . . . . . . . . . . . .Trigger Type 30. . . . . . . . . . . . . . . . . . . . . . . . . . . . . . . . . . . . . . . . . . . . . . . . . . . . . . . . . . . . . . . . . . . . . . .Trigger Modes 30. . . . . . . . . . . . . . . . . . . . . . . . . . . . . . . . . . . . . . . . . . . . . . . . . . . . . . . . . . . . . . . . . . . . . .Trigger Sources 30. . . . . . . . . . . . . . . . . . . . . . . . . . . . . . . . . . . . . . . . . . . . . . . . . . . . . . . . . . . . . . . . . . . . .Trigger Source Connectors 31. . . . . . . . . . . . . . . . . . . . . . . . . . . . . . . . . . . . . . . . . . . . . . . . . . . . . . . . . . . . .Gated Trigger Connector (Option GT Equipped) 32. . . . . . . . . . . . . . . . . . . . . . . . . . . . . . . . . . . . . . . . . . . . . .Enhanced Triggering 32. . . . . . . . . . . . . . . . . . . . . . . . . . . . . . . . . . . . . . . . . . . . . . . . . . . . . . . . . . . . . . . . .Trigger Holdoff 32. . . . . . . . . . . . . . . . . . . . . . . . . . . . . . . . . . . . . . . . . . . . . . . . . . . . . . . . . . . . . . . . . . . . . .
Setting Trigger Controls 34. . . . . . . . . . . . . . . . . . . . . . . . . . . . . . . . . . . . . . . . . . . . . . . . . . . . . . . . . . . . . . . . . . .Setting Pattern Sync Controls 35. . . . . . . . . . . . . . . . . . . . . . . . . . . . . . . . . . . . . . . . . . . . . . . . . . . . . . . . . . . . . .Checking Trigger Status 36. . . . . . . . . . . . . . . . . . . . . . . . . . . . . . . . . . . . . . . . . . . . . . . . . . . . . . . . . . . . . . . . . .
Table of Contents
ii CSA8200 & TDS8200 Series Quick Start User Manual
Analyzing Waveforms 37. . . . . . . . . . . . . . . . . . . . . . . . . . . . . . . . . . . . . . . . . . . . . . . . . . . . . . . . . . . . . . . . . . . . . . . .Taking Automatic Measurements 37. . . . . . . . . . . . . . . . . . . . . . . . . . . . . . . . . . . . . . . . . . . . . . . . . . . . . . . . . . . .Turning Off Automatic Measurements 41. . . . . . . . . . . . . . . . . . . . . . . . . . . . . . . . . . . . . . . . . . . . . . . . . . . . . . . . .Cursor Measurements 42. . . . . . . . . . . . . . . . . . . . . . . . . . . . . . . . . . . . . . . . . . . . . . . . . . . . . . . . . . . . . . . . . . . .Math Waveforms 44. . . . . . . . . . . . . . . . . . . . . . . . . . . . . . . . . . . . . . . . . . . . . . . . . . . . . . . . . . . . . . . . . . . . . . .Waveform Databases 46. . . . . . . . . . . . . . . . . . . . . . . . . . . . . . . . . . . . . . . . . . . . . . . . . . . . . . . . . . . . . . . . . . . .Display a Communication Signal 47. . . . . . . . . . . . . . . . . . . . . . . . . . . . . . . . . . . . . . . . . . . . . . . . . . . . . . . . . . . .Display and Analyze Communication Signals Using Mask Testing 48. . . . . . . . . . . . . . . . . . . . . . . . . . . . . . . . . . . . .FrameScan 51. . . . . . . . . . . . . . . . . . . . . . . . . . . . . . . . . . . . . . . . . . . . . . . . . . . . . . . . . . . . . . . . . . . . . . . . . . .To Use TDR 52. . . . . . . . . . . . . . . . . . . . . . . . . . . . . . . . . . . . . . . . . . . . . . . . . . . . . . . . . . . . . . . . . . . . . . . . . . .Phase Reference 53. . . . . . . . . . . . . . . . . . . . . . . . . . . . . . . . . . . . . . . . . . . . . . . . . . . . . . . . . . . . . . . . . . . . . . .Histograms 54. . . . . . . . . . . . . . . . . . . . . . . . . . . . . . . . . . . . . . . . . . . . . . . . . . . . . . . . . . . . . . . . . . . . . . . . . . . .Document Your Results 55. . . . . . . . . . . . . . . . . . . . . . . . . . . . . . . . . . . . . . . . . . . . . . . . . . . . . . . . . . . . . . . . . . .
Using the 80A05 Electrical Clock Recovery Module Examples 56. . . . . . . . . . . . . . . . . . . . . . . . . . . . . . . . . . . . . . . . . . .Clock Recovery / Trigger on Recovered Clock 57. . . . . . . . . . . . . . . . . . . . . . . . . . . . . . . . . . . . . . . . . . . . . . . . . . .Clock Recovery / Trigger for Optical Signal, with the 80C12 Optical Module 58. . . . . . . . . . . . . . . . . . . . . . . . . . . . .Differential Clock Recovery and Acquisition 59. . . . . . . . . . . . . . . . . . . . . . . . . . . . . . . . . . . . . . . . . . . . . . . . . . . .Probing with Low-impedance Probes 60. . . . . . . . . . . . . . . . . . . . . . . . . . . . . . . . . . . . . . . . . . . . . . . . . . . . . . . . .Probing with Differential to Single-ended Probes 61. . . . . . . . . . . . . . . . . . . . . . . . . . . . . . . . . . . . . . . . . . . . . . . . .Vertical Gain Adjustment 62. . . . . . . . . . . . . . . . . . . . . . . . . . . . . . . . . . . . . . . . . . . . . . . . . . . . . . . . . . . . . . . . . .
Skew and Deskewing 63. . . . . . . . . . . . . . . . . . . . . . . . . . . . . . . . . . . . . . . . . . . . . . . . . . . . . . . . . . . . . . . . . . . . . . . .Sources of Skew 63. . . . . . . . . . . . . . . . . . . . . . . . . . . . . . . . . . . . . . . . . . . . . . . . . . . . . . . . . . . . . . . . . . . . . . . .Minimizing Skew 64. . . . . . . . . . . . . . . . . . . . . . . . . . . . . . . . . . . . . . . . . . . . . . . . . . . . . . . . . . . . . . . . . . . . . . . .Measuring Skew 64. . . . . . . . . . . . . . . . . . . . . . . . . . . . . . . . . . . . . . . . . . . . . . . . . . . . . . . . . . . . . . . . . . . . . . . .Methods to Deskew Your Signals 64. . . . . . . . . . . . . . . . . . . . . . . . . . . . . . . . . . . . . . . . . . . . . . . . . . . . . . . . . . . .Methods to Adjust Out Skew 66. . . . . . . . . . . . . . . . . . . . . . . . . . . . . . . . . . . . . . . . . . . . . . . . . . . . . . . . . . . . . . .Differential TDR Deskew Method 67. . . . . . . . . . . . . . . . . . . . . . . . . . . . . . . . . . . . . . . . . . . . . . . . . . . . . . . . . . . .
Configuration/Setup Considerations 67. . . . . . . . . . . . . . . . . . . . . . . . . . . . . . . . . . . . . . . . . . . . . . . . . . . . . .Performing Acquisition Deskew 68. . . . . . . . . . . . . . . . . . . . . . . . . . . . . . . . . . . . . . . . . . . . . . . . . . . . . . . . . .Performing TDR Step Deskew 69. . . . . . . . . . . . . . . . . . . . . . . . . . . . . . . . . . . . . . . . . . . . . . . . . . . . . . . . . .
Cleaning the Instrument 71. . . . . . . . . . . . . . . . . . . . . . . . . . . . . . . . . . . . . . . . . . . . . . . . . . . . . . . . . . . . . . . . . . . . . .Exterior Cleaning 71. . . . . . . . . . . . . . . . . . . . . . . . . . . . . . . . . . . . . . . . . . . . . . . . . . . . . . . . . . . . . . . . . . . . . . .Flat Panel Display Cleaning 71. . . . . . . . . . . . . . . . . . . . . . . . . . . . . . . . . . . . . . . . . . . . . . . . . . . . . . . . . . . . . . . .Optical Connector Cleaning 71. . . . . . . . . . . . . . . . . . . . . . . . . . . . . . . . . . . . . . . . . . . . . . . . . . . . . . . . . . . . . . . .
Index 73. . . . . . . . . . . . . . . . . . . . . . . . . . . . . . . . . . . . . . . . . . . . . . . . . . . . . . . . . . . . . . . . . . . . . . . . . . . . . . . . . . .
General Safety Summary
CSA8200 & TDS8200 Series Quick Start User Manual iii
General Safety SummaryReview the following safety precautions to avoid injury and prevent damage to this product or any products connected to it.
To avoid potential hazards, use this product only as specified.
Only qualified personnel should perform service procedures.
While using this product, you may need to access other parts of the system. Read the General Safety Summary in other
system manuals for warnings and cautions related to operating the system.
To Avoid Fire or Personal Injury
Use Proper Power Cord. Use only the power cord specified for this product and certified for the country of use.
Connect and Disconnect Properly. Do not connect or disconnect probes or test leads while they are connected to avoltage source.
Ground the Product. This product is grounded through the grounding conductor of the power cord. To avoid electricshock, the grounding conductor must be connected to earth ground. Before making connections to the input or output
terminals of the product, ensure that the product is properly grounded.
Observe All Terminal Ratings. To avoid fire or shock hazard, observe all ratings and markings on the product. Consultthe product manual for further ratings information before making connections to the product.
Do not apply a potential to any terminal, including the common terminal, that exceeds the maximum rating of that terminal.
Power Disconnect. The power switch disconnects the product from the power source. See instructions for the location.
Do not block the power switch; it must remain accessible to the user at all times.
Do Not Operate Without Covers. Do not operate this product with covers or panels removed.
Use Proper Fuse. Use only the fuse type and rating specified for this product.
Avoid Exposed Circuitry. Do not touch exposed connections and components when power is present.
Wear Eye Protection.Wear eye protection if exposure to high-intensity rays or laser radiation exists.
Do Not Operate With Suspected Failures. If you suspect there is damage to this product, have it inspected byqualified service personnel.
Do Not Operate in Wet/Damp Conditions.
Do Not Operate in an Explosive Atmosphere.
Keep Product Surfaces Clean and Dry.
Provide Proper Ventilation. Refer to the manual’s installation instructions for details on installing the product so it hasproper ventilation.
Symbols and Terms
Terms in this Manual. These terms may appear in this manual:
General Safety Summary
iv CSA8200 & TDS8200 Series Quick Start User Manual
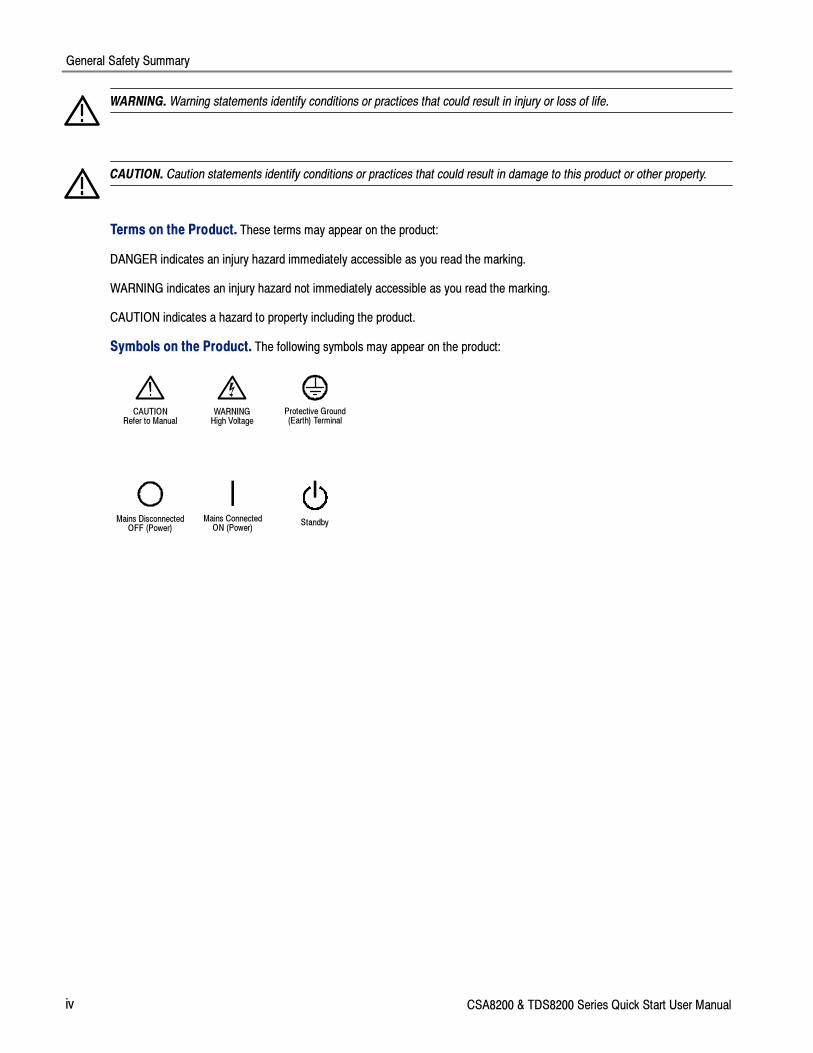
WARNING. Warning statements identify conditions or practices that could result in injury or loss of life.
CAUTION. Caution statements identify conditions or practices that could result in damage to this product or other property.
Terms on the Product. These terms may appear on the product:
DANGER indicates an injury hazard immediately accessible as you read the marking.
WARNING indicates an injury hazard not immediately accessible as you read the marking.
CAUTION indicates a hazard to property including the product.
Symbols on the Product. The following symbols may appear on the product:
CAUTIONRefer to Manual
WARNINGHigh Voltage
Protective Ground(Earth) Terminal
Mains DisconnectedOFF (Power)
Mains ConnectedON (Power)
Standby
Preface
CSA8200 & TDS8200 Series Quick Start User Manual v
Preface
Documentation
This manual describes the installation and operation of CSA8200 & TDS8200 Series Instruments along with basic
operations and concept. For more detailed information, see the online help on your instrument.
NOTE. The screen images in this manual are based on product software version 2.5 and may differ slightly from other
versions of product software.
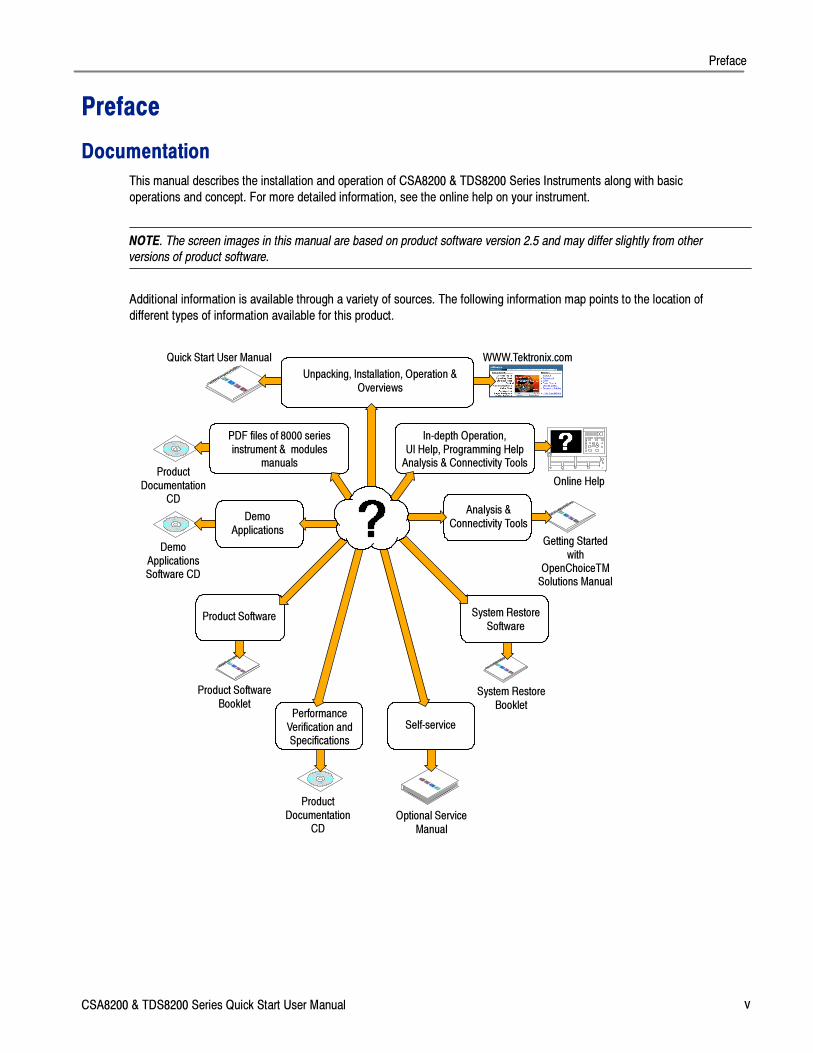
Additional information is available through a variety of sources. The following information map points to the location of
different types of information available for this product.
ProductDocumentation
CD
PDF files of 8000 seriesinstrument & modules
manuals
In-depth Operation,UI Help, Programming HelpAnalysis & Connectivity Tools
Product SoftwareBooklet
Unpacking, Installation, Operation &Overviews
System RestoreBooklet
Quick Start User Manual WWW.Tektronix.com
Analysis &Connectivity Tools
Product Software System RestoreSoftware
Optional ServiceManual
DemoApplicationsSoftware CD
Online Help
Getting Startedwith
OpenChoiceTMSolutions Manual
DemoApplications
ProductDocumentation
CD
Self-servicePerformanceVerification andSpecifications
Preface
vi CSA8200 & TDS8200 Series Quick Start User Manual
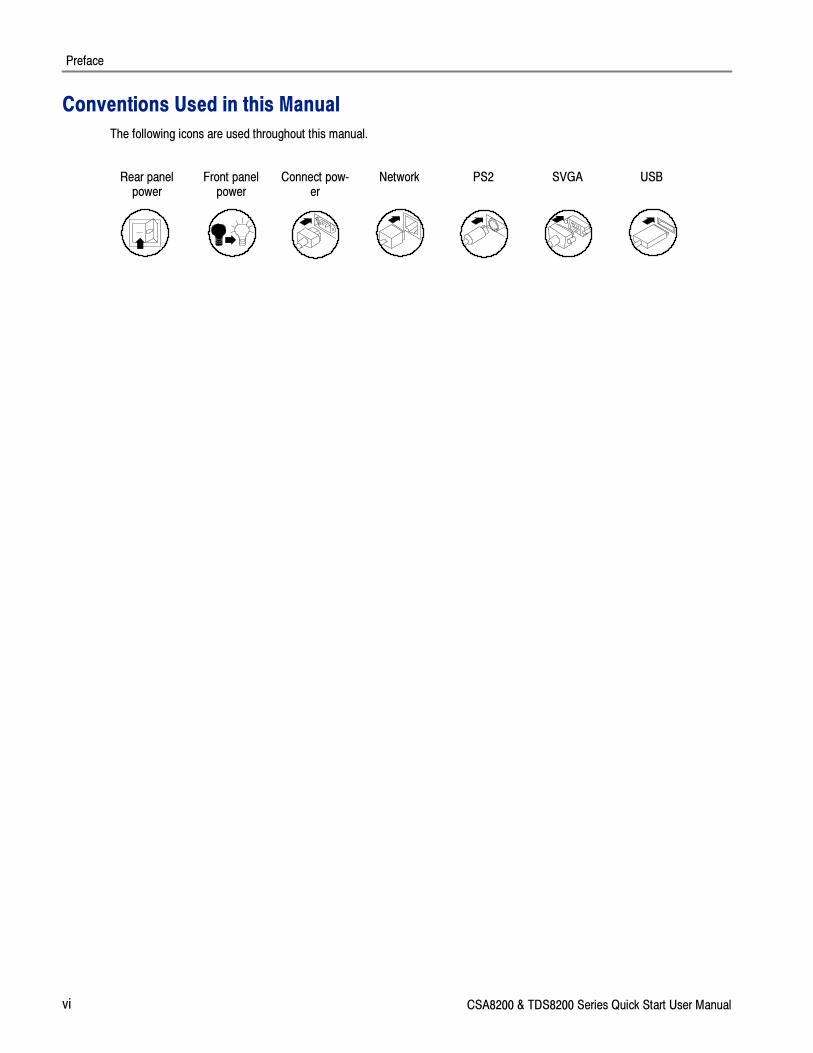
Conventions Used in this Manual
The following icons are used throughout this manual.
Rear panelpower
Front panelpower
Connect pow-er
Network PS2 SVGA USB
Key Features
CSA8200 & TDS8200 Series Quick Start User Manual 1
Key FeaturesThe CSA8200 and TDS8200 Series instruments are high-speed, precision sampling systems that find use in validation and
conformance testing and impedance verification for:
� High-performance semiconductor/computer applications, such as semiconductor testing, TDR characterization of
circuit boards, IC packages and cables, and high-speed serial digital data communications.
� High-performance communications applications, such as design evaluation and manufacturing test of datacom and
telecom components, transceiver subassemblies, and transmission systems.
The instruments include a user interface that runs on the Microsoft Windows 2000 operating system as a windowed
application. You operate the instrument using front-panel controls with the mouse and keyboard or with the touch screen.
Features Include:
� Industry-leading waveform acquisition and measurement rate, with Sample, Envelope, and Average acquisition modes.
� Support for up to six sampling modules (two large and four small modules). Up to eight inputs can be active at a time.
� Supports integrated optical and/or electrical signal pick-off and clock recovery, enabling accurate triggering on optical
and/or electrical communication-signals.
� Support for optical modules with several integrated, selectable reference receivers, which eliminates the need for a
multitude of add-on reference receivers.
� Full programmability, with an extensive GPIB-command set and a message-based interface.
� True differential TDR, with fast step (15 psec reflected risetime) when used with a TDR-capable 80E10 sampling
module.
� Industry-leading trigger bandwidth (12+ GHz) when using the built-in-prescaler.
� Support of both telecom (SONET and SDH) and datacom (Fibre Channel, Infiniband, and Gigabit Ethernet) optical
communication standards.
� Powerful built-in measurement capability, including histograms, mask testing, and automatic measurements.
� Automatic measurements operate on Pulses, RZ eye patterns, and NRZ eye patterns.
� DC to 65 GHz optical bandwidth; DC to 70+ GHz electrical bandwidth, with up to 12.5 GHz triggering.
NOTE. Bandwidth is determined by the specific modules that are installed.
� Low jitter (200 fs typical) in phase reference modes with the 82A04 Phase Reference module.
� FrameScan acquisition for isolating data-dependent failures during conformance/performance testing and for
examining very low-level repetitive signals.
� Jitter analysis with the 80SJNB Advanced Jitter, Noise and BER Analysis Software for the TDS/CSA8000 Series
Sampling Oscilloscopes application (requires software key). Refer to the 8000 Series Product Software CD-ROM
booklet for free trial information and software key use.
� Pattern (frame) triggering with the 80A06 PatternSync Trigger module.
Key Features
2 CSA8200 & TDS8200 Series Quick Start User Manual
� Improved acquisition throughput and timing accuracy using the PatternSync Trigger module in conjunction with
FrameScan.
� Support for optical conformance testing of SONET/SDH signals (including the various forward error correction rates for
these telecom rates) from 155 Mbps to 43 Gb/s, FibreChannel signals, and 1, 2, and 10 Gigabit Ethernet signals as
well as 2.5 Gb/s Infiniband signals.
NOTE. Support for conformance testing rates is determined by the specific modules that are installed.
� High precision time base with two modes of operation, locked and short-term jitter-optimized.
� Negligible long-term jitter degradation (<0.1 ppm), which substantially improves the ability to view signals that are
delayed far from the trigger point without distortion.
� Improved short-term and long-term trigger jitter.
� A gated trigger option (Option GT) that lets you disable or enable (gate) triggering based on a TTL signal you connect
to the instrument rear panel. This Option allows you to use recirculating buffers as part of your test setup to simulate
the effects of very long optical links that are typical of undersea cables and long terrestrial links.
� Analysis and connectivity tools enable the instrument to be controlled from a variety of local and remote environments
and to share data with other commercially available analysis programs.
� Predefined, built-in masks in addition to the user-defined masks.
� A large 10-inch color display that supports color grading of waveform data to show sample density.
� An intuitive UI (User Interface), with built-in online help displayable on screen.
Install Your Instrument
CSA8200 & TDS8200 Series Quick Start User Manual 3
Install Your InstrumentUnpack the instrument and check that you received all items listed as Standard Accessories. Recommended accessories
and probes, instrument options, and upgrades are listed in the online help. Check the Tektronix Web site (www.tektro-
nix.com) for the most current information.
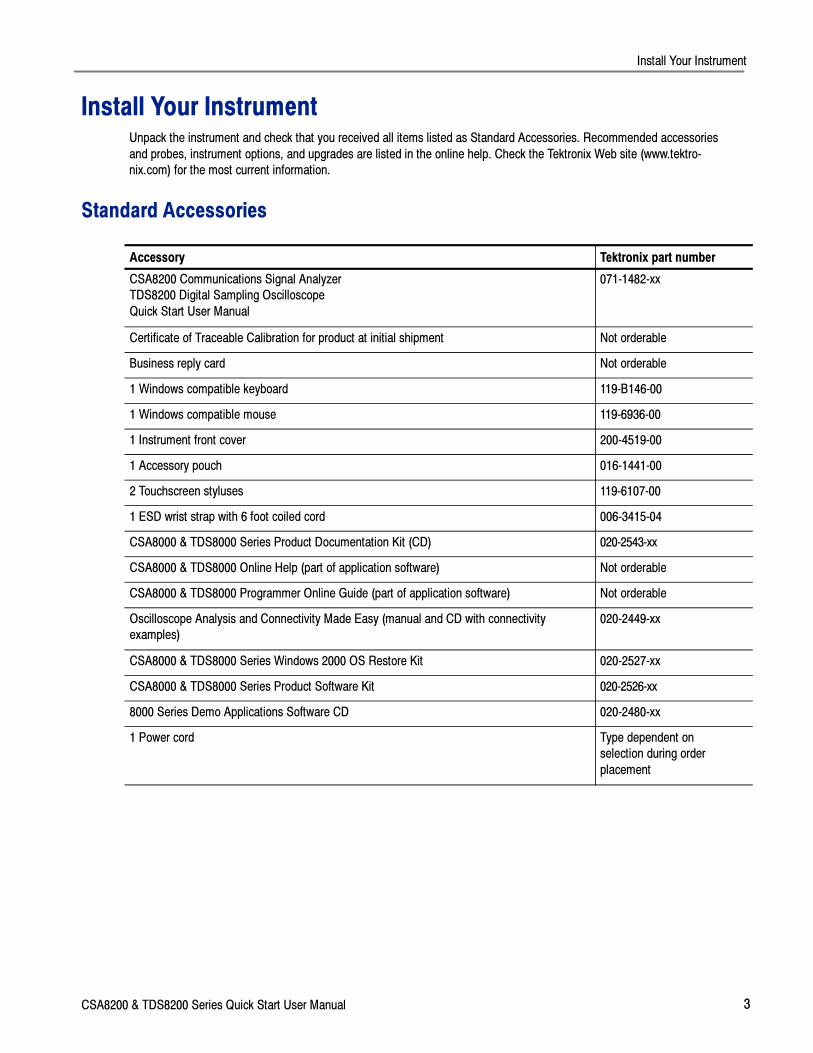
Standard Accessories
Accessory Tektronix part number
CSA8200 Communications Signal Analyzer
TDS8200 Digital Sampling Oscilloscope
Quick Start User Manual
071-1482-xx
Certificate of Traceable Calibration for product at initial shipment Not orderable
Business reply card Not orderable
1 Windows compatible keyboard 119-B146-00
1 Windows compatible mouse 119-6936-00
1 Instrument front cover 200-4519-00
1 Accessory pouch 016-1441-00
2 Touchscreen styluses 119-6107-00
1 ESD wrist strap with 6 foot coiled cord 006-3415-04
CSA8000 & TDS8000 Series Product Documentation Kit (CD) 020-2543-xx
CSA8000 & TDS8000 Online Help (part of application software) Not orderable
CSA8000 & TDS8000 Programmer Online Guide (part of application software) Not orderable
Oscilloscope Analysis and Connectivity Made Easy (manual and CD with connectivity
examples)
020-2449-xx
CSA8000 & TDS8000 Series Windows 2000 OS Restore Kit 020-2527-xx
CSA8000 & TDS8000 Series Product Software Kit 020-2526-xx
8000 Series Demo Applications Software CD 020-2480-xx
1 Power cord Type dependent on
selection during order
placement
Install Your Instrument
4 CSA8200 & TDS8200 Series Quick Start User Manual
Operating Considerations
The following information lists the specifications related to the operation of the mainframe. Refer to the Specifications and
Performance Verification manual for a complete list of specifications.
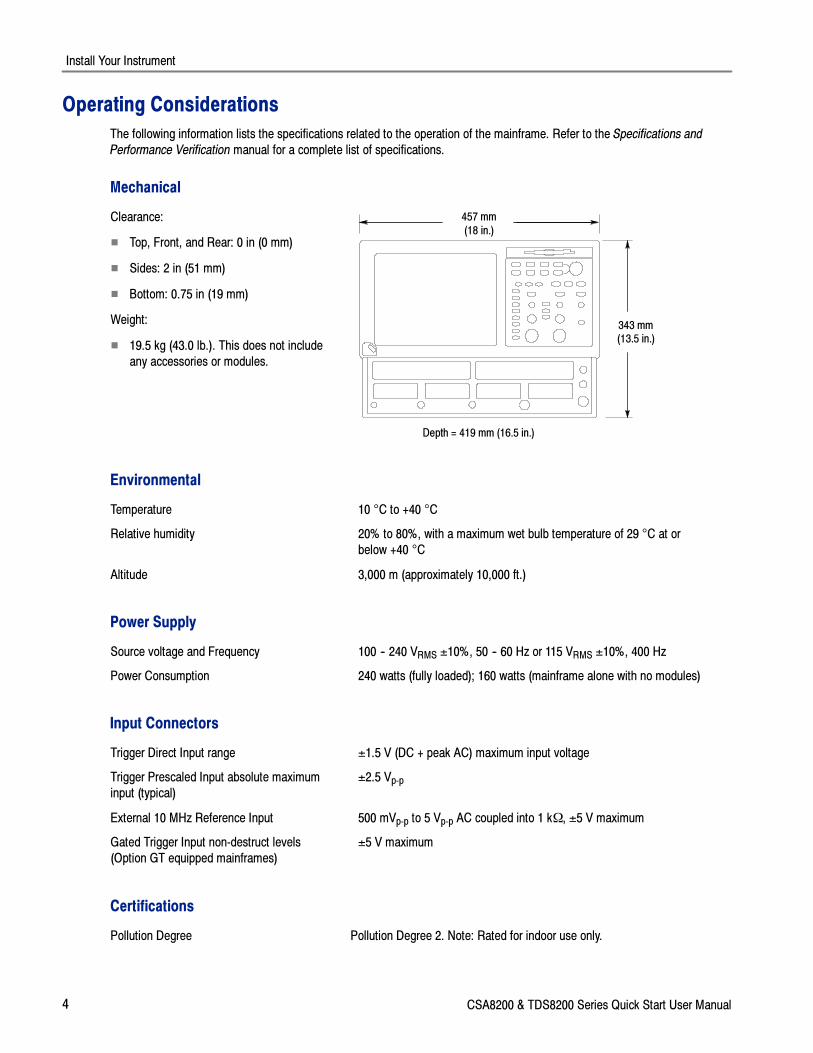
Mechanical
Clearance:
� Top, Front, and Rear: 0 in (0 mm)
� Sides: 2 in (51 mm)
� Bottom: 0.75 in (19 mm)
Weight:
� 19.5 kg (43.0 lb.). This does not include
any accessories or modules.
457 mm(18 in.)
343 mm(13.5 in.)
Depth = 419 mm (16.5 in.)
Environmental
Temperature 10 °C to +40 °C
Relative humidity 20% to 80%, with a maximum wet bulb temperature of 29 °C at or
below +40 °C
Altitude 3,000 m (approximately 10,000 ft.)
Power Supply
Source voltage and Frequency 100 -- 240 VRMS ±10%, 50 -- 60 Hz or 115 VRMS ±10%, 400 Hz
Power Consumption 240 watts (fully loaded); 160 watts (mainframe alone with no modules)
Input Connectors
Trigger Direct Input range ±1.5 V (DC + peak AC) maximum input voltage
Trigger Prescaled Input absolute maximum
input (typical)
±2.5 Vp-p
External 10 MHz Reference Input 500 mVp-p to 5 Vp-p AC coupled into 1 kΩ, ±5 V maximum
Gated Trigger Input non-destruct levels
(Option GT equipped mainframes)
±5 V maximum
Certifications
Pollution Degree Pollution Degree 2. Note: Rated for indoor use only.
Install Your Instrument
CSA8200 & TDS8200 Series Quick Start User Manual 5
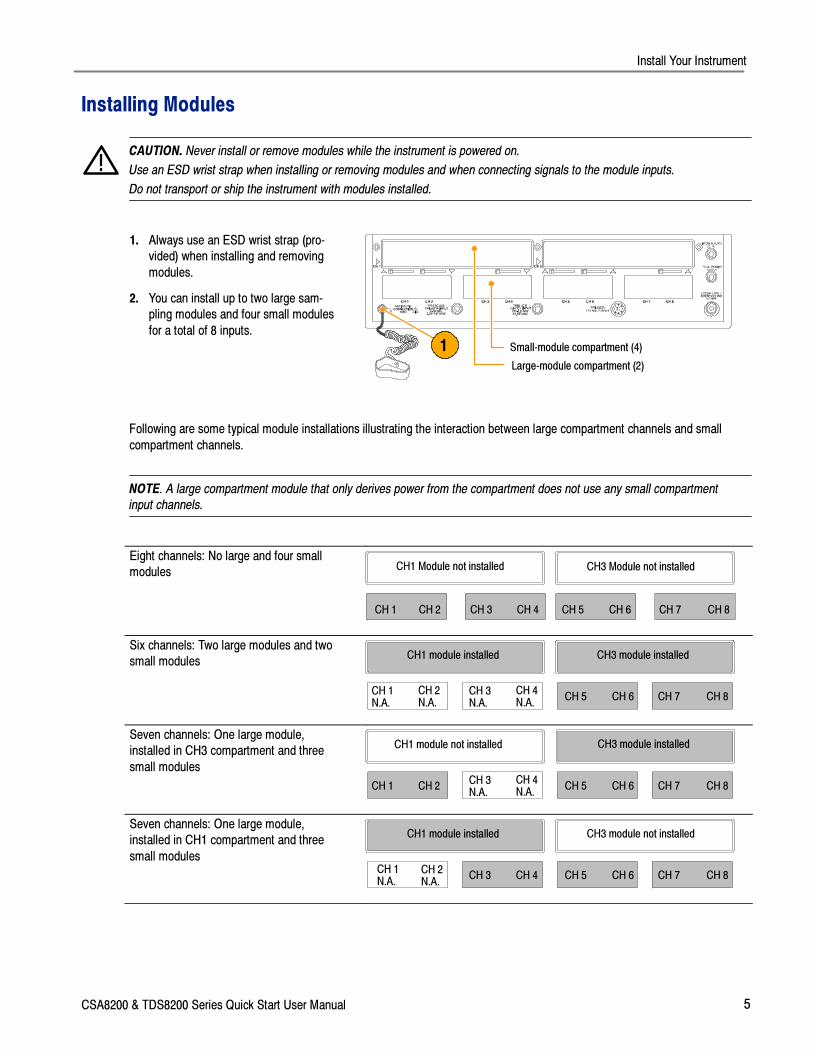
Installing Modules
CAUTION. Never install or remove modules while the instrument is powered on.
Use an ESD wrist strap when installing or removing modules and when connecting signals to the module inputs.
Do not transport or ship the instrument with modules installed.
1. Always use an ESD wrist strap (pro-
vided) when installing and removing
modules.
2. You can install up to two large sam-
pling modules and four small modules
for a total of 8 inputs.
Small-module compartment (4)
Large-module compartment (2)
1
Following are some typical module installations illustrating the interaction between large compartment channels and small
compartment channels.
NOTE. A large compartment module that only derives power from the compartment does not use any small compartment
input channels.
Eight channels: No large and four small
modules
CH 1 CH 2 CH 6CH 3 CH 8CH 5 CH 7
CH3 Module not installed
CH 4
CH1 Module not installed
Six channels: Two large modules and two
small modulesCH3 module installedCH1 module installed
CH 6CH 3N.A.
CH 5 CH 7CH 4N.A.
CH 8CH 1N.A.
CH 2N.A.
Seven channels: One large module,
installed in CH3 compartment and three
small modules
CH3 module installedCH1 module not installed
CH 6CH 3N.A.
CH 5 CH 7CH 4N.A.
CH 8CH 1 CH 2
Seven channels: One large module,
installed in CH1 compartment and three
small modules
CH1 module installed
CH 1N.A.
CH 6CH 3 CH 8CH 5 CH 7CH 2N.A.
CH 4
CH3 module not installed
Install Your Instrument
6 CSA8200 & TDS8200 Series Quick Start User Manual
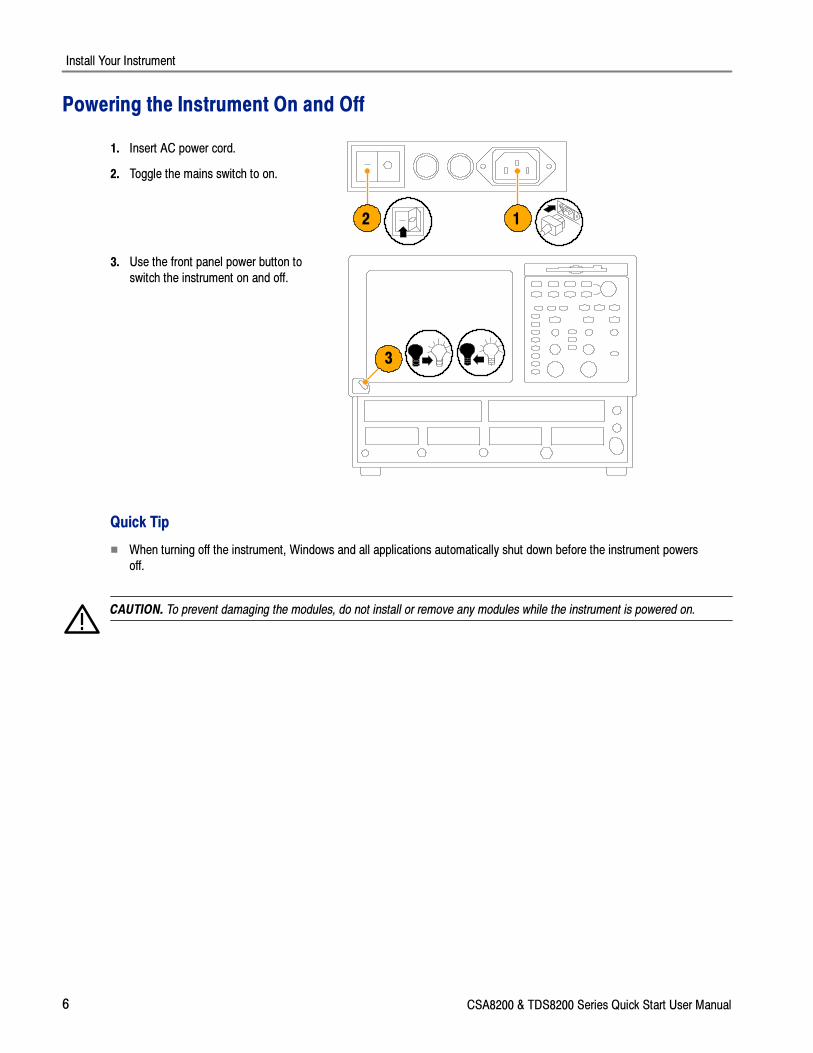
Powering the Instrument On and Off
1. Insert AC power cord.
2. Toggle the mains switch to on.
12
3. Use the front panel power button to
switch the instrument on and off.
3
Quick Tip
� When turning off the instrument, Windows and all applications automatically shut down before the instrument powers
off.
CAUTION. To prevent damaging the modules, do not install or remove any modules while the instrument is powered on.

Install Your Instrument
CSA8200 & TDS8200 Series Quick Start User Manual 7
Creating an Emergency Startup Disk
Create an emergency startup disk that you can use to restart your instrument in case of a major hardware or software
failure. Store this disk in a safe place.
1. Select the minimize icon, gaining
access to the Start menu.1
2. Select Start > Programs >
Accessories > System Tools >
Backup.
2
3. Select Emergency Repair Disk and
follow the on-screen instructions.
3
Install Your Instrument
8 CSA8200 & TDS8200 Series Quick Start User Manual
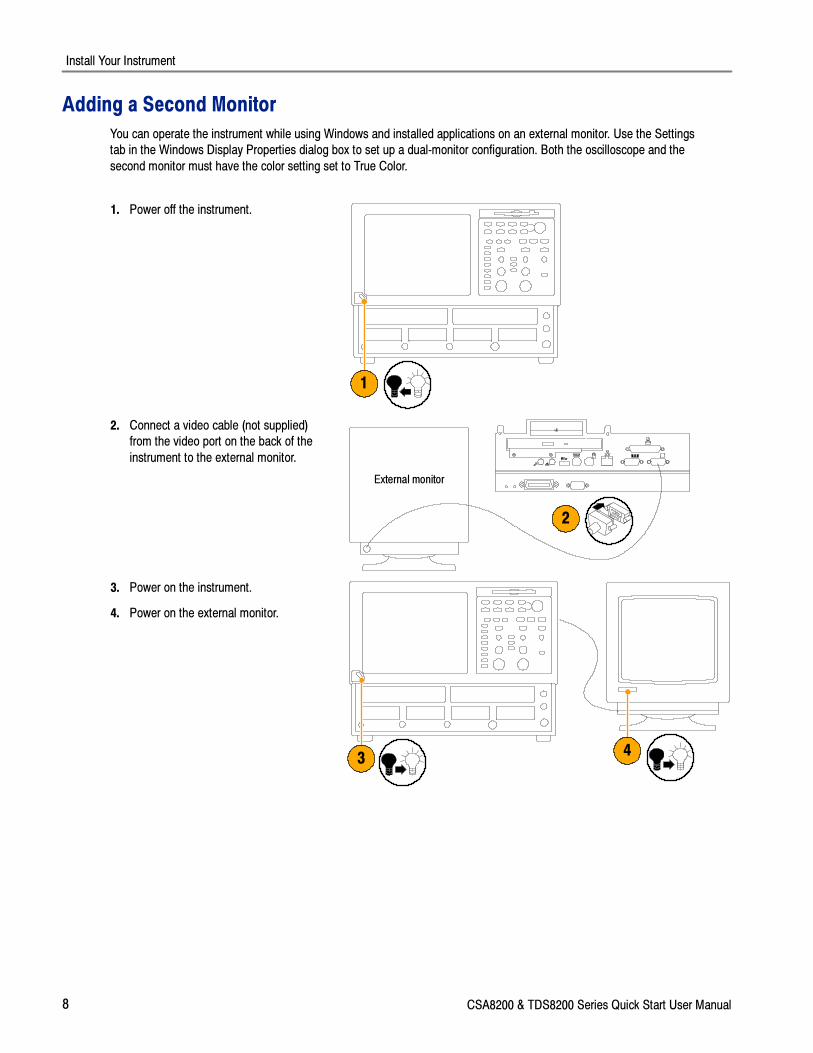
Adding a Second Monitor
You can operate the instrument while using Windows and installed applications on an external monitor. Use the Settings
tab in the Windows Display Properties dialog box to set up a dual-monitor configuration. Both the oscilloscope and the
second monitor must have the color setting set to True Color.
1. Power off the instrument.
1
2. Connect a video cable (not supplied)
from the video port on the back of the
instrument to the external monitor.
2
External monitor
3. Power on the instrument.
4. Power on the external monitor.
34
Install Your Instrument
CSA8200 & TDS8200 Series Quick Start User Manual 9
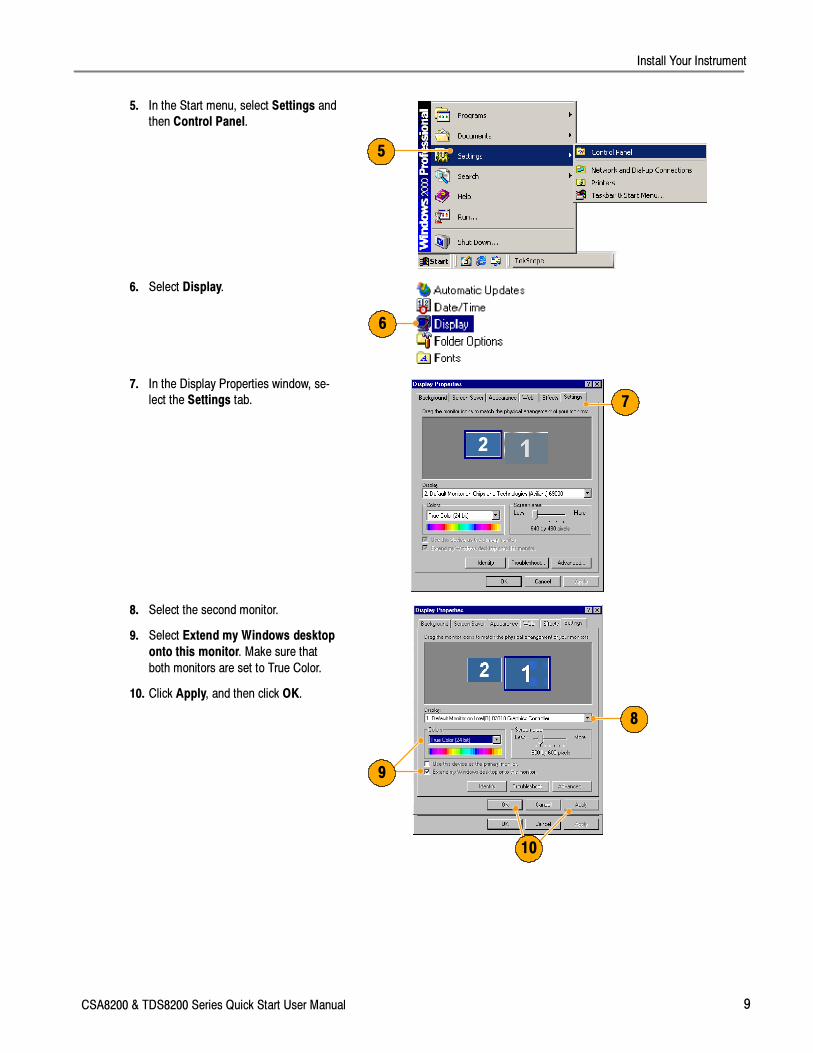
5. In the Start menu, select Settings and
then Control Panel.
5
6. Select Display.
6
7. In the Display Properties window, se-
lect the Settings tab. 7
8. Select the second monitor.
9. Select Extend my Windows desktop
onto this monitor. Make sure that
both monitors are set to True Color.
10. Click Apply, and then click OK.
8
9
10
Install Your Instrument
10 CSA8200 & TDS8200 Series Quick Start User Manual
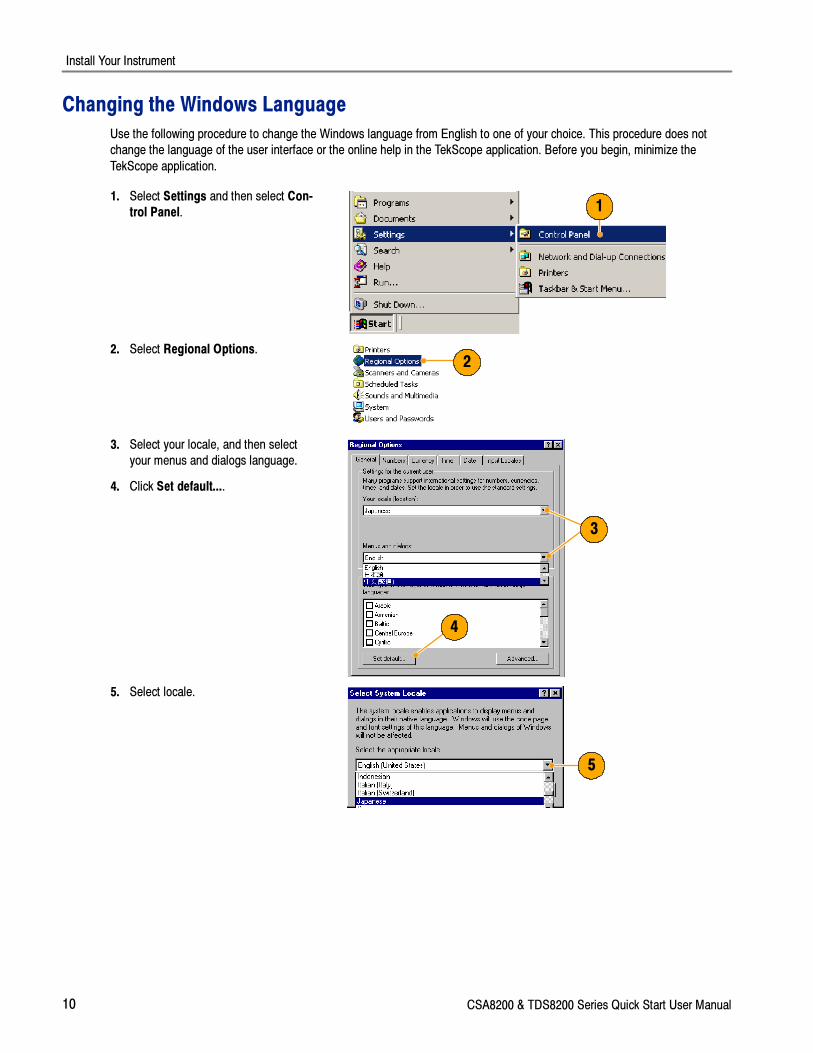
Changing the Windows Language
Use the following procedure to change the Windows language from English to one of your choice. This procedure does not
change the language of the user interface or the online help in the TekScope application. Before you begin, minimize the
TekScope application.
1. Select Settings and then select Con-
trol Panel. 1
2. Select Regional Options.2
3. Select your locale, and then select
your menus and dialogs language.
4. Click Set default....
3
4
5. Select locale.
5

Install Your Instrument
CSA8200 & TDS8200 Series Quick Start User Manual 11
6. Click Add to add the input locale.
6
7. Select the Input locale and Keyboard
layout/IME.
7
8. Select the Installed input locale, and
click Set as Default.
9. Click OK.
8
9
10. Click Yes in each dialog box.
10
Getting Acquainted with Your Instrument
12 CSA8200 & TDS8200 Series Quick Start User Manual
Getting Acquainted with Your Instrument
Front Panel
On/Off switch
Floppy disk drive
Ground terminal
Control panel
Internal clock output
DC calibration output
External 10 MHz reference input
Trigger prescale inputTrigger direct input
Trigger probe power
Rear Panel
PS2 (keyboard)
USB (keyboard)
Audio line in (microphone)
Audio line out
GPIB
Scope VGA output for instrument display
SVGA out for dual-monitordisplay
Parallel port
LAN COM 1
CD-ROM drive
Removable hard drive
PS2 (mouse)
Gated trigger Option GT(lower right corner)
Getting Acquainted with Your Instrument
CSA8200 & TDS8200 Series Quick Start User Manual 13
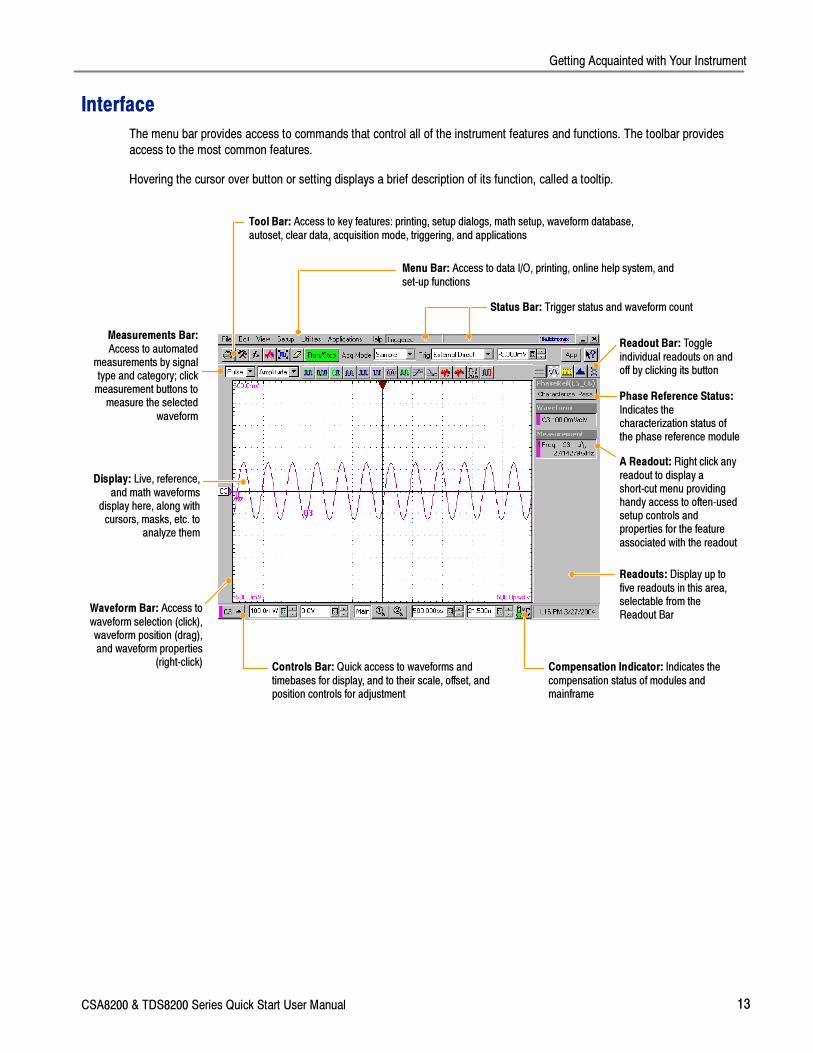
Interface
The menu bar provides access to commands that control all of the instrument features and functions. The toolbar provides
access to the most common features.
Hovering the cursor over button or setting displays a brief description of its function, called a tooltip.
Menu Bar: Access to data I/O, printing, online help system, andset-up functions
Tool Bar: Access to key features: printing, setup dialogs, math setup, waveform database,autoset, clear data, acquisition mode, triggering, and applications
Measurements Bar:Access to automated
measurements by signaltype and category; clickmeasurement buttons tomeasure the selected
waveform
Display: Live, reference,and math waveforms
display here, along withcursors, masks, etc. to
analyze them
Readouts: Display up tofive readouts in this area,selectable from theReadout Bar
Controls Bar: Quick access to waveforms andtimebases for display, and to their scale, offset, andposition controls for adjustment
Waveform Bar: Access towaveform selection (click),waveform position (drag),and waveform properties
(right-click)
A Readout: Right click anyreadout to display ashort-cut menu providinghandy access to often-usedsetup controls andproperties for the featureassociated with the readout
Readout Bar: Toggleindividual readouts on andoff by clicking its button
Status Bar: Trigger status and waveform count
Compensation Indicator: Indicates thecompensation status of modules andmainframe
Phase Reference Status:Indicates thecharacterization status ofthe phase reference module
Getting Acquainted with Your Instrument
14 CSA8200 & TDS8200 Series Quick Start User Manual
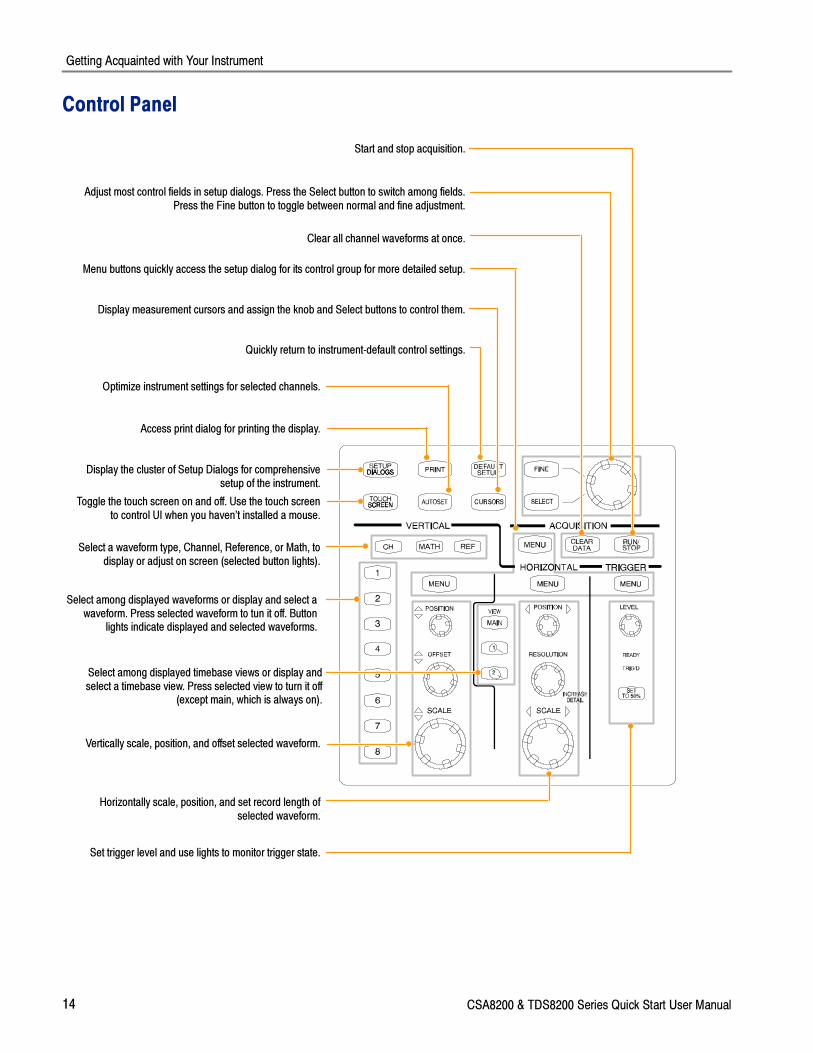
Control Panel
Select among displayed waveforms or display and select awaveform. Press selected waveform to tun it off. Button
lights indicate displayed and selected waveforms.
Select a waveform type, Channel, Reference, or Math, todisplay or adjust on screen (selected button lights).
Display the cluster of Setup Dialogs for comprehensivesetup of the instrument.
Toggle the touch screen on and off. Use the touch screento control UI when you haven’t installed a mouse.
Access print dialog for printing the display.
Optimize instrument settings for selected channels.
Quickly return to instrument-default control settings.
Vertically scale, position, and offset selected waveform.
Select among displayed timebase views or display andselect a timebase view. Press selected view to turn it off
(except main, which is always on).
Horizontally scale, position, and set record length ofselected waveform.
Clear all channel waveforms at once.
Menu buttons quickly access the setup dialog for its control group for more detailed setup.
Set trigger level and use lights to monitor trigger state.
Adjust most control fields in setup dialogs. Press the Select button to switch among fields.Press the Fine button to toggle between normal and fine adjustment.
Display measurement cursors and assign the knob and Select buttons to control them.
Start and stop acquisition.
Getting Acquainted with Your Instrument
CSA8200 & TDS8200 Series Quick Start User Manual 15
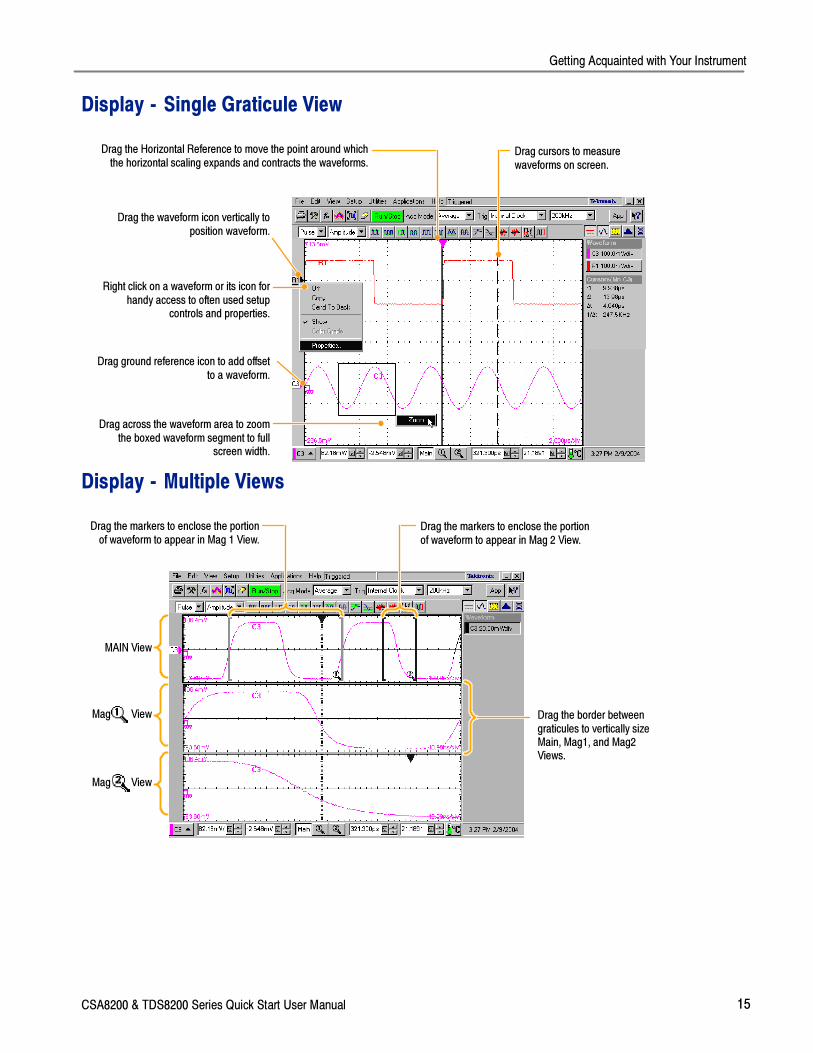
Display - Single Graticule View
Right click on a waveform or its icon forhandy access to often used setup
controls and properties.
Drag across the waveform area to zoomthe boxed waveform segment to full
screen width.
Drag cursors to measurewaveforms on screen.
Drag ground reference icon to add offsetto a waveform.
Drag the waveform icon vertically toposition waveform.
Drag the Horizontal Reference to move the point around whichthe horizontal scaling expands and contracts the waveforms.
Display - Multiple Views
Drag the markers to enclose the portionof waveform to appear in Mag 2 View.
Drag the markers to enclose the portionof waveform to appear in Mag 1 View.
Drag the border betweengraticules to vertically sizeMain, Mag1, and Mag2Views.
MAIN View
Mag View
Mag View
Getting Acquainted with Your Instrument
16 CSA8200 & TDS8200 Series Quick Start User Manual
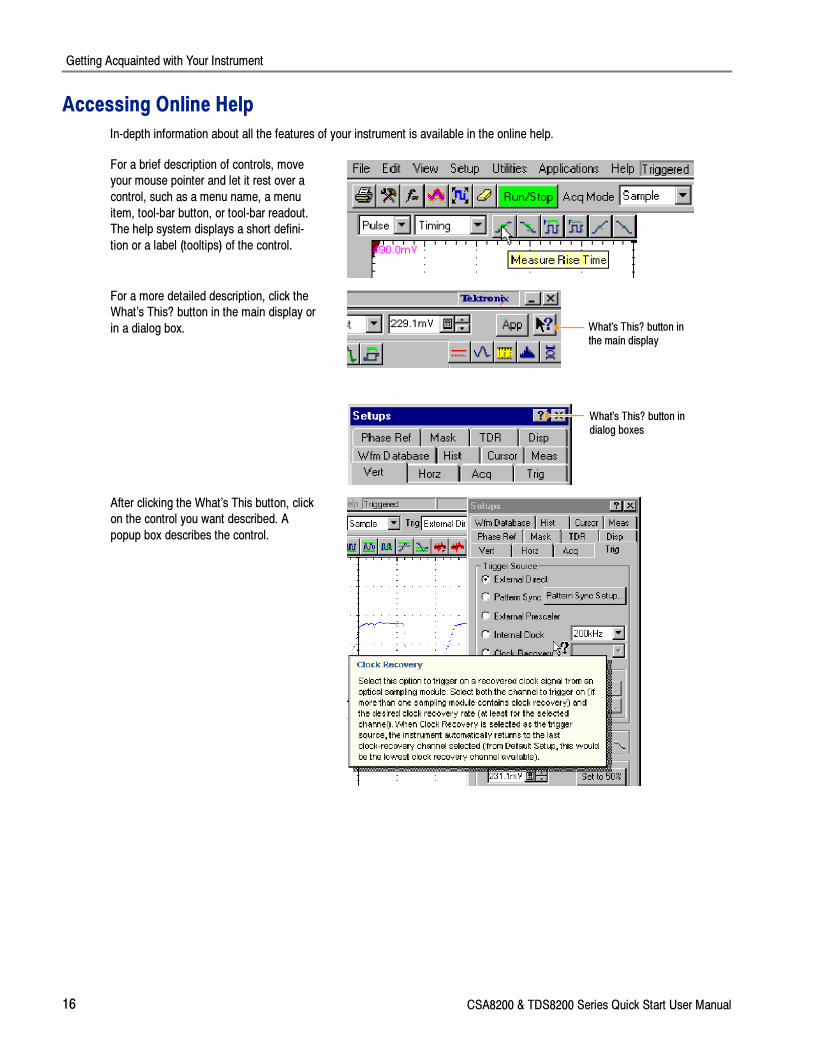
Accessing Online Help
In-depth information about all the features of your instrument is available in the online help.
For a brief description of controls, move
your mouse pointer and let it rest over a
control, such as a menu name, a menu
item, tool-bar button, or tool-bar readout.
The help system displays a short defini-
tion or a label (tooltips) of the control.
For a more detailed description, click the
What’s This? button in the main display or
in a dialog box. What’s This? button inthe main display
What’s This? button indialog boxes
After clicking the What’s This button, click
on the control you want described. A
popup box describes the control.
Getting Acquainted with Your Instrument
CSA8200 & TDS8200 Series Quick Start User Manual 17
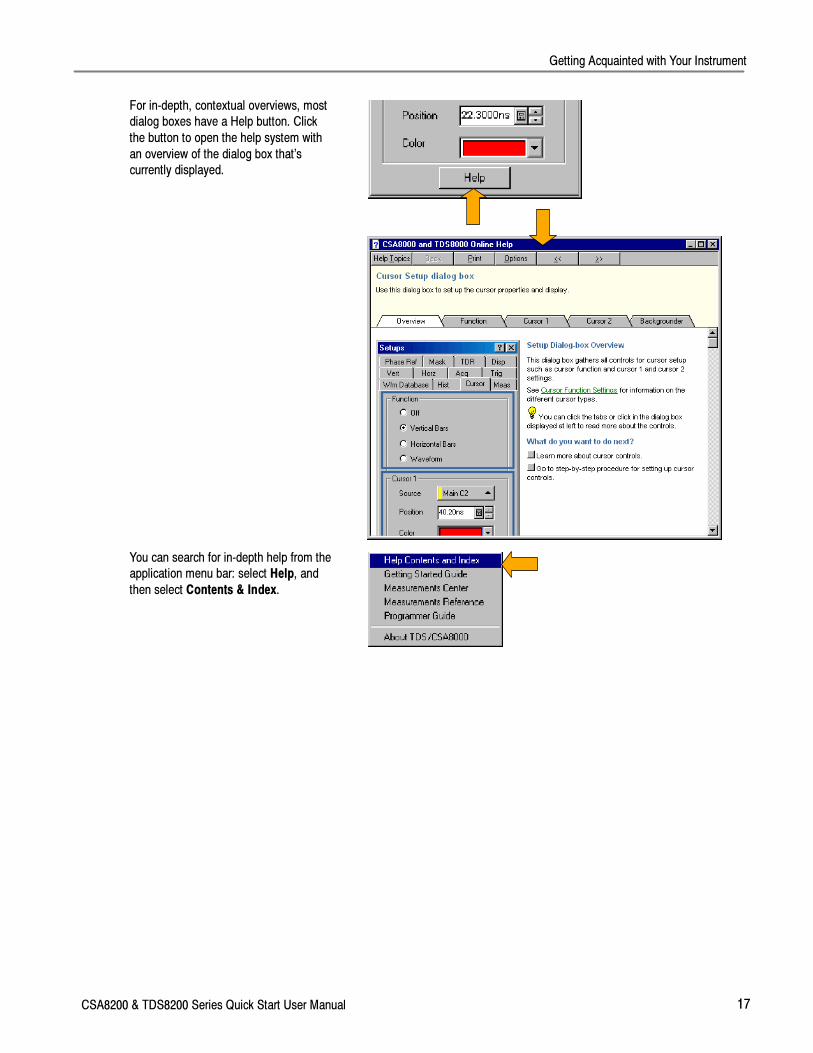
For in-depth, contextual overviews, most
dialog boxes have a Help button. Click
the button to open the help system with
an overview of the dialog box that’s
currently displayed.
You can search for in-depth help from the
application menu bar: select Help, and
then select Contents & Index.
Inspect Your Instrument
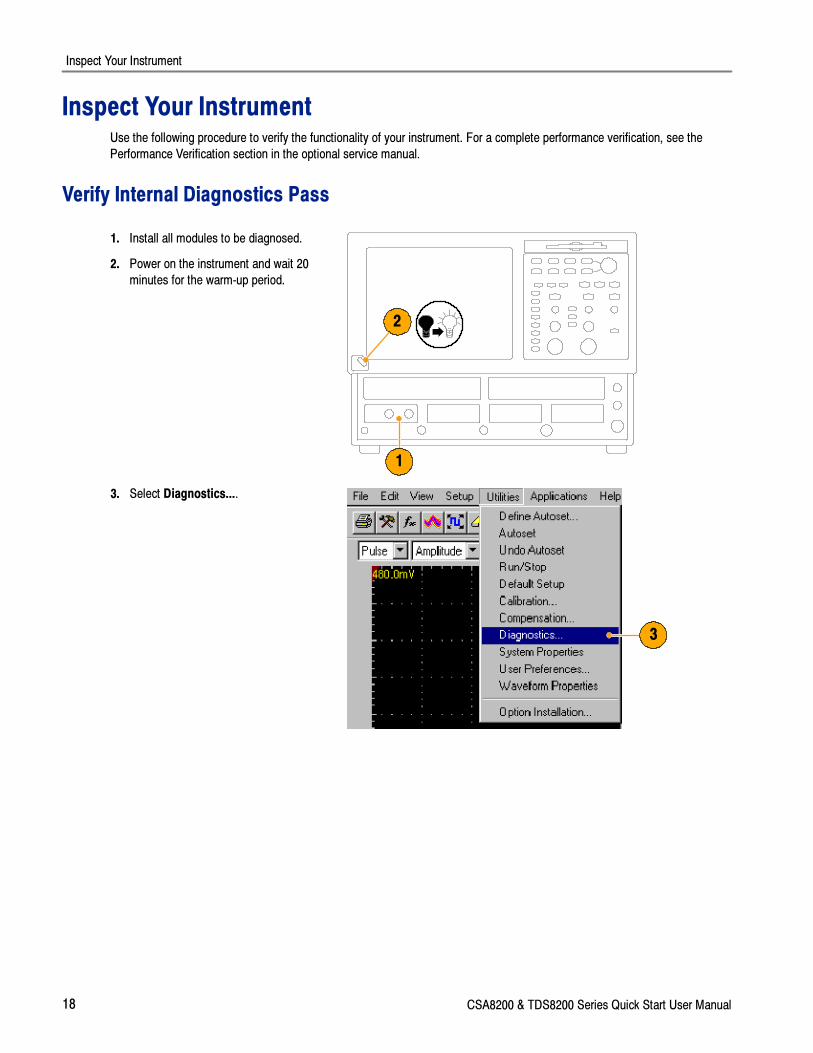
18 CSA8200 & TDS8200 Series Quick Start User Manual
Inspect Your InstrumentUse the following procedure to verify the functionality of your instrument. For a complete performance verification, see the
Performance Verification section in the optional service manual.
Verify Internal Diagnostics Pass
1. Install all modules to be diagnosed.
2. Power on the instrument and wait 20
minutes for the warm-up period.
1
2
3. Select Diagnostics....
3

Inspect Your Instrument
CSA8200 & TDS8200 Series Quick Start User Manual 19
4. Select the Subsystem Level tab.
5. Select all the entries by clicking the
first entry Control Proc and dragging
down to select the rest. All entries
should be highlighted as shown above.
6. In the Run box, leave Loop and Halt
on Failure unchecked.
7. Click Run.
8. Verify that Pass appears as Status in
the dialog box when the diagnostics
complete. If diagnostic failures occur,
contact your local Tektronix service
personnel.
4
56
7
8
Optimizing Measurement Accuracy
20 CSA8200 & TDS8200 Series Quick Start User Manual
Optimizing Measurement AccuracyThis instrument can compensate itself and the sampling modules installed, optimizing the internal signal path used to
acquire the waveforms you measure. Compensation optimizes the capability of the instrument to make accurate
measurements at the ambient temperature.
NOTE. After first installing a sampling module(s) or moving a sampling module from one compartment to another, run
Compensation from the Utilities menu to ensure that the instrument meets it specifications when reaching a stable
equilibrium after power-up (normally 20 minutes is recommended).
You must save the compensation results or they will be lost when the instrument is powered down.
Signal Path Compensation
This procedure compensates the signal path of each installed module (for the current temperature) to enhance measure-
ment results.
Use this procedure for any of the following conditions:
� A module has been added to the instrument or a module has been moved to another compartment.
� The temperature has changed more than 5 °C since the last signal path compensation.
When making measurements at vertical scale settings less than or equal to 5 mV/div, perform the signal path compensa-
tion once a week. Failure to do so may result in the instrument not meeting warranted performance levels at those volts/div
settings.
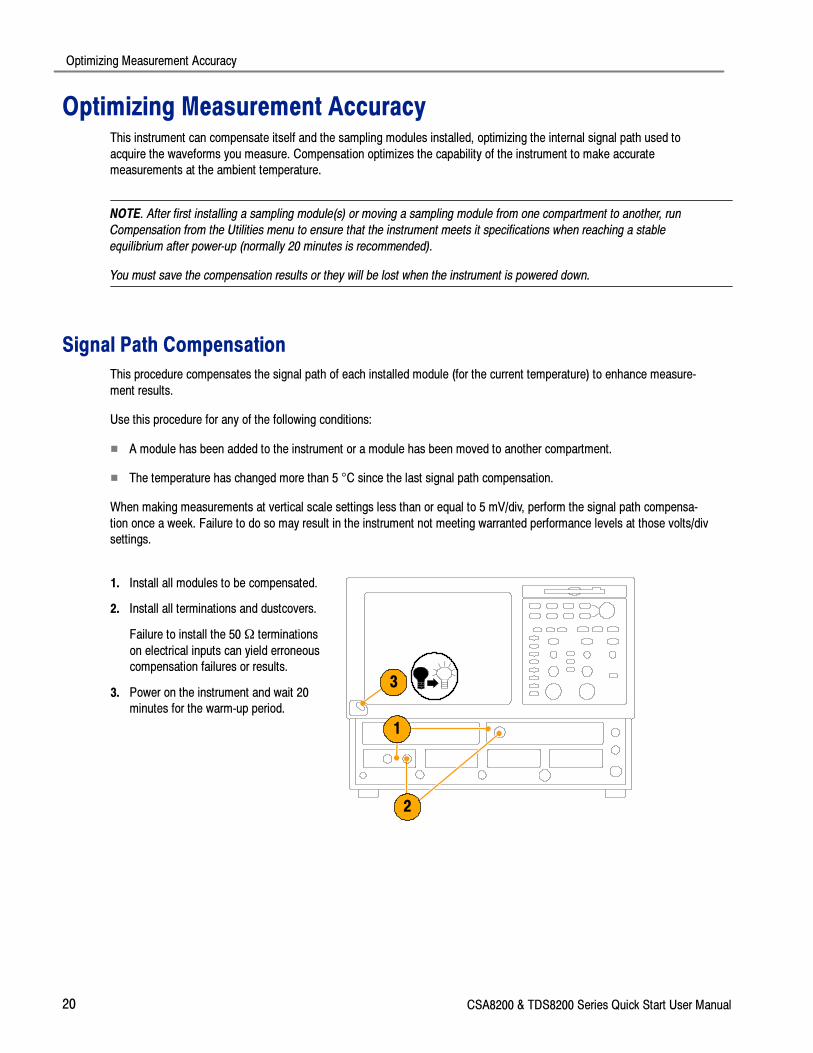
1. Install all modules to be compensated.
2. Install all terminations and dustcovers.
Failure to install the 50Ω terminations
on electrical inputs can yield erroneous
compensation failures or results.
3. Power on the instrument and wait 20
minutes for the warm-up period.
1
2
3
Optimizing Measurement Accuracy
CSA8200 & TDS8200 Series Quick Start User Manual 21
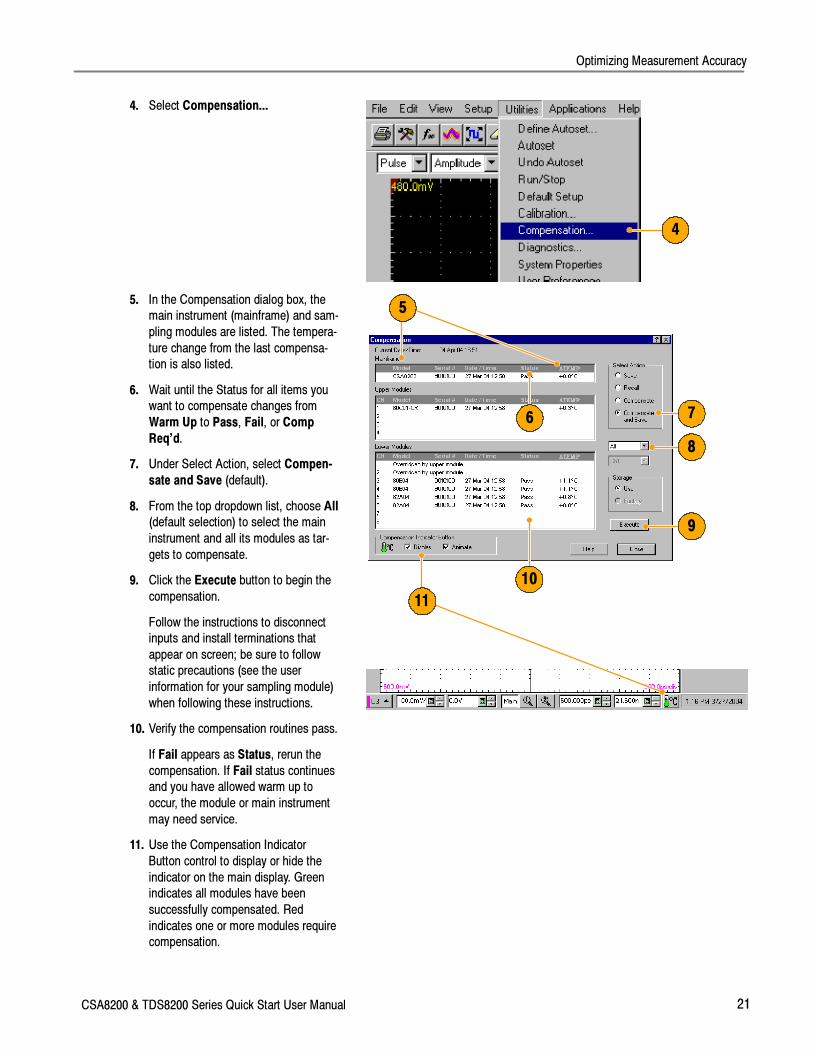
4. Select Compensation...
4
5. In the Compensation dialog box, the
main instrument (mainframe) and sam-
pling modules are listed. The tempera-
ture change from the last compensa-
tion is also listed.
6. Wait until the Status for all items you
want to compensate changes from
Warm Up to Pass, Fail, or Comp
Req’d.
7. Under Select Action, select Compen-
sate and Save (default).
8. From the top dropdown list, choose All
(default selection) to select the main
instrument and all its modules as tar-
gets to compensate.
9. Click the Execute button to begin the
compensation.
Follow the instructions to disconnect
inputs and install terminations that
appear on screen; be sure to follow
static precautions (see the user
information for your sampling module)
when following these instructions.
10. Verify the compensation routines pass.
If Fail appears as Status, rerun the
compensation. If Fail status continues
and you have allowed warm up to
occur, the module or main instrument
may need service.
11. Use the Compensation Indicator
Button control to display or hide the
indicator on the main display. Green
indicates all modules have been
successfully compensated. Red
indicates one or more modules require
compensation.
5
6 7
8
9
10
11
Optimizing Measurement Accuracy
22 CSA8200 & TDS8200 Series Quick Start User Manual
Perform Dark-Level and User Wavelength Gain Compensations
Performing a dark-level compensation maximizes the accuracy of the extinction ratio and other optical automatic
measurements you take. Performing a User Wavelength Gain compensation optimizes an optical channel for your custom
input signal.
NOTE. Dark-level compensation performs a subset of the module compensation process. It is designed to be fast so it can
be performed frequently, just before measurements are taken. This compensation is not saved and is only valid for the
selected bandwidth or filter path and the internal optical power meter.
You should perform the procedure Signal Path Compensation on page 20 to compensate all vertical bandwidth and filter
selections.
Use the following procedure to perform either compensation; this procedure applies only to optical modules.
1. Install at least one optical sampling
module in the instrument to be dark-
level calibrated. Set the acquisition
system to run continuously.
1
2. Use the Vertical buttons to select the
channel to be compensated.
2
3. From the application menu bar, click
Setup, and then click Vertical. 3

Optimizing Measurement Accuracy
CSA8200 & TDS8200 Series Quick Start User Manual 23
To run the Dark-Level compensation:
4. In Vert Setup dialog box, click the Dark
Level button under Compensation.
Follow the instructions on screen.
Repeat steps 2 and 4 for any addition-
al optical channels you want to
compensate.
4
To run the User Wavelength Gain compensa-
tion (for custom input signals):
5. Attach an optical signal, with a precise-
ly known amount of optical power, to
the optical module input.
Use an independently-calibrated
average optical power meter to
measure this power precisely. Then
connect the signal to the optical
module using the same fiber cables.
5
6. In Vert Setup dialog box, click the User
Wavelength Gain button under Com-
pensation. Follow the instructions on
screen.
7. In the User Wavelength Gain Com-
pensation dialog box, set the wave-
length and power of the signal to be
applied to the channel.
8. Press the OK button to execute the
compensation.
6
7
8
Acquisition
24 CSA8200 & TDS8200 Series Quick Start User Manual
AcquisitionThis section contains concepts of and procedures for using the acquisition system. Detailed information is available in the
online help.
Setting Up Signal Input
Use front-panel buttons to set up your instrument to acquire the signal.
CAUTION. Sampling modules are inherently vulnerable to static damage. Always observe static-safe procedures and
cautions as outlined in your sampling-module user manual.
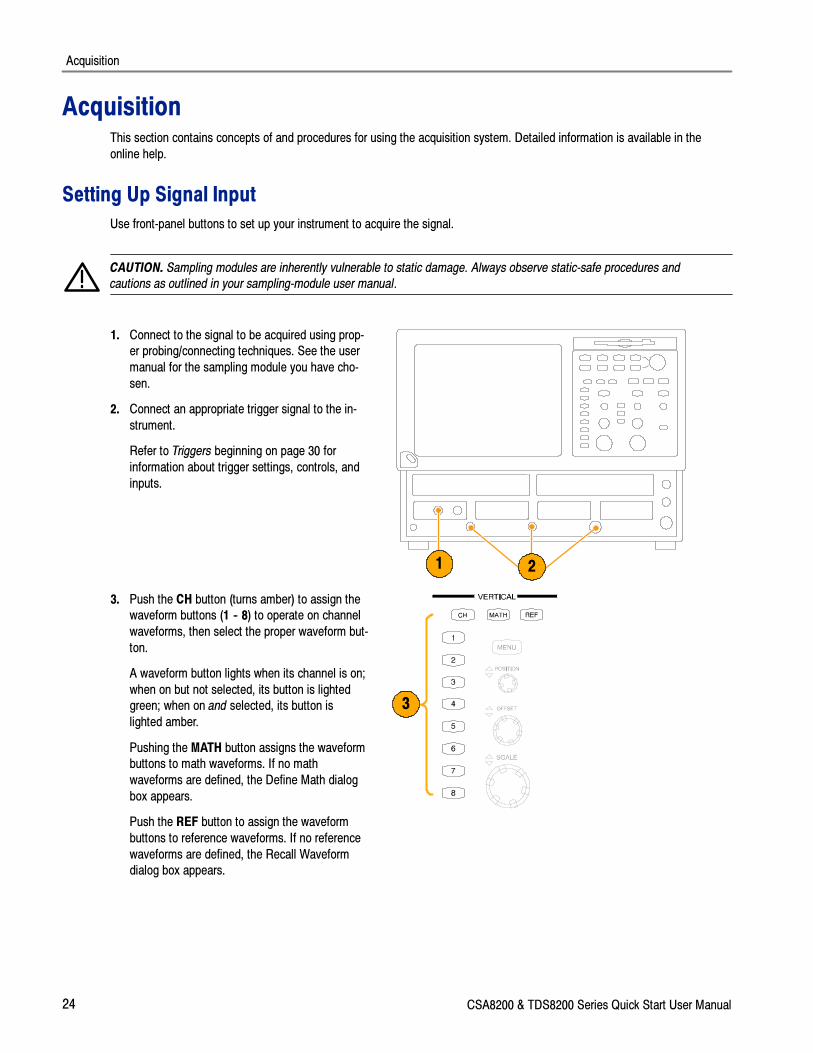
1. Connect to the signal to be acquired using prop-
er probing/connecting techniques. See the user
manual for the sampling module you have cho-
sen.
2. Connect an appropriate trigger signal to the in-
strument.
Refer to Triggers beginning on page 30 for
information about trigger settings, controls, and
inputs.
1 2
3. Push the CH button (turns amber) to assign the
waveform buttons (1 -- 8) to operate on channel
waveforms, then select the proper waveform but-
ton.
A waveform button lights when its channel is on;
when on but not selected, its button is lighted
green; when on and selected, its button is
lighted amber.
Pushing the MATH button assigns the waveform
buttons to math waveforms. If no math
waveforms are defined, the Define Math dialog
box appears.
Push the REF button to assign the waveform
buttons to reference waveforms. If no reference
waveforms are defined, the Recall Waveform
dialog box appears.
3
Acquisition
CSA8200 & TDS8200 Series Quick Start User Manual 25
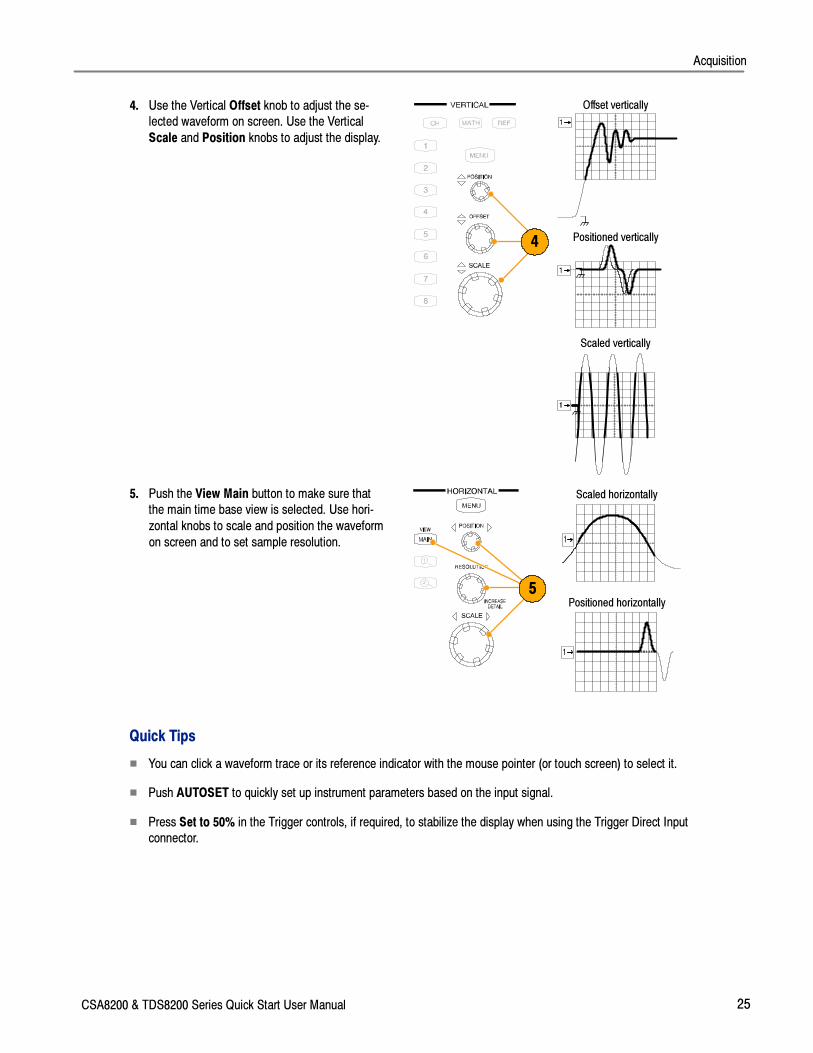
4. Use the Vertical Offset knob to adjust the se-
lected waveform on screen. Use the Vertical
Scale and Position knobs to adjust the display.
4 Positioned vertically
Offset vertically
Scaled vertically
5. Push the View Main button to make sure that
the main time base view is selected. Use hori-
zontal knobs to scale and position the waveform
on screen and to set sample resolution.
Scaled horizontally
Positioned horizontally5
Quick Tips
� You can click a waveform trace or its reference indicator with the mouse pointer (or touch screen) to select it.
� Push AUTOSET to quickly set up instrument parameters based on the input signal.
� Press Set to 50% in the Trigger controls, if required, to stabilize the display when using the Trigger Direct Input
connector.
Acquisition
26 CSA8200 & TDS8200 Series Quick Start User Manual
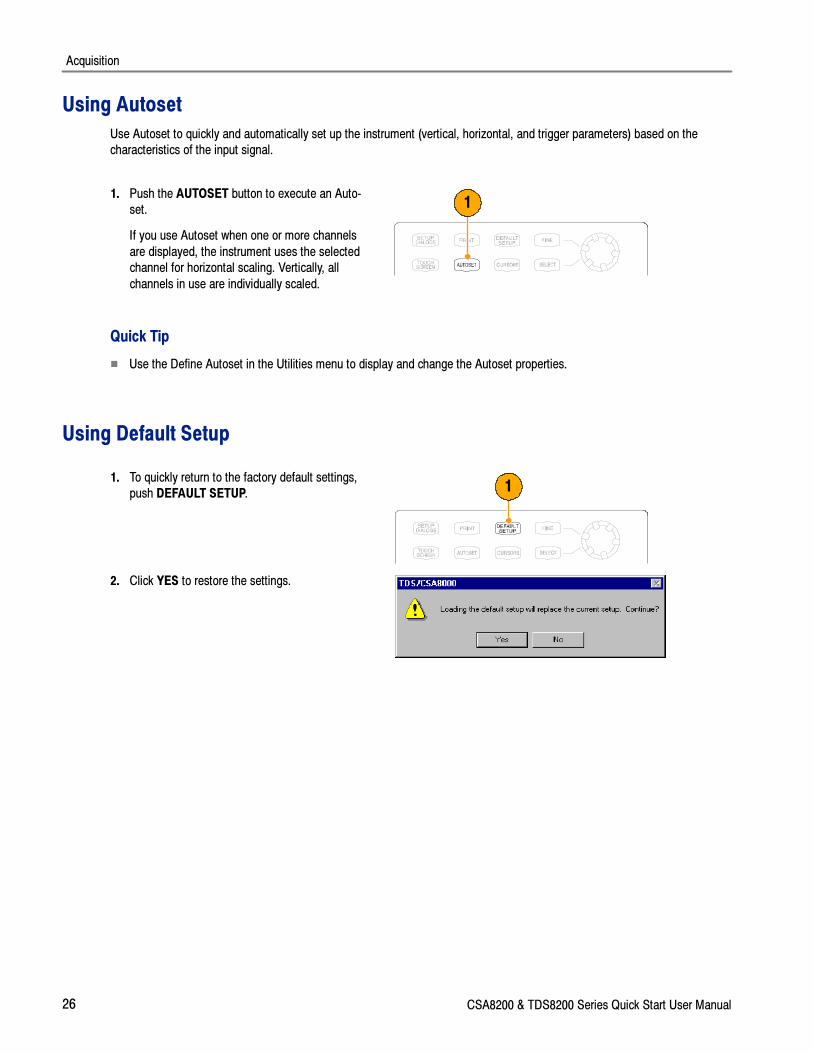
Using Autoset
Use Autoset to quickly and automatically set up the instrument (vertical, horizontal, and trigger parameters) based on the
characteristics of the input signal.
1. Push the AUTOSET button to execute an Auto-
set.
If you use Autoset when one or more channels
are displayed, the instrument uses the selected
channel for horizontal scaling. Vertically, all
channels in use are individually scaled.
1
Quick Tip
� Use the Define Autoset in the Utilities menu to display and change the Autoset properties.
Using Default Setup
1. To quickly return to the factory default settings,
push DEFAULT SETUP. 1
2. Click YES to restore the settings.
Acquisition
CSA8200 & TDS8200 Series Quick Start User Manual 27
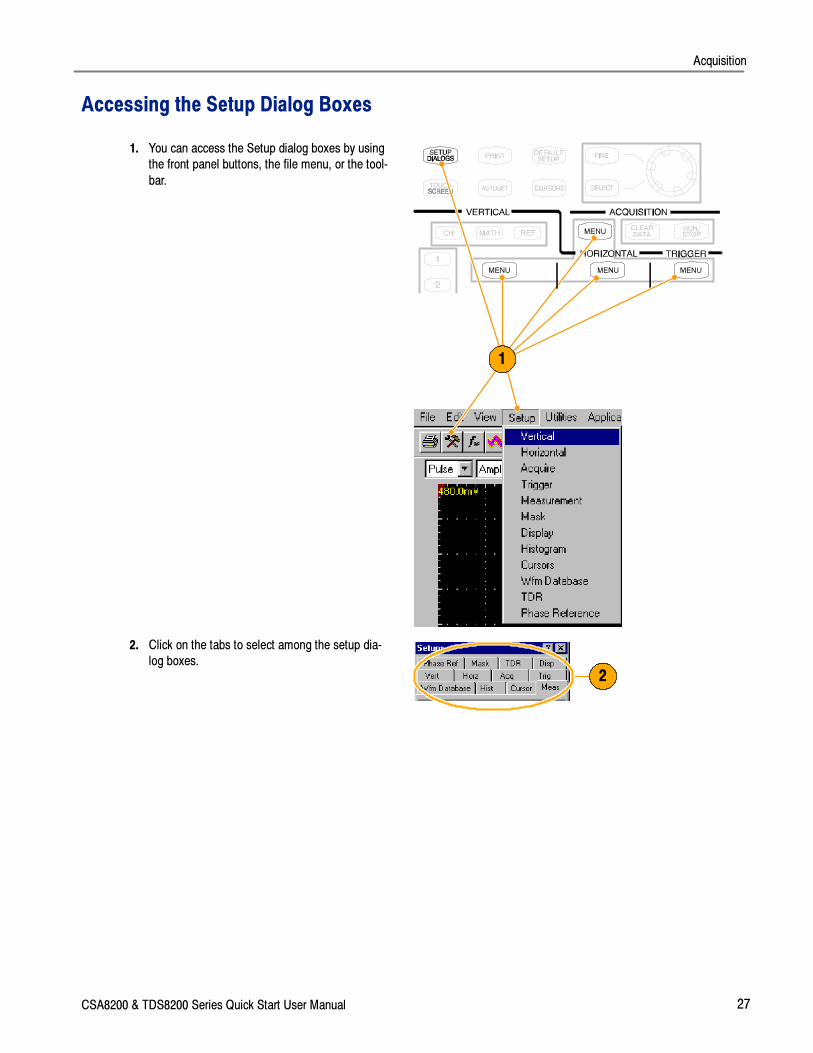
Accessing the Setup Dialog Boxes
1. You can access the Setup dialog boxes by using
the front panel buttons, the file menu, or the tool-
bar.
1
2. Click on the tabs to select among the setup dia-
log boxes.
2
Acquisition
28 CSA8200 & TDS8200 Series Quick Start User Manual
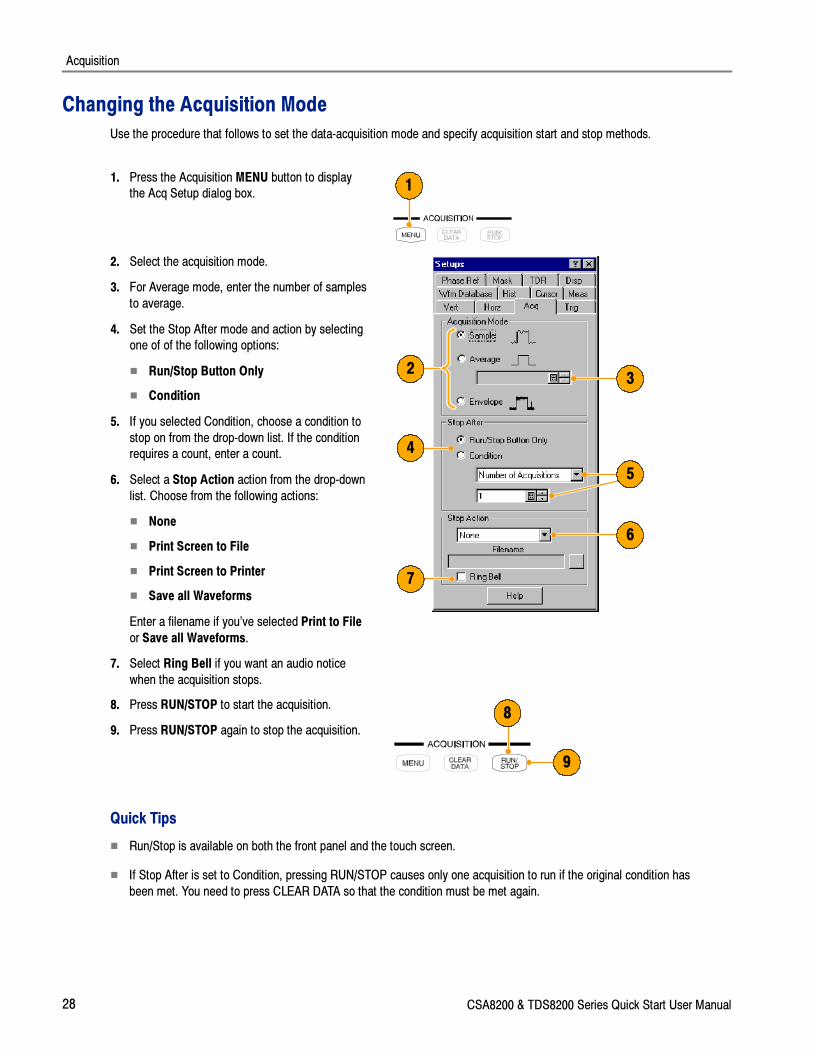
Changing the Acquisition Mode
Use the procedure that follows to set the data-acquisition mode and specify acquisition start and stop methods.
1. Press the Acquisition MENU button to display
the Acq Setup dialog box.1
2. Select the acquisition mode.
3. For Average mode, enter the number of samples
to average.
4. Set the Stop After mode and action by selecting
one of of the following options:
� Run/Stop Button Only
� Condition
5. If you selected Condition, choose a condition to
stop on from the drop-down list. If the condition
requires a count, enter a count.
6. Select a Stop Action action from the drop-down
list. Choose from the following actions:
� None
� Print Screen to File
� Print Screen to Printer
� Save all Waveforms
Enter a filename if you’ve selected Print to File
or Save all Waveforms.
7. Select Ring Bell if you want an audio notice
when the acquisition stops.
23
4
5
6
7
8. Press RUN/STOP to start the acquisition.
9. Press RUN/STOP again to stop the acquisition.
8
9
Quick Tips
� Run/Stop is available on both the front panel and the touch screen.
� If Stop After is set to Condition, pressing RUN/STOP causes only one acquisition to run if the original condition has
been met. You need to press CLEAR DATA so that the condition must be met again.
Acquisition
CSA8200 & TDS8200 Series Quick Start User Manual 29
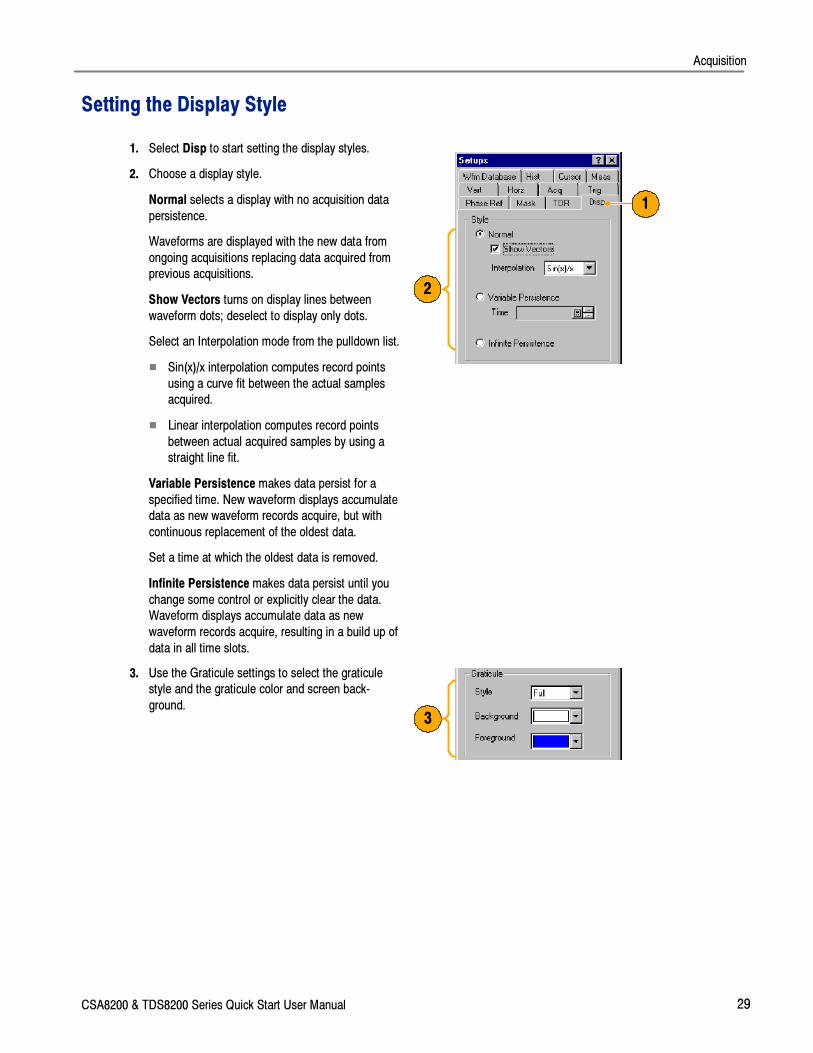
Setting the Display Style
1. Select Disp to start setting the display styles.
2. Choose a display style.
Normal selects a display with no acquisition data
persistence.
Waveforms are displayed with the new data from
ongoing acquisitions replacing data acquired from
previous acquisitions.
Show Vectors turns on display lines between
waveform dots; deselect to display only dots.
Select an Interpolation mode from the pulldown list.
� Sin(x)/x interpolation computes record points
using a curve fit between the actual samples
acquired.
� Linear interpolation computes record points
between actual acquired samples by using a
straight line fit.
Variable Persistence makes data persist for a
specified time. New waveform displays accumulate
data as new waveform records acquire, but with
continuous replacement of the oldest data.
Set a time at which the oldest data is removed.
Infinite Persistence makes data persist until you
change some control or explicitly clear the data.
Waveform displays accumulate data as new
waveform records acquire, resulting in a build up of
data in all time slots.
1
2
3. Use the Graticule settings to select the graticule
style and the graticule color and screen back-
ground.3
Triggers
30 CSA8200 & TDS8200 Series Quick Start User Manual
TriggersThis section contains concepts and procedures for using the trigger system. Detailed information is available in the online
help.
Triggering Concepts
Trigger Event
When a trigger event occurs, the instrument acquires a sample in the process of building a waveform record. The trigger
event establishes the time-zero point in the waveform record and all samples are measured with respect to that event. The
trigger event starts waveform acquisition. A trigger event occurs when the trigger source (the signal that the trigger circuit
monitors) passes through a specified voltage level in a specified direction (the trigger slope). When a trigger event occurs,
the instrument acquires one sample of the input signal. When the next trigger event occurs, the instrument acquires the
next sample. This process continues until the entire record is filled with acquired samples. Without a trigger, the instrument
does not acquire any samples. This behavior differs from that of real-time acquisition systems, which can acquire a
complete waveform record from a single trigger event.
Trigger Type
This instrument supports edge triggering only, in which edge triggers gate a series of acquisitions. The slope control
determines whether the instrument recognizes the trigger point on the rising or the falling edge of a signal. You can set the
trigger slope from the toolbar at the top of the display or in the Trigger Setup dialog box. The level control determines
where on that edge the trigger point occurs. You can set the trigger level from the front panel with the Trigger LEVEL knob.
The slope and level controls apply only when the trigger source is set to External Direct (using the TRIGGER DIRECT
INPUT connector).
Trigger Modes
The trigger modes control the behavior of the instrument when not triggered:
Normal mode sets the instrument to acquire a waveform only when triggered. Normal mode does not acquire data if
triggering stops; the last waveform records acquired remains “frozen” on the display (if the channels containing them are
displayed). If no last waveform exists, none is displayed.
Auto mode sets the instrument to acquire a waveform even if a trigger event does not occur. Auto mode uses a timer that
starts after trigger rearm. If the trigger circuit does not detect a trigger before this timeout (about 100 ms), it auto triggers,
forcing enough trigger events to acquire all active channels. In the case of repetitive acquisitions in automatic trigger
mode, waveform samples are acquired, but at different places in the data stream (synchronization is lost). If you do not
apply a signal to any displayed channel, a baseline is displayed for that channel.
Trigger Sources
The trigger source provides the signal that the trigger system monitors. The source can be:
� The internal clock of the instrument (TDR clock rate), with user-selectable clock frequencies. The INTERNAL CLOCK
OUTPUT connector supplies a replica of the internal clock at the instrument front panel.
Triggers
CSA8200 & TDS8200 Series Quick Start User Manual 31
� An external signal coupled to one of the trigger input connectors on the front panel.
� External Direct, DC coupled and usable with signals up to at least 3.0 GHz
� External Prescale, divided by 16 and usable with signals from 2.0 GHz up to at least 12.5 GHz
� An internal clock-recovery trigger provided by an optical sampling module equipped with a clock-recovery option or a
dedicated electrical clock recovery module. Clock recovery is user-selectable for triggering rates that depend on the
sampling module used; for example, either 622 Mbps (OC-12/STM-4 standards) or 2.488 Gbps (OC-48/STM-16
standards) for the 80C01-CR Optical Sampling Module.
� A pattern (frame) trigger provided by a PatternSync trigger module such as the 80A06 PatternSync Trigger Module.
The output of the pattern sync trigger module must be connected to the EXTERNAL DIRECT TRIGGER INPUT
connector on the front panel.
Use a trigger source that is synchronized with the signal you are sampling and displaying. Selection of your trigger source
depends on your application, as shown in Table 1.
Table 1: Application-based triggering
Application Source to use
Communications (optical) serial NRZ datasignals
Set source to Clock Recovery, set the clock-recovery type, and use an opticalsampling module equipped with a clock-recovery option supporting the specificdata rate of the serial optical signal.
The available clock recovery rates depend on the sampling module installed.
TDR measurement using an electricalsampling module equipped with TDR
Set source to Internal Clock to use the internal clock of the instrument (TDRclock), and select the appropriate clock frequency. Disconnect any signalconnected to the External 10 MHz Reference Input when using the Internal clock.
Measurements on systems with a synchro-nized pretrigger signal
Set source to External Direct or External Prescaler as appropriate and connectthe pretrigger signal.
Any application requiring that the inputsignal provide the trigger
Set source to External Direct or External Prescaler as appropriate. Use a signalsplitter or power divider to couple to both the Ext Direct or Prescaler input andthe input channel, so that the sampled signal is also the trigger signal.
Any application requiring that you probethe trigger source
Set source to External Direct and use a Tektronix probe.
Any application requiring that you performspecial measurements using gated trigger
Set source to External Direct, select Gated Trigger, and use a TTL connection totrigger gate.
Trigger Source Connectors
External triggers can be connected to either the TRIGGER DIRECT INPUT or TRIGGER PRESCALE INPUT connectors
on the front panel:
� Signals connected to the PRESCALE connector are divided by eight and then fed to the trigger circuits.
� Signals connected to the DIRECT connector are fed directly to the trigger circuitry. The signal is DC coupled and can
be up to 3.0 GHz.
Triggers
32 CSA8200 & TDS8200 Series Quick Start User Manual
When using a given trigger source, disconnect any other trigger source from the front panel to ensure specified
performance. Specifically:
� Do not connect a signal to the TRIGGER DIRECT or TRIGGER PRESCALE front-panel connector unless you’ve
selected that input as the trigger source in the Trigger setup dialog box.
� Do not connect a signal to the External 10 MHz Reference front-panel connector unless you have selected that input
as the timebase mode in the Horizontal setup dialog box.
Gated Trigger Connector (Option GT Equipped)
You can attach a BNC cable to the External Gate input at rear panel (TTL connection) to selectively exclude data from
acquisition by means of gating the trigger on and off. Several conditions must be met to get a stable display of waveform
data:
� The channel and trigger must be otherwise triggerable without the trigger gate.
� The gating signal must be at a TTL high.
� The triggering system must be enabled and the instrument will acquire.
Enhanced Triggering
These features can help stabilize triggering and perform special measurements:
� High Frequency Triggering. High Frequency triggering increases trigger sensitivity of the trigger circuit by decreasing
hysteresis (a transition or noise band), allowing triggering on higher frequency signals.
� Gated Triggering. Gated triggering takes the trigger and the External Gate input and applies them to the instrument
through what is in effect an AND function. Gated triggering can be used for applications such as simulations of
undersea communication fibers where test fixtures are used to repeat the test signal through a short loop of cable to
simulate traveling longer distances. The trigger gate can be used to ignore triggers until the signal has traversed the
loop many times.
Trigger Holdoff
Trigger holdoff can help stabilize triggering. When you adjust holdoff, the instrument changes the time it waits before
rearming its trigger circuit after acquiring a sample. Before rearming, trigger circuitry cannot recognize when the next
trigger conditions are satisfied and cannot generate the next trigger event. When the instrument is triggering on undesired
events, you can adjust holdoff to obtain stable triggering.
Triggers
CSA8200 & TDS8200 Series Quick Start User Manual 33
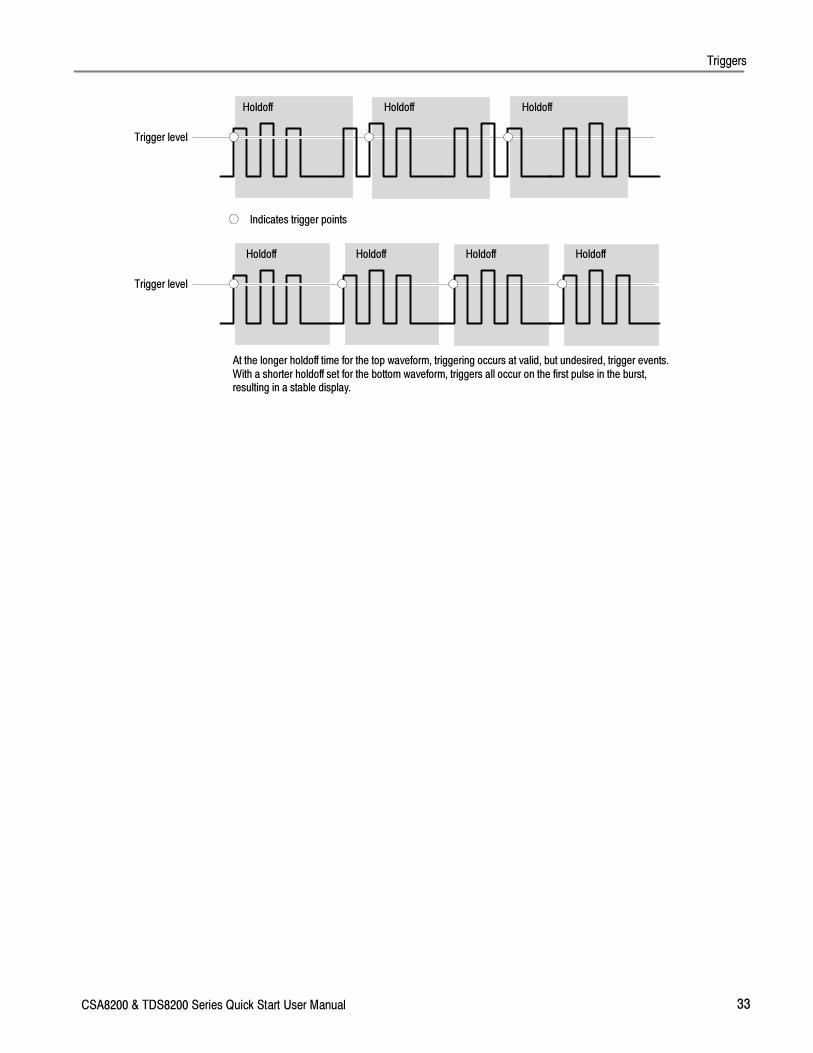
Indicates trigger points
Trigger level
At the longer holdoff time for the top waveform, triggering occurs at valid, but undesired, trigger events.With a shorter holdoff set for the bottom waveform, triggers all occur on the first pulse in the burst,resulting in a stable display.
Holdoff Holdoff Holdoff
Trigger level
Holdoff Holdoff Holdoff Holdoff
Triggers
34 CSA8200 & TDS8200 Series Quick Start User Manual
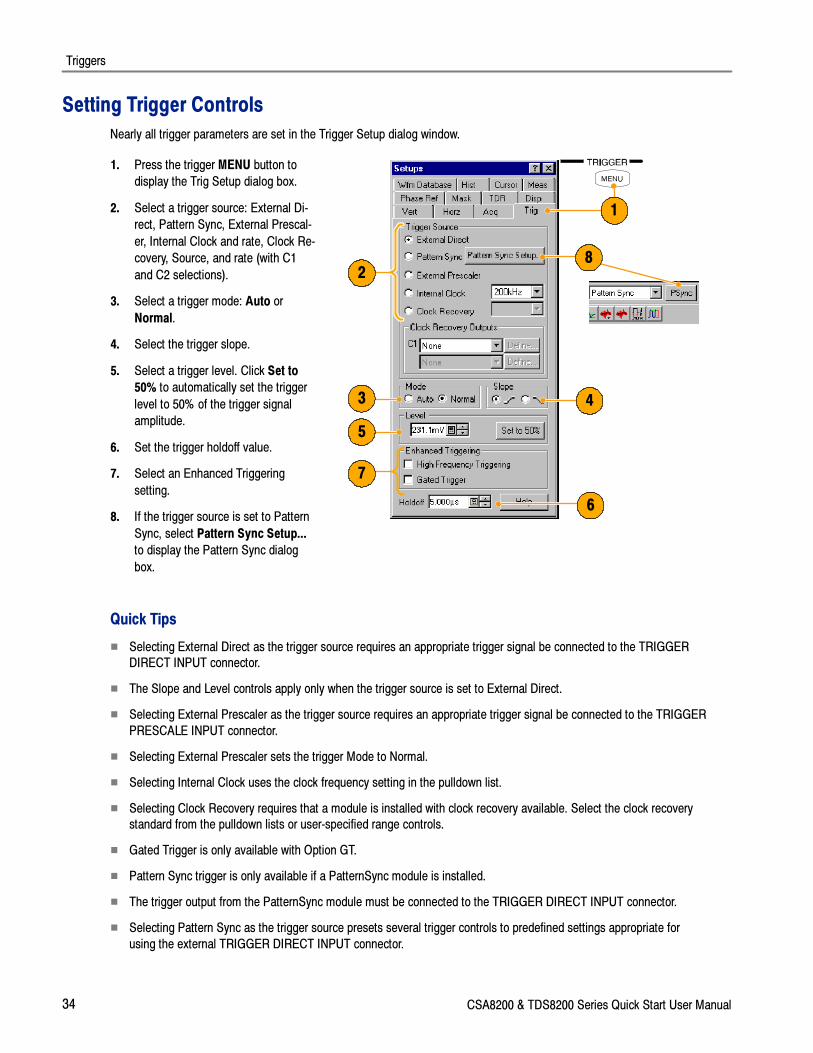
Setting Trigger Controls
Nearly all trigger parameters are set in the Trigger Setup dialog window.
1. Press the trigger MENU button to
display the Trig Setup dialog box.
2. Select a trigger source: External Di-
rect, Pattern Sync, External Prescal-
er, Internal Clock and rate, Clock Re-
covery, Source, and rate (with C1
and C2 selections).
3. Select a trigger mode: Auto or
Normal.
4. Select the trigger slope.
5. Select a trigger level. Click Set to
50% to automatically set the trigger
level to 50% of the trigger signal
amplitude.
6. Set the trigger holdoff value.
7. Select an Enhanced Triggering
setting.
8. If the trigger source is set to Pattern
Sync, select Pattern Sync Setup...
to display the Pattern Sync dialog
box.
1
2
3 4
5
6
7
8
Quick Tips
� Selecting External Direct as the trigger source requires an appropriate trigger signal be connected to the TRIGGER
DIRECT INPUT connector.
� The Slope and Level controls apply only when the trigger source is set to External Direct.
� Selecting External Prescaler as the trigger source requires an appropriate trigger signal be connected to the TRIGGER
PRESCALE INPUT connector.
� Selecting External Prescaler sets the trigger Mode to Normal.
� Selecting Internal Clock uses the clock frequency setting in the pulldown list.
� Selecting Clock Recovery requires that a module is installed with clock recovery available. Select the clock recovery
standard from the pulldown lists or user-specified range controls.
� Gated Trigger is only available with Option GT.
� Pattern Sync trigger is only available if a PatternSync module is installed.
� The trigger output from the PatternSync module must be connected to the TRIGGER DIRECT INPUT connector.
� Selecting Pattern Sync as the trigger source presets several trigger controls to predefined settings appropriate for
using the external TRIGGER DIRECT INPUT connector.
Triggers
CSA8200 & TDS8200 Series Quick Start User Manual 35
Setting Pattern Sync Controls
The Pattern Sync dialog box can be displayed when Pattern Sync is the selected triggering source.
1. Select the parameters for the pattern
sync module.
� Select the channel Source where
the pattern sync module is
installed.
� Select the Data Rate (bit rate)
(default is 2.48832 Gbps).
� Select the Pattern Length (default
is 127).
� Select a Data:Clock Ratio
(data-to-clock ratio) (default is 1:1).
� Select a Relative Trigger Bit (in the
range of 0 to Pattern Length--1)
(default is 0).
2. Use the AutoSync feature to auto-
matically detect the data rate, pattern
length and/or data-to-clock ratio of
the applied data and clock signals
(data to a sampling module channel
and the clock to the Pattern Sync
module).
3. Enable FrameScan to to automatical-
ly scan through a pattern (or part of
the pattern).
The FrameScan control is tied to the
FrameScan control in the Horizontal
Setup dialog box (changing either
one affects the other).
1
2
3
Quick Tips
� All pattern sync controls are disabled (grayed out) if there are no available pattern sync sources.
� The default selected pattern sync source is the lowest-numbered pattern sync module.
� The Data Rate in the Pattern Sync dialog box is tied to the Bit Rate control in the Horizontal setup dialog box
(changing either one affects the other).
� If the entered Data Rate does not match the rate of the selected communication standard in the Horizontal Setup, then
the communication standard is changed to “User”.
� Using the PatternSync Trigger module in conjunction with FrameScan can improve both acquisition throughput and
timing accuracy.
Triggers
36 CSA8200 & TDS8200 Series Quick Start User Manual
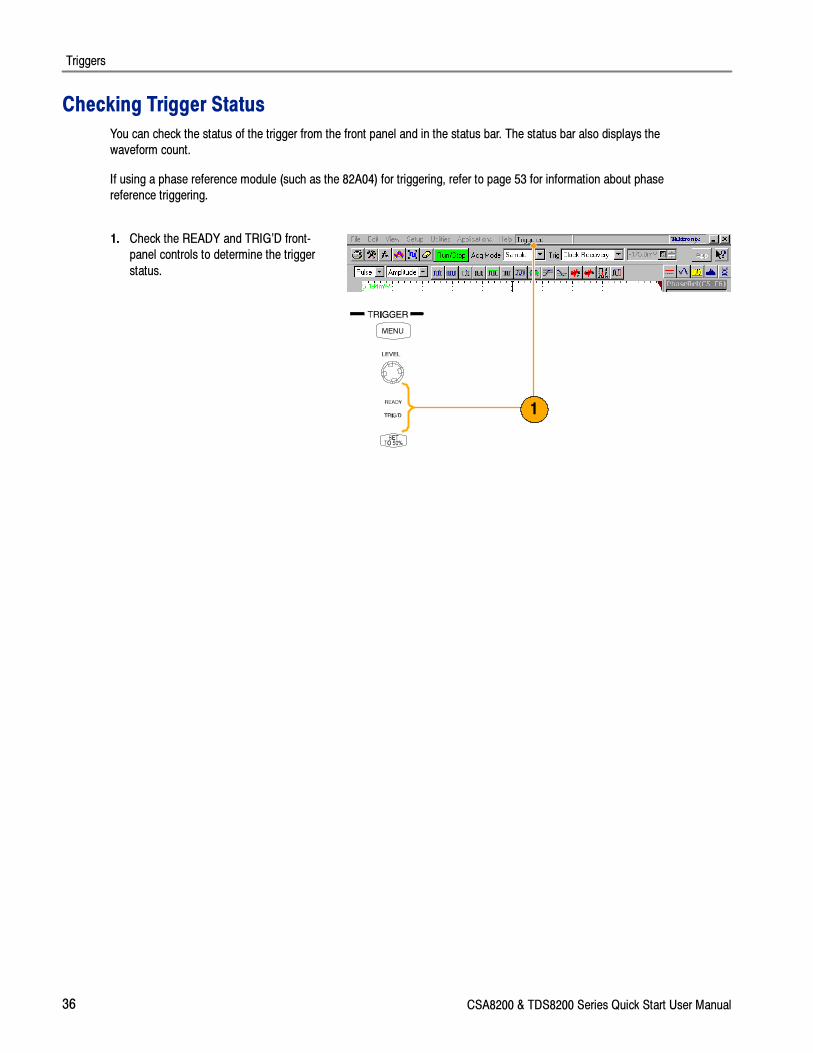
Checking Trigger Status
You can check the status of the trigger from the front panel and in the status bar. The status bar also displays the
waveform count.
If using a phase reference module (such as the 82A04) for triggering, refer to page 53 for information about phase
reference triggering.
1. Check the READY and TRIG’D front-
panel controls to determine the trigger
status.
1
Analyzing Waveforms
CSA8200 & TDS8200 Series Quick Start User Manual 37
Analyzing WaveformsYour instrument features cursors, automatic measurements, statistics, histograms, and math to assist you in analyzing
waveforms. This section contains concepts and procedures for analyzing waveforms. Detailed information is available in
the online help.
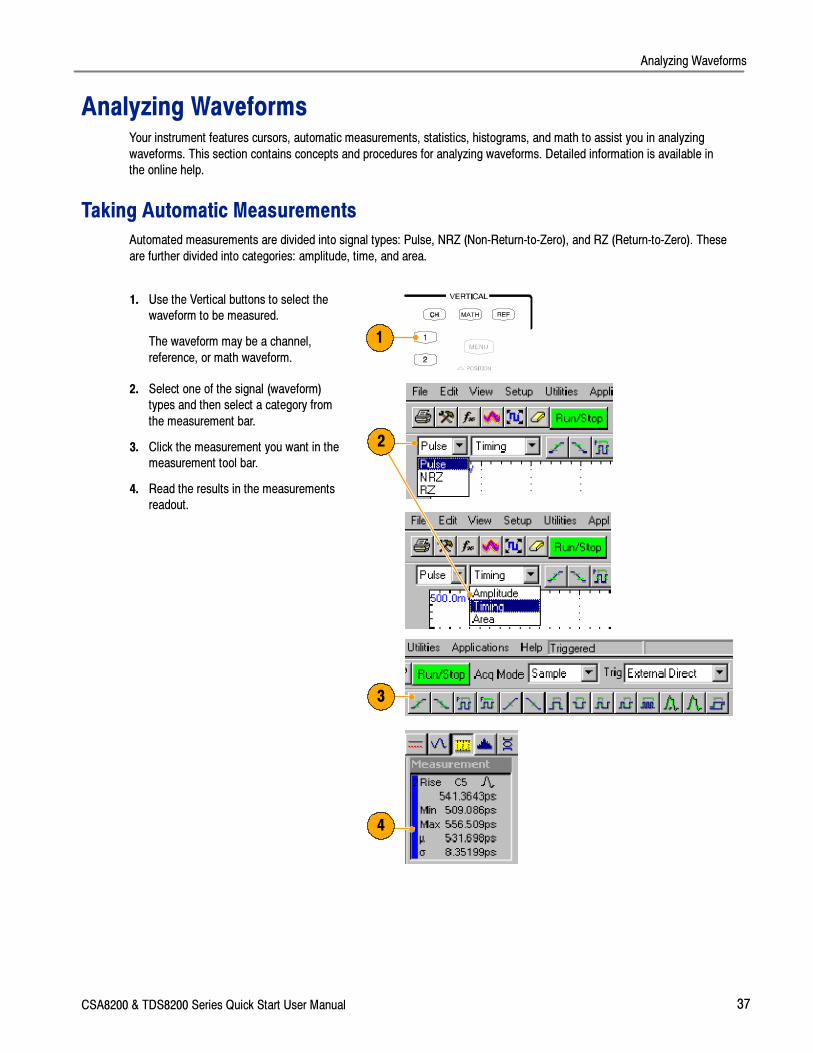
Taking Automatic Measurements
Automated measurements are divided into signal types: Pulse, NRZ (Non-Return-to-Zero), and RZ (Return-to-Zero). These
are further divided into categories: amplitude, time, and area.
1. Use the Vertical buttons to select the
waveform to be measured.
The waveform may be a channel,
reference, or math waveform.
1
2. Select one of the signal (waveform)
types and then select a category from
the measurement bar.
3. Click the measurement you want in the
measurement tool bar.
4. Read the results in the measurements
readout.
2
3
4
Analyzing Waveforms
38 CSA8200 & TDS8200 Series Quick Start User Manual
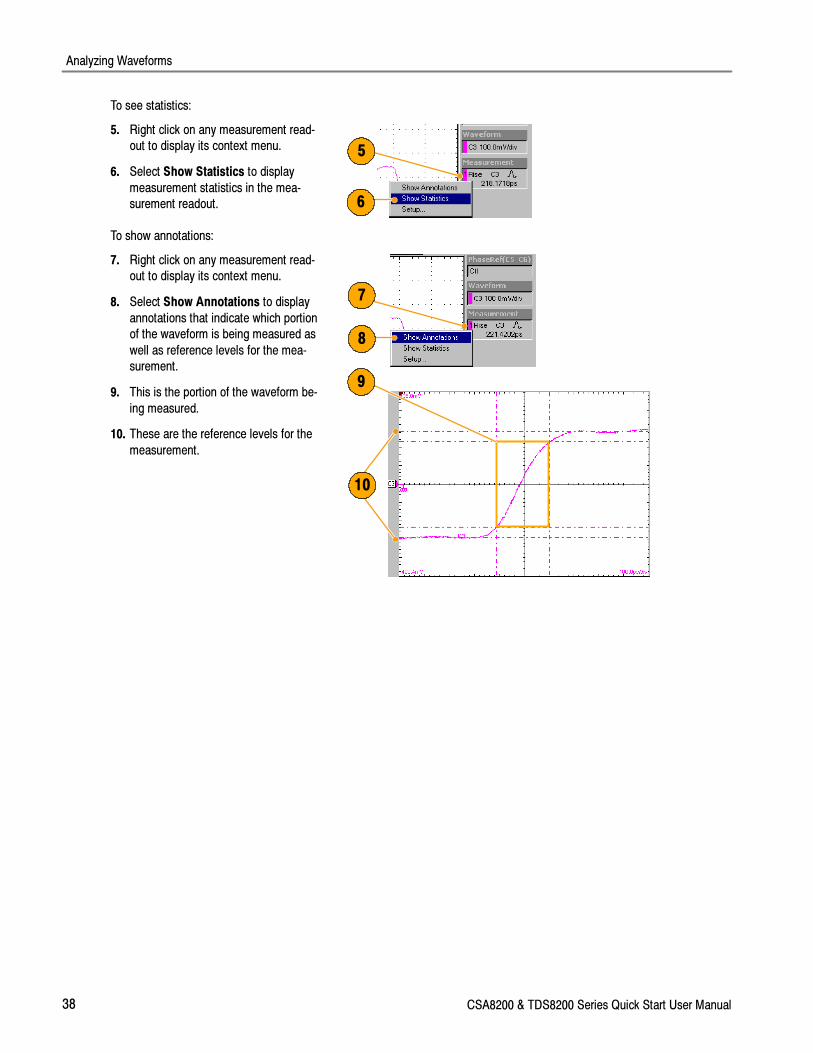
To see statistics:
5. Right click on any measurement read-
out to display its context menu.
6. Select Show Statistics to display
measurement statistics in the mea-
surement readout.
5
6
To show annotations:
7. Right click on any measurement read-
out to display its context menu.
8. Select Show Annotations to display
annotations that indicate which portion
of the waveform is being measured as
well as reference levels for the mea-
surement.
9. This is the portion of the waveform be-
ing measured.
10. These are the reference levels for the
measurement.
7
8
9
10
Analyzing Waveforms
CSA8200 & TDS8200 Series Quick Start User Manual 39
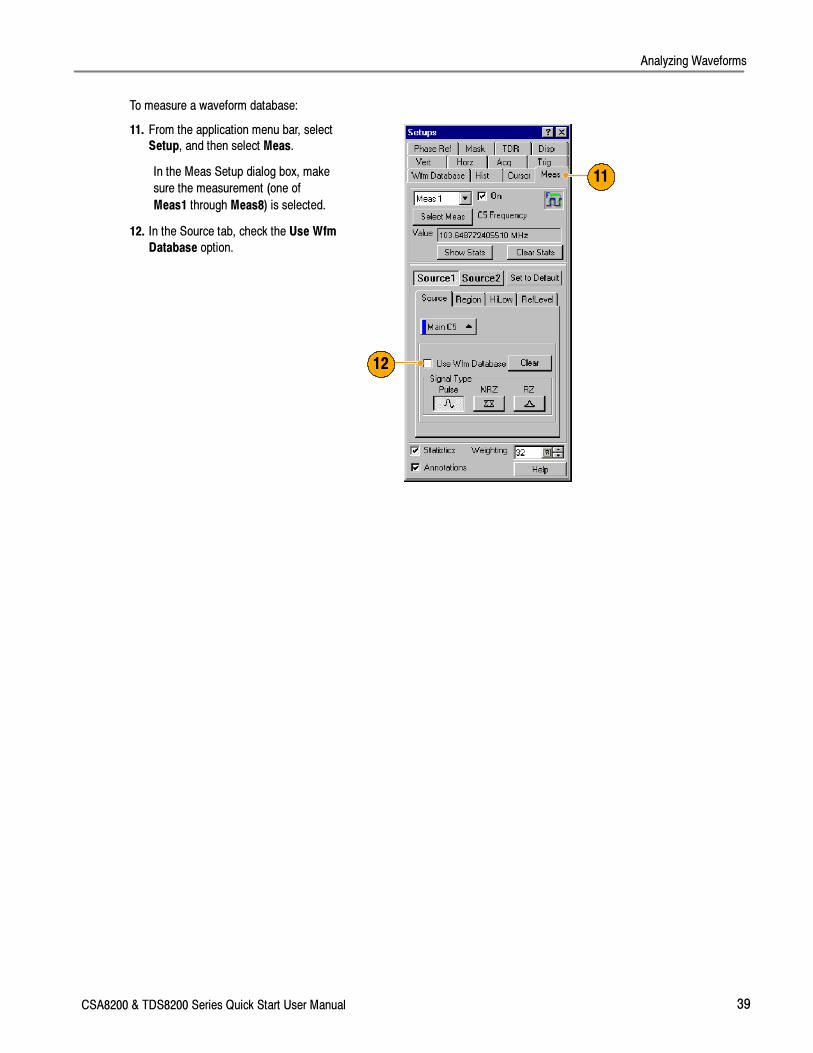
To measure a waveform database:
11. From the application menu bar, select
Setup, and then select Meas.
In the Meas Setup dialog box, make
sure the measurement (one of
Meas1 through Meas8) is selected.
12. In the Source tab, check the Use Wfm
Database option.
11
12
Analyzing Waveforms
40 CSA8200 & TDS8200 Series Quick Start User Manual
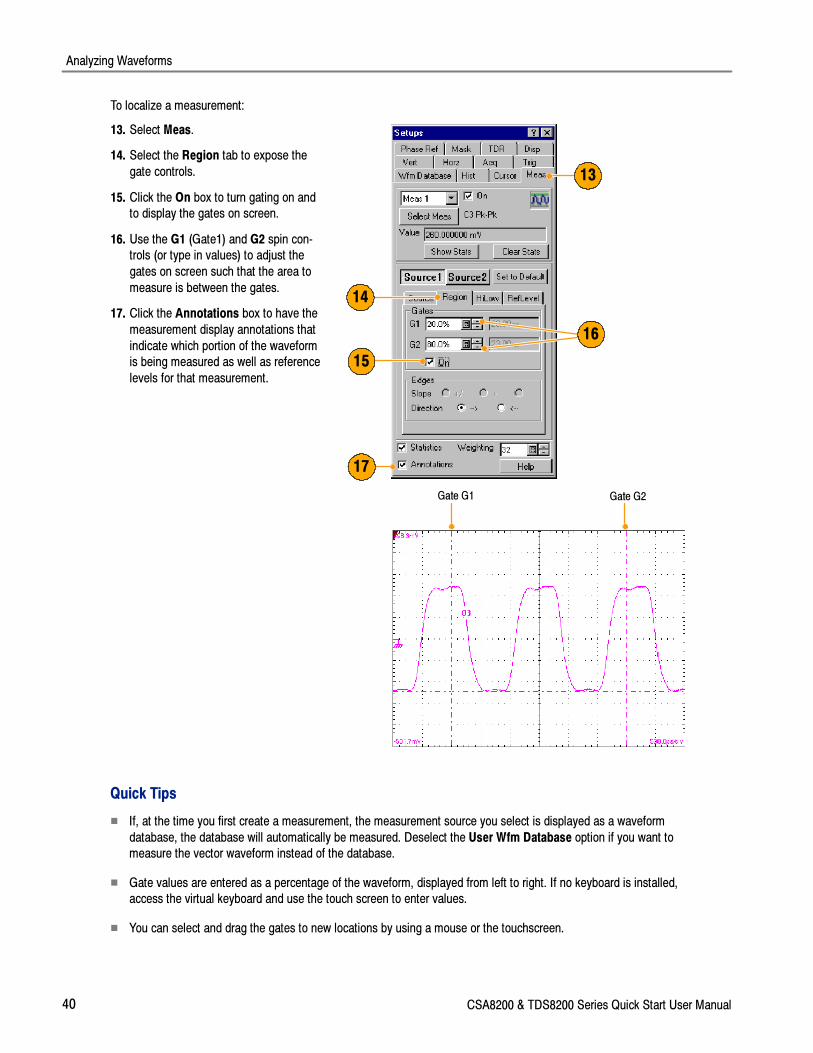
To localize a measurement:
13. Select Meas.
14. Select the Region tab to expose the
gate controls.
15. Click the On box to turn gating on and
to display the gates on screen.
16. Use the G1 (Gate1) and G2 spin con-
trols (or type in values) to adjust the
gates on screen such that the area to
measure is between the gates.
17. Click the Annotations box to have the
measurement display annotations that
indicate which portion of the waveform
is being measured as well as reference
levels for that measurement.
13
14
15
16
Gate G1 Gate G2
17
Quick Tips
� If, at the time you first create a measurement, the measurement source you select is displayed as a waveform
database, the database will automatically be measured. Deselect the User Wfm Database option if you want to
measure the vector waveform instead of the database.
� Gate values are entered as a percentage of the waveform, displayed from left to right. If no keyboard is installed,
access the virtual keyboard and use the touch screen to enter values.
� You can select and drag the gates to new locations by using a mouse or the touchscreen.
Analyzing Waveforms
CSA8200 & TDS8200 Series Quick Start User Manual 41
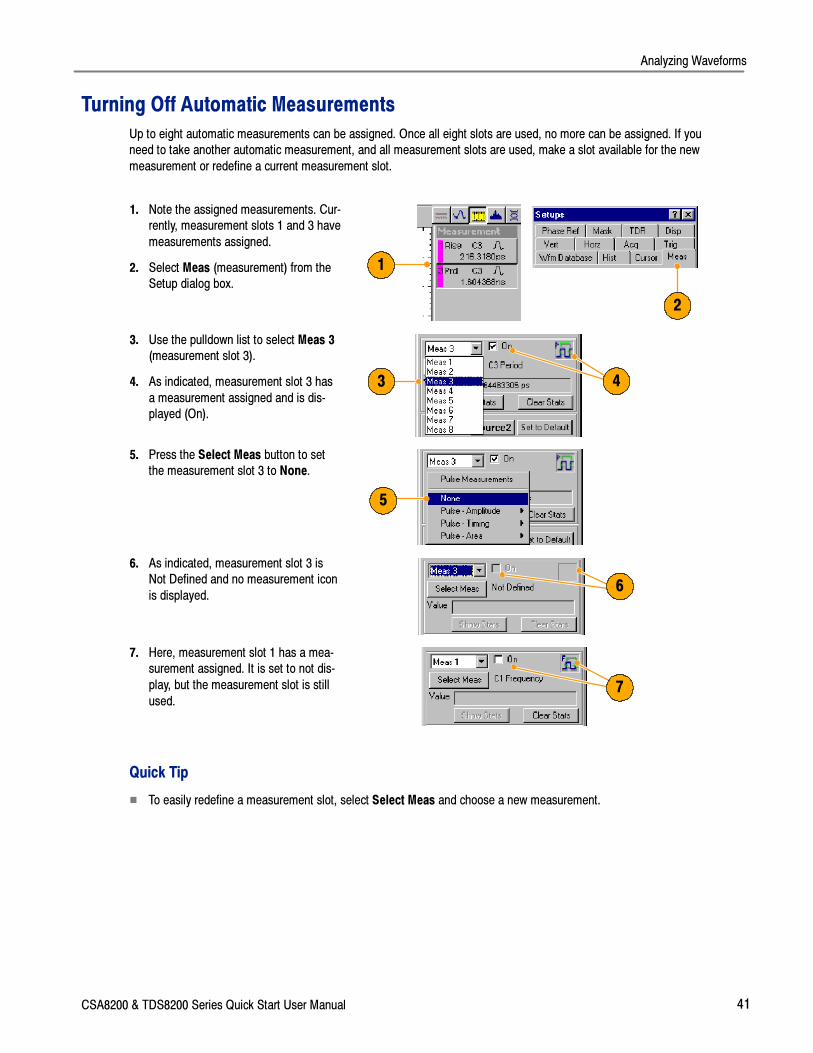
Turning Off Automatic Measurements
Up to eight automatic measurements can be assigned. Once all eight slots are used, no more can be assigned. If you
need to take another automatic measurement, and all measurement slots are used, make a slot available for the new
measurement or redefine a current measurement slot.
1. Note the assigned measurements. Cur-
rently, measurement slots 1 and 3 have
measurements assigned.
2. Select Meas (measurement) from the
Setup dialog box.
1
2
3. Use the pulldown list to select Meas 3
(measurement slot 3).
4. As indicated, measurement slot 3 has
a measurement assigned and is dis-
played (On).
3 4
5. Press the Select Meas button to set
the measurement slot 3 to None.
5
6. As indicated, measurement slot 3 is
Not Defined and no measurement icon
is displayed.6
7. Here, measurement slot 1 has a mea-
surement assigned. It is set to not dis-
play, but the measurement slot is still
used.7
Quick Tip
� To easily redefine a measurement slot, select Select Meas and choose a new measurement.

Analyzing Waveforms
42 CSA8200 & TDS8200 Series Quick Start User Manual
Cursor Measurements
Use cursors to measure amplitude and time quickly and with more accuracy than when using the graticule to take
measurements. Because you position cursors wherever you want on the waveform, they are easier to localize to a
waveform segment or feature than automatic measurements.
1. Press the CURSORS button:
once for Vertical Bars
twice for Horizontal Bars
three times for waveform cursors.
Cursor selection is also available
from the Setup menu.
2. Press the SELECT button to toggle
selection between the two cursors. The
active cursor is represented by a solid
line.
3. Turn the General Purpose knob to
position each cursor on the waveform
to measure the feature that interests
you.
1 2 3
4. Vertical bars (V Bars) measure
horizontal parameters.4
5. Horizontal bars (H Bars) measure
amplitude parameters.
5
Analyzing Waveforms
CSA8200 & TDS8200 Series Quick Start User Manual 43
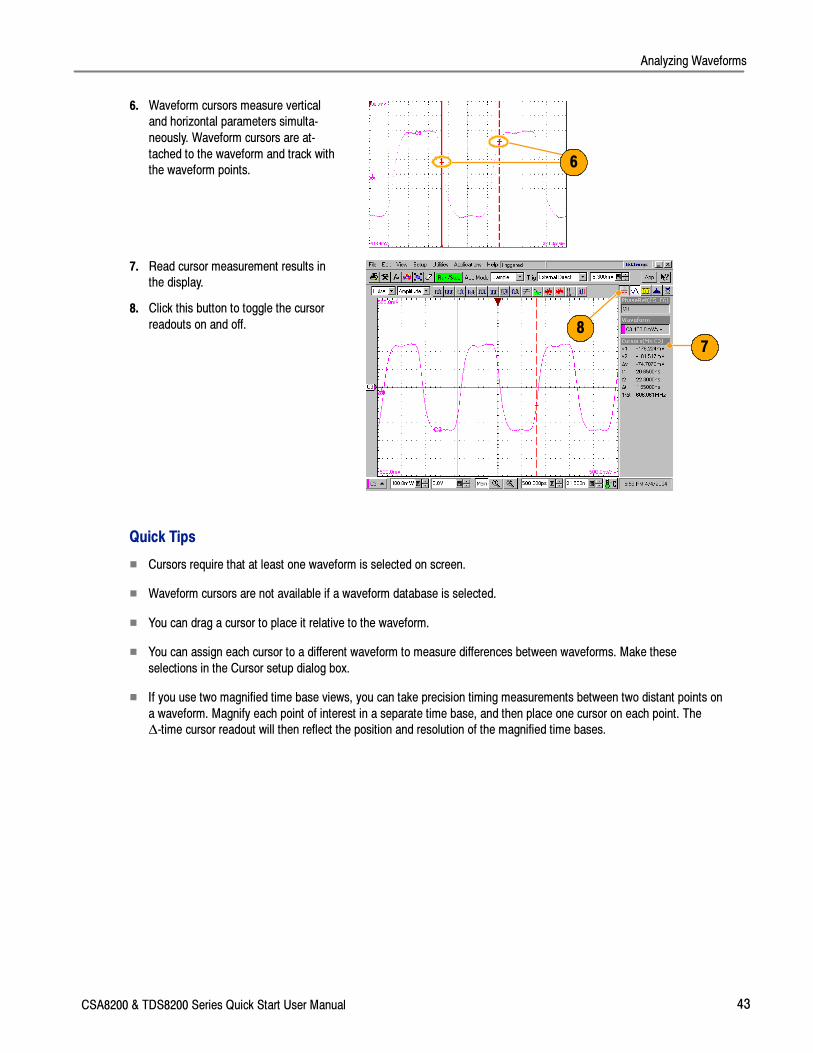
6. Waveform cursors measure vertical
and horizontal parameters simulta-
neously. Waveform cursors are at-
tached to the waveform and track with
the waveform points.6
7. Read cursor measurement results in
the display.
8. Click this button to toggle the cursor
readouts on and off.
7
8
Quick Tips
� Cursors require that at least one waveform is selected on screen.
� Waveform cursors are not available if a waveform database is selected.
� You can drag a cursor to place it relative to the waveform.
� You can assign each cursor to a different waveform to measure differences between waveforms. Make these
selections in the Cursor setup dialog box.
� If you use two magnified time base views, you can take precision timing measurements between two distant points on
a waveform. Magnify each point of interest in a separate time base, and then place one cursor on each point. The
Δ-time cursor readout will then reflect the position and resolution of the magnified time bases.
Analyzing Waveforms
44 CSA8200 & TDS8200 Series Quick Start User Manual
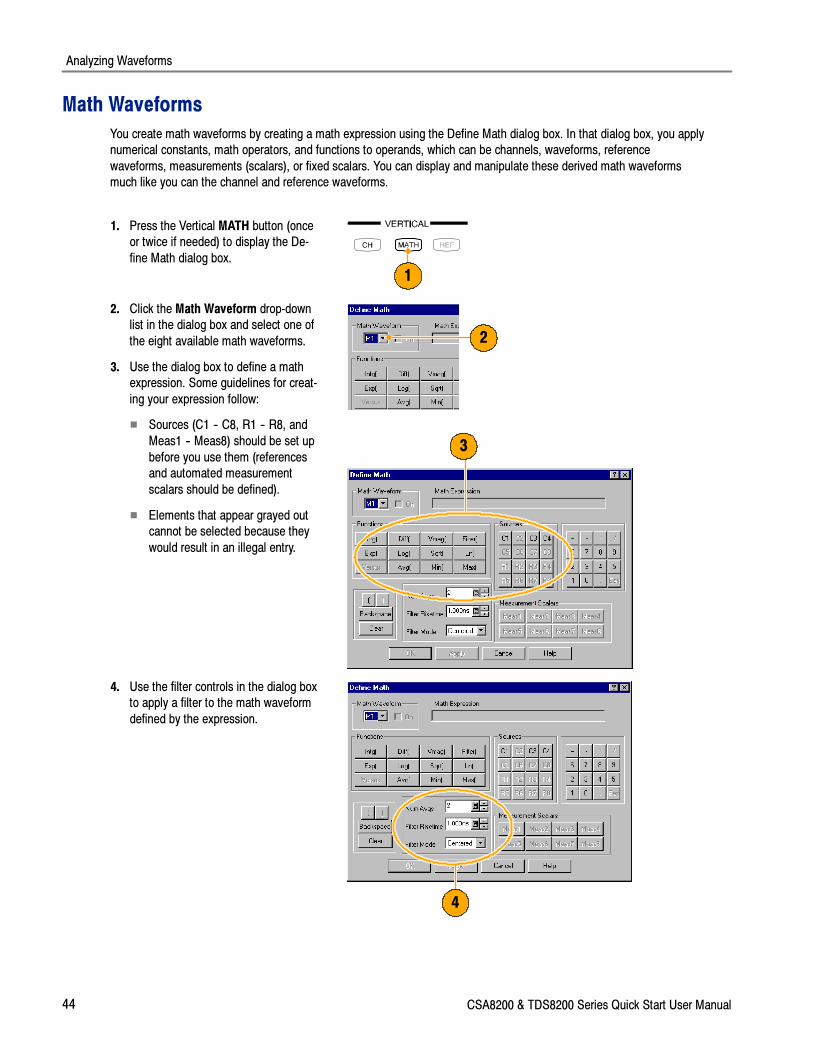
Math Waveforms
You create math waveforms by creating a math expression using the Define Math dialog box. In that dialog box, you apply
numerical constants, math operators, and functions to operands, which can be channels, waveforms, reference
waveforms, measurements (scalars), or fixed scalars. You can display and manipulate these derived math waveforms
much like you can the channel and reference waveforms.
1. Press the Vertical MATH button (once
or twice if needed) to display the De-
fine Math dialog box.
1
2. Click the Math Waveform drop-down
list in the dialog box and select one of
the eight available math waveforms.
3. Use the dialog box to define a math
expression. Some guidelines for creat-
ing your expression follow:
� Sources (C1 -- C8, R1 -- R8, and
Meas1 -- Meas8) should be set up
before you use them (references
and automated measurement
scalars should be defined).
� Elements that appear grayed out
cannot be selected because they
would result in an illegal entry.
2
3
4. Use the filter controls in the dialog box
to apply a filter to the math waveform
defined by the expression.
4
Analyzing Waveforms
CSA8200 & TDS8200 Series Quick Start User Manual 45
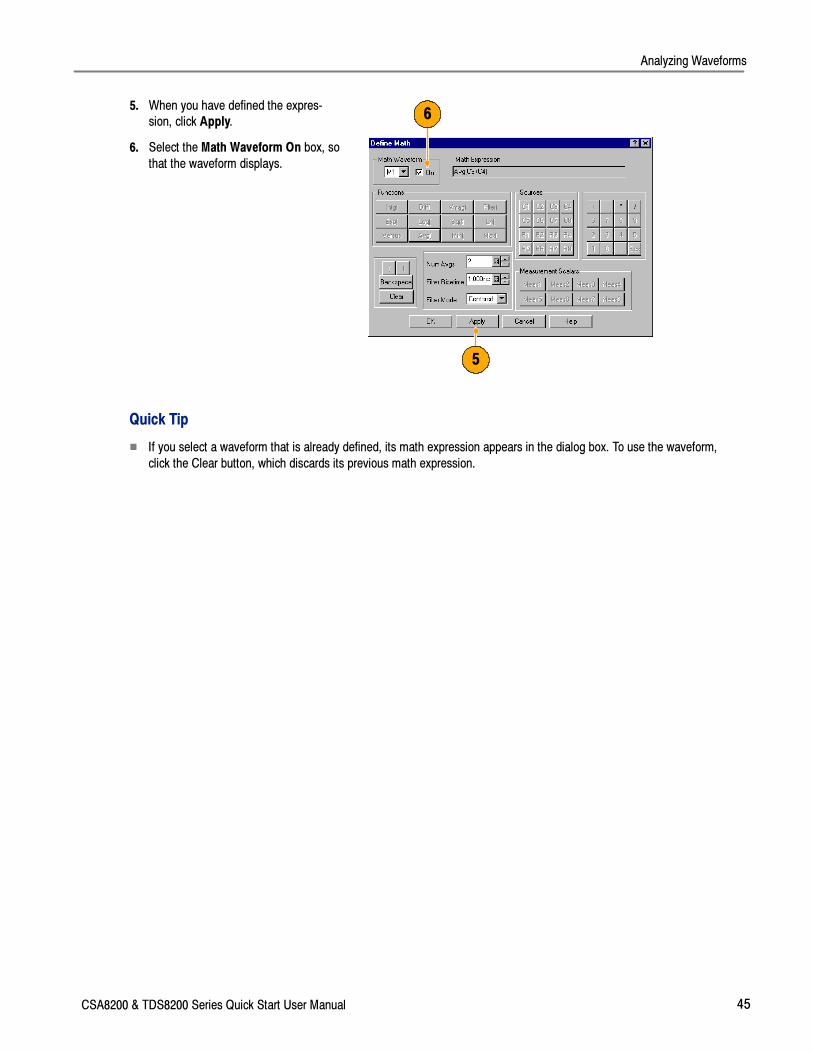
5. When you have defined the expres-
sion, click Apply.
6. Select the Math Waveform On box, so
that the waveform displays.
5
6
Quick Tip
� If you select a waveform that is already defined, its math expression appears in the dialog box. To use the waveform,
click the Clear button, which discards its previous math expression.
Analyzing Waveforms
46 CSA8200 & TDS8200 Series Quick Start User Manual
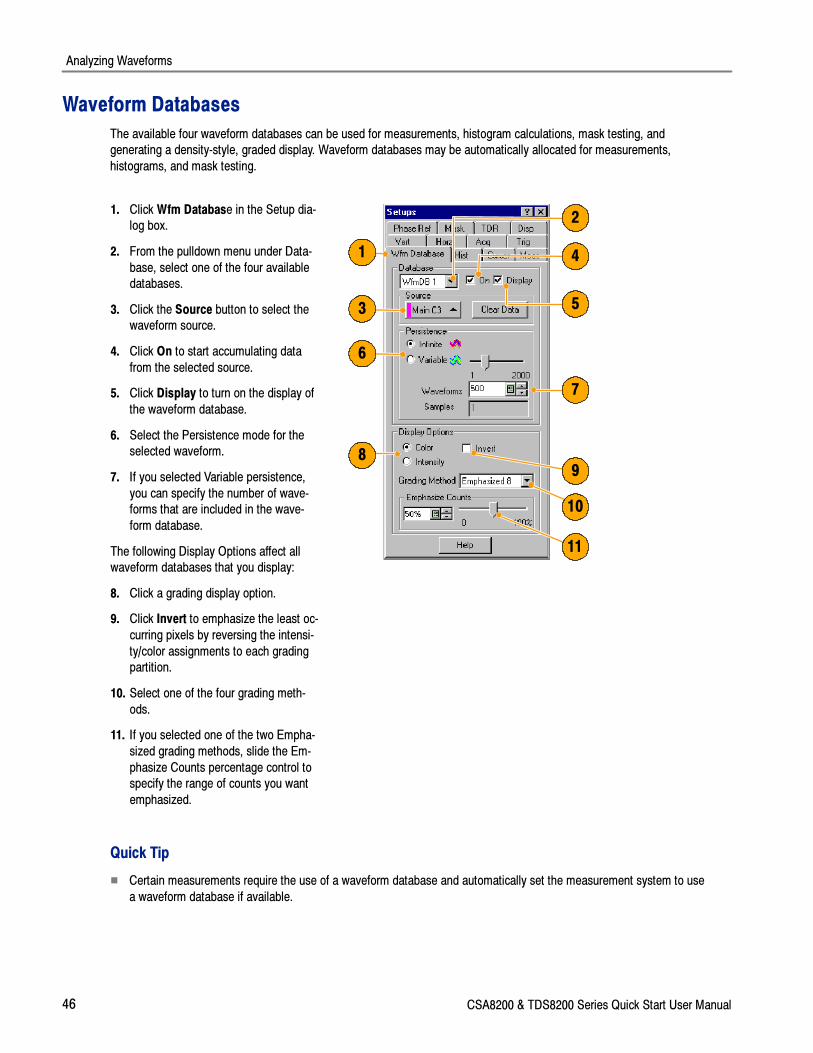
Waveform Databases
The available four waveform databases can be used for measurements, histogram calculations, mask testing, and
generating a density-style, graded display. Waveform databases may be automatically allocated for measurements,
histograms, and mask testing.
1. Click Wfm Database in the Setup dia-
log box.
2. From the pulldown menu under Data-
base, select one of the four available
databases.
3. Click the Source button to select the
waveform source.
4. Click On to start accumulating data
from the selected source.
5. Click Display to turn on the display of
the waveform database.
6. Select the Persistence mode for the
selected waveform.
7. If you selected Variable persistence,
you can specify the number of wave-
forms that are included in the wave-
form database.
The following Display Options affect all
waveform databases that you display:
8. Click a grading display option.
9. Click Invert to emphasize the least oc-
curring pixels by reversing the intensi-
ty/color assignments to each grading
partition.
10. Select one of the four grading meth-
ods.
11. If you selected one of the two Empha-
sized grading methods, slide the Em-
phasize Counts percentage control to
specify the range of counts you want
emphasized.
1
2
3
4
5
6
7
8
9
10
11
Quick Tip
� Certain measurements require the use of a waveform database and automatically set the measurement system to use
a waveform database if available.
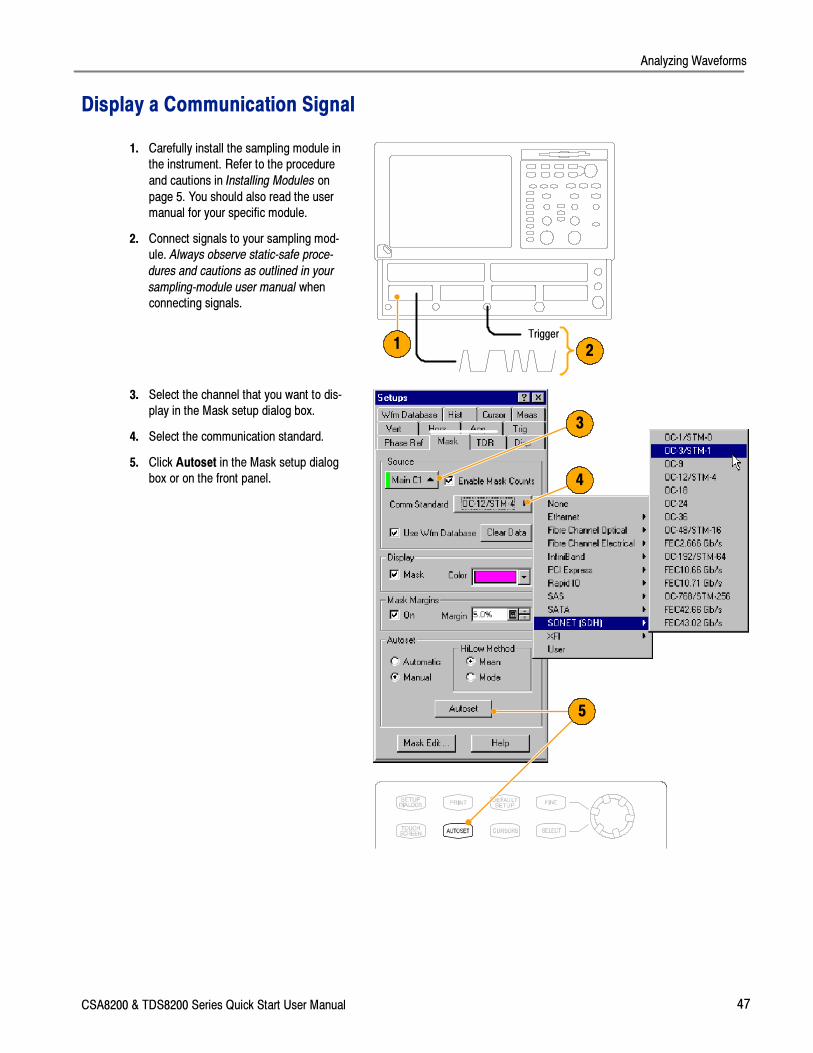
Analyzing Waveforms
CSA8200 & TDS8200 Series Quick Start User Manual 47
Display a Communication Signal
1. Carefully install the sampling module in
the instrument. Refer to the procedure
and cautions in Installing Modules on
page 5. You should also read the user
manual for your specific module.
2. Connect signals to your sampling mod-
ule. Always observe static-safe proce-
dures and cautions as outlined in your
sampling-module user manual when
connecting signals.
Trigger1
2
3. Select the channel that you want to dis-
play in the Mask setup dialog box.
4. Select the communication standard.
5. Click Autoset in the Mask setup dialog
box or on the front panel.
3
4
5

Analyzing Waveforms
48 CSA8200 & TDS8200 Series Quick Start User Manual
Display and Analyze Communication Signals Using Mask Testing
Use mask testing to test your waveforms for time or amplitude violations against a predefined industry standard or a
user-defined mask. Mask testing counts waveform samples (called hits or violations) that occur within a specific area (the
mask). Use the communications-standard masks that this instrument provides (SONET/SDH, Fiber Channel Optical and
Electrical, and Ethernet) to test your signals, or define your own masks.
1. Select the waveform to be mask tested
from the drop-down list under Source.
2. Select a standard mask in the Mask set-
up dialog box. Selecting a communica-
tion standard or user-defined mask auto-
matically:
� Displays the mask on screen and
autosets for the mask if Automatic is
checked in the dialog box.
� Enables mask testing.
� Displays mask count statistics in the
mask readout. A mask does not
have to be displayed to have mask
counting enabled.
3. If you want, disable mask counts. (Se-
lecting a mask in step 2 automatically
enabled them.)
4. Check Use Wfm Database to use a wa-
veform database as the waveform
source.
1
2
34
5. If you want, you can enable margins to
explore design margins of your
communications signal.
5

Analyzing Waveforms
CSA8200 & TDS8200 Series Quick Start User Manual 49
To autoset the waveform to mask:
6. Click the Autoset button to perform a
manual autoset on the mask-source wa-
veform.
7. Select the HiLow Method used to deter-
mine the High and Low values when
aligning the input signal to the masks.
Mean sets the Mask Autoset to use the
mean value of the High level (topline)
and Low level (baseline), taken within
the fixed eye aperture (center 20% of the
eye), to align the input signal to the NRZ
mask.
Mode sets the Mask Autoset to use the
High level (topline) and Low level
(baseline), taken across one unit interval
of the eye diagram, to align the input
signal to the NRZ mask.
67
To set a Stop Action:
8. Click Acq in the Setup menu.8
9. In the Acq Setup dialog box, check the
Condition option under Stop After.
10. In the Condition pulldown list, select a
mask-related criteria, such as Mask To-
tal Hits and set a count, such as 1, in
the count box.
These settings stop acquisition when
mask violations satisfy the criteria you
set.
9
10
11. Push the RUN/STOP button to restart
acquisition, if stopped.
11
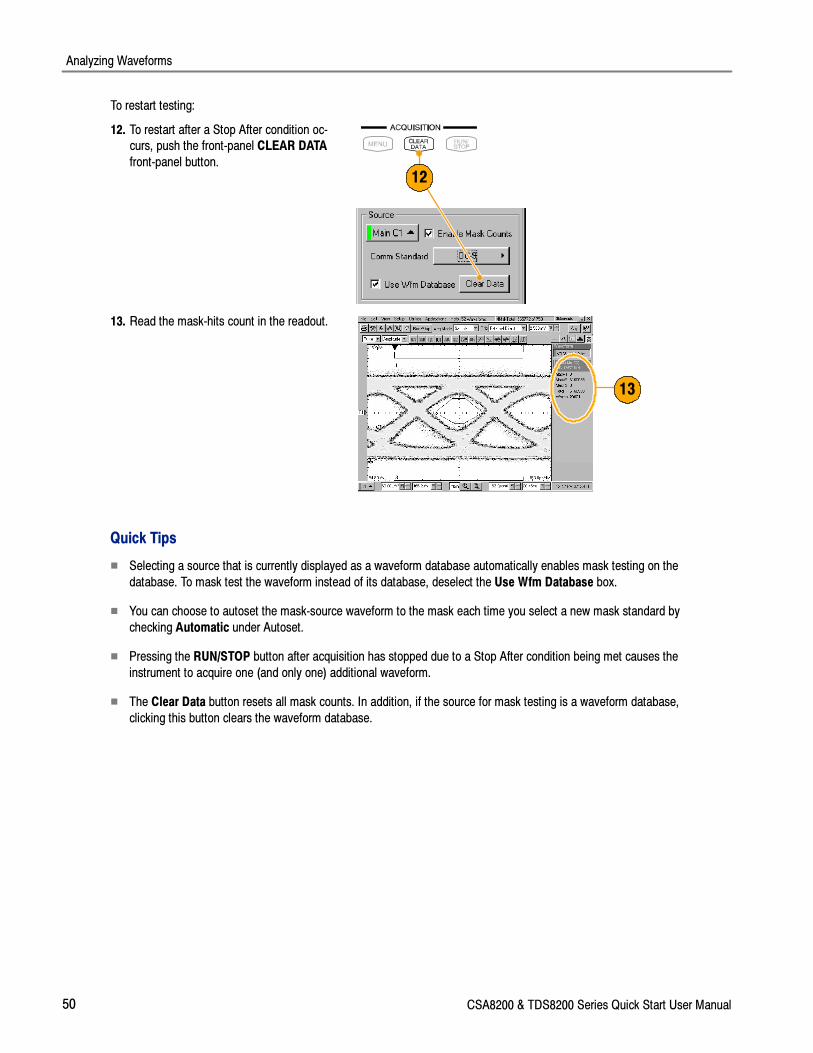
Analyzing Waveforms
50 CSA8200 & TDS8200 Series Quick Start User Manual
To restart testing:
12. To restart after a Stop After condition oc-
curs, push the front-panel CLEAR DATA
front-panel button.
12
13. Read the mask-hits count in the readout.
13
Quick Tips
� Selecting a source that is currently displayed as a waveform database automatically enables mask testing on the
database. To mask test the waveform instead of its database, deselect the Use Wfm Database box.
� You can choose to autoset the mask-source waveform to the mask each time you select a new mask standard by
checking Automatic under Autoset.
� Pressing the RUN/STOP button after acquisition has stopped due to a Stop After condition being met causes the
instrument to acquire one (and only one) additional waveform.
� The Clear Data button resets all mask counts. In addition, if the source for mask testing is a waveform database,
clicking this button clears the waveform database.
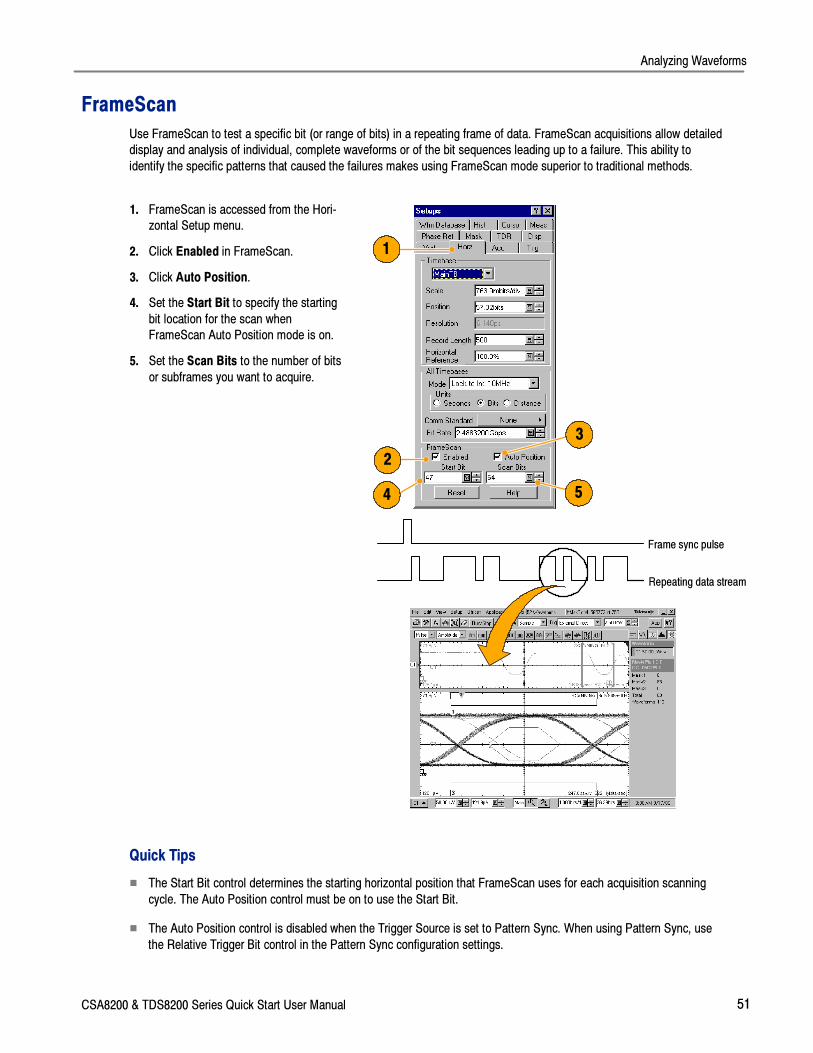
Analyzing Waveforms
CSA8200 & TDS8200 Series Quick Start User Manual 51
FrameScan
Use FrameScan to test a specific bit (or range of bits) in a repeating frame of data. FrameScan acquisitions allow detailed
display and analysis of individual, complete waveforms or of the bit sequences leading up to a failure. This ability to
identify the specific patterns that caused the failures makes using FrameScan mode superior to traditional methods.
1. FrameScan is accessed from the Hori-
zontal Setup menu.
2. Click Enabled in FrameScan.
3. Click Auto Position.
4. Set the Start Bit to specify the starting
bit location for the scan when
FrameScan Auto Position mode is on.
5. Set the Scan Bits to the number of bits
or subframes you want to acquire.
Frame sync pulse
Repeating data stream
1
2
3
4 5
Quick Tips
� The Start Bit control determines the starting horizontal position that FrameScan uses for each acquisition scanning
cycle. The Auto Position control must be on to use the Start Bit.
� The Auto Position control is disabled when the Trigger Source is set to Pattern Sync. When using Pattern Sync, use
the Relative Trigger Bit control in the Pattern Sync configuration settings.
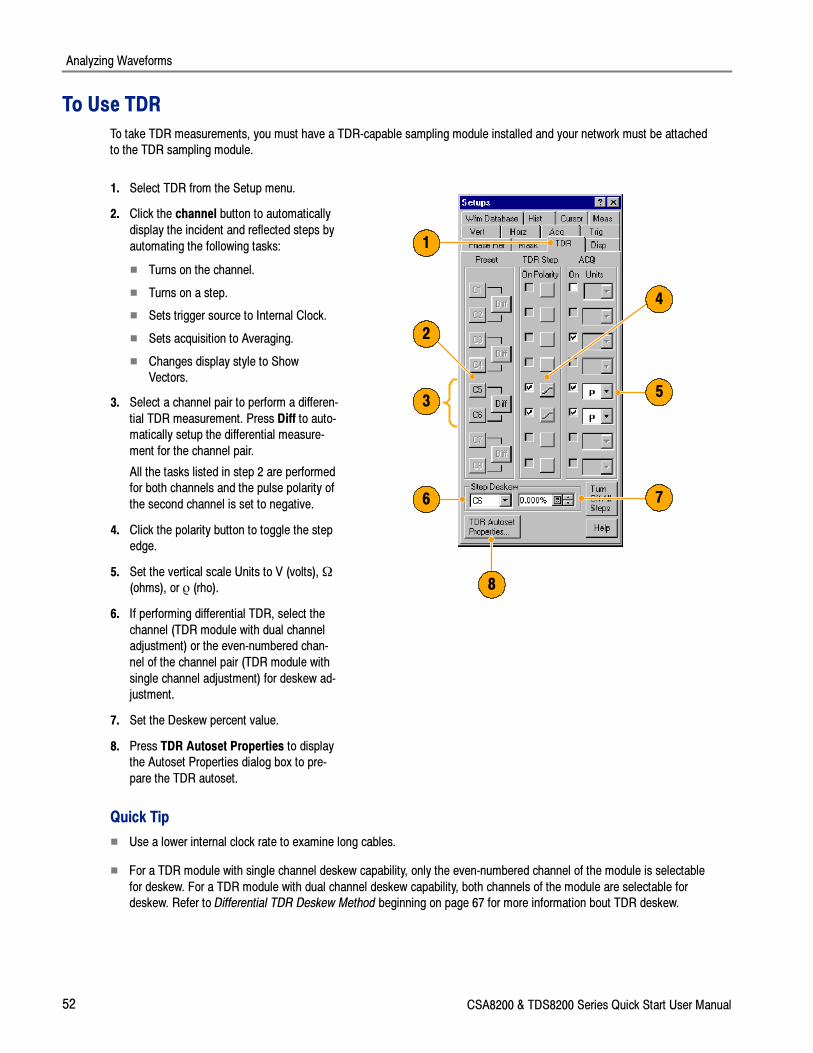
Analyzing Waveforms
52 CSA8200 & TDS8200 Series Quick Start User Manual
To Use TDR
To take TDR measurements, you must have a TDR-capable sampling module installed and your network must be attached
to the TDR sampling module.
1. Select TDR from the Setup menu.
2. Click the channel button to automatically
display the incident and reflected steps by
automating the following tasks:
� Turns on the channel.
� Turns on a step.
� Sets trigger source to Internal Clock.
� Sets acquisition to Averaging.
� Changes display style to Show
Vectors.
3. Select a channel pair to perform a differen-
tial TDR measurement. Press Diff to auto-
matically setup the differential measure-
ment for the channel pair.
All the tasks listed in step 2 are performed
for both channels and the pulse polarity of
the second channel is set to negative.
4. Click the polarity button to toggle the step
edge.
5. Set the vertical scale Units to V (volts), Ω
(ohms), or ρ (rho).
6. If performing differential TDR, select the
channel (TDR module with dual channel
adjustment) or the even-numbered chan-
nel of the channel pair (TDR module with
single channel adjustment) for deskew ad-
justment.
7. Set the Deskew percent value.
8. Press TDR Autoset Properties to display
the Autoset Properties dialog box to pre-
pare the TDR autoset.
1
2
3
4
5
6 7
8
Quick Tip
� Use a lower internal clock rate to examine long cables.
� For a TDR module with single channel deskew capability, only the even-numbered channel of the module is selectable
for deskew. For a TDR module with dual channel deskew capability, both channels of the module are selectable for
deskew. Refer to Differential TDR Deskew Method beginning on page 67 for more information bout TDR deskew.
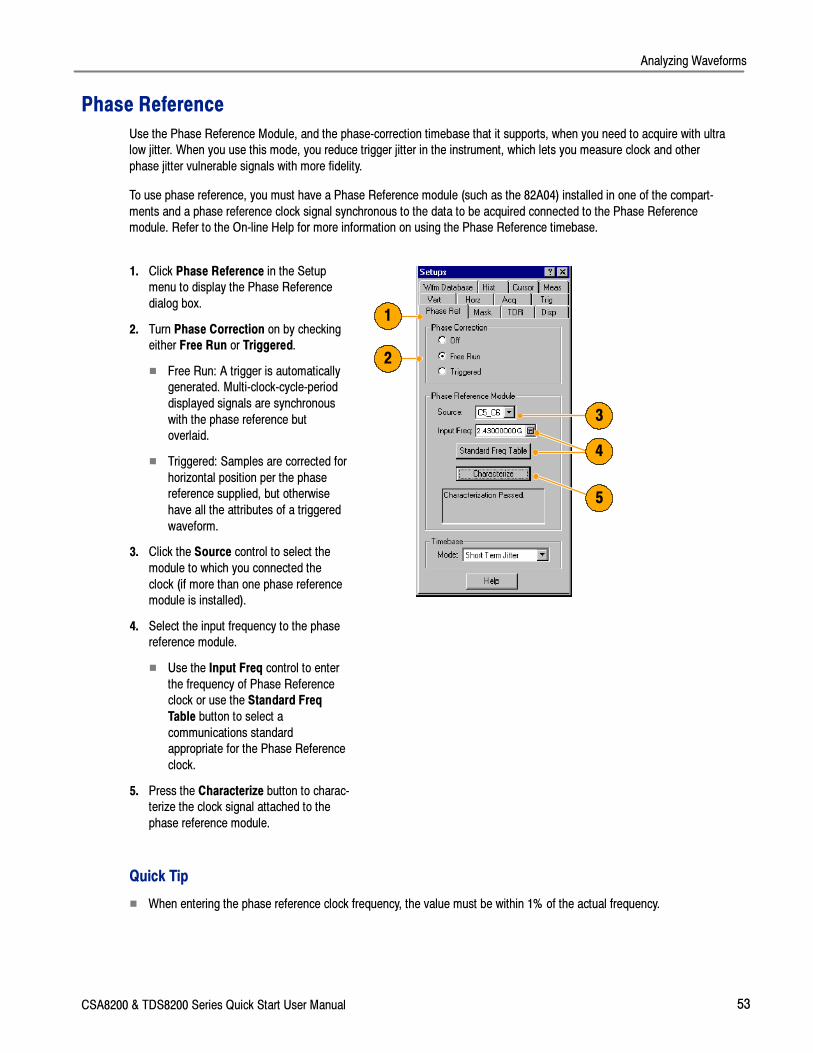
Analyzing Waveforms
CSA8200 & TDS8200 Series Quick Start User Manual 53
Phase Reference
Use the Phase Reference Module, and the phase-correction timebase that it supports, when you need to acquire with ultra
low jitter. When you use this mode, you reduce trigger jitter in the instrument, which lets you measure clock and other
phase jitter vulnerable signals with more fidelity.
To use phase reference, you must have a Phase Reference module (such as the 82A04) installed in one of the compart-
ments and a phase reference clock signal synchronous to the data to be acquired connected to the Phase Reference
module. Refer to the On-line Help for more information on using the Phase Reference timebase.
1. Click Phase Reference in the Setup
menu to display the Phase Reference
dialog box.
2. Turn Phase Correction on by checking
either Free Run or Triggered.
� Free Run: A trigger is automatically
generated. Multi-clock-cycle-period
displayed signals are synchronous
with the phase reference but
overlaid.
� Triggered: Samples are corrected for
horizontal position per the phase
reference supplied, but otherwise
have all the attributes of a triggered
waveform.
3. Click the Source control to select the
module to which you connected the
clock (if more than one phase reference
module is installed).
4. Select the input frequency to the phase
reference module.
� Use the Input Freq control to enter
the frequency of Phase Reference
clock or use the Standard Freq
Table button to select a
communications standard
appropriate for the Phase Reference
clock.
5. Press the Characterize button to charac-
terize the clock signal attached to the
phase reference module.
1
2
3
4
5
Quick Tip
� When entering the phase reference clock frequency, the value must be within 1% of the actual frequency.
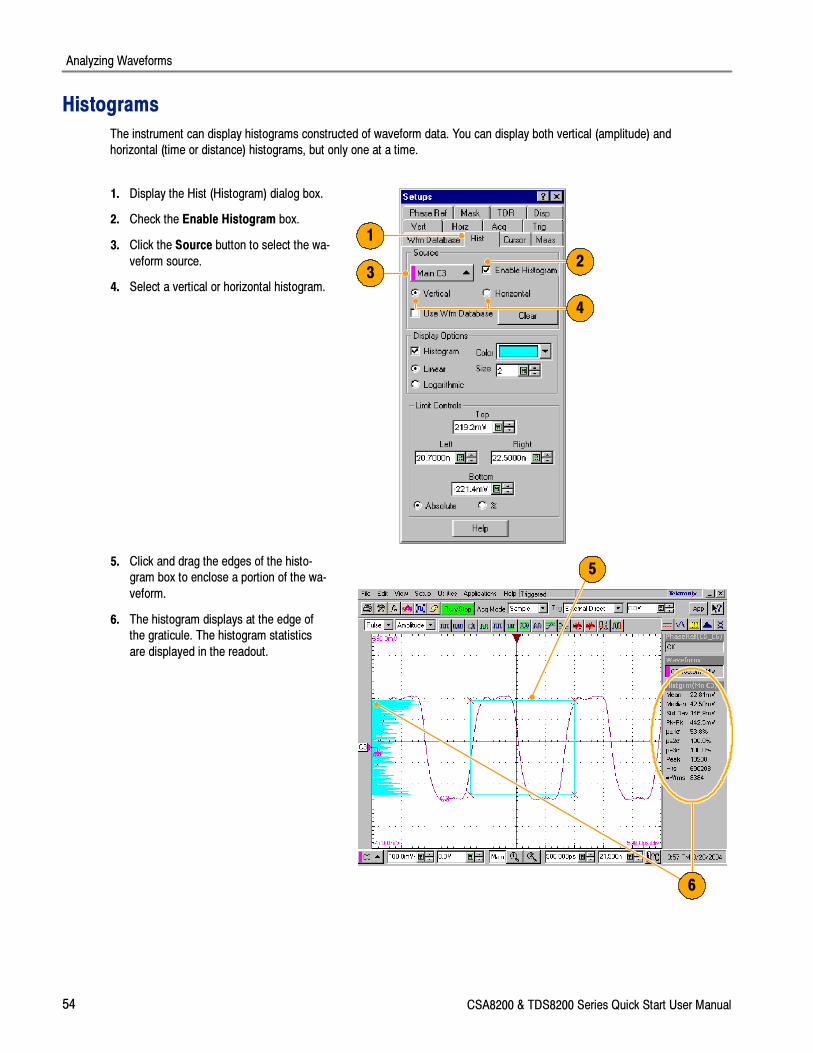
Analyzing Waveforms
54 CSA8200 & TDS8200 Series Quick Start User Manual
Histograms
The instrument can display histograms constructed of waveform data. You can display both vertical (amplitude) and
horizontal (time or distance) histograms, but only one at a time.
1. Display the Hist (Histogram) dialog box.
2. Check the Enable Histogram box.
3. Click the Source button to select the wa-
veform source.
4. Select a vertical or horizontal histogram.
1
23
4
5. Click and drag the edges of the histo-
gram box to enclose a portion of the wa-
veform.
6. The histogram displays at the edge of
the graticule. The histogram statistics
are displayed in the readout.
5
6
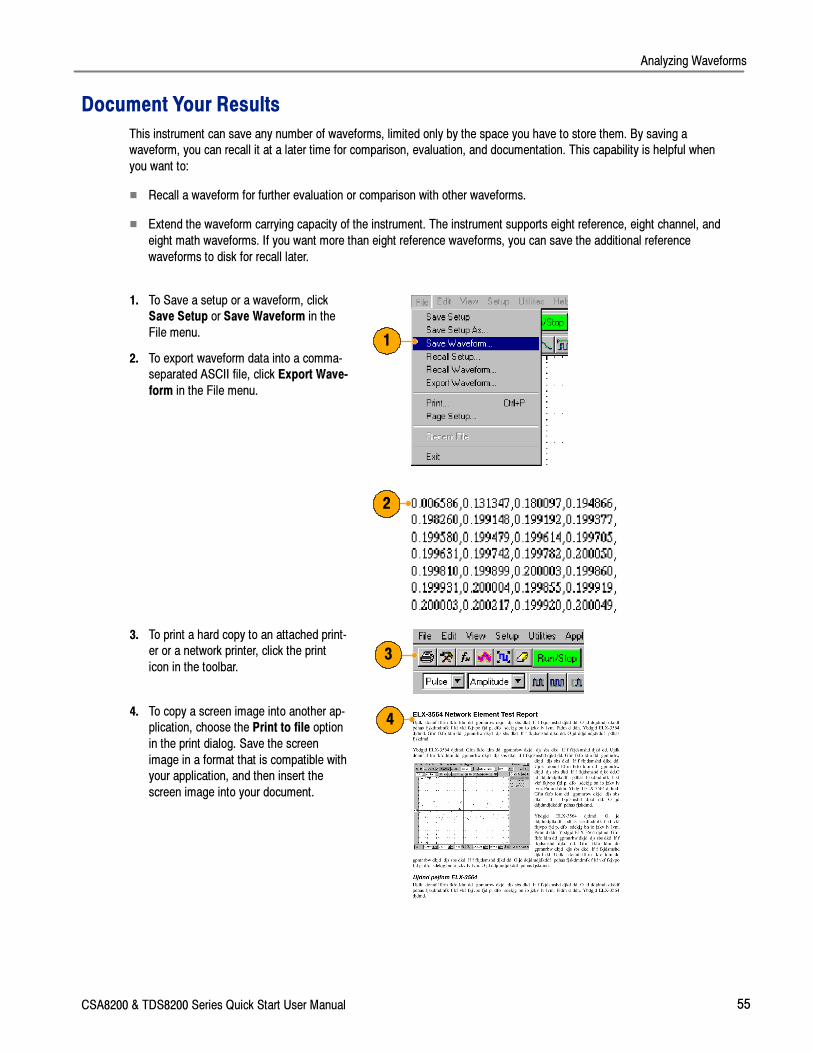
Analyzing Waveforms
CSA8200 & TDS8200 Series Quick Start User Manual 55
Document Your Results
This instrument can save any number of waveforms, limited only by the space you have to store them. By saving a
waveform, you can recall it at a later time for comparison, evaluation, and documentation. This capability is helpful when
you want to:
� Recall a waveform for further evaluation or comparison with other waveforms.
� Extend the waveform carrying capacity of the instrument. The instrument supports eight reference, eight channel, and
eight math waveforms. If you want more than eight reference waveforms, you can save the additional reference
waveforms to disk for recall later.
1. To Save a setup or a waveform, click
Save Setup or Save Waveform in the
File menu.
2. To export waveform data into a comma-
separated ASCII file, click Export Wave-
form in the File menu.
1
2
3. To print a hard copy to an attached print-
er or a network printer, click the print
icon in the toolbar.3
4. To copy a screen image into another ap-
plication, choose the Print to file option
in the print dialog. Save the screen
image in a format that is compatible with
your application, and then insert the
screen image into your document.
4
Using the 80A05 Electrical Clock Recovery Module Examples
56 CSA8200 & TDS8200 Series Quick Start User Manual
Using the 80A05 Electrical Clock Recovery Module ExamplesThis section contains various ways to use an 80A05 Electrical Clock Recovery module with other optical and electrical
sampling modules.
The 80A05 brings a new standard for ease of use to sampling oscilloscopes: simple triggering on electrical signals through
its clock recovery on either single-ended or differential signals. The differential functionality, in particular, simplifies
acquisitions that were previously difficult to accomplish. The 80A05 is able to recover clock signals at most standard rates
between 50 Mb/s and 12.6 Gb/s.
The skew between signals presents a challenge to many measurements. Verifying the amount of skew, and deskewing
when necessary keeps your skew errors in check and limits the undesirable influence of common mode signal on your
measurements.
This section presents simple example setups and information about vertical calibration, horizontal deskew, and minimizing
the effect of skew on your measurements.
Figure 1: 80A05 module
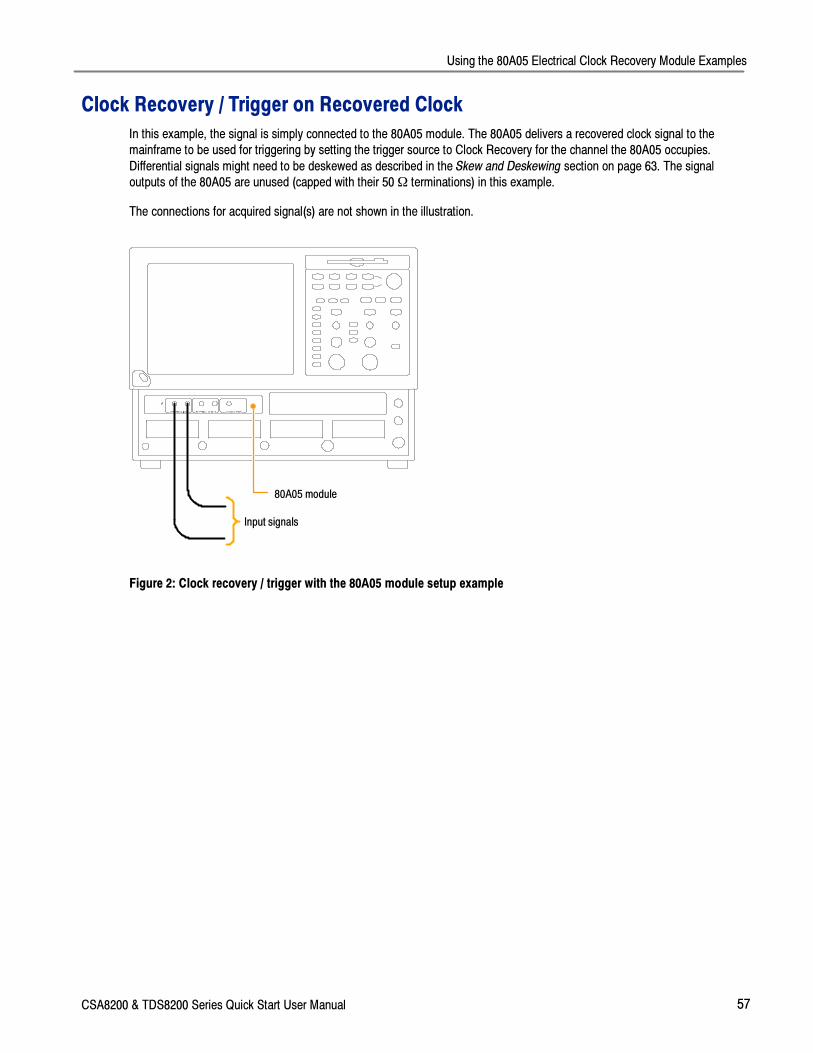
Using the 80A05 Electrical Clock Recovery Module Examples
CSA8200 & TDS8200 Series Quick Start User Manual 57
Clock Recovery / Trigger on Recovered Clock
In this example, the signal is simply connected to the 80A05 module. The 80A05 delivers a recovered clock signal to the
mainframe to be used for triggering by setting the trigger source to Clock Recovery for the channel the 80A05 occupies.
Differential signals might need to be deskewed as described in the Skew and Deskewing section on page 63. The signal
outputs of the 80A05 are unused (capped with their 50Ω terminations) in this example.
The connections for acquired signal(s) are not shown in the illustration.
Input signals
80A05 module
Figure 2: Clock recovery / trigger with the 80A05 module setup example
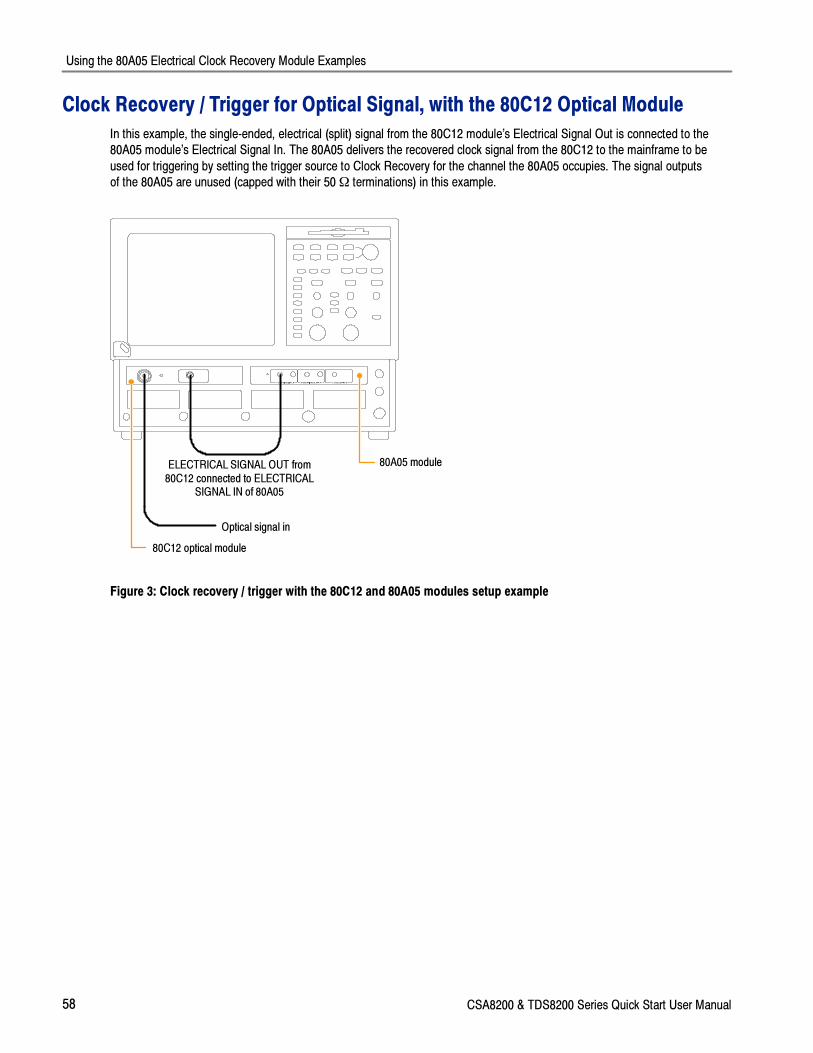
Using the 80A05 Electrical Clock Recovery Module Examples
58 CSA8200 & TDS8200 Series Quick Start User Manual
Clock Recovery / Trigger for Optical Signal, with the 80C12 Optical Module
In this example, the single-ended, electrical (split) signal from the 80C12 module’s Electrical Signal Out is connected to the
80A05 module’s Electrical Signal In. The 80A05 delivers the recovered clock signal from the 80C12 to the mainframe to be
used for triggering by setting the trigger source to Clock Recovery for the channel the 80A05 occupies. The signal outputs
of the 80A05 are unused (capped with their 50Ω terminations) in this example.
Optical signal in
ELECTRICAL SIGNAL OUT from80C12 connected to ELECTRICAL
SIGNAL IN of 80A05
80C12 optical module
80A05 module
Figure 3: Clock recovery / trigger with the 80C12 and 80A05 modules setup example
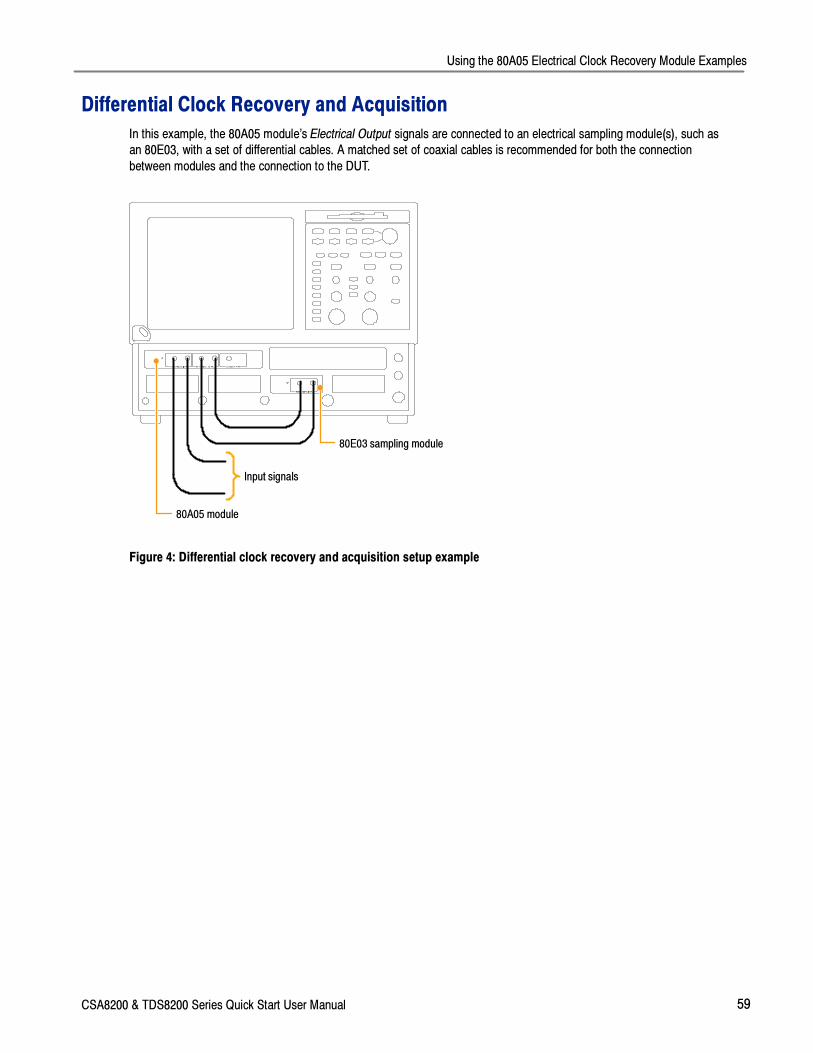
Using the 80A05 Electrical Clock Recovery Module Examples
CSA8200 & TDS8200 Series Quick Start User Manual 59
Differential Clock Recovery and Acquisition
In this example, the 80A05 module’s Electrical Output signals are connected to an electrical sampling module(s), such as
an 80E03, with a set of differential cables. A matched set of coaxial cables is recommended for both the connection
between modules and the connection to the DUT.
80A05 module
80E03 sampling module
Input signals
Figure 4: Differential clock recovery and acquisition setup example
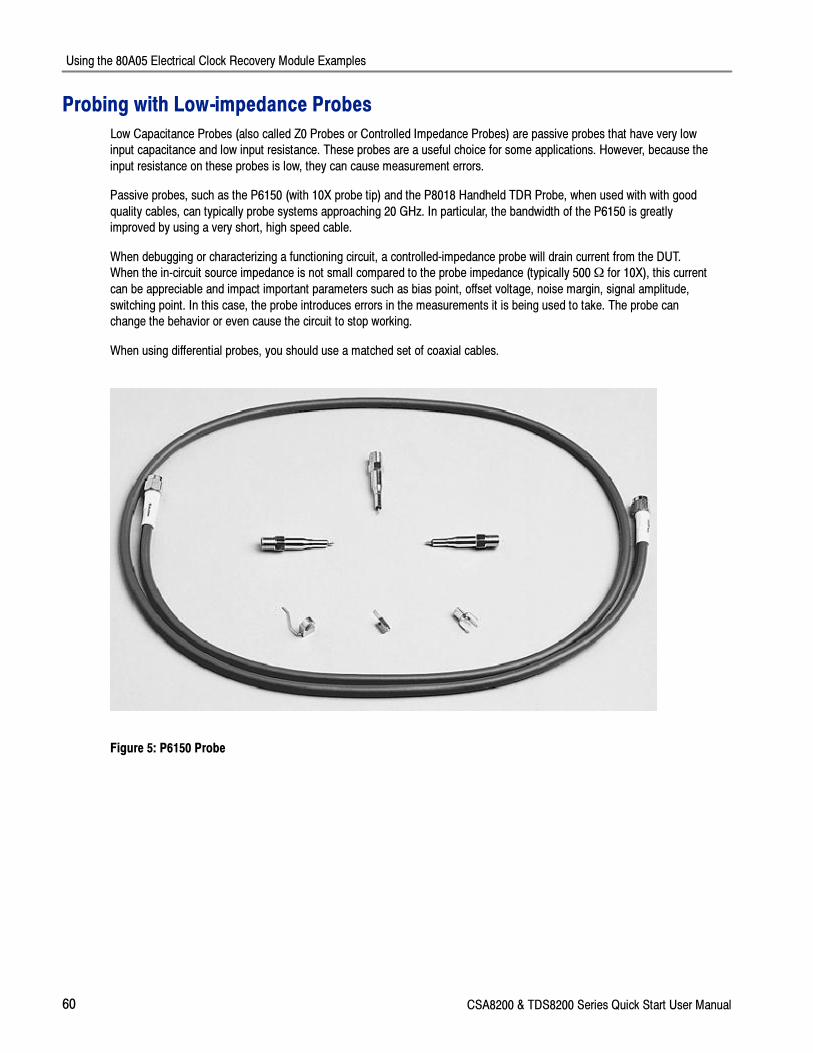
Using the 80A05 Electrical Clock Recovery Module Examples
60 CSA8200 & TDS8200 Series Quick Start User Manual
Probing with Low-impedance Probes
Low Capacitance Probes (also called Z0 Probes or Controlled Impedance Probes) are passive probes that have very low
input capacitance and low input resistance. These probes are a useful choice for some applications. However, because the
input resistance on these probes is low, they can cause measurement errors.
Passive probes, such as the P6150 (with 10X probe tip) and the P8018 Handheld TDR Probe, when used with with good
quality cables, can typically probe systems approaching 20 GHz. In particular, the bandwidth of the P6150 is greatly
improved by using a very short, high speed cable.
When debugging or characterizing a functioning circuit, a controlled-impedance probe will drain current from the DUT.
When the in-circuit source impedance is not small compared to the probe impedance (typically 500Ω for 10X), this current
can be appreciable and impact important parameters such as bias point, offset voltage, noise margin, signal amplitude,
switching point. In this case, the probe introduces errors in the measurements it is being used to take. The probe can
change the behavior or even cause the circuit to stop working.
When using differential probes, you should use a matched set of coaxial cables.
Figure 5: P6150 Probe
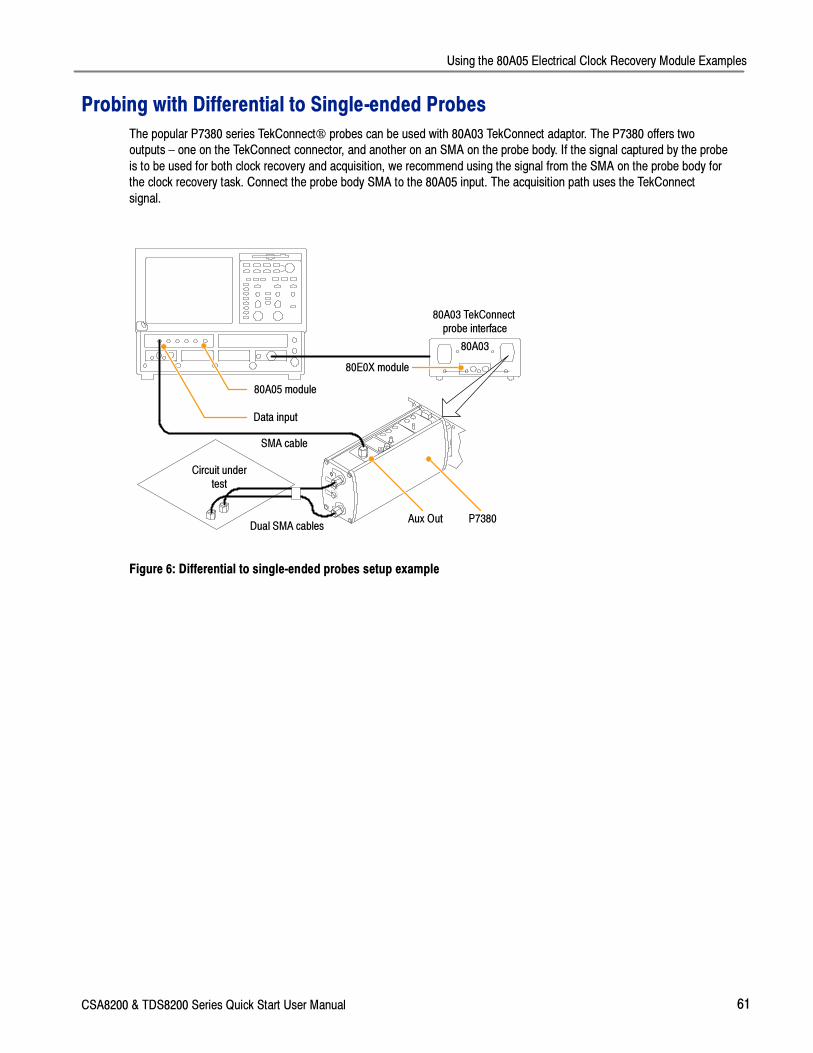
Using the 80A05 Electrical Clock Recovery Module Examples
CSA8200 & TDS8200 Series Quick Start User Manual 61
Probing with Differential to Single-ended Probes
The popular P7380 series TekConnect® probes can be used with 80A03 TekConnect adaptor. The P7380 offers two
outputs – one on the TekConnect connector, and another on an SMA on the probe body. If the signal captured by the probe
is to be used for both clock recovery and acquisition, we recommend using the signal from the SMA on the probe body for
the clock recovery task. Connect the probe body SMA to the 80A05 input. The acquisition path uses the TekConnect
signal.
Aux Out
Data input
SMA cable
80E0X module
80A03
80A05 module
Dual SMA cables
Circuit undertest
80A03 TekConnectprobe interface
P7380
Figure 6: Differential to single-ended probes setup example
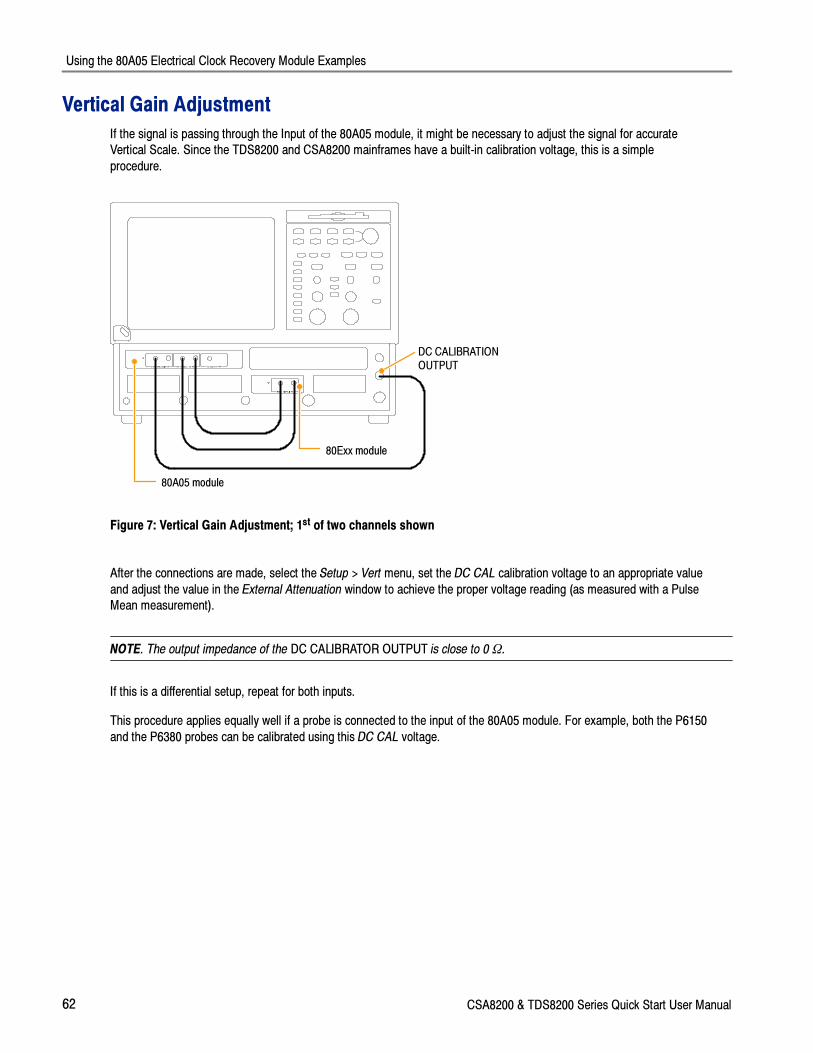
Using the 80A05 Electrical Clock Recovery Module Examples
62 CSA8200 & TDS8200 Series Quick Start User Manual
Vertical Gain Adjustment
If the signal is passing through the Input of the 80A05 module, it might be necessary to adjust the signal for accurate
Vertical Scale. Since the TDS8200 and CSA8200 mainframes have a built-in calibration voltage, this is a simple
procedure.
DC CALIBRATIONOUTPUT
80A05 module
80Exx module
Figure 7: Vertical Gain Adjustment; 1st of two channels shown
After the connections are made, select the Setup > Vert menu, set the DC CAL calibration voltage to an appropriate value
and adjust the value in the External Attenuation window to achieve the proper voltage reading (as measured with a Pulse
Mean measurement).
NOTE. The output impedance of the DC CALIBRATOR OUTPUT is close to 0 Ω.
If this is a differential setup, repeat for both inputs.
This procedure applies equally well if a probe is connected to the input of the 80A05 module. For example, both the P6150
and the P6380 probes can be calibrated using this DC CAL voltage.
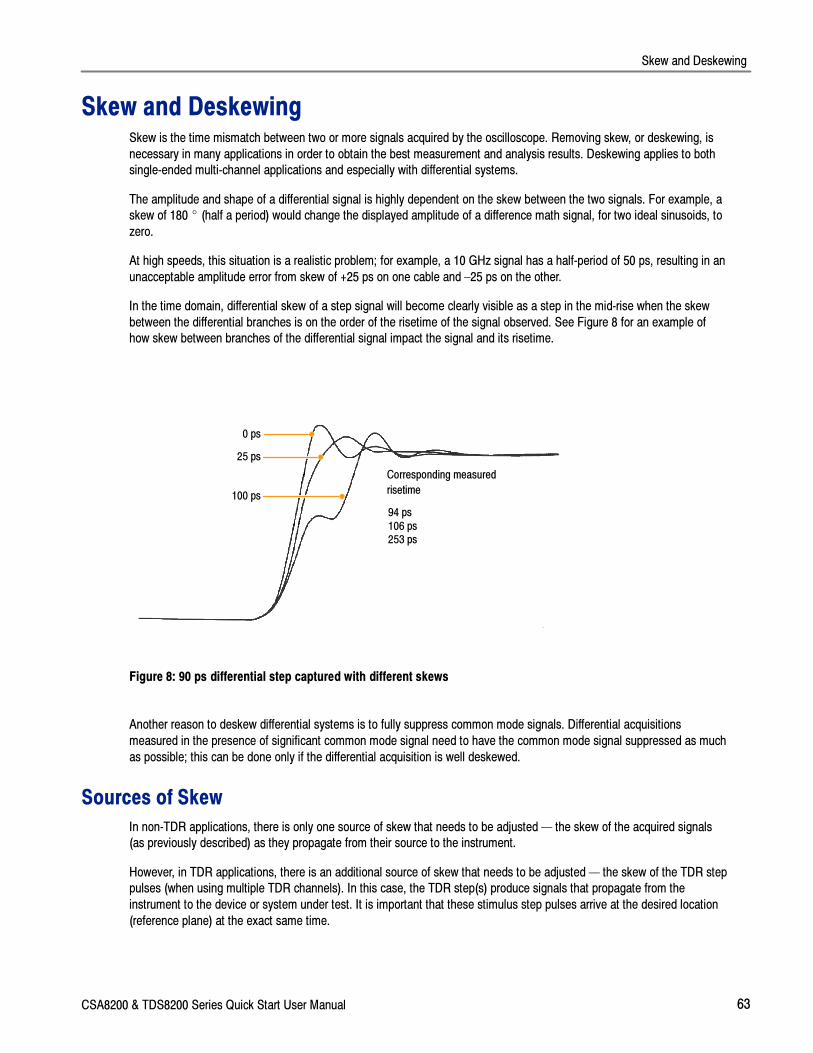
Skew and Deskewing
CSA8200 & TDS8200 Series Quick Start User Manual 63
Skew and DeskewingSkew is the time mismatch between two or more signals acquired by the oscilloscope. Removing skew, or deskewing, is
necessary in many applications in order to obtain the best measurement and analysis results. Deskewing applies to both
single-ended multi-channel applications and especially with differential systems.
The amplitude and shape of a differential signal is highly dependent on the skew between the two signals. For example, a
skew of 180 � (half a period) would change the displayed amplitude of a difference math signal, for two ideal sinusoids, to
zero.
At high speeds, this situation is a realistic problem; for example, a 10 GHz signal has a half-period of 50 ps, resulting in an
unacceptable amplitude error from skew of +25 ps on one cable and –25 ps on the other.
In the time domain, differential skew of a step signal will become clearly visible as a step in the mid-rise when the skew
between the differential branches is on the order of the risetime of the signal observed. See Figure 8 for an example of
how skew between branches of the differential signal impact the signal and its risetime.
0 ps
25 ps
100 ps
Corresponding measured
risetime
94 ps106 ps253 ps
Figure 8: 90 ps differential step captured with different skews
Another reason to deskew differential systems is to fully suppress common mode signals. Differential acquisitions
measured in the presence of significant common mode signal need to have the common mode signal suppressed as much
as possible; this can be done only if the differential acquisition is well deskewed.
Sources of Skew
In non-TDR applications, there is only one source of skew that needs to be adjusted — the skew of the acquired signals
(as previously described) as they propagate from their source to the instrument.
However, in TDR applications, there is an additional source of skew that needs to be adjusted — the skew of the TDR step
pulses (when using multiple TDR channels). In this case, the TDR step(s) produce signals that propagate from the
instrument to the device or system under test. It is important that these stimulus step pulses arrive at the desired location
(reference plane) at the exact same time.
Skew and Deskewing
64 CSA8200 & TDS8200 Series Quick Start User Manual
One method for correcting (deskewing) for these skew sources in a differential TDR system is described in Minimizing
Skew.
Minimizing Skew
You can minimize skew between differential branches or multiple inputs by following these simple rules:
� Use balanced cable pairs.
� Measure and match your cables. (TDR modules such as 80E10, 80E08, and 80E04 allow you to measure cable delays
with very high precision.)
� In differential systems, use Differential probes or Differential SMA to Single-ended active convertors (such as the
Tektronix P7380SMA).
If the skew cannot be removed, or is unknown, proceed with measuring and/or removing it.
Measuring Skew
In most situations, you can determine the skew by measuring the horizontal position of the signals under consideration (the
skew is the difference between threshold crossing times).
� For single valued waveforms (as opposed to eye diagrams), you can use averaging and/or filtering. The filter is found
in the math menu; its time constant (“Filter Risetime”) should be set to a fraction of the measured signal’s risetime.
Also keep in mind that the filter requires a pre-charge, so the signal trace is unreliable from the edge of the screen one
time-constant inward (on both the left and on the right edge of the screen).
The position of the waveform can be read with either the cursors or the automatic measurement. Saving the first signal
as a reference is a convenient way to keep it available and visible.
� For multi--valued waveforms (eye diagrams) neither average nor filter is appropriate; rely instead on the automatic
measurement system to find the precise position of the crossing.
Methods to Deskew Your Acquired Signals
For best measurement results when using multiple inputs, it is necessary to remove the skew between the acquisition
paths. To remove skew between multiple acquisition paths (acquisition deskewing), do the following:
� If you are using the 80A05 module to recover clock from a differential signal, you need to deskew at the SMA
connectors connected to the 80A05.
� If you are also viewing the signals out of the 80A05 module, for best results, you need to deskew again, this time from
the 80A05 module to the sampling module(s) inputs. This is shown in Figure 9.
Skew and Deskewing
CSA8200 & TDS8200 Series Quick Start User Manual 65
Input signals
Deskewed at input to 80A05
Deskewed at input tosampling module
Figure 9: Deskewing multiple input signal paths with the 80A05
In cases where there is an insignificant amount of common mode signal between the differential branches, this might be all
the deskew you need; you might not need to deskew to the 80A05 module inputs. Keep in mind that depending on the bit
rate, the accuracy required, and your cabling, you might not need all of the deskewing steps.
Here are some practical examples of deskewing your signals in different situations:
Trigger Present, Known Fast-edge Signal Present
If there is a trigger signal that you can rely on while you are deskewing your differential signal and there is a known
fast-edge that is (or can be) connected to your DUT; deskew with this signal. If the target is an 80A05 module (and as such
has no acquisition of its own), use any single acquisition channel (available in your setup) to measure the horizontal
position of first one, then the other branch of the differential signal (bypassing the 80A05 module for the moment). For
example, you have channel 1 of an 80E02 module available for acquisitions; connect the +branch of the electrical signal to
CH1, note the position (you can save it as a reference waveform); disconnect the +branch from the CH1 (and terminate it
properly), connect the --branch to CH1 and use your deskew adjustment to remove the skew. (Refer to Methods to Adjust
Out Skew on page 66).
NOTE. This signal should have a repetition rate much lower than the amount of skew that needs to be removed so that the
relative skew between the signals can be correctly determined.
No Trigger, Zero Skew Signal Available
Using Internal Clock Output (from front panel). Use the INTERNAL CLOCK OUTPUT signal on the oscilloscope as the
signal source (into your differential probe or circuit) — first for one branch, then for the other.
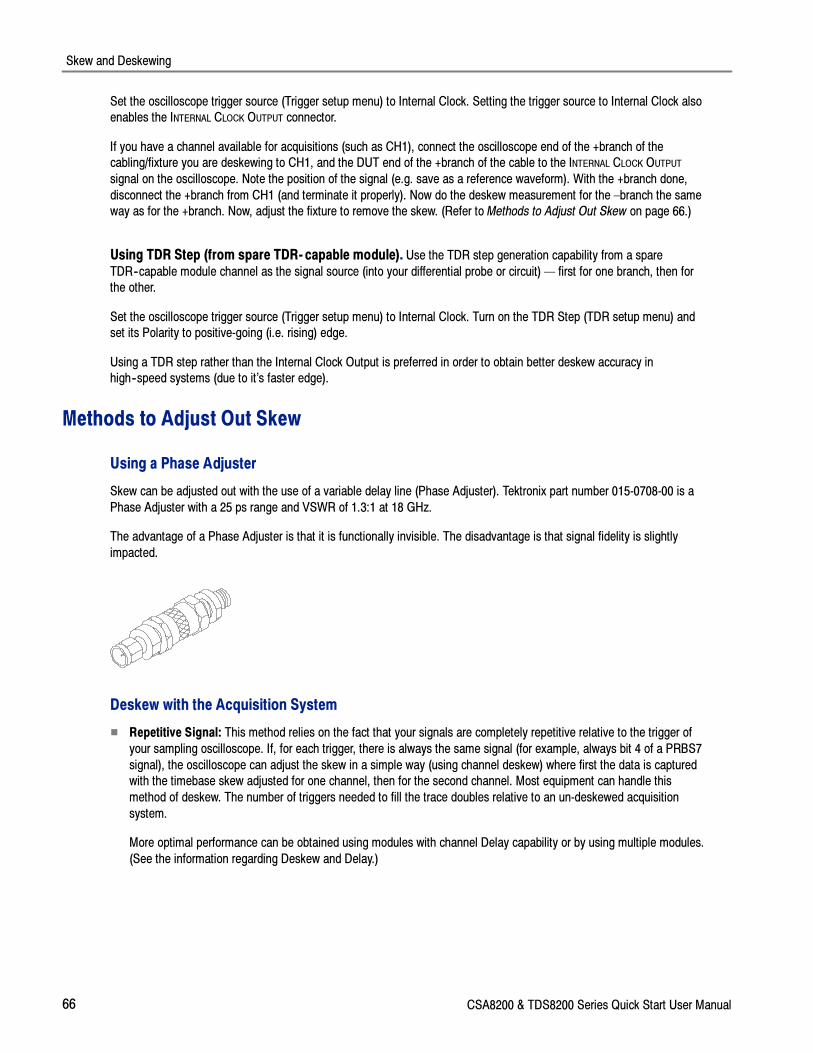
Skew and Deskewing
66 CSA8200 & TDS8200 Series Quick Start User Manual
Set the oscilloscope trigger source (Trigger setup menu) to Internal Clock. Setting the trigger source to Internal Clock also
enables the INTERNAL CLOCK OUTPUT connector.
If you have a channel available for acquisitions (such as CH1), connect the oscilloscope end of the +branch of the
cabling/fixture you are deskewing to CH1, and the DUT end of the +branch of the cable to the INTERNAL CLOCK OUTPUT
signal on the oscilloscope. Note the position of the signal (e.g. save as a reference waveform). With the +branch done,
disconnect the +branch from CH1 (and terminate it properly). Now do the deskew measurement for the –branch the same
way as for the +branch. Now, adjust the fixture to remove the skew. (Refer to Methods to Adjust Out Skew on page 66.)
Using TDR Step (from spare TDR- capable module). Use the TDR step generation capability from a spare
TDR--capable module channel as the signal source (into your differential probe or circuit) — first for one branch, then for
the other.
Set the oscilloscope trigger source (Trigger setup menu) to Internal Clock. Turn on the TDR Step (TDR setup menu) and
set its Polarity to positive-going (i.e. rising) edge.
Using a TDR step rather than the Internal Clock Output is preferred in order to obtain better deskew accuracy in
high--speed systems (due to it’s faster edge).
Methods to Adjust Out Skew
Using a Phase Adjuster
Skew can be adjusted out with the use of a variable delay line (Phase Adjuster). Tektronix part number 015-0708-00 is a
Phase Adjuster with a 25 ps range and VSWR of 1.3:1 at 18 GHz.
The advantage of a Phase Adjuster is that it is functionally invisible. The disadvantage is that signal fidelity is slightly
impacted.
Deskew with the Acquisition System
� Repetitive Signal: This method relies on the fact that your signals are completely repetitive relative to the trigger of
your sampling oscilloscope. If, for each trigger, there is always the same signal (for example, always bit 4 of a PRBS7
signal), the oscilloscope can adjust the skew in a simple way (using channel deskew) where first the data is captured
with the timebase skew adjusted for one channel, then for the second channel. Most equipment can handle this
method of deskew. The number of triggers needed to fill the trace doubles relative to an un-deskewed acquisition
system.
More optimal performance can be obtained using modules with channel Delay capability or by using multiple modules.
(See the information regarding Deskew and Delay.)
Skew and Deskewing
CSA8200 & TDS8200 Series Quick Start User Manual 67
� Random Signal: Random signals are signals that don’t necessarily repeat on equivalent trigger events from
acquisition-to-acquisition. One example would be acquiring a random or pseudo-random serial data bit stream (for
example, a PRBS7 signal) while triggering directly on its associated serial clock (or from the data stream’s recovered
clock).
In the case of random signals, the oscilloscope must acquire each waveform sample of both differential branches from
exactly the same trigger event. Otherwise, due to the signal’s random nature, one of the samples of the differential pair
may have changed value (from an absolute, real-time perspective) and yield incorrect results when viewing the
mathematical differential or common mode waveform.
To ensure that random, differential or common mode signals can be properly time aligned, the TDS8200 and CSA8200
oscilloscopes allow the skew to be adjusted between individual modules by way of independent acquisition timebases
(not available in phase reference mode). This is called channel Deskew. In addition, some modules (e.g. the 80E06,
80E07, 80E08, 80E09, and 80E10) contain an additional, and highly useful, skew adjustment capability called channel
Delay.
While both deskew and delay allow you to compensate individual channels for skew differences introduced externally
from the instrument, they are implemented differently. Deskew is applied to the strobe drive of the module common to
both channels in the module. Therefore, when the deskew values differ between the channels within that module, the
instrument automatically performs separate acquisitions for each channel (on different sets of triggers) in order to
satisfy the requested deskew difference. On the other hand, delay is applied only to the individual channel (within the
module itself). Therefore, to retain maximum performance, keep the deskew values for both channels in a single
sampling module the same and use the Delay control if possible.
Differential TDR Deskew Method
The following procedure outlines a method to deskew a single differential (or common) mode system (one signal pair). This
procedure utilizes autoset features found in software version 2.5 and above. The procedure can be extended to additional
signals when appropriate TDR modules are used. Generally speaking, the dual-channel 80E10 and 80E08 TDR sampling
modules are most appropriate due to their capability to independently control both delay (for deskewing the acquisition of
signals) and TDR step deskew (for deskewing the generated TDR steps) for each channel.
The two major steps required to achieve a properly deskewed differential TDR system are:
� Deskew the acquired signals (Acquisition Deskew) — This time aligns the acquisition of the signals such that they are
sampled at precisely the same time.
� Deskew the TDR steps (TDR Step Deskew) — This time aligns the TDR steps such that the stimulus steps arrive at
the desired reference plane at precisely the same time.
Configuration/Setup Considerations
Before starting, there are two setup choices to be made:
� Reference Plane: This is the location at which you ultimately want both the acquisition signals and TDR steps to be
time aligned. Common choices for the reference plane include:
� The instrument front panel.
� The inputs to a DUT (Device Under Test) attached to cables.
� The inputs to a DUT within a fixture.
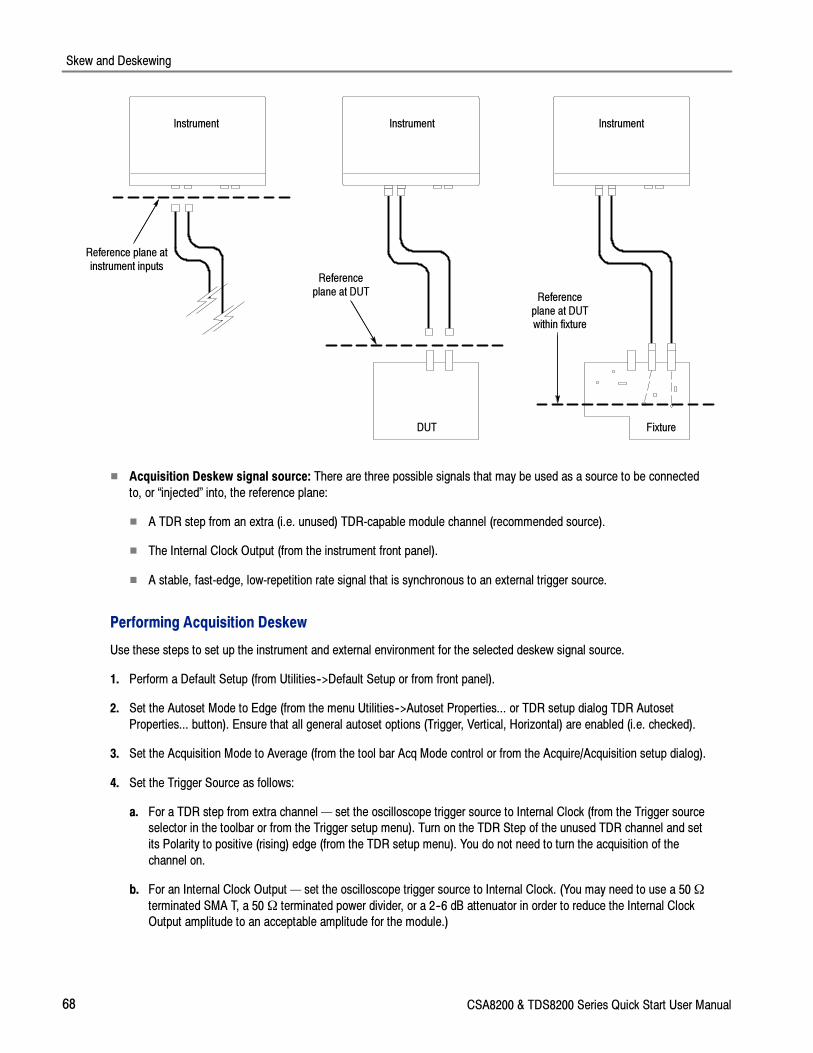
Skew and Deskewing
68 CSA8200 & TDS8200 Series Quick Start User Manual
FixtureDUT
Instrument Instrument Instrument
Reference plane atinstrument inputs
Referenceplane at DUT Reference
plane at DUTwithin fixture
� Acquisition Deskew signal source: There are three possible signals that may be used as a source to be connected
to, or “injected” into, the reference plane:
� A TDR step from an extra (i.e. unused) TDR-capable module channel (recommended source).
� The Internal Clock Output (from the instrument front panel).
� A stable, fast-edge, low-repetition rate signal that is synchronous to an external trigger source.
Performing Acquisition Deskew
Use these steps to set up the instrument and external environment for the selected deskew signal source.
1. Perform a Default Setup (from Utilities-->Default Setup or from front panel).
2. Set the Autoset Mode to Edge (from the menu Utilities-->Autoset Properties... or TDR setup dialog TDR Autoset
Properties... button). Ensure that all general autoset options (Trigger, Vertical, Horizontal) are enabled (i.e. checked).
3. Set the Acquisition Mode to Average (from the tool bar Acq Mode control or from the Acquire/Acquisition setup dialog).
4. Set the Trigger Source as follows:
a. For a TDR step from extra channel — set the oscilloscope trigger source to Internal Clock (from the Trigger source
selector in the toolbar or from the Trigger setup menu). Turn on the TDR Step of the unused TDR channel and set
its Polarity to positive (rising) edge (from the TDR setup menu). You do not need to turn the acquisition of the
channel on.
b. For an Internal Clock Output — set the oscilloscope trigger source to Internal Clock. (You may need to use a 50Ω
terminated SMA T, a 50Ω terminated power divider, or a 2--6 dB attenuator in order to reduce the Internal Clock
Output amplitude to an acceptable amplitude for the module.)
Skew and Deskewing
CSA8200 & TDS8200 Series Quick Start User Manual 69
c. For a fast edge, low repetition rate signal with synchronous trigger — connect the trigger signal to either the
TRIGGER PRESCALE or the TRIGGER DIRECT input.
5. Connect the deskew signal source to the reference plane of the 1st channel to be deskewed and turn that channel on.
6. Press Autoset (from toolbar above the graticule or from the front panel). A signal edge should be displayed near the
center of the graticule. Record the Horizontal Position value (lower right numeric control) as Time1.
7. If deskewing a module without channel delay capability (e.g. 80E04), save the waveform as a Reference waveform
(from File-->Save Waveform...). The saved Reference waveform is automatically turned on and displayed.
8. Connect the deskew signal source to the reference plane of the 2nd channel to be deskewed and turn that channel on.
Turn the 1st deskew channel off.
9. Press Autoset (from toolbar). A signal edge should be displayed near the center of the graticule. Record the Horizontal
Position value (lower right numeric control) as Time2.
10. If deskewing a module without channel delay capability (e.g. 80E04), then perform the following:
Compute Time2--Time1. If the result is positive, then set the channel Deskew (Vertical setup menu) for the 2nd
channel to the resulting difference. Otherwise, set the channel deskew for the 1st channel to the absolute value of the
difference.
11. If deskewing a module with channel delay capability (e.g. 80E10 or 80E08), then perform the following:
a. Turn on a Delay measurement (from the Measurement setup menu or the measurement toolbar (Pulse -->Timing
--> Delay)) with the 2nd channel as Source1 and the 1st channel as Source2, measuring between the rising edges.
b. Adjust one or both of the 1st and 2nd channel’s Delay (Vertical setup menu) until the delay measurement is
minimized (near zero). If the measurement can not be minimized sufficiently, then reset the Delay controls to zero
and use the Deskew control as described in step 10.
Performing TDR Step Deskew
Use these steps to set up the instrument and external environment for TDR Step Deskew.
1. Disconnect the deskew signal source and turn off both the Reference waveform and Delay measurement (if either is
on).
2. Provide an open or short termination at the reference plane for both channels.
3. Turn both channels on (if not already).
4. Set the Autoset Mode to TDR (from Utilities-->Autoset Properties... or TDR setup menu TDR Autoset Properties...
button).
5. Press AUTOSET (from toolbar above the graticule or from the front panel).
6. Select the other channel and press Autoset. Given reasonably matched cables to the DUT, both reflected edges at the
reference plane should be displayed near the 3rd horizontal graticule. If not, increase the Horizontal Scale until both
reflected edges are displayed.
7. Adjust Horizontal Scale (and Position, if necessary) such that the two reflected edges are visible and apart from each
other in order to obtain good horizontal resolution. A 10--100 ps/div horizontal scale is a typical target.
Skew and Deskewing
70 CSA8200 & TDS8200 Series Quick Start User Manual
8. Either visually, or by setting up a delay measurement between the channels, adjust the TDR Step Deskew (TDR setup
menu) to align the reflected edges.
The instrument should now be set up to accurately make differential or common mode TDR measurements.
NOTE. For future use with the same configuration ( the same instrument, modules, cables and/or fixtures), save the setup
(from menu bar File-->Save Setup As...).
Cleaning the Instrument
CSA8200 & TDS8200 Series Quick Start User Manual 71
Cleaning the InstrumentPeriodically you may need to clean the exterior of your instrument. To do so, follow the instructions in this section.
WARNING. Before performing any procedure that follows, power down the instrument and disconnect it from line voltage.
Exterior Cleaning
CAUTION. To prevent getting moisture inside the instrument during external cleaning, use only enough liquid to dampen
the cloth or applicator.
Clean the exterior surfaces of the chassis with a dry lint-free cloth or a soft-bristle brush. If any dirt remains, use a cloth or
swab dipped in a 75% isopropyl alcohol solution. Use a swab to clean narrow spaces around controls and connectors. Do
not use abrasive compounds on any part of the chassis that may damage the chassis.
CAUTION. Avoid the use of chemical cleaning agents which might damage the plastics used in this instrument. Use a
75% isopropyl alcohol solution as a cleaner and wipe with a clean cloth dampened with deionized water. (Use only
deionized water when cleaning the menu buttons or front-panel buttons.) Before using any other type of cleaner, consult
your Tektronix Service Center or representative.
Flat Panel Display Cleaning
The instrument display is a soft plastic display and must be treated with care during cleaning.
CAUTION. Improper cleaning agents or methods can damage the flat panel display.
Avoid using abrasive cleaners or commercial glass cleaners to clean the display surface.
Avoid spraying liquids directly on the display surface.
Avoid scrubbing the display with excessive force.
Clean the flat panel display surface by gently rubbing the display with a clean-room wipe (such as Wypall Medium Duty
Wipes, #05701, available from Kimberly-Clark Corporation).
If the display is very dirty, moisten the wipe with distilled water or a 75% isopropyl alcohol solution and gently rub the
display surface. Avoid using excess force or you may damage the plastic display surface.
Optical Connector Cleaning
When using optical modules, the measurement accuracy is increased (or maintained) by keeping the optical connectors
clean. It’s important to follow the procedures for cleaning optical connectors provided in the manual for your optical
module.

Cleaning the Instrument
72 CSA8200 & TDS8200 Series Quick Start User Manual
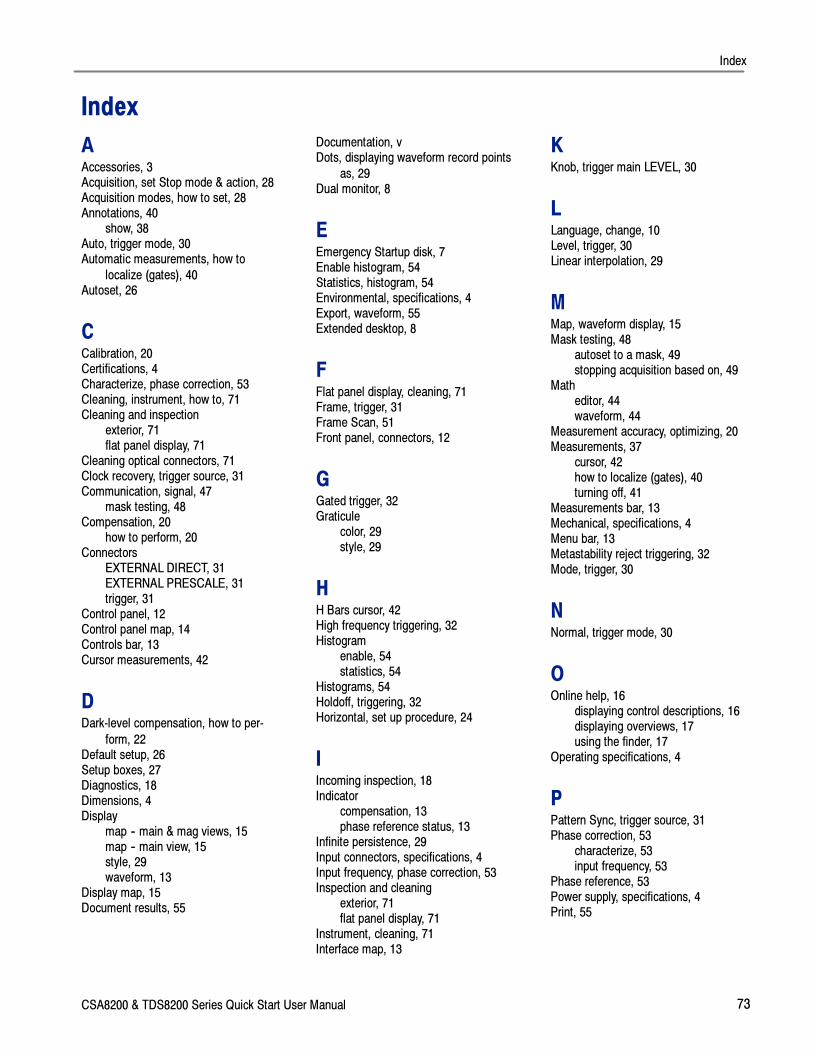
Index
CSA8200 & TDS8200 Series Quick Start User Manual 73
Index
AAccessories, 3Acquisition, set Stop mode & action, 28Acquisition modes, how to set, 28Annotations, 40
show, 38Auto, trigger mode, 30Automatic measurements, how to
localize (gates), 40Autoset, 26
CCalibration, 20Certifications, 4Characterize, phase correction, 53Cleaning, instrument, how to, 71Cleaning and inspection
exterior, 71flat panel display, 71
Cleaning optical connectors, 71Clock recovery, trigger source, 31Communication, signal, 47
mask testing, 48Compensation, 20
how to perform, 20Connectors
EXTERNAL DIRECT, 31EXTERNAL PRESCALE, 31trigger, 31
Control panel, 12Control panel map, 14Controls bar, 13Cursor measurements, 42
DDark-level compensation, how to per-
form, 22Default setup, 26Setup boxes, 27Diagnostics, 18Dimensions, 4Display
map -- main & mag views, 15map -- main view, 15style, 29waveform, 13
Display map, 15Document results, 55
Documentation, vDots, displaying waveform record points
as, 29Dual monitor, 8
EEmergency Startup disk, 7Enable histogram, 54Statistics, histogram, 54Environmental, specifications, 4Export, waveform, 55Extended desktop, 8
FFlat panel display, cleaning, 71Frame, trigger, 31Frame Scan, 51Front panel, connectors, 12
GGated trigger, 32Graticule
color, 29style, 29
HH Bars cursor, 42High frequency triggering, 32Histogram
enable, 54statistics, 54
Histograms, 54Holdoff, triggering, 32Horizontal, set up procedure, 24
IIncoming inspection, 18Indicator
compensation, 13phase reference status, 13
Infinite persistence, 29Input connectors, specifications, 4Input frequency, phase correction, 53Inspection and cleaning
exterior, 71flat panel display, 71
Instrument, cleaning, 71Interface map, 13
KKnob, trigger main LEVEL, 30
LLanguage, change, 10Level, trigger, 30Linear interpolation, 29
MMap, waveform display, 15Mask testing, 48
autoset to a mask, 49stopping acquisition based on, 49
Matheditor, 44waveform, 44
Measurement accuracy, optimizing, 20Measurements, 37
cursor, 42how to localize (gates), 40turning off, 41
Measurements bar, 13Mechanical, specifications, 4Menu bar, 13Metastability reject triggering, 32Mode, trigger, 30
NNormal, trigger mode, 30
OOnline help, 16
displaying control descriptions, 16displaying overviews, 17using the finder, 17
Operating specifications, 4
PPattern Sync, trigger source, 31Phase correction, 53
characterize, 53input frequency, 53
Phase reference, 53Power supply, specifications, 4Print, 55
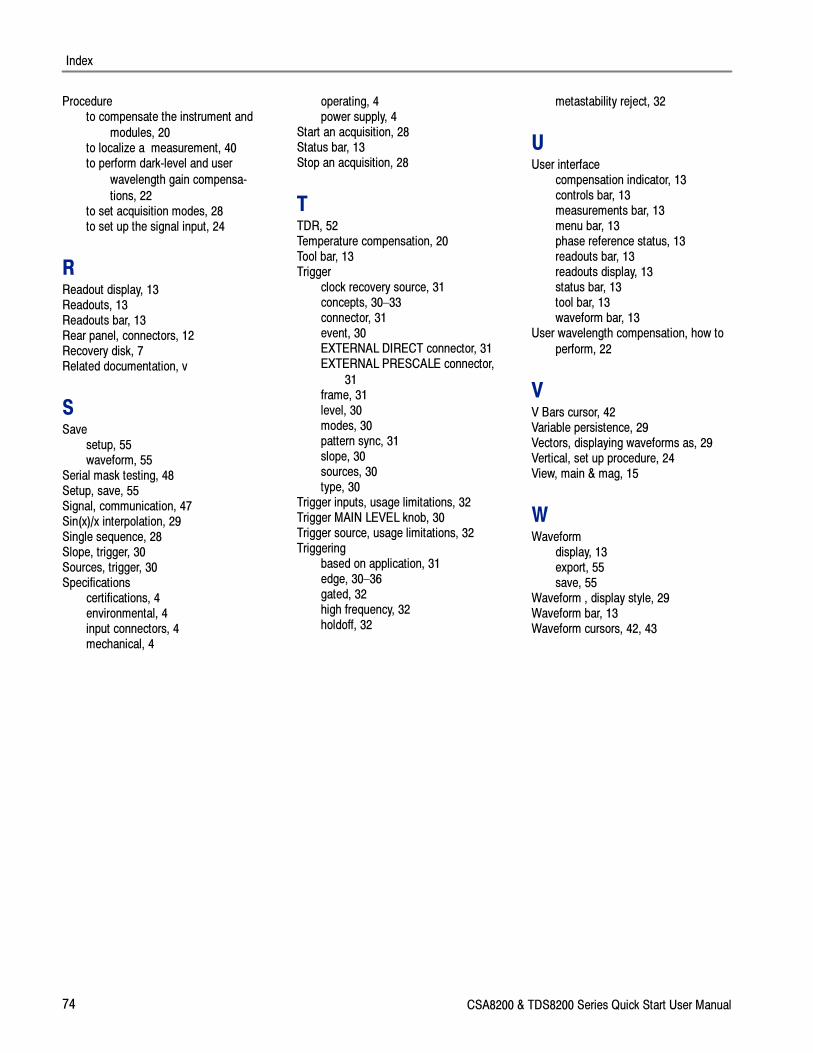
Index
74 CSA8200 & TDS8200 Series Quick Start User Manual
Procedureto compensate the instrument and
modules, 20to localize a measurement, 40to perform dark-level and user
wavelength gain compensa-
tions, 22to set acquisition modes, 28to set up the signal input, 24
RReadout display, 13Readouts, 13Readouts bar, 13Rear panel, connectors, 12Recovery disk, 7Related documentation, v
SSave
setup, 55waveform, 55
Serial mask testing, 48Setup, save, 55Signal, communication, 47Sin(x)/x interpolation, 29Single sequence, 28Slope, trigger, 30Sources, trigger, 30Specifications
certifications, 4environmental, 4input connectors, 4mechanical, 4
operating, 4power supply, 4
Start an acquisition, 28Status bar, 13Stop an acquisition, 28
TTDR, 52Temperature compensation, 20Tool bar, 13Trigger
clock recovery source, 31concepts, 30–33connector, 31event, 30EXTERNAL DIRECT connector, 31EXTERNAL PRESCALE connector,
31frame, 31level, 30modes, 30pattern sync, 31slope, 30sources, 30type, 30
Trigger inputs, usage limitations, 32Trigger MAIN LEVEL knob, 30Trigger source, usage limitations, 32Triggering
based on application, 31edge, 30–36gated, 32high frequency, 32holdoff, 32
metastability reject, 32
UUser interface
compensation indicator, 13controls bar, 13measurements bar, 13menu bar, 13phase reference status, 13readouts bar, 13readouts display, 13status bar, 13tool bar, 13waveform bar, 13
User wavelength compensation, how to
perform, 22
VV Bars cursor, 42Variable persistence, 29Vectors, displaying waveforms as, 29Vertical, set up procedure, 24View, main & mag, 15
WWaveform
display, 13export, 55save, 55
Waveform , display style, 29Waveform bar, 13Waveform cursors, 42, 43