crystal field spectroscopy by inelastic neutron scattering
TRANSCRIPT

Z. Phys. B - Condensed Matter 63, 213-230 (1986) Condensed Zeitschrift Matter f~r Physik B
�9 Springer-Verlag 1986
Crystal Field Spectroscopy by Inelastic Neutron Scattering
I. Single Ion Properties
B. Frick and M. Loewenhaupt Institut ffir FestkiSrperforschung, Kernforschungsanlage Jiilich, Federal Republic of Germany
Received October 14, 1985
We present a review of inelastic neutron scattering results on very diluted rare earth (RE)-Laves phases. A systematic investigation to study crystal electric fields, experi- enced by single rare earth ions in a metallic environment, was done on (RE, R)Ala, with RE = Pr, Nd, Tb, Dy, Ho, Er, Tm and R = Sc, Y, La. We show the influence of the 4f- ions on the crystal fields as well as the influence of the host lattices. The rare earth atoms in ScA12 have been studied for the first time and most of the other alloys, with LaA12 and YA12 as hosts, have been studied for the first time with magnetic atom concentrations below 1 a t% and/or with good resolution for low energy excitations. Furthermore we studied the dynamics of 4f-moments, which are coupled to the con- duction electrons by determining the coupling constants. We present a comprehensive set of crystal field parameters and coupling constants from these systematic studies and discuss them qualitatively within the available theoretical models. The influence of magnetic atom concentration on crystal field spectra will be shown in part II.
1. Introduction
The origin of crystal electric field (CF) potentials, in Rare Earth (RE)-metals or metallic alloys is not well understood, even if the activity in this field is enor- mous, as can be seen from several proceedings about this subject [2-6]. In most cases the CF- potentials are probed by measuring the CF-splitting, experienced by stable 4f-magnetic moments. From the experimental side several attempts have been undertaken to find a systematic behavior of the CF- parameters. For this purpose experiments have been carried out on 4f-compounds as well as on diluted 4f-alloys; the influence of either different hosts or different RE-atoms on the CF-potentials have been tested. Most theories start to explain the CF-para- meters from the simplified picture of a point-charge model and take the influence of conduction electrons only by corrections into account, as for example by screening or antishielding. In some cases the experi- mental parameters could be reproduced by this sim- ple method but often deviations were reported. Only one case is known, where it was tried to explain the
contribution of the conduction electrons to the CF- potential by a more elaborated method [7].
The lack of a proper theoretical model justifies a more extended study on this subject. We have cho- sen the model system system (RE, R)Ala, with RE =Pr , Nd, Tb, Dy, Ho, Er, Tm and R = L a , Y and Sc. The non-magnetic hosts LaA12, YA1 a and ScA1 a have the same cubic Laves-phase structure, but dif- ferent lattice constants (LaAla: 8.145&, YA12: 7.855 &; ScAla: 7.579 A). It is possible to substitute the R-atoms - located on sites with cubic point symmetry - by the magnetic lanthanide atoms, be- cause they are chemically equivalent. Electronic band structure calculations are available for LaA12 [8] and de Haas van Alphen measurements show no striking difference between LaA12 [93 and YA12 [31]. Thus one can hope to get additional infor- mation from the change of CF-potential as function of the R-atoms if RE is given, or as a function of the RE-atoms for given R-atoms.
We used inelastic neutron scattering, the most powerful spectroscopic method for metals, to study the CF-splitting of the RE-atoms. Some more ex-

214 B. Frick and M. Loewenhaupt: Crystal Field Spectroscopy by Inelastic Neutron Scattering. I
tended, earlier studies on these systems were done by inelastic neutron scattering, too, on either more concentrated systems [10, 11] or on the full com- pounds (see e.g. [12] and references there). Further- more ESR, specific heat, conductivity and magneti- sation measurements have been reported earlier. We used for our experiments magnetic concentrations which were below 1 at % of magnetic atoms in most cases. The necessity to use very low concentrations will become clear in part II. A short report from a part of these experiments has been given earlier [36, 37].
Beside the systematics of CF parameters we stud- ied the dynamical behavior of the stable 4f-moments coupled to the conduction electrons. This infor- mation is mainly deduced from the line widths of the CF-transitions.
First we summarize the fundamentals of the theoretical description of the CF-splitting for stable RE-atoms in a metallic environment. Then we will show how this can be measured by neutron scatter- ing. After experimental and sample details we pres- ent the results for Pr, Nd, Tb, Dy, Ho, Er and Tin, probing the CF in LaA12, YA12 and ScA12. A sum- mary and interpretation of the CF-systematics fol- lows. Furthermore we present the results of the dynamical behavior by giving the coupling constants between magnetic moments and conduction elec- trons.
2. T h e o r y
a) Crystal Field Theory
The Hund's ground state of a free 4f-ion, which is of (2J+l ) - fo ld degeneracy, shows a crystal field split- ting, i.e. partially removal of the degeneracy in an anisotropic surrounding. The classification of the ei- genvalues to the CF-Hamiltonian by irreducible rep- resentations F~ was done by Bethe [13]. We will not deduce the exact formalism but restrict ourselves to cubic symmetry for which the F~ are still partially degenerate and for which the CF-Hamiltonian for the RE3+,ion, after some transformations [14-16], can be written in the simple form:
HCF = W{xO4/F(4 ) -k (1 - tx]) 06/F(6)} (1)
with the CF-parameters x and W after Lea, Leask, Wolf (LLW) [16], with the constants F(4), F(6) (see Table l) and with 0 4 = 0 ~ and 0 6 = 0 o
2 4 m - 106, where O. are Stevens equivalent operators [14]. The LLW-parameter x weights the terms of 4th and 6th order, whereas W is a measure for the overall splitting. These parameters are usually de- termined by the experiment directly. They are con-
F n nected to the CF-parameters A , ( ) by the re- lations:
xW=ps F(4) A,~(r 4)
Table l. Important constants for the earth atoms to calculate crystal field parameters and coupling constants: S, L, J=quantam numbers for spin, angular and total angular momentum; gj=Land6 factor; fij, ?j=Stevens factors; (r")=mean values of the 4f-radial wavefunc- tions after Freeman and Desclaux [17]; operator constants F(4) and F(6)
S L J gj ~j x 10 4 yj x 10 6
La 3 + 0 0 0 0 - -
Ce 3§ 1/2 3 5/2 6/7 63.492 0
P~§ 1 5 4 4/5 - 7.3462 60.994
Nd 3+ 3/2 6 9/2 8/11 - 2.911 -37.988
Pm 3§ 2 6 4 3/5 4.0755 668.588
Sm 3§ 5/2 5 5/2 2/7 25.012 0
Eu 3§ 3 3 0 0 0 0
Gd 3§ 7/2 0 7/2 2 0 0
Tb 3+ 3 3 6 3/2 1.2244 - 1.1212
Dy ~§ 5/2 5 15/2 4/3 - 0,592 1.035
H & + 2 6 8 5/4 - 0,333 - 1.2937
E~ § 3/2 6 t5 /2 6/5 0,444 2,0699
Tm 3+ 1 5 6 7/6 1.6325 - 5.6061
Yb 3§ 1/2 3 7/2 8/7 -17_316 148.0
Lu 3+ 0 0 0 0 - -
F(4) F(6)
60 0
60 1260
60 2520
60 1260
60 0
60 1260
60 7560
60 13860
60 13860
60 13860
60 7560
60 1260
< ~ > 4 f < ~ > 4 f [A41 [A 61
0,3108 0,5118
0.2614 0.4030
0,2282 0,3300
0.1991 0.2755
0.1772 0,2316
0.1584 0.1985
0.1427 0.1720
0.1295 0.1504
0.1180 0.1328
0.1081 0.1181
0,0996 0.1057
0.0921 0.0953
0.0854 0.0863

B. Frick and M. Loewenhaupt: Crystal Field Spectroscopy by Inelastic Neutron Scattering. I 215
and (2)
(1 - Ixl) W = ~/j F(6) A 6 (r6).
The CF-parameters A,, which are the expansion coefficients to the CF-potential of the lattice, are of main interest. It is however not possible to get them directly, independent of the properties of the 4f-ion, because the radial distribution of the 4f-wave- function (r") must be taken from theoretical calcula- tions. We used here the relativistic calculations from Freeman and Desclaux [17]. Their values, the constants F(n) and the Stevens coefficients [14] fls, 7s are tabulated in Table 1. Often the CF-parameters B, are used, which are defined by Bg=fldAg(r 4) and B 6 =)~sA6(r6).
b) Dynamics
For the description of the dynamical behavior of the 4 f moments coupled to the conduction electrons we apply the theory of Becker, Fulde and Keller (BFK) [18], which takes the coupling of the magnetic mo- ment to the conduction electrons into account:
S --~ HCF q- H ~ + Hkr (3)
The additional Hamiltonian Hr describes the con- duction electron system and Hkl stands for the iso- tropic exchange interaction between the magnetic 4 f moment and the conduction electrons. From this Hamiltonian (3) the dynamic single ion susceptibility u(r") of the magnetic moment was calculated [18]. The coupling strength is described by the exchange coupling constant:
P = (gs - 1) N(Ev) Jex (4)
with gs=Land6 factor, N(Ee)=density of states at the Fermi energy for the conduction electrons and Jex = exchange integral. The Land6 factors ga- can be found in Table 1.
The scattering law is simply related to the imaginary part of the dynamic susceptibility )(':
S (Q, co) ~ 1/(1 - exp ( - fl h co)) z" (Q, co) (6)
with fi = (k s T) -1. The poles of the susceptibility lead to excitations which can be observed in the inelastic neutron energy gain or loss spectrum. The observed intensities are given by the transition probabilities for magnetic dipot transitions between two CF-states F~ in the case where the excitation energies do not overlap. For unpolarized neutrons one can write the scattering function for the paramagnetic scattering of magnetic atoms as [19]:
S(Q, co)= N(1/27re) a
fZ(Q) g2 ~ p,l(nlJ• (7) n , m
with N = number of magnetic atoms, f(Q) = magnetic form factor, 7= 1.913 the neutron g-factor and r~ the classical electron radius; In) and Im) are the eigen- functions of the CF-Hamiltonian, p, the thermal oc- cupation probability and J l is the component of the total angular momentum operator perpendicular to Q.
In the case of large line widths compared to the excitation energy, usually for high coupling con- stants p or higher temperatures, the observed exci- tation spectrum cannot be described by Hcv only and for example the BFK-theory [18] must be used. In this theory it is, e.g., shown that the intensity can be transferred from the inelastic to the elastic region and that inelastic CF-excitations can shift with in- creasing temperature towards the elastic line.
Using BFK-theory it is necessary that single ion behavior is ensured because only then the replace- ment of Z" by u'(r") is justified. This is not the case, if magnetic moment interaction comes into play (this will be shown in part II). Thus it is important to use samples with low concentrations of magnetic atoms, in order to apply BFK-theory or HCF only, without taking additional interactions into account.
c) Connection to Neutron Scattering
The scattering law S(Q, co) is proportional to the neutron scattering cross section, where Q and co are the momentum and energy transfer of the neutrons, respectively:
d 2 G
dO dr . = kz/k~ s(o , co), (5)
where k I and k~ are the final and initial neutron wave vectors after and before the scattering process.
3. Experimental Details
All experiments presented here, have been carried out on the neutron time-of-flight instrument IN6, ILL Grenoble, which is located at the cold source. We used, if not mentioned otherwise, the incident energy of E o = 3.14 meV, leading to an elastic resolu- tion of 90 peV (FWHM). A few measurements were done with Eo=2.35 meV and 4.8 meV, yielding re- solutions of 42 bteV and 130 geV (FWHM), respec- tively. As this is a time-of-flight instrument which is time focusing, the resolution changes with energy
216 B, Frick and M. Loewenhaupt: Crystal Field Spectroscopy by Inelastic Neutron Scattering. I
transfer and this was taken into account in our least-squares-fit [20]. As no dependence on momen- tum transfer Q is present for single ion magnetic excitations - except the magnetic form-factor depen- dence - we summed up most of the 337 detectors, covering a Q-range for elastic scattering of 0 . 2 7 ~ - l < Q < 2 . 0 A - t for Eo=3.14 meV. Typical measuring times were of the order of one hour. The statistical error is roughly given by the scatter of the data points of the spectra shown in this paper (part I and part II).
The measured spectra, which we show below, are usually normalized per magnetic atom. In several spectra for the polycrystals we find an instrumental
spurion around 0.4 meV, which belongs presumably to an indirect scattering of a nuclear bragg intensity. For this reason i t is also present in the non-mag- netic spectra of polycrystals LaA12, YA12 and ScA12 and not for single crystals. This spurious intensity is only present at the energy loss side and can thus be separated by assuming detailed balance for the true scattering from the sample.
All spectra are corrected for absorption, back- ground scattering, detector efficiency and are cali- brated, if possible, to absolute intensities by a va- nadium reference measurement. After this the time- of-flight spectra are converted into an energy scale and we will show spectra where the scattering law is
Table 2. Samples of RE~RI_,A12, which have been studied in this work. pc=polycrystal, sc=single crystal, E i = incident neutron energy, RT= room tern 9erature
Sample
(Pr,La)AI2 (Pr,Sc)AI2
(Nd,Sc)AI2
(Tb,La)AI2
(Tb,Y)AI~,
(Tb,Sc)AI2
(Dy,La)A12 (Dy,Sc)AI2
(Ho,La)AI2
(Ho,Sc)AI2
(Er,La)AI2 (Er,Y)AI2 (Er, Sc)AI2
(Tm,La)AI2
type
PC PC
PC
SC SC SC SC SC SC SC SC PC PC
PC PC
PC PC PC PC
PC SC SC
SC
magn. conc. E, temperatures c [meV] [K]
001 3.14 15, 25, 100, 200, RT 0.02 3.14 10, 25, 50, 100, 200, RT
0.02 3.14 25, 80, 120, RT
0.001 0.003 0.01 0.02 0.04 0.06 0.15 0.003 0.01 0.04
0.005 0.01
0.001 0.01 0.04 001
0.003 0.003 0.02
0.003
(TmY)AI2 (Tm,La)AI2
(Tm,La)AI2 (Tm,La)AI2 (Tm,La)AI2 (Tm,Sc)AI2
SC PC
PC PC PC PC
0.003 0.01
0.02 0.04 0.06 0.02
3.14 3.14 3.14 3.14 1 3.14 1 3.14 1 3.14
3.14/4.8 3.14
3.14 3.14
3.14 3.14 3.14
3.14
3.14 314 3.14
4.8 3.14 2.54 2.54 3.14 3.14 4.8
3.14/4.8 3.14/4.8 3.14/4.8
3.14
1.5, 3.5, 10, 25, 50, 100, RT 20, 40, 60, 80, 120, 160 1.5, 50 1.5, 50
.5, 5, 50
.5, 50 ,5, 5, 50
1.5, 5, 10, 20, 40, 110, 180, RT 1.5, 5, 10, 25, 50, 100, RT/1.5, 10, 25, 50 1.5, 5, 10, 25, 50, 100
1.5, 5.5, 10, 30, 50 1.5, 5, 10, 25, 50, 100, RT
1.5, 3, 5, 10, 50 1.5, 3, 5, 10, 50, 100, RT 1.5, 5, 10, 50 2, 10, 25, 50, 100, RT
1.7, 5, 10, 15, 20, 25, 30, 40, 45, 50, 70, 100, RT 1.5, 5, 10, 30, 50, 75, 100, RT 1.5, 20, 50, 90
1.5, 25, 50 2.4, 10, 16, 30, 40, 70, 100, RT 0.5, 0.8, 1.34, 1.5, 2, 2.5, 2.95, 3.2, 4,5,6,7,8.5, 12.5 1.5, 5, 10, 20, 50, 100, RT 1.5, 5, 10, 25, 50, 100 1.5, 25 1.5, 5, 10, 25, 50, 100/1.5, 25 1.5, 5, 10, 25, 50, 100/1.5, 25 1.5, 5. 10, 25, 50, 100/1.5, 5, 10, 25 1.5, 20, 80

B. Frick and M. Loewenhaupt: Crystal Field Spectroscopy by Inelastic Neutron Scattering. I 217
plotted against the energy transfer (energy gain (loss) means energy gain (loss) for the neutrons; negative sign is used for energy gain).
The full lines, drawn in the following pictures, belong to least-squares-fits by the BFK-theory, with exchange coupling if not mentioned otherwise, in- cluding the nuclear elastic scattering and the phonon scattering. The spectra for higher temperatures (T>50 K) are often shown with an interrupted en- ergy scale in order to show also the phonon scatter- ing, which we usually found above 10 meV, well separated from magnetic scattering.
4. Sample Preparation
All samples were prepared first as polycrystals by at least three melting procedures in a water-cooled Cu boat, heated by an induction furnace under argon pressure of about 800-1,200 Torr. The polycrystals have been broken into several pieces and arranged for the next melting procedure in a different manner to improve homogeneity. The starting materials were A1 of quality 5N and lanthanides, Sc and Y of quality 4N, which were composed stoichiometrically before melting and checked for weight loss after- wards. The weight loss was less than 0.1 w-%.
For the single crystals, drawn by Czochralski- method [21], we used polycrystals as a starting ma- terial prepared as described above, In Table 2 the studied samples with concentration of magnetic atoms can be found. In the further colums we list the incident neutron energies and the temperatures studied.
5. Experimental Results
We will present i) our experimental results for each sample, and ii) compare them with earlier measure- ments. For the least-squares-fits we used the level schemes shown in Fig. 16 and the CF-parameters given in Table 3. Of course these CF-parameters de- scribe the spectra for one system at all temperatures studied, Here we can only show a selection of the numerous measured spectra (Table 2).
Pro.01Lao.99A12 i) We find at T=1.5 K one magnetic CF-transition at 0.23 meV in the energy loss of the neutrons (Fig. 1). With increasing temperature this transition broadens to quasielastic magnetic scattering (T =25 K), which remains up to room temperature. Further inelastic transitions could not be found as a
Table 3. Summarized experimental results for the CF-
} ScAI2 Pr YAI2 [101
LaAI2
Nd
Tb
Dy
Ho
Er
)arameters and
Tm
} ScAI2 YAI2 [ 101 LaAI2 [ 1 1 ]
ScAI2 YAI2 LaAI2
ScAI2 YAI2 [ 10] LaAI2
ScAI2 YAI2 [ 10] LaAI2
} ScAI2 YAI2 LaAI2
ScAI2 YAI2 LaAI2
the coupling constants
x W [K]
0.59(2) -3.00(10) 0,732 (20) -3,758 (110) 0.85(5) -5.7/-2.4
-0.28 (2) 2.27 (20) -0.403 (15) 2.14(11) -0.58 (8) 1.76 (6)
0.58 (2) 0.22 (2) 0.80 (4) 0.29 (3) 0,90(10) 0.30(10}
0.273 (10) -0.165(10) 0.430 (10) -0.164(6} 0.680(20) -0.11 (2)
--0,179(5) 0.163(10) -0.310(15) 0.164(12) -0,495(10) 0.107(5)
-0.195(10) -0.245(10) -0.313(5) -0.256(5) -0.51 (I) -0.19(1)
0.40(1) 0.48(1) 0.53(1) 0.53(1) 0.72 (1) 0.47 (2)
A4 < r4 > As<r6> [K] [K]
40.16 (150) -15.61 (52} 62.43 (170) -13.10 (38)
110/55 -11/-5.5
36.39 (260) -16 .8 (15) 49.38 (300) -13 .3 (8) 58.44 (800) - 7.7 (10)
17.37 (20) -10.9 (4) 31.58 (36) - 6.8 (8) 36.75 (100) - 3.5 (12)
12.6890) - 8.4(6) 19.85(86) - 6.5(3) 21.06 (65) - 2.45 (45)
14.60(98) - 7.5(5) 25.44 (220) - 6.3 (5) 26.51(130) - 3.0(2)
17.93 (90) - 6.87 (30) 30,08(75) - 6.1 (2) 36.37 (200) - 3.2 (2)
19.60(5) - 6.68(20) 28.68 (76) - 5.9 (2) 34.55(155) - 3.1 (1)
A 4 A~ [meV A -4] [meV A -6]
13.24 -3.34 20.59 -2,80 36.3/18.1 -2.3/-1.2
13.66 -4.39 18.65 -3.49 22.1 -2.02
11.56 -6.25 22.02 -3.92 24.47 -2.03
9.26 -5.43 14.50 -4.23 15,38 -1.59
11.65 -5.45 20.29 -4.61 21.14 -2.20
15.52 -5,6 26.03 -5.0 31.48 -2.6
18.34 --6.04 26.84 -5.32 32.33 -2.81
p'
0,090 (2O)
0.060 (10)
0.040 (10) 0,O35 (5) 0,034(4)
0.028 (5) 0.033 (6) 0.040 (10)
0,024 (2) 0,031 (3) 0.031 (3)
0,031 (3) O.033 (2) 0,033(3)
0,048 (12) 0.055 (5) 0.060 (5)

218 B. Frick and M. Loewenhaupt: Crystal Field Spectroscopy by Inelastic Neutron Scattering. I
3 0 0 0 I I J I I I I I
o Pr '~
~. T = 1 . 5 K
�9 , , ; - > ,,~
0 ~--- - - q ~ " ~ - l l = m l " - - " l f i l l I I I I I % " " I
-1.25 -0.75 -0.25 0 0.25 0.75 1.25 energy transfer ~u[meV]
3000 I I I
Pro 1 LomAt z
T = 25K
1 I
" j - 1 . 2 5 - 0 . 7 5 I - 0 - 2 5 ;
.00%_ I I i I i - - - i
0.25 025 1.25 energy transfer ~cu[meV]
Fig. 1. Inelasdc neutron spectra for Pro.olLao.99A12 at T = t . 5 K and T= 25 K
200
E
100
5-~
E
0
I [ I [ 1 [ L I I
ProzSC.98At 2
T=50 K
9 :~o- - ' - -~ ' -2'o ' -~o -~ 4 -~ -~
e n e r g y t r a n s f e r ~ w [ m e V ]
I I I I i ] i I I I I I
Pr.ozSC-gBAt2
T= 100 K _
e o a �9 e ~
J �9 , r , , , , 111 , , , ,
- L 0 - 3 0 - 2 0 - I 0 - 8 - 6 - 4 - 2
ene rgy f r a n s f e r ~ w [ m e V ]
t
i
Fig. 2. Inelastic neutron spectra for Pro,02Sc0.gaAl 2 at T=1.5 K and at T= 100 K
significant scattering intensity. We can allow mag- netic scattering around ( -8+_2) meV (very weak) and at (-19_+1) meV (more pronounced, but in between the phonons). However, statistics is too poor for a clear statement. We can give no unam- biguous solution for the CF-parameters. We suggest x =0.85(5) and W = - 2 . 4 K if we take the 0.23 meV and the 8meV line or W - - - 5 . 7 K if we take the 0.23 meV and the 19 meV line. No solution is possi- ble where all three transitions are allowed.
ii) Measurements on a 10 at-% sample [11] re- port a CF-transition at 8.5 meV. No CF-parameters are given.
Pr0.o2Sc0.98 A12 i) We observe for T = I . 5 K (not shown here) no inelastic intensity up to about 2.5 meV energy loss. Also quasielastic scattering intensity could not be found at low temperatures. At T=25 K a magnetic line appears around - 4 . 8 meV (shown for T=5 0 K in Fig. 2), which remains clearly present up to T = 1 0 0 K . At T = 2 0 0 K (not shown) the magnetic intensity is smeared out and only a broad hump between the dominating phonons and the elastic line is present. As can be seen from Fig. 2 the fit with the parameters in Table 3 is not satisfactory, but
somewhat better than for another possible CF-pa- rameter set: x =0.20, W= - 1 . 0 K. From the temper- ature dependence of the -4 .8 meV line and the absence of further magnetic scattering at low tem- peratures we recommend the CF-parameters given in Table 3. The relatively large concentration of Pr- ions together with a large coupling constant may be the origin of the observed additional peaks.
ii) No other measurements are known.
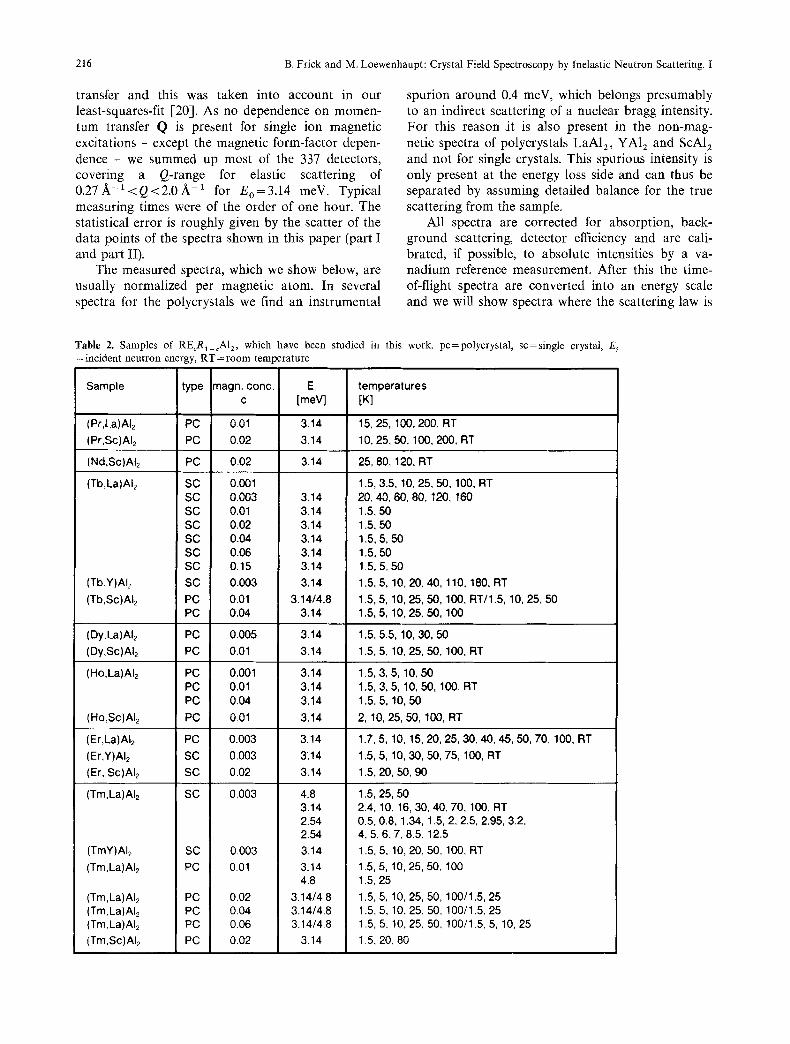
Ndo.02Sco.98A12 i) No CF-transitions are found at T=l .5 K and 25 K, neither in the energy gain up to - 1 0 meV, nor in the energy loss up to 2,5 meV for neutrons. But at 7"=80 K and T = 120 K we observe two in- elastic lines at - 8 . 2 meV and -9 .9 meV. These two lines are shown in Fig. 3 for T=120 K. The domi- nating inelastic intensity around - 2 0 meV and - 2 5 meV (quadratic points) consists mainly of phonon- scattering and hides a further weak CF-transition at 18 meV, as fits reveal. At room temperature the CF- transitions are smeared out, giving only a broad hump between the phonons and the elastic line.
ii) No reference measurements are known for this system from the literature.
B. Frick and M. Loewenhaupt: Crystal Field Spectroscopy by Inelastic Neutron Scattering. I 219
-40 -3tO -20 -10 200 I i I i I I I I I
NdozSCgo A [ z . .
j T = 1 2 0 K
2~) I I I I i i I I I -- --16 --12 --8 --4
energy I'rQnsfer JfiuJ[meV]
Fig. 3. inelastic neutron spectra for Ndo.o2Sco.98Al z at T= 120 K
E o
d .E N
e
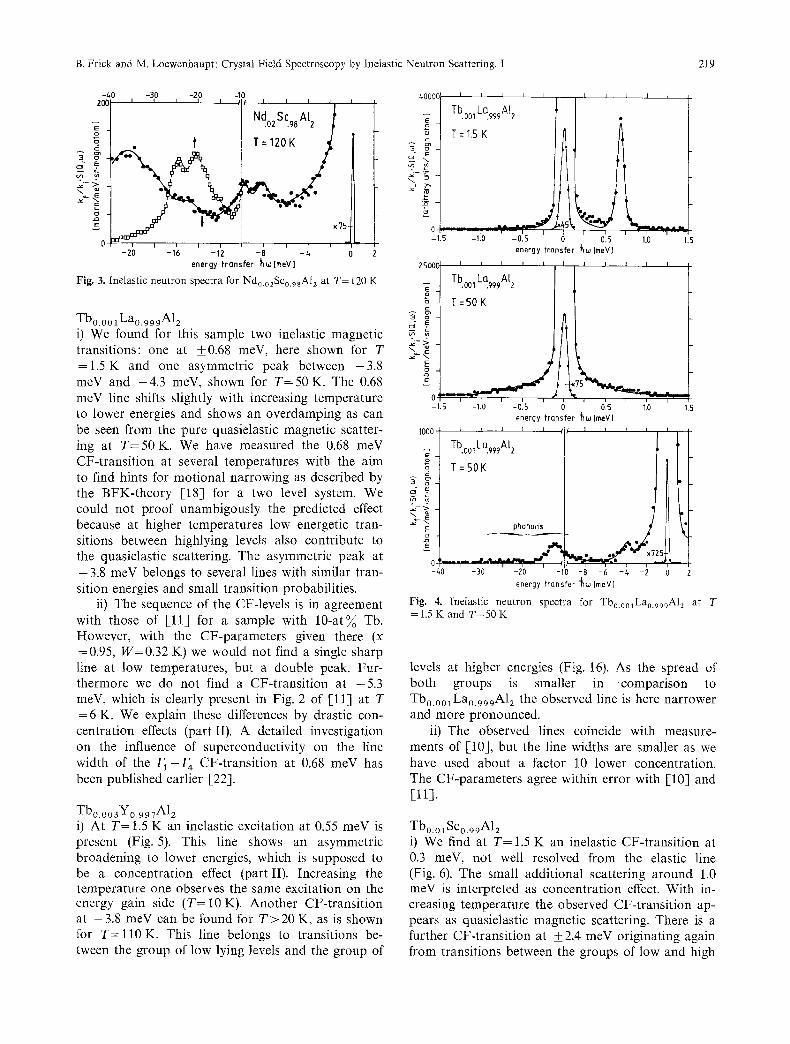
Tb0.o01Lao.999A12 i) We found for this sample two inelastic magnetic transitions: one at _+0.68 meV, here shown for T =1.5 K and one asymmetric peak between -3 .8 meV and -4 .3 meV, shown for T = 5 0 K. The 0.68 meV line shifts slightly with increasing temperature to lower energies and shows an overdamping as can be seen from the pure quasielastic magnetic scatter- ing at T = 5 0 K . We have measured the 0.68 meV CF-transition at several temperatures with the aim to find hints for motional narrowing as described by the BFK-theory [18] for a two level system�9 We could not proof unambigously the predicted effect because at higher temperatures low energetic tran- sitions between highlying levels also contribute to the quasielastic scattering. The asymmetric peak at -3 .8 meV belongs to several lines with similar tran- sition energies and small transition probabilities.
ii) The sequence of the CF-levels is in agreement with those of [11] for a sample with 10-at~o Tb. However, with the CF-parameters given there (x =0.95, W=0.32 K) we would not find a single sharp line at low temperatures, but a double peak. Fur- thermore we do not find a CF-transition at -5 .3 meV, which is clearly present in Fig. 2 of [11] at T =6 K. We explain these differences by drastic con- centration effects (part II). A detailed investigation on the influence of superconductivity on the line width of the F 1 - F 4 CF-transition at 0.68 meV has been published earlier [22].
Tbo.oosYo.997A12 i) At T= 1.5 K an inelastic excitation at 0.55 meV is present (Fig. 5). This line shows an asymmetric broadening to lower energies, which is supposed to be a concentration effect (part II). Increasing the temperature one observes the same excitation on the energy gain side (T=10 K). Another CF-transition at - 3 . 8 meV can be found for T > 2 0 K, as is shown for T = l l 0 K. This line belongs to transitions be- tween the group of low lying levels and the group of
~0000 i_
$5
~
I I I I I I I
Tb'~176 L~ I T=I.5 K ~~~
�9 I '0 v --0'5 I ~ I 015
energy transfer Jfiw [meV}
250@
\ oJ
J I I
1.0 1.5
I I I I I I I I I I I
Tboo 1 Lo999A[ 2 T=SOK
x75
-,.5 -,io -o'.5 o o.s 1.o ,.5
energy t r a n s f e r ~Tw [meV] 1000 I l 1 1 t I 1 1 p
-~ Tb.om L~ 2 I
T=50K ~.~ t n m
~ . ea
E phonons
I
i i i - i -40 -3'0 -20 - I 0 -8 - 6 - 4 - 2 2
energy t r a n s f e r J~w [meV]
Fig. 4. inelastic neutron spectra for Tbo.001Lao.999A12 at T =1.5K and T=50K
levels at higher energies (Fig. 16). As the spread of both groups is smaller in comparison to Tbo.001Lao.999A12 the observed line is here narrower and more pronounced�9
ii) The observed lines coincide with measure- ments of [10], but the line widths are smaller as we have used about a factor 10 lower concentration. The CF-parameters agree within error with [10] and [11].
Tbo.olSco.99A12 i) We find at T= 1.5 K an inelastic CF-transition at 0.3 meV, not well resolved from the elastic line (Fig. 6). The small additional scattering around 1.0 meV is interpreted as concentration effect. With in- creasing temperature the observed CF-transition ap- pears as quasielastic magnetic scattering. There is a further CF-transition at _+2.4 meV originating again from transitions between the groups of low and high

220 B. Frick and M. Loewenhaupt: Crystal Field Spectroscopy by Inelastic Neutron Scattering. 1
t~O00
2 o
E e~
I i I I I
Tb.00~Yg~Tal ~
T : 1.5K
i I I I I
' o ' . s ' ~'.o ,.s -1.5- -1.0 -0.5 0 energy t r a n s f e r ' h w [ m e V l
2 0 0 0 I I i i I i i ~ I
k I . . d .E
0 [ i i i i i
-t.s -i.o -o.s o'.5 ~io 1.5 energy t r a n s f e r h w [ m e V ]
300 i i i i i i I ~ . I I r i
~ ' Tb.oo3Y997 kl 2 o
"~ T:110 K I ~ / ~ ~ phon0ns _
.o
-L,O -30 -20 -I0 -B -6 -t+ -2 energy transfer ~[meV]
Fig. 5. Inelastic neutron spectra for Tbo.oo3Yo,99~Al 2 at T= 1.5 K, T=10K and T=l l0K
15000 I I I . q L q I J I I I
~ Tb~ A[2 I
~. T : 1 5 K
_ ~ - > \ m
r - - - r - - - r
- 1 .5 - l .O - 0 . 5 015 I:0 1.5 energy t r a n s f e r ~ w [ m e V ]
15000 L I i I I i I .... I I I I
- TboiSC99A[2
" -~ ,
E
r - l l - 1 .5 -110 -0' .5 0.5 1.0 1.5
ene rgy t r a n s f e r "~a [meV]
90~ I I I I I ! I
- TbolSCggA[ 2 E " �9 o
"~ T: IOOK E d ..
~ - >
~ phonons
0 - - - " 3 f i i ~ - , - -
- ~ 0 - 3 0 - 2 0 - t 0 - B - 6 - 4 -2 energy t r a n s f e r ~Sw[meV]
F i g . 6. Inelastic neutron spectra Tbo.o~Sco.99A12 at T=l.5 K, T =25 K and T=100 K
lying levels. It is shown for T = 100 K on the energy gain side together with the phonons.
ii) This system has not been studied before.
DYo.oosLao.995Alz i) We find two inelastic lines: one at +0.35 meV and one around - 3 meV (Fig. 7). The 0.35 meV line is clearly visible only at low temperatures, here shown for T = 10 K. It broadens to quasielastic scat- tering for more elevated temperatures. The line near - 3 meV is shown for T= 50 K. Our fits reveal that it consists of several lines at - 3 . 9 meV, -3 .3 meV and at -2 .65 meV.
ii) Measurements on a 10 at-~o sample by 1-11] also show the peak around 3 meV. The CF-parame- ters given in [11], however, cannot explain the 0.35 meV line and the shape of our peak around - 3 meV.
DYo.01Sco.99A12 i) For T = 1.5 K and T= 10 K the excitation spectra consist only of elastic intensity and magnetic qua- sielastic scattering, which broadens with temperature (Fig. 8, T = 1 0 K). At T=25 K several inelastic tran- sitions appear at +__1.6 meV, - 2 . 5 meV and -3 .5 meV. These CF-transitions broaden to quasielastic scattering at higher temperatures. The small discrep- ancies between single ion fit and data points are possibly a consequence of level splitting (part II) !
ii) No other measurements are known.
Hoo.o 1Lao.99A12 i) A sharp CF-transition line is found for T= 1.5 K at ___0.3 meV (Fig. 9). The line broadens with tem- perature and appears at T = 5 0 K as quasielastic magnetic scattering. From this temperature up to room temperature we find in the energy gain at -3 .8 meV a further inelastic peak, shown here for T

B. Frick and M. Loewenhaupt: Crystal Field Spectroscopy by Inelastic Neut ron Scattering. I 221
~,000
= 3000
" 5 2 0 0 o
"- 1000
i i
DYo.oos LaO.995 ALz
T:IOK
{
o
-1.2 -O.fl -0./,
i i i
0 0./, 0.8 1.2 energy transfer "hw [meV]
I~ ' ' ' ~ I I
,oo I
]Ill - 6 - / , -2 0 2
energy transfer I ~ [rneV] Fig. 7. Inelastic neutron spectra for Dyo.oosLao.99~A1 ~ at T - 10 K and T= 50 K
I0000
~ - L - ~ _
E
1.5
2000
E o c~
- - r :3 o
d 9 t~ m
c
E
0 -6
I J I I I I I I I I
DYo~SCggA[ 2
T=IOK
I i l t i i I i i
1.0 0.5 0 0~.5 T.O 1.5 energy transfer ~w[meVI
I I I I I I I I
DY'~ I
T=25K
o I i - i i I i i i
-/+ -2 energy fransfer "~w[meV)
I I
..575
, I i
Fig. 8. Inelastic neutron spectra for Dyo.otSco.99A1 z at T = 1 0 K and T= 25 K
I0000
c~
d d E
" " E
E
0 -
-1.5
I I 1 i 1
H~ L%9 At z
T=1.5 K
- -- : - - - - ' -,'0 ' . . . . ~0~ ~ ' -
I
_ H~ At 2
T= 50 K
d a e - >
0 l i l l i i - 1 . 5 - I , 0 - 0 . 5
I I I I
o
500 i I i
- H0.oILa.99 A[ z E o
T= 100 K
<:3 E
_~-# \
~ phonons c L o
i I -z,O -3'0 -2'0 -10
o energy transfer Jh6J[meVl
I I I I I
i i i
-8 -6 -/* -2 e n e r g y t r a n s f e r t l w [ m e V ]
0.5 1.0 1.5
r
t
Fig, 9. Inelastic neutron spectra Hoo.olLao.99Al 2 at T = 1.5 K, T =50 K, and T=100 K
=100 K. We will discuss in part II the small ad- ditional peaks in the 1.5 K spectrum at 0.68 meV, 1 meV and 1.3 meV.
ii) A sample with 10 -a t~ Ha was studied pre- viously [11]. Only one inelastic transition at 3.9 meV observed, which corresponds to our - 3 . 8 meV peak. No CF-parameters were given.
H O o . o l S c 0 . 9 9 A 1 2
i) At T = I . 5 K and T = 1 0 K we observe at +2.4 meV a CF-transition (not shown). At T = 1 0 K a further inelastic line arises near the elastic line at _+0.33 meV. It is seen as a shoulder for T = 2 5 K (Fig. 10) and becomes quasielastic at higher tempera- tures. At T = 100 K we observe in the energy gain several CF-transitions at - 2 . 4 meV, - 4 . 3 meV, - 6 . 4 meV and at - 9 .1 meV. All these lines and their relative and absolute intensities can be ex-

222 B. Frick and M. Loewenhaupt: Crystal Field Spectroscopy by Inelastic Neutron Scattering�9 I
20000
E
0 ~ -1.5
I 1 1 I I
H~
T:25 K
___./ i i i I
- I . 0 - 0 . 5
3 c}
N ad~>
0 r : -1.S
150(
E o
E
E
Y
I I 1 1
' 0'5. ' ' ' 1.0 e n e r g y t r a n s f e r ~ l ~ [ m e V )
I l I I I I I I I ] I
H~ 2 . .
T=IOOK ~,"'"~L
/ ~xm
J im*~ ' -I.'o ' -o'.5 ' ' ' o15 ' I.o
! I
o -z~O
0 energy transfer ~ta[meVl
i I I I I / / I i I
Ho.o I So.99 A~ 2
T= 100 K
phonons _~ ,~ i,m . . . . . . .~- ' - - ~ , , . , ~ ~,~
- - - q . . . . i - i i i - , r, 1 l 1 -30 - 2 0 -10 - 8 -6 -/+
e n e r g y h r a n s f e r f ~ w [ r n e V ]
1.5
1.5
Fig. 10. Inelastic neutron spectra for Ho0.olSco.99At z at T=25 K and T= 100 K. The dashed line in the middle figure shows the magnetic contribution to the scattering intensity
25000 I I I I I 1 1 L l I 1
d E
_~-S-
c
E
e I - - I i i I i i r i - - r -
-1.0 -05 0 0.5 1,0 e n e r g y t r Q n s f e r ~ ( # [ m e V ]
ZOOOOj i , , , 'I "i ; i , I -~ Eroo)L~ /
~ { ; , ~ magnet ic B F K )
1 T : 5 K / [ il--total
t ' , :=~ I 1, , �9 , \ ,' ,
- 0 "*'=~;--" - I . 0 - 0 . 5 0 0.5 1.0
e n e r g y t r o n s f e r ~ w [ m e V ]
lOOC , i ~ , ' Yl ' ' J f f )
Er'~176 L~ AI2 1
~ ~, phonons ~ I l l
~ {
-g0 -30 -20 -10 -8 -6 - 4 -2 0
energy transfer %~[meV)
Fig. l l . Inelastic neutron spectra of Ero.ooaLao.eevAl z at T =t .5 K, T=5 K, and T=50 K
plained by the CF-parameters given in Table 3 and the corresponding level scheme shown in Fig. 16.
ii) No other measurements on this system are known.
Ero.oo3La0.0o?Ala i) At low temperatures an inelastic CF-transition is observed at +_0.3 meV (for T = 1.5 K and 5 K shown in Fig. 11). For this line it is not possible to get a good fit with just one inelastic line, which we believe to be an effect of concentration. The dashed line for T = 5 K shows the low energy part of the magnetic scattering (quasi- and inelastic) as calculated from fits with BFK-theory. At T = 5 0 K a further peak is found at -4 .8 meV.
ii) On a t0 a t - ~ Er sample only one inelastic CF-transition at approximately 5meV has been found [11] corresponding to our - 4 . 8 meV line.
The proposed CF-parameters (deduced from this line and specific heat measurement) agree within error with our values.
Ero.oo3Yo.997A12 i) At T=1.5 K we observe at 1.35 meV a CF-tran- sition, which is also present at higher temperatures in the energy gain (Fig. 12). As can be seen from the T = 5 0 K spectrum, a further CF-transition at +_0.25 meV leads to a broadening of the elastic line at higher temperatures. In the spectrum for T = 5 0 K further lines are found at - 5 . 5 meV, -6 .8 meV and -8 .5 meV. The fits reveal that all CF-transitions, even those with small transition probabilities, can be identified.
ii) Our measurements were performed on a sin- gle crystal with a much lower concentration than used for earlier measurements ([25]: 2at-%), [11]:

B. Frick and M. Locwcnhaupt: Crystal Field Spectroscopy by Inelastic Neutron Scattering. I 223
~ 0 0 0 1 i I I I I J I I I I [ I
1 1 " "~ .003 .997 2
.~-~
xIS �9
~0
5000
o
d E
_~-~
E
-2.t, -1.6 -0.8 0 0.8 1.6 2J* energy transfer huImeV]
I I t I I I I I I I
Er.003Y997 A[ 2
T=50 K
i i I i I i i
. ~ 1000-
1000
lt.OO- El'02 Sc98 At z
-~ T= 20K / /
I;Lj Z0()
0t �9 , �9 , .
T= 1.SK , j
- 3 - 2 -1
-2.L~ -1.6 - 0.8 0.8 1.6 2./* energy transfer Jfiw [meV]
6 0 0 I I I I I I I I i j I I I
T=SO K 3
E
E
-50 -40 -30 -10 -B -6 -/~ -2 0 energy transfer "hw [meVl
Fig, 12. Inelastic neutron spectra of Erom03Y0.99vAl 2 at T= 1.5 K and at T=50 K
" T - f i
-G-R,, ; j 0 1 2
e n e r g y f m n s f e r l i n e r ]
Era2 Sc98 At z 800-
"~,- T= SOK =: ~ - -/
c o :_ / , 0 0 -
0 ,
-10 -8 -6 -~, - i 0 energy transfer [meV ]
Fig. 13. Inelastic neutron spectra of Er0.ozSco.98A1 a at T= 1.5 K, T= 20 K and T= 50 K
10at-%). The CF-parameters, given in Table3, agree with [25, 11] within error. Recent ESR- measurements [26-] (x = 0.322 (20) and W= -0 .29 (2) K) agree in x and show a deviation of about 10~o for W. This group of measurements now confirms a unique set of CF-parameters for ErcYl_cA12. Controversial results of several earlier measurements are summarized in [24].
Ero.o2Sco.9sA12 i) The spectra for T=1.5 K and T = 2 0 K show an inelastic CF-transition at 4-2.4 meV (Fig. 13). In the energy loss this line is located just at the border of the observable energy transfer. For higher tempera- tures, for example T= 50 K, we can observe a rather large number of well separated CF-transitions at: _+1.1 meV, +2.4 meV, -4 .1 meV, - 5 . 2 meV, -6 .5 meV, - 7 . 6 meV, and -9 .8 meV. This system can be
described very well by the CF-level scheme in Fig. 16.
ii) This sample had been investigated earlier [25] by neutron scattering with similar results for the CF-parameters.
Tmo oo3Lao 997A12 i) We discussed this sample in detail in connection with an investigation on the influence of supercon- ductivity on the width of CF-lines [-23]. Therefore we will not show the measured spectra here. We find a CF-transition at _+0.75 meV for low temperatures ( T < 4 0 K ) . At T=1.5 K no further transitions are found, even if higher incident neutron energies are used (see Table 2). Above about T = 4 K a further line at _+0.22 meV appears. At T = 5 0 K and 100 K we observe another CF-transition in the energy gain at - 5.5 meV.

224 B. Frick and M. Loewenhaupt: Crystal Field Spectroscopy by Inelastic Neutron Scattering. I
t+O(X
E
02.~'~ ";-
200
I I I I I
Tmoo~Y.997 Atz
E
T=SK
I I i I I
-iii i-eO!Bergy Iltroni!er i&a [4~] 116 : Z.'
. ...,2: " - Jl" :0 :'; :r-'- ]10 ~ ' 20 ' 10 8 6 L~ 2 ; 2
energy transfer ~u [meV ]
150( g.
~'. d .E .~- :;..
0 2.z~ -2.Z~
,5o 1
. 3 8 '
-'~-~" 1 .
O ~ . . . . O l , , , , ,
-40 -2.4 -1.6 -0.8
I I I I I I I l I
�9 o e
,,,,'7" "r �9 ~:s. y ~ : . . s . 2 > / " ~ . . J .,%.~
I I I I I I I I I
-1.6 -0 .8 0 0.8 1.6 energy transfer ~JImeVl
I I I I I / | 1 I I I I I I
Tm.003Y.997 A[ z . . . .
~jD ~Q l
--~S �9
' ' 0'8 ' 1'6 '
energy transfer ~w[meVl
2.4
2./.
Fig. 14. Inelastic neutron spectra of Tmo.0o3Yo.997A12 at T= 5 K, T= 50 K, and room temperature (RT). The lines are fits with isotropic exchange (full line) and quadrupol coupling (dashed line)
ii) Again this alloy had been studied by earlier neutron scattering measurements [25, 27, 28] but for concentrations of 2 at- % and higher. A drastic influ- ence of concentration on the excitation spectra is observed and is discussed in part II. The CF-param- eters given earlier (x =0.5 (10); W=0.3 (10) K [25]) give a magnetic F5 (1) CF-ground state. In contrast to this our new parameters ([23] and Table 3) yield a nonmagnetic F 1 groundstate.
Tmo.003Yo.997A12 i) At T--1.5 K only one CF-transition at 1.08 meV is present and the additional intensity is interpreted as non-single ion effect (shown in part II). A further CF-line arises at a temperature of T= 5 K at +0.56 meV (Fig. 14). At T--50 K these transitions are still present, and some further lines at + 1.6 meV (weak) and 2.0 meV (very weak). Additionally at T= 50 K we find CF-transitions at -3 .9 meV, -5 .2 meV (broad line, consisting of two unresolved peaks), and at -6 .6 meV. For the low energy part of the spectra at 50 K and room temperature we present two dif- ferent fits with BFK-theory; for the drawn line we used isotropic exchange coupling and for the dashed line aspherical Coulomb coupling. The latter gives a slightly better fit at T = 5 0 K , 100 K and RT than exchange coupling.
ii) Samples with c > 2 at-~o Tm in YA12 have been studied before by neutron scattering [25, 27],
900-
Tmo2 Sc~8 AI 2
700-
-6. -/~. -2. 0. energy trQnsfer [meVl
d Fig. 15. Inelastic neutron spectra of Tmo.ozSco.98A12 at T=20 K and 80 K
with results which are not very different from the CF-parameters given here. A very early study on Tmo.25Yo.75A12 [29] has led to the parameters: x = 0.50 (5), W=0.464 (58)K, which are also consistent within error with our result.
Tmo. o 2Sco.9 sA12 i) At T= 1.5 K we find a CF-transition at 2.1 meV in the energy loss of neutrons. For T= 20 K (Fig. 15)

B. Frick and M. Loewenhaupt: Crystal Field Spectroscopy by Inelastic Neutron Scattering. I 225
this line appears also in the energy gain. A further line is clearly present at (-4.0_+0.3) meV. The ob- served lines, as well as the elastic line seem to have small sidepeaks, which we explain as a concentration effect. The spectrum for T = 8 0 K, finally, shows a double-peak at -2 .1 meV to -2 .3 meV. Ad- ditionally we find a clearly resolved peak at - 4 . 0 meV.
ii) An earlier neutron scattering experiment with worse resolution [25, 27] on the same sample yield- ed similar CF-parameters.
6. Summary of CF-Parameters and Coupling Constants
From least-square-fits with BFK-theory - all full lines in the spectra above belong to them - we obtain three parameters: the LLW parameters x and W and the coupling constants p. The values deduced from our measurements are summarized in Table 3. The LLW parameters x and W are usually con-
verted into the CF parameters A , ( r ~} which are also tabulated in Table 3. These CF-parameters contain besides the intrinsic crystal field parameters A, ad- ditionally the influence of the magnetic test ion: the mean radial wavefunction of the 4f-electrons (r") . A separation of the two contributions can only be done by using the theoretically calculated ( r" ) val- ues. We used the values from [17], obtained from relativistic calculations (see Table 1). The resulting CF-parameters A, are also tabulated in Table 3. Fi- nally the last column of this table contains the re- duced coupling constants 1P'1 for the coupling strength of the magnetic moments to the conduction electrons:
p'= p/(ga - 1)= N(EF) Jex-
In order to complete our values, we have included in Table 3 five values from literature [-10, 11].
We have summarized in Fig. 16 the CF-level schemes in the form of LLW plots, together with the overall CF-splitting energies in K. This figure illus-
60 r3 Pr | �9 Na" J I ~ b~ - 150 LLW-CRYSTALFIELD 40 " ~ ' ~ ' 2 ~ I " ~2, 11"I ~ 100 PARAMETERS
r v ' l I I I ~ 0 Y d ilufion by YA[ 2 IZ'r, ~ - 50 sL, overa[l spliffing
- 4 0 - r / 1 ~ i ', I ~ r ~ '''~ ~ y~La -100 inK
t
!i -100 ~.
-200
-300 I" -150 -400 I- -200
0 x 1-1 x 0-1 x 0 0 x 1 Fig. 16. LLW-diagrams and resulting level schemes for the investigated systems (RE, R)AI z, Also shown is the ground state ( t ) and the overall splitting in K

226 B, Frick and M. Loewenhaupt: Crystal Field Spectroscopy by Inelastic Neutron Scattering. I
A/+ < r/b I [K]
40-
20-
x ~ [CF-paramefers
X~ ,//x~" La A[2 8.1b,5 ~ ' x . \ \ ~ ~'x YA[ 2 7.855
~ ; . ~ ScAt 2 7.579
�9 , I , , , , , + , , , i
[e Pr Nd Tb Dy Ho Er Tm l i f , , ! l | i r
LaA[ 2
SeAl2 -10 -
A,o<r6~ x . z 6 [ K ] " . , ~ / / ~ r 6 "
/
Fig. 17. Fourth and sixth order CF-parameters in the cubic Laves phases RA12 (R=La, Y, Sc), tested by several rare earth atoms. The values contain still the influence of the 4f-wavefunction
0.08
0.060
O.OZ~O
0.020
coupling constants 9'= N (El=)" 3ex
I }
L 0 , A I 2 : , ,
Y AL2 x ScAIz : .
Ce Pr Nd Tb Dy Ho Er Trn I I I I I I I I I I I I I
Fig. 18. Coupling constants (BFK) for isotropic exchange in- teraction between 4f-moments and conduction electrons
trates that the x-parameters, giving the ratio be- tween the 4th and 6th order CF-parameters, all show the same trend: their absolute values increase when going from ScA12 to YA12 and LaA12. This means that the 4th order terms are always more dominant in the LaA12 matrix than in the YA1 z and in the ScA12 matrix.
A plot of the CF-parameters A, ( r" ) , as deter- mined from our measured spectra, is shown in Fig. 17 (note the different scale for the fourth and sixth order parameters). We find a systematic be- havior of the CF-parameters. All 4th-order parame- ters are positive and all 6th-order parameters are negative. Furthermore the values for the different host matrices lie on well defined curves, which have similar shape for the fourth and sixth order parame- ters, respectively. A trivial and expected feature is the decrease of the absolute values of the 4th and 6th- order parameters for increasing number of 4f- electrons, reflecting the lanthanide contraction of the
radial 4f-wavefunctions. This is illustrated by the dotted line, belonging to (r") , which is normalized in order to follow the curves of ScA12.
If the influence of the 4 f ions on the CF-parame- ters would only originate from lanthanide contrac- tion one would expect, similar to the dotted ( r") curves, smooth CF-parameter curves. There are, however, characteristic deviations of the 4th-order parameters, which show a minimum near Dy, He, and an increase for Er and Tm. Furthermore one recognizes that the distance between the LaA12 and YA12 curves is smaller than between the YA12 and ScA12 curves for the 4th-order parameters, In con- trast, the 6th-order parameter curves lie more close together for YAt 2 and ScAI 2 than for LaA12 and YA12 .
The summarized coupling constants p' are plot- ted in Fig. 18. This is the first time that a systematic study of coupling constants has been done. The pa- rameters are results of least-square-fits with the

B. Frick and M. Loewenhaupt: Crystal Field Spectroscopy by Inelastic Neutron Scattering. I 227
BFK-theory for exchange interaction. We find a de- crease of coupling constants with the rare earth atoms and an increase for T m and, less significant, for Er.
7. Discussion of the CF-Parameters
We start the discussion of the CF-parameters, which we have determined, with the model of point charges on neighbor sites. As mentioned above no theories are available, which would take the influence of conduction electrons on the CF-potential into ac- count quantitatively. The simplest and nearly only way for experimentalists to interprete their data are therefore calculations within the point charge model. This is usually done in the real space, calculating the contributions from different numbers of neighbor shells. One must be concient of the fact that the convergency is not ensured by this calculation, even if one can show that the results for 2 neighboring shells and 6 neighboring shells do not differ very much [10]. Recently a point charge calculation in the reciprocal space has been carried out for NdA12 [-30], which delivers the correct sign for the CF- parameters but a 6th-order CF-parameter , which is too small by a factor of ten.
The common feature of all point charge models, however, including the last method, is that ad- ditional assumptions must be made to explain our
experimental results. This refers especially to the sequence and the sign of the CF-parameters. We will illustrate this by simple point charge considerations. From a point charge calculation up to the sixth neighbor shell [10] and taking an average over the measured CF-parameters we get unreasonable large point charges for a luminum ( Z A 1 ) and for the R =La , Y, Sc atoms (ZR):
LaAI=: ZR=14.9, ZA~= 7.9;
YAI=: ZR=24.1, ZAny16.0;
ScAI=: ZR ---- 22.6, ZAZ=16.1.
If we would take more reasonable values, e.g. Zal = Z R = 3, we would end up with negative A~ param- eters for all hosts, in contrast to the observation, and with negative A 6 parameters. In order to show this, we have sketched in Fig. 19a the CF-parame- ters. If no influence of the rare earth test ion is present, we would get horizontal lines (dotted for Sc, La, dashed for Y). If we take into account the dif- ferent electronegativities for La, Y, Sc [32] (La: 3.25, Y: 3.20, and Sc: 3.05), and keeping Y as reference, we obtain a slight shift of the curves for La and Sc (dashed lines). The charge for A1 was assumed to be the same in all three host lattices. The drawn lines correspond to the experimental mean values of CF- parameters. To match experimental and calculated values significant additional contributions must be taken into account. It is supposed that the con-
I
Az, j
I meV' ~,'~l
30
Lo
Y 2O
Sc 10
Ce 3' Trn J.
Lo, . . . . . . . ............................... -S
y . . . . . . . .
Sc ..............................
Sc . . . . . . . .
A6 a) lmeV. J l ~ ]
Ce3. Tm ~- /~fn t I L
-05 ............................. L~
............................. S(
- I ~.[
La.
Y -5 Sc
A~ [meV,~] ~'
.... LQ- .... y_
l~_ ~ . . . . . .
L ~ . . . . . . .
Ce 3" Tm I" I I
A~ b) [ m e q . A ~ l
Ce ~" Tm 3" 4 f "
o~ . . . . . ~
- . . . . . ~Sc J L ~ a L Ii
A~ [meV~ A-4I
1C
Ce Nd Tb Ho Tm
'F~r ' 'D'y' E'r' _i
-S '
A6 C) lr~w ~c 6 ]
~, LoA~ 2
x YAI~
�9 SeAl2
REAL2
Ce Nd Tb Ho Tm i
Oy Er
~f~ P
Fig. 19a-c. Comparison between the experimental mean values and point charge calculations of the forth and sixth order CF-parameters in the cubic Laves phases RA12 (R=La, Y, Sc); ( )=mean value of the experimental results; ( - --)=calculated point charge values front different models: a Model assuming the charges of aluminum ZA~ and R-atoms Z~ to be Z~=ZAI=3. Dotted lines without, dashed lines taking electronegativity of the R-atoms into account (see text), b Model assuming ZR = 3 and ZA] = 0. e Experimental values from Table 3 compared with experimentaI values for the compounds REAl 2 from literature

228 B. Frick and M. Loewenhaupt: Crystal Field Spectroscopy by Inelastic Neutron Scattering. I
duction electrons strongly influence the CF-parame- ters and this is sketched as nearly host independent A,l in Fig. 19a. Thus in this model the conduction electron contribution would be a dominant mecha- nism, changing in fact the sign of the 4th-order parameters and the size of the 6th-order parameters. The role of the 5 d-electrons having a high density of states at the Fermi-level in LaA12 [8] and contri- buting mainly to the 4th-order parameters was dis- cussed by [7].
It was realized earlier [35] that one can obtain positive A 4 and negative A 6 parameters by chosing a zero aluminum charge. Theoretical arguments for this have been given recently [-30] by show- ing that nearly free conduction electrons in alumi- num screen the point charges very efficiently whereas the 5d electrons of the rare earth atoms are very ineffective in screening point charges. Following this argument and taking the aluminum charge zero and ZR=3, we get positive A 4 parameter, which however increase in their absolute value from LaA12 to YA12 and ScA1 z because of the larger lattice constants of LaA12 compared to YA12 and ScA12. The A 4 and A 6 parameters calculated this way are scetched in Fig. 19b by the dashed lines. Again a conduction electron contribution Ar must be in- troduced. This contribution must be of different size for the three host lattices to meet the experimental results. The A4 contribution of Ael should decrease from LaA1 z and YA12 to ScA1 z. This seems plau- sible from the conduction electron structure of these lattices and from the different densities of states near the Fermi level, which lead to different shielding lengths. On the other hand the contribution of A~ to the A 6 parameters must increase from LaA12 to YA12 and ScA12 and must correct the small nega- tive A 6 values to the much larger experimental val- ues.
In Fig. 19c we have plotted the experimental A 4
and A 6 values in order to illustrate that beneath the sign and sequence (La ~ Y- , Sc) of the curves there are characteristic deviations from straight lines. The minimum for Dy and the increase for Er and Tm in the A4 curves show this clearly. We have marked in Fig. 19c the CF-parameters for the compounds REAl 2 by the dashed areas. These parameters have been taken from [12]. It is obvious that the com- pound vNues are located near the values for the diluted (RE, Y)A12 CF-parameters. Again a mini- mum is found for the DyA12 parameters.
Concluding this part of discussion we want to summarize that the above estimations within the point charge model show that the conduction elec- trons play an important role in determining the sign and strength of the CF-potentials in metals. The
influence of 5d electrons must remain speculative until exact calculations are done. Even more sophis- ticated point charge calculations in reciprocal lattice [30] can up to now not explain the size of both CF- parameters and their relative size in the three lattices LaA12, YA12, ScA12 without additionally making speculative assumptions.
8. Discussion of the Dynamics
We now want to discuss the observed coupling con- stants p', deduced from BFK-theory [18], and com- pare some predictions of the BFK-theory with our experimental results. One advantage of data analysis with this theory is the drastic reduction of the fit parameters, because the one coupling constant de- termines all line widths of the CF-transitions. The assumption of this theory is, that isotropic exchange interaction is the leading interaction mechanism be- tween the 4f.moments and the conduction electrons. The inclusion of this interaction may result in a shift of CF-lines as one increases the temperature or even in a narrowing of the line width of the quasielastic scattering in a certain temperature range. The ap- pearance of such an effect is not expected from other theories [33].
The observed exchange coupling constants (Fig. 17) decrease from the light to the heavy rare earth atoms and increase for Tm in RA12. The de- crease may be a consequence of the more contracted 4f-wavefunctions when going from the light to the heavy rare earths and was observed already by other methods like NMR, electrical resistivity etc. [34]. No increase for Tm and Er had been observed ear- lier. Possibly this is not a consequence of stronger exchange coupling but of other effects like aspherical Coulomb scattering (see TmcY 1 cA12) or of a more trivial reason as sample inhomogeneities (see part II). We want to mention here also an experi- ment which clearly demonstrated that the CF line widths are determined mainly by the isotropic ex- change coupling: the observation of a drastic de- crease of the line widths in the superconducting phase [22, 23].
Concerning the predicted shift of CF-linewidths, we found this confirmed for CF-transitions located in the neighbourhood of the elastic line, when quasi- and inelastic scattering did overlap. We could, how- ever, not separate a possible temperature effect of lattice dilatation on the CF-parameters. Generally we got better consistency of the CF-parameters for low and high temperatures using BFK-theory than using a simple CF-theory. But at low temperatures the BFK-theory gives only correct line positions if the

B. Frick and M. Loewenhaupt: Crystal Field Spectroscopy by Inelastic Neutron Scattering. I 229
coupling constants p are kept constant and if one takes the high temperature value of p, because CF- line widths are strongly influenced by an additional residual line width at low temperatures, which is not described by the BFK-theory. The origin of the ad- ditional residual line width may be sample inhomo- geneities.
The effect of motional narrowing, predicted by the BFK-theory, could not be confirmed or dis- proved by our measurements. The main reason for this is the enormous nuclear elastic scattering, which prevents the unambiguous separation of the qua- sielastic magnetic scattering at lower temperatures, where the quasielastic line widths are small (see e.g. Fig. 11, T= 5 K). Measurements with polarized neu- trons and polarization analysis to study this prob- lem on diluted alloys suffer still from too low in- tensity. Furthermore the situation becomes more complicated for the investigated CF-splittings in comparison to a two level system [18] because fur- ther CF-transitions appear near the elastic line for elevated temperature.
9. Conclusion
Furthermore we have studied the dynamical be- havior of the very diluted magnetic 4f-moments, coupled to the conduction electrons. The influence of the coupling between magnetic moments on the excitation spectra will be discussed in part II of this work. We could roughly confirm the BFK-theory [18], even if there are open questions as the, e.g., additional residual CF-line width at low tempera- tures. We have found a dependence of the coupling constants from the RE ions, which agree qualitative- ly with the results from other measuring methods, except the higher coupling constant for Tm. The latter may be connected with a change in coupling mechanism from isotropic exchange to aspherical Coulomb (quadrupol) scattering.
Concluding we hope that this experimental work can give some insight into the origin of crystal elec- tric field potentials in metals and into the dynamic behavior of single magnetic moments coupled to conduction electrons.
We want to acknowledge the help of M. Beyss in sample preparation, the helpful support during the experiments at ILL, Grenoble by Dr. M. Bee and the fruitful discussions with Dr. A Bringer. Further we thank the "Sonderforschungsbereich 125- Achen-Jiilich-KNn" for financial support.
We have presented inelastic neutron scattering re- sults for a systematic study of very diluted (RE, R)A12-alloys , with RE = rare earths and R = La, Y, Sc. The comprehensive set of CF-parameters de- duced from the measured spectra allowed us to get information about several contributions to the CF- potential: First the contribution of the rare earth atoms (used as test ions) itself and second the contri- bution of the host lattices (with sligthly different electronic band structure and lattice constants). We have discussed our results within the simple picture of point charge model, even if it is clear that in metals the conduction electrons should have a strong influence. We have shown that the experi- mental results can be explained only by a very dras- tic influence of conduction electrons, influencing the sign and the strengths of the CF-parameters. Also these experiments show clearly the necessity of exact theoretical calculations in order to explain the origin of CF-potentials in metals. A progress in this field, concerning the behavior of stable ions, seems desir- able as a first step towards the understanding of behavior of unstable, crystal field split ions, which show Kondo effect or intermediate valency. Our ex- perimental results show some characteristic features (sign of CF-parameters; sequence of CF-curves and distance between them; deviation from a smooth (r") behavior), which should be explained by such detailed calculations.
References
1. Frick, B., Loewenhaupt, M.: Z. Phys. B - Condensed Matter 63, 225 (1986); will be referred to as part II of the present work
2. Furrer, A. (ed.): Crystal field effects in metals and alloys. New York: Plenum Press 1977
3. Corner, W.D., Tanner, B.K. (eds.): Rare earths and actinides. Institute of Physics Conference Series 37, London 1977
4. Crow, J.E., Guertin, R.P., Mihalisin, T.W. (eds.): Crystalline electric field and structural effects in f-electron systems. New York: Plenum Press 1980
5. Guertin, R.P., Suski, W., Zolnierek, Z. (eds.): Crystalline elec- tric field effects in f-electron magnetism. New York: Plenum Press 1982
6. Hilscher, G., Wiesinger, G., Gratz, E., Schmitzer, C., Weinber- ger, P., Gr6ssinger, R. (eds.): Electronic structure and proper- ties of rare earth and actinide intermetallics. Amsterdam: North Holland 1985. Physica 130B, 1-568 (1985)
7. Schmitt, D.: J. Phys. F7, 1521 (1971); J. Phys. F9, 1745, 1759 (1979)
8. Hasegawa, A., Yanase, A.: J. Phys. F 10, 847 (1980) 9. Seitz, E., Lengeler, B., Kamm, G., Kopp, J.: J. Phys. C5, 76
(1979) 10. Walter, U., Holland-Moritz, E.: Z. Phys. B - Condensed Mat-
ter 45, 107 (1981) 11. Barbara, B., Berthier, Y., Devine, D.A.B., Rossignol, M.F.: J.
Phys. F 12, 2625 (1982) 12. Eyers, A.o Alke, A., Leson, A., Kohake, D., Purwius, H.G.: J.
Phys. C 15, 2459 (1982) 13. Bethe, H.: Ann. Phys. 3, 133 (1929) 14. Stevens, K.W.H.: Proc. Phys. Soc. A65, 209 (1952) 15. Hutchings, M.T.: Solid state physics. Vol. 16, p. 227. London,
New York: Academic Press (1964)

230 B. Frick and M. Loewenhaupt: Crystal Field Spectroscopy by Inelastic Neutron Scattering. I
16. Lea, K.P., Leask, M.J.M., Wolf, W.P.: J. Phys. Chem. Sol. 23, 1381 (1962)
17. Freeman, A.J., Desclaux, J.P.: J. Magn. Magn. Mat. 12, 11 (1979)
18. Becker, K.W., Fulde, P., Keller, J.: Z. Phys. B - Condensed Matter 28, 9 (1977)
19. Birgeneau, R.J.: J. Phys. Chem. Sol. 33, 59 (1972) 20. Scherm, R., Carlile, C., Dianoux, J., Suck, J., White, J.: In-
ternal Scientific Report of ILL Grenoble, 76S2355 (1976) 21. Beyss, M., Welter, J.M., Kaiser, T.: J. Cryst. Growth 50, 419
(1980) 22. Feile, R., Loewenhaupt, M., Kjems, J.K., Hoenig, J.E.: Phys.
Rev. Lett. 47, 610 (1981) 23. Frick, B., Loewenhaupt, M., Murani, A., Feile, R.: Solid State
Commun. $4, 563 (1985) 24. Loewenhaupt, M., Frick, B., Walter, U., Holland-Moritz, E.,
Horn, S.: J. Magn. Magn. Mat. 31--34, 187 (1983) 25. Loewenhaupt, M., Horn, S., Frick, B.: in [5], p. 125 26. DSbler, U., Baberschke, K., Barnes, S.E.: Phys. Rev. B27,
6593 (1983) 27. Horn, S.: Ph.D. Thesis, TH Darmstadt (1982) 28. Horn, S., Loewenhaupt, M.; Scheuer, H., Steglich, F.: J. Magn.
Magn. Mat. 14, 239 (1979)
29. Furrer, A., Btihrer, W., Heer, H.: J. Magnetism 4, 63 (1973) 30. del Moral, A.: J. Phys. F14, 1477 (1984) 31. Seitz, E.: J. Phys. FS, L189 (1978) 32. Miedema, A.R., Boom, R., deBoer, F.R.: Crystal structure
and chemical bonding in inorganic chemistry. Rooymans, CJ.M., Rabenau, A. (eds.), p. 163. Amsterdam: North Holland 1975
33. Lopes, L.C., Ngoc Thuan, N., Lasailly, Y., Bhattacharjee, A.K., Coqblin, B.: in [6], p. 122
34. Maple, M.B.: Solid State Commun. 8, 1915 (1970) 35. Newman, D.J.: J. Phys. F13, 1511 (1983) 36. Frick, B., Loewenhaupt, M.: in [61, p. 372 37. Frick, B.: Ph.D. Thesis, Univ. Cologne, report of KFA Jtilich,
Jtil-1941 (1984)
B. Frick M. Loewenhaupt Institut ftir FestkSrperforschung Kernforschungsanlage Jiil]ch GmbH Postfach 1913 D-5170 Jiilich 1 Federal Republic of Germany