crw directors and staff - capital region water · ms4 crw, lower paxton township, and susquehanna...
TRANSCRIPT

Monthly Management ReportCRW Directors and Staff
November 2019As of November 14, 2019
Ensure Financial StabilityReconciled Bank Account Balances Refer to attached Reconciled Bank Account Balances as of 10/31/2019.Monthly Financial Statements Provided separately to Board of Directors. AP Check Reconciliation Register Provided separately to Board of Directors.Capital Improvement Projects for Drinking Water
Provided separately to Board of Directors.
Capital Improvement Projects for Wastewater
Provided separately to Board of Directors.
Grant Management Refer to attached Grant Management Report.
Ensure Revenues are Consistent with System UsageWater Shutoffs Drinking Water Division staff performed 65 water shut-offs for non-payment. Water was restored to 51 properties. Repair/Replace Meters/MXUs/Batteries Drinking Water Division staff replaced 25 water meters, 58 batteries, and 28 MXUs.
Reduce Wet Weather Impacts to Infrastructure, Community, and Receiving WatersNegotiate with PADEP/US EPA/DOJ on Past and Future Practices
CRW met with USEPA/USDOJ/PADEP on 10/17/2019 to discuss technical topics. CRW helped clarify technical components of our plan. At the conclusion of the meeting, USEPA requested additional information on CSO statistics, Monitoring procedures, Pollutants of Concern, and Modeling Computations which were subsequently provided by CRW on 10/31/2019.
Develop Necessary Planning for Implementation of Green Infrastructure
CRW issued a Request for Proposal (RFP) on 10/28/2019 to develop Planning Area Level Green Stormwater Infrastructure Plans. This detailed planning will support the development of projects for the PENNVEST Programmatic Financing over the next five years. The RFP will be due on 11/25/2019 and a recommendation for consultant selection will be on the December Board Agenda.
Joint Pollutant Reduction Plan -Collaborate with Suburban Partners on MS4
CRW, Lower Paxton Township, and Susquehanna Township revised and updated our Joint Pollutant Reduction Plan (PRP) per PADEP comments. Since the revisions led to new proposed projects for the 5-year Permit cycle, the Joint PRP is open for public comment beginning 11/07/2019 and will remain open until 12/09/2019. The Joint PRP will be discussed at a public meeting on 11/19/2019 starting at 7:00 PM at the Lower Paxton Township Municipal Building, 425 Prince Street, Harrisburg, PA. Following the public comment period the Joint PRP will be resubmitted to PADEP for approval.
Obtain and Comply with Individual MS4 Permit
See above.
Operate Facilities with a High Standard of CareThe Drinking Water Division met all Primary and Secondary Safe Drinking Water Act permit parameters. AWTF met all required NPDES monthly permit parameters in October. One Sanitary Sewer Overflow was reported. Details can be found in the Wastewater Division Monthly Report for October.One NOV that was received by the Drinking Water Division in August regarding improper registration of a storage tank by the PADEP Storage Tank Program was rescinded in November. The NOV was disputed by CRW staff and through correspondence PADEP has confirmed that the potential NOV was resolved and closed and is not part of CRW's record for the facility.There were no NOVs received by the Wastewater Division in October.
Permit Compliance
Notice of Violations (NOVs)
1

Monthly Management ReportCRW Directors and Staff
November 2019As of November 14, 2019
The Drinking Water Maintenance Department conducted all scheduled preventative maintenance for the month to the Water Treatment Plant equipment. Specific facility maintenance activities are outlined within the Drinking Water Division Monthly Report which included focus on servicing the Susquehanna River Pump Station and components for both an annual exercise and emergency preparedness.
The Wastewater Department completed all regularly scheduled preventative maintenance in the month of October. Most notably, the Field Operations Department focused on semi-annual preventative maintenance of its CSO structures, completing 44 throughout the month.
CCTV Wastewater crews and contractors flushed a total of 2,549.32 LF (0.48 miles) of pipe in October. Crews also performed CCTV assessment of15,074.57 LF (2.86 miles) of sewer mains during the month.
The Drinking Water Distribution Department did not have to respond to any emergency water main breaks in October.Wastewater responded to 10 customer backup complaints during the month of October. CRW was found to be responsible for one. Details are provided in the Wastewater Division Monthly Report for October.
Wastewater/Stormwater Rules and Regulations
As required by the implementation of the stormwater program and stormwater fee, CRW is making updates to the Rules and Regulations to the Wastewater System (CSS, Separate Sanitary System, and MS4). See Issue Brief Combined Wastewater and Stormwater Rules and Regulations.
GIS • Yellow card layer (water connection cards) have been pushed to the Cityworks test environment.• Fats, Oils and Grease (FOG) locations have been pushed to Cityworks for Tom Bernstein.
Cityworks
Asset Management On 11/05/2019, in support of the Collection System Asset Management Plan, initial outputs from Operational Insights and Assetic Predictor were reviewed, including financial strategies. An example of dashboard metrics using Microsoft Power BI (Business Intelligence Platform) were demonstrated 11/05/2019, along with discussion of other metrics to consider for the dashboard.
Development Review Summary For details, see attached Development Stormwater Management Review Summary Spreadsheet for October.
Professional & Contractor Services Recommend Board approval of the following Task Orders, Change Orders and Agreements:• MS4 Permit Obligation – Resolution No. 2019-040 - Joint Pollutant Reduction Plan REVISED Intergovernmental Cooperation Agreement• 2019 Water Main Replacement Project - Change Order No. 3 with Rogele, Inc.• Task Order 2016-29-03: Engineering Services for 2019 Annual DeHart Dam Inspection with Gannett Fleming• Water Transmission Easement Clearing Project - Change Order No. 1 with Julian Hardwoods
AWTF Primary Digesters Rehabilitation Exterior and HVAC work continues on the electrical building and the linear mixer has been installed in Digester No 2. AWTF Primary Clarifiers Rehabilitation No update. Front Street Pumping Station Improvements
No update.
2019 Street Restoration The project is complete and will be removed from future reports. WSC Chlorine Scrubber Installation Startup and testing of the scrubber unit will occur in mid-November.WSC Fluoride Conversion The fluoride tanks arrived early November and the project should be completed shortly after installation. WSC Filter Media Replacement The contractor discovered deteriorated concrete and the project team is coming up with a solution to address the issue. Cameron Street Water Main Lining All water main lining is complete. Outstanding work includes relocating a portion of the water main.2019 Sewer Replacement The contractor is working at the last location (12th & Walnut Streets). Work will continue through November.Water Transmission Easement Clearing Project
All clearing work is complete. Two Work Change Directives were issued for the project and a Final Adjusting Change Order is recommended. See related Issue Brief.
Incident Response
Preventative Maintenance
Undertake Capital Improvement Projects - Refer to attached Capital Improvement Projects Report
2
Monthly Management ReportCRW Directors and Staff
November 2019As of November 14, 2019
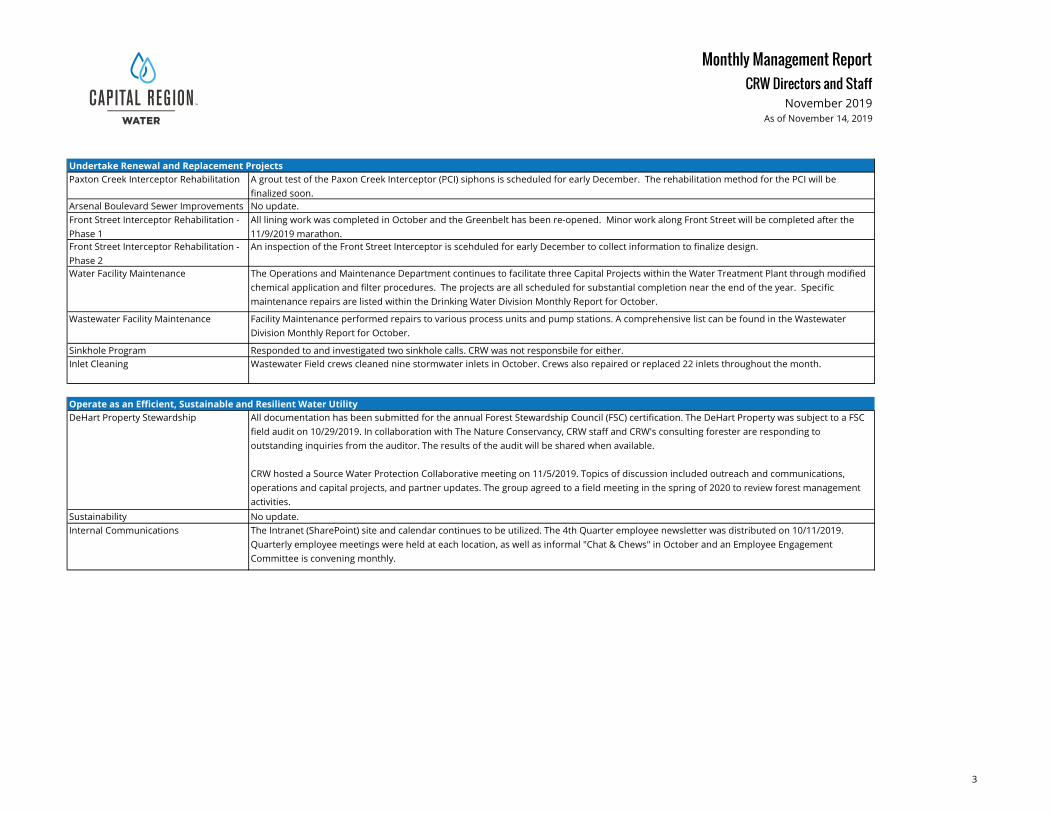
Undertake Renewal and Replacement ProjectsPaxton Creek Interceptor Rehabilitation A grout test of the Paxon Creek Interceptor (PCI) siphons is scheduled for early December. The rehabilitation method for the PCI will be
finalized soon.Arsenal Boulevard Sewer Improvements No update.Front Street Interceptor Rehabilitation - Phase 1
All lining work was completed in October and the Greenbelt has been re-opened. Minor work along Front Street will be completed after the 11/9/2019 marathon.
Front Street Interceptor Rehabilitation - Phase 2
An inspection of the Front Street Interceptor is scehduled for early December to collect information to finalize design.
Water Facility Maintenance The Operations and Maintenance Department continues to facilitate three Capital Projects within the Water Treatment Plant through modified chemical application and filter procedures. The projects are all scheduled for substantial completion near the end of the year. Specific maintenance repairs are listed within the Drinking Water Division Monthly Report for October.
Wastewater Facility Maintenance Facility Maintenance performed repairs to various process units and pump stations. A comprehensive list can be found in the Wastewater Division Monthly Report for October.
Sinkhole Program Responded to and investigated two sinkhole calls. CRW was not responsbile for either.Inlet Cleaning Wastewater Field crews cleaned nine stormwater inlets in October. Crews also repaired or replaced 22 inlets throughout the month.
Operate as an Efficient, Sustainable and Resilient Water UtilityDeHart Property Stewardship All documentation has been submitted for the annual Forest Stewardship Council (FSC) certification. The DeHart Property was subject to a FSC
field audit on 10/29/2019. In collaboration with The Nature Conservancy, CRW staff and CRW's consulting forester are responding to outstanding inquiries from the auditor. The results of the audit will be shared when available.
CRW hosted a Source Water Protection Collaborative meeting on 11/5/2019. Topics of discussion included outreach and communications, operations and capital projects, and partner updates. The group agreed to a field meeting in the spring of 2020 to review forest management activities.
Sustainability No update.Internal Communications The Intranet (SharePoint) site and calendar continues to be utilized. The 4th Quarter employee newsletter was distributed on 10/11/2019.
Quarterly employee meetings were held at each location, as well as informal "Chat & Chews" in October and an Employee Engagement Committee is convening monthly.
3

Monthly Management ReportCRW Directors and Staff
November 2019As of November 14, 2019
Inform and Listen to Customers and Encourage Stewardship of our SystemsMedia Relations - Press and Social Media Press releases were issued announcing the results of the 2019 Lead and Copper testing on 10/10/2019, receipt of a $13 million PENNVEST loan
on 10/17/2019, and the short-term River Run on 10/31/2019.
Social media topics included stormwater and the proposed stormwater fee, rehabilitation of the Front Street Interceptor, locations and disruptions related to sewer inspections and repairs, lead and copper test results, leaf collection and street sweeping guidance, meeting reminders, job opportunities, and event updates. Capital Region Water sent 26 tweets via Twitter, created 29 posts on Facebook, and provided 4 Nextdoor.com posts. Two specific customer requests were made via Facebook. The first was made on 10/10/2019 requesting an update on the Third Street Project, which was provided as well as clarification on CRW’s maintenance responsibility of the GSI assets. The second request was made on 10/21/2019 for an investigation at Mulberry and Crescent Streets due to a storm drain concern. CRW followed up to inspect and clear trash/debris from storm inlets.
Community Relations Community Ambassador Meeting: An Ambassador meeting will be held on 11/20/2019. Discussion of the 11/20/2019 meeting will be provided on the December Management Report.
Community Events: CRW attended and provided water and information at the following events: • John Harris College and Career Fair - 10/03/2019• Facility Tours for Melrose School - 10/04/2019• Stop the Drop Monthly Litter Cleanup - 10/15/2019• City Council Stormwater Fee Proposal Presentation - 10/15/2019• Community Trick or Treat with Tri-County Community Action – 10/19/2019• Facility Tours for City Council – 10/19/2019• Facility Tours with City Council Youth Aid – 10/23/2019• Stormwater Fee Discussion with the Harrisburg Chapter of the Democratic Socialists of American (DSA) – 10/24/2019• City Council Pre-Trick or Treat Night – 10/30/2019
SPECIAL NOTE: For upcoming events, please visit our "Board Meetings and Events" calendar that is available on our website's home page at capitalregionwater.com.
Public Communications Communications for this month include our short-term river run, results of lead and copper testing, timeline for budgets and rates, cold weather/winter preparation, leak detection, job openings, and ongoing construction projects.
Diversity • PreBid Meeting for CBH2O Priority Planning RFP.• Worked with consultant to identify potential GSI Maintenance contractors.• Reached out to local M/W/DBEs to provide quotes for projects.• Scheduled prebid meeting for GSI construction project.
AdministrativeRisk Management No update.Human Resources • New employee AWTF Tour - Friday, 11/08/2019.
• Temple University Leadership Training, Class Two, Sessions A and B - November 2019. • Collective bargaining continues. • Life and Dental Insurance contract renewals. • Recruiting: Refer to attached Recruiting Report.
4

Monthly Management ReportCRW Directors and Staff
November 2019As of November 14, 2019
Information Technologies (IT)
Surplus Equipment (phone, networking, old servers) were packed and shipped via Federal Express on 11/08/2019.
Office Management and Admin Professional Services
Street/Sidewalk-Cut Permits: One new Drinking Water and One Drinking Water/Wastewater requests were received for the Harrisburg Universtity Building and processed from the City of Harrisburg's Engineer. Satisfactory restorations were made and permits were closed on five Drinking Water Street/Sidewalk-Cut Permits.
The Feasibility Study, including tours and evaluations of various suitable properties on the market, and cost-benefit analysis, for relocating our Administrative Offices is complete. The motion to purchase the property located at 3003 N. Front Street in the City of Harrisburg was approved by the Board in the Special Meeting on 11/13/2019.
Incoming Correspondence Report: Refer to attached Incoming Correspondence and Social Media Correspondence Report for October 2019.
Recommend Board approval of the following Admin Professional Service Contracts: None.CRW received three Right-to-Know requests and responded to two Right-to-Know requests due to extensions or appeal during the period 10/17/2019 through 11/13/2019 as follows:
CRW's Open-Records Officer participated in a Office of Open Records (OOR) webinar on 10/29/2019 regarding record retention practices for local government agencies and their relationship to the Right-to-Know Law.
CRW's Open-Records Officer and Assistant Open-Records Officer attended the OOR's Annual Training at the Capitol Complex on 11/07/2019. Discussion on the upcoming OOR Docketing System to be rolled out in the coming months was disclosed. This new Docketing System is designed to make the RTK Law Appeal process go smoother for all parties through an electronic portal system.
RTK 2019-029 - Quin Breland, General Counsel, Vice-President Acquisitions (Vortex Companies). Any and all correspondence, documentation provided and agreements from 1/1/2018 to the present, between CDM Smith and Capital Region Water as it relates to reference(s) that include the following: Paxton Creek, Quadex Lining Systems, GeoKrete and Northeast Remsco. If everything can be provided electronically, then copies are not needed. If not, we will want copies. Response due: 8/22/2019. Response provided 8/22/2019 for notice of 30-day extension until 9/23/2019. Add'l Extension until 9/25/2019. Response provided 9/25/2019.
RTK 2019-033 - Philip C. Brown. All Termination Notices (not actual terminations) for 1416 State Street, Harrisburg from 10/01/2008 through 10/14/2019. If there are no such Termination Notices, please state this. Response due: 10/22/2019. Response provided 10/22/2019 for notice of 30-day extension until 11/22/2019. Final response provided 11/06/2019.
Right-to-Know Requests
5

Monthly Management ReportCRW Directors and Staff
November 2019As of November 14, 2019
RTK 2019-034 - Anthony Naylor. (1) Total amount of water withdrawn from all of your withdraw sites for the months of August of 2019. (2) Total amount of water withdrawn from all of your withdraw sites for the months of September of 2019. (3) Total amount of water delivered to customers in August 2019. (4) Total amount of water delivered to customers in September 2019. (5) The total amount of water distributed by any other manner than would have been accounted for in the above request #3 for the month of August 2019. (6) The total amount of water distributed by any other manner than would have been accounted for in the above request #4 for the month of September 2019. (7) The total number of residential customers in 2019 that had a water usage of above 50,000 gallons in one month. (8) The total number of residential customers in 2019 that had a water usage of above 100,000 gallons in one month. (9) The total number of residential customers that had any monthly increase of at least 10 times above their 2019 average monthly usage in 2019. (10) The total number of residential customers that had any monthly increase of at least 100 times above their 2019 average monthly usage in 2019. Response due: 11/04/2019. Partial Response provided 11/04/2019 with notice of 30-day extension until 12/04/2019. Final response pending as of 11/14/2019.
RTK 2019-035 - Kenneth Deloian (SmartProcure). Request for any and all electronically maintained purchasing records for 2019-07-09 to current. Specific information requested from the record-keeping system: Unique identifying number such as PO#, Check# or Invoice#, Date, Description, Price, Quantity, Vendor ID, name and address. Please note NO copying, NO printing and NO scanning of records. Response due: 11/05/2019. Response provided 11/05/2019.RTK 2019-036 - Philip C. Brown. Provide all information concerning the affiliation of Capital Region Water/CRW and the City of Harrisburg, PA including when the billing duties for water services was transferred to CRW. How were then delinquent accounts handled including any subsequent Termination Notices and Municipal Liens? Were any delinquent accounts provided payment terms or other accomodations that were not offered to the other accounts? Was the delinquent property account of Philip C. Brown at 1416 State handled in a discriminatory/unfavorable manner as he had made derogatory comments concerning former Hbg. Mayor Stephen Reed & others? Response due: 11/15/2019. Response provided 11/08/2019.
6

Reconciled Bank Account Balances 10/31/19
Balance APY Bank
Business Checking 363,422.29$ 0.75% First National Bank
Money Market-Admin 1,341,546.19$ 2.17% First National Bank
Project Fund 429,177.42$ 2.17% First National Bank
Certificate of Deposit – Nat’l Civil War Museum 250,000.00$ 0.5489% First National Bank Restricted $250,000 min/$500,000 max
Lockbox 221,713.15$ 0.00% PNC Bank
General Account 446,706.35$ 0.00% First National Bank
Certificate of Deposit – Admin -$ 2.3492% First National Bank
WATER
Water Revenue Fund 3,430,614.54$ 88.00% First National Bank
Water Operation Reserve Account 1,676,186.79$ 2.17% First National Bank Req'd Balance $685,132.00 (adjusts)
Water Contingency Account 1,410,187.28$ 2.17% First National Bank
Water Contingency Subaccount 1,833,649.45$ 2.17% First National Bank
Money Market-Water 19,890,320.52$ 2.17% First National Bank
Certificate of Deposit-Water -$ 2.3492% First National Bank
SEWER
Sewer Revenue Account 2,208,184.07$ 0.80% First National Bank
Money Market-Sewer 19,897,605.60$ 2.17% First National Bank
Certificate of Deposit-Sewer -$ 2.3492% First National Bank
Bank Statements (reconciled accounts)
ADMIN

Grant Management Report
Funding Program ProjectProposal Due
Date
Anticipated
Announcement
Date
Date of
Notification
Request
Amount
Request Type
(Cash vs. Loan)
CRW Matching
Amount
CRW Matching
Type$$$ Awarded Rationale/Notes
$0 $0
$0 $0
PENNVEST Infrastructure (Projects) ProFi Green Infrastructure PENNVEST Loan COMPLETED 16-Oct-19 16-Oct-19 $13,000,000 Loan $0 0 $13,000,000 Approved.
PENNVEST Infrastructure (Projects) Front Street Pump Station Upgrade COMPLETED 18-Jul-18 18-Jul-18 $11,136,900 Loan $0 0 $11,136,900 Project underway.
PENNVEST Infrastructure (Projects) AWTF Headworks PENNVEST Loan COMPLETED 15-Oct-17 15-Oct-17 $5,500,000 Loan $0 0 $3,577,394 Bid lower than anticipated. Reduced loan accordingly. Project complete.
Impact Harrisburg (iH) Infrastructure (Projects) City of Harrisburg's Multimodal (COH-MC) Project COMPLETED Unknown 22-Jul-16 $3,000,000 Cash $5,098,000 Cash & GSI Escrow
Account
$2,743,645 Project substantially complete.
Impact Harrisburg (iH) Local Stormwater Project with City of Harrisburg Parks & Rec. COMPLETED 16-Nov-17 16-Nov-17 $250,000 Cash $200,000 Cash $195,220 Two of the three parks covered by grant complete. Funds received.
DEP Local Stormwater BMP Implementation Grant Downspout Planter Pilot Project COMPLETED 14-Dec-15 30-Jun-16 $100,000 Cash $30,000 In-Kind $20,825 Project complete. Funds received.
$32,986,900 $5,328,000 $30,673,984
$0 $0
GRANT OVERVIEW
SUB TOTALS
SUB TOTALS
SUB TOTALS
Capital Region Water's Pending Grant & Loan Applications
Capital Region Water's Awarded Grant, Loan and Bond Proceeds
Capital Region Water's Not Awarded Grants & Loans
Capital Region Water's Future Grant Applications
SUB TOTALS
N:\CRW\Financial\Grants\Grant & Funding Management Reports\2019-10-00 Grant Management Report Page 1 of 1

Drinking Water Capital Improvement Projects Report
Actual Expenditure YTD % Budget Expended 2019 Budget
MUNIS Project Code Description Status Jan Feb Mar Apr May Jun Jul Aug Sep Oct Nov Dec60800801-80100-00050 DeHart Evaluation - PROF SERVI DESIGN 2,401$ 15,365$ 510$ 33,603$ 12,427$ 21,861$ 15,468$ 21,485$ 2,162$ 125,281$ 8% 1,533,333$ 60800801-80100-00007 WSC Emergency Generator CONSTRUCTION -$ 398,295$ 19,362$ 3,916$ 2,323$ 1,845$ 2,708$ 169,443$ -$ 597,891$ 120% 500,000$ 60800801-80100-00008 WSC Filter Media Replaceme CONSTRUCTION 3,308$ 3,868$ 9,661$ 4,228$ 5,111$ 2,097$ 860$ 1,705$ -$ 30,836$ 8% 400,170$ 60800801-80100-00015 Water Main Replacement Const CONSTRUCTION 43,338$ 13,258$ 32,927$ 238,563$ 551,946$ 193,825$ 26,282$ 152,126$ 183,600$ 1,435,866$ 113% 1,265,658$ 60800801-80100-00045 Chlorine Scrubber Project CONSTRUCTION -$ 1,255$ 1,265$ 670$ 92,079$ 67,160$ 3,150$ 67,948$ -$ 233,528$ 47% 493,688$ 60800801-80100-00046 Mountain Line Clearing CONSTRUCTION 6,217$ 5,591$ 7,058$ 20,453$ 61,652$ 141,801$ 6,917$ 10,122$ 5,466$ 265,276$ 504,225$ 60800801-80100-00081 Cameron Street Water Main Li CONSTRUCTION 618$ -$ 40,172$ -$ -$ -$ 520,243$ 269,800$ 1,031,652$ 1,862,485$ 88% 2,123,700$ 60800801-80100-00092 Liquid Fluoride Chem Feed Sy CONSTRUCTION 17,085$ 3,681$ 6,007$ 905$ 4,992$ 8,929$ 4,288$ 7,846$ 95,626$ 149,357$ 58% 258,160$
Actual Monthly Expenditure 72,967$ 441,312$ 116,961$ 302,338$ 730,530$ 437,518$ 579,916$ 700,474$ 1,318,505$ -$ -$ -$ 4,700,521$ 66.4% 7,078,933
Actual CUMULATIVE Expenditure 72,967$ 514,279$ 631,240$ 933,577$ 1,664,107$ 2,101,626$ 2,681,541$ 3,382,015$ 4,700,521$
ACTUAL EXPENDITURE (from Finance)
$0
$1,000,000
$2,000,000
$3,000,000
$4,000,000
$5,000,000
$6,000,000
$7,000,000
$8,000,000
$-
$1,000,000
$2,000,000
$3,000,000
$4,000,000
$5,000,000
$6,000,000
$7,000,000
$8,000,000
Jan Feb Mar Apr May Jun Jul Aug Sep Oct Nov Dec
Cum
ulat
ive
Expe
nditu
re
Month
2019 Drinking Water Capital Improvement Projects ExpenditureActual Estimated
N:\CRW\Monthly Reports\Management\Draft\2019-11-08 2019 CIP Project Expenditure to Board.xlsx

Wastewater Capital Improvement Projects Report
Actual Expenditure YTD % Budget Expended 2019 Budget
MUNIS Project Code Description Status Jan Feb Mar Apr May Jun Jul Aug Sep Oct Nov Dec80800801-80100-00023 Cogeneration Improvments St DESIGN 54,930$ 28,322$ -$ 54,244$ 20,462$ -$ 16,446$ -$ -$ 174,404$ 23% 750,000$ 80800801-80100-00024 Primary Clarifier Improvement DESIGN -$ 488$ -$ -$ -$ -$ 724,388$ -$ -$ 724,876$ 125% 580,000$ 80800801-80100-00061 Arsenal Boulevard Sewer Improvements DESIGN -$ -$ -$ -$ -$ -$ -$ -$ -$ -$ 0% 852,495$ 80800801-80100-00065 Other Multi-Modal CCTV Investi DESIGN 136,446$ 18,966$ -$ -$ -$ -$ -$ 56,497$ 59,335$ 271,244$ 164% 165,000$ 80800801-80100-00070 GSI Design DESIGN 20,530$ 34,100$ 16,043$ -$ 158,256$ 11,928$ 21,799$ 5,927$ 18,598$ 287,180$ 38% 750,000$ 80800801-80100-00073 Wet Weather Services DESIGN 111,129$ -$ $ 39,400 3,500$ 49,730$ -$ -$ -$ 84,136$ 287,895$ 34% 850,000$ 80800801-80100-00083 Front Street Interceptor Rehabilitation - Ph 2 DESIGN 13,753$ 266$ 808$ 1,351$ 288$ -$ -$ -$ -$ 16,466$ 5% 316,075$ 80800801-80100-00088 MulDer Square GSI DESIGN -$ -$ -$ -$ -$ -$ -$ -$ -$ -$ 0% 20,000$ 80800801-80100-00089 2018 South Allison Hill GSI DESIGN 3,582$ 1,918$ -$ -$ -$ 2,042$ 3,508$ 254$ -$ 11,303$ 1% 1,057,575$ 80800801-80100-00090 2nd/7th Strts Multimoda GSI DESIGN -$ 30,273$ -$ 3,333$ 70,876$ 49,971$ -$ -$ -$ 154,454$ 11% 1,443,450$ 80800801-80100-00091 Pax Crk TMDL Joint PRP MS4 DESIGN 5,035$ -$ -$ -$ -$ -$ -$ 3,900$ 8,059$ 16,995$ 4% 430,563$ 80800801-80100-00020 Anaerobic Digester Roof Rep CONSTRUCTION 455,636$ 1,279,571$ 62,734$ 1,057,095$ 608,999$ 1,118,338$ 548,727$ 1,339,623$ 80,573$ 6,551,294$ 108% 6,040,500$ 80800801-80100-00025 Front St Pump Sta Design/Co CONSTRUCTION 115,972$ 39,593$ 70,284$ 178,559$ 390,564$ 141,492$ 375$ 492,030$ 639,170$ 2,068,039$ 30% 6,814,814$ 80800801-80100-00026 Collection System Rehabilitation CONSTRUCTION 74,710$ 239,939$ 65,184$ 228,277$ 343,889$ 136,614$ 288,472$ 247,400$ 55,576$ 1,680,062$ 52% 3,234,623$ 80800801-80100-00028 Paxton Creek Interceptor Re CONSTRUCTION 19,136$ 5,824$ 23,862$ 27,493$ 8,866$ 70,373$ 4,474$ 158,509$ 5,898$ 324,434$ 6% 5,590,700$ 80800801-80100-00029 Front Street Interceptor Rehabilitation - Ph 1 CONSTRUCTION 9,682$ 1,038$ 1,285$ 1,416$ 144$ 852$ 17,257$ 8,821$ 34,414$ 74,909$ 15% -$ 80800801-80100-00084 3rd Street Multimodal GSI CONSTRUCTION 23,768$ -$ -$ 1,905$ 1,575$ 68,618$ 25,988$ -$ 524,183$ 646,037$ 126% 510,775$ 80800801-80100-00085 City Parks GSI CONSTRUCTION 38,982$ -$ -$ -$ 19,399$ 31,132$ -$ -$ -$ 89,514$ 16% 546,113$ 80800801-80100-00086 Summit Terrce Neighbrhd GSI CONSTRUCTION 86,421$ -$ -$ -$ 2,886$ -$ -$ -$ -$ 89,306$ -$
Actual Monthly Expenditure 1,169,710$ 1,680,299$ 279,600$ 1,557,174$ 1,675,934$ 1,631,360$ 1,651,433$ 2,312,961$ 1,509,942$ -$ -$ -$ 13,468,412$ 45.0% 29,952,683$
Actual CUMULATIVE Expenditure 1,169,710$ 2,850,009$ 3,129,609$ 4,686,783$ 6,362,717$ 7,994,077$ 9,645,510$ 11,958,471$ 13,468,412$
ACTUAL EXPENDITURE (from Finance)
$0
$5,000,000
$10,000,000
$15,000,000
$20,000,000
$25,000,000
$30,000,000
$0
$5,000,000
$10,000,000
$15,000,000
$20,000,000
$25,000,000
$30,000,000
Jan Feb Mar Apr May Jun Jul Aug Sep Oct Nov Dec
Cum
ulat
ive
Expe
nditu
re
Month
2019 Wastewater Capital Improvement Projects ExpenditureActual Estimated
N:\CRW\Monthly Reports\Management\Draft\2019-11-08 2019 CIP Project Expenditure to Board.xlsx

Development Stormwater Management Review SummaryNovember 8, 2019 Status Report
Development StatusLatest
Submittal
Latest
Comments
Act 167
WatershedBMP
Disturbed Area
(Ac)Rate Control
Volume
ControlInfiltration Comment
William Howard Day
Homes
Final Land
Development10/8/2019 11/7/2019 Paxton Creek Infiltration beds 1.65 X X X
Approval recommendation letter on
11/7/2019
137 South 17th StreetPrelimimary/Final
Development 9/16/2019 10/10/2019 Paxton Creek Detention Basin 0.85 X Sent comment letter on 10/10/2019
N:\CRW\Monthly Reports\Management\Draft\SWM Review\2019-11-08 October Board update on SWM Review.xlsx

Information Current as of 11/12/2019
RECRUITING STATUS Carlesha Halkias, HR Manager
November 12, 2019
Page 1 of 2
New Hires Position Employee Effective Date Service Area
None
Transfers
Employee Former Position New Position Effective Date JC Laborer I – AWTF Facilities Maintenance
Worker I – AWTF 11/12/2019
Retirements Position Employee Effective Date
Operator IV – AWTF BB 12/20/2019 Operator III – DW JZ 12/29/2019
Resignations/ Terminations Position Employee Effective Date
Open Positions Position Status Service Area
Community Relations Manager (Previously External Affairs Manager) – Admin.
Three scheduled second interviews. (SE, RL, and BG). One phone screen scheduled for 11/12/2019. (KK).
N/A
Meter Account Supervisor – Admin.
On hold. Posting pulled. Will repost mid-November.
N/A
HR Generalist – Admin. On hold. N/A Facility Maintenance Supervisor - DW
Candidate under review as of 11/12/2019. Waiting on candidate return call to coordinate phone interview.
No
CSR/Account Specialist I - CS Two internal candidates interviewed 10/31/2019. Skills test pending. It will be administered by Kent Frese.
N/A

Information Current as of 11/12/2019
RECRUITING STATUS Carlesha Halkias, HR Manager
November 12, 2019
Page 2 of 2
Operator (in anticipation of Brightbill retirement) – AWTF
Posted Internally. Closes on 11/08/2019. internal candidates – JW & DW
N/A
Operator (in anticipation of JZ retirement) – DW
Posted internally on 11/8/2019. No internal candidates as of 11/12/2019.
N/A
Laborer I (In anticipation of JC transition) - AWTF
Posted internally and externally on 11/7/2019. Six external candidates under review as of 11/12/2019.
N/A
Cashier (In anticipation of one of our current cashiers moving into CSR/Account Specialist I position.
TBD N/A

Incoming Correspondence Report October 2019
Date Received
Date of Correspondence
Company/Agency andName of Sender
ReferenceCRW Addressee/
Received by/Provided to
10/11/2019 10/7/2019 PA DEPApproval Letter - Special StudyAct 537 PlanningPaxton Creek Interceptor North Branch Upgrade
Addressed to: Susquehanna Twp.CC'd to: Dave StewartRec'd by: J. Miller-ZerbeProvided to: Dave Stewart
10/11/2019 N/APA DEP South Central Region - Air Quality Program
2019 Transmittal of Annual Operating FeeAddressed to: Jess RosentelRec'd by: J. Miller-ZerbeProvided to: Jen O'Neill
10/15/2019 10/9/2019 PA DEPPublic Water SupplyConstruction Permit No. 221195005Filter Nos. 3-8 Rehabilitation
Addressed to: Dave StewartRec'd by: J. Miller-ZerbeProvided to: Dave Stewart
10/16/2019 10/15/2019Glatfelter Claims Management, Jamie Gehly
Addressed to: Joe RitcheyRec'd by: J. Miller-ZerbeProvided to: Joe Ritchey
10/16/2019 10/10/2019 HRG, Justin BatesCameron Street Water Main Rehabilitation Project No. 2019-01 Certified Payroll
Addressed to: Jeff BowraRec'd by: J. Miller-ZerbeProvided to: Jeff Bowra
10/16/2019 10/14/2019Gannett Fleming, Jennifer Miller
2019 System ImprovementsSubstantial Completion Certificate & Punch List
Addressed to: Jeff BowraRec'd by: J. Miller-ZerbeProvided to: Jeff Bowra
10/16/2019 10/14/2019Gannett Fleming, Craig Snyder
Fluoride Feed and Storage System PSI Pumping Solutions, Inc. Contract 1 & 2Estimate No. 1 and Partial Waiver of Lien
Addressed to: Jeff BowraRec'd by: J. Miller-ZerbeProvided to: Jeff Bowra
10/16/2019 10/11/2019Gannett Fleming, Jennifer Miller
2019 Water Systems ImprovementsEstimate No. 5 and Partial Waiver of LienChange Order No. 2
Addressed to: Jeff BowraRec'd by: J. Miller-ZerbeProvided to: Jeff Bowra
Page 1

Incoming Correspondence Report October 2019
Date Received
Date of Correspondence
Company/Agency andName of Sender
ReferenceCRW Addressee/
Received by/Provided to
10/17/2019 10/16/2019Keystone Bonding & Surety Agency, LLC Beth A. Seibert
Third Request - General Form Status Inquiry
Addressed to: Capital Region WaterRec'd by: Tammie SheafferProvided to: Joe Ritchey
10/17/2019 10/8/2019 First National Bank Collateral Letter
Addressed to: Business AdministrationRec'd by: Tammie SheafferProvided to: Julie Peters
10/17/2019 10/16/2019Gannett Fleming, Craig Snyder
Chlorine Gas Scrubber Installation, Heisey Mechanical LTD - Contract 1Certified Payroll
Addressed to: Jeff BowraRec'd by: Tammie SheafferProvided to: Jeff Bowra
10/17/2019 10/16/2019Gannett Fleming, Craig Snyder
Fluoride Feed and Storage System, PSI Pumping Solutions - Contract 1 & 2Certified Payroll
Addressed to: Jeff BowraRec'd by: Tammie SheafferProvided to: Jeff Bowra
10/18/2019 10/18/2019City of Harrisburg - Bureau of Planning
City of Harrisburg Subdivision and/or Land Development Application for 17 South 2nd Street, Harrisburg, PA 17101 for Primary Tax Parcel ID Number 03-004-017
Addressed to: Capital Region WaterRec'd by: Karen McKillipProvided to: Jeff Bowra
10/18/2019 10/16/2019Skelly and Loy, Justin Matincheck
Hollywood Casino at Penn National Race Course - Preparedness, Prevention, and Contingency Plan - Downstream Notification
Addressed to: Capital Region WaterRec'd by: Tammie SheafferProvided to: Mike McFadden
10/18/2019 10/16/2019 HRG, Steven PuterbaughApplication for Payment No. 3, Contract No. 2019-01: Cameron Street Water Main Rehabilitation
Addressed to: Dave StewartRec'd by: Tammie SheafferProvided to: Dave Stewart
10/21/2019 10/16/2019FLOW Assessment Services
Harrisburg, PA Interceptor Flow Monitoring Report September 2019 Data CD
Addressed to: Claire MaulhardtRec'd by: J. Miller-ZerbeProvided to: Claire Maulhardt
Page 2

Incoming Correspondence Report October 2019
Date Received
Date of Correspondence
Company/Agency andName of Sender
ReferenceCRW Addressee/
Received by/Provided to
10/22/2019 10/18/2019 UPS Freight
Traffic Dept. - Shipment Consigned to CRW at Fluoride Feed 100 Pine Drive, Harrisburg, PA 17103 - Seeking Disposition for Refused Shipment - Legal Notice
Addressed to: CRW - Fluoride Feed Rec'd By: Angie Leyva Provided to: Kodi Webb and Mike McFadden
10/23/2019 10/17/2019 PA DEPConnections in Paxton Creek BasinLower Paxton Township, Dauphin County
Addressed to: Lower Paxton Twp. CC'd to: CRWRec'd by: J. Miller-ZerbeProvided to: Jeff Bowra
10/30/2019 10/14/2019 United States EPANational Study of Nutrient Removal and Secondary Technologies at Publicly-owned Treatment Works (POTWs)
Addressed to: Harrisburg Advanced WWTFRec'd by: J. Miller-ZerbeProvided to: Jess Rosentel
10/31/2019 10/24/2019 PennDOT Utility Relocation Reimbursement AgreementAddressed to: Jeff BowraRec'd by: J. Miller-ZerbeProvided to: Jeff Bowra
Page 3

Social Media Correspondence Report October 2019
DescriptionFor the month of October, Capital Region Water’s social media topics included stormwater and the proposed stormwater fee, rehabilitation of the Front Street Interceptor, locations and disruptions related to sewer inspections and repairs, lead and copper test results, leaf collection and street sweeping guidance, meeting reminders, job opportunities, and event updates. Capital Region Water sent 26 tweets via Twitter, created 29 posts on Facebook, and provided 4 Nextdoor.com posts. Two specific customer requests were made via Facebook. The first was made on October 10 requesting an update on the Third Street project, which was provided as well as clarification on CRW’s maintenance responsibility of the GSI assets. The second request was made on October 21 for an investigation at Mulberry and Crescent Streets due to a storm drain concern. CRW followed up to inspect and clear trash/debris from the storm inlets.
Page 4

Drinking Water
Drinking Water

DRINKING WATER DIVISION
MONTHLY REPORT
Cameron Street Water Main Lining
October 2019
100 Pine Drive, Harrisburg, PA 17103 | 888-510-0606
capitalregionwater.com

N:\CRW\Monthly Reports\Operations\Drinking Water\Final Drafts\2019\2019-10-00 Monthly Report\2019-10-00 Monthly Report Text.docx
Page 1 of 2
Drinking Water Division Monthly Report October 2019
Plant Operations The Capital Region Water (CRW) Drinking Water Division met all Federal Safe Drinking Water Act Water Quality Standards for the month of October. Specific water quality results are summarized in Exhibit A. A total of 214 million gallons (MG), 6.9 million gallons per day (MGD), was withdrawn from the water supply sources for treatment. All source water was withdrawn from the DeHart Reservoir. As shown in Exhibit B, a total of 189 MG, 6.1 MGD of finished drinking water was pumped to the distribution system. The DeHart water source was in service 31 days. The DeHart Watershed had above average rainfall in October (Exhibit C) and the DeHart Reservoir water level decreased (Exhibit D). An estimated 258 MG of water was released from DeHart Reservoir to Clark Creek, averaging 8.3 MGD for the month. This down stream flow, which is received by remote flow monitoring from the Weir location and actual staff gauge readings, was in compliance with the flow required by the State Water Allocation Permit (Exhibit E). During the month of October, the Hydro-Turbine Generator was not in service due to a decreased need for water production to levels below the minimum required for proper operation of the unit. Estimated electricity cost savings for the year are shown in Exhibit G.
Plant Maintenance The Maintenance Department performed scheduled preventative maintenance for the month using the Cityworks Maintenance Management System for all water treatment plant equipment. The DeHart property was patrolled and maintained. Annual preparations were made to prepare equipment for the exercise of the alternate source water, the Susquehanna River, for treatment. The Susquehanna River Pump Station was serviced and tested to include the three vertical turbine pumps, variable frequency drives, intake screen and air cleaning system, local chemical feed application system, raw water sample lines, pressure relief and air release valves.
Distribution The Distribution Department completed an abnormally high 542 PA ONE Calls in the month of October to locate CRW’s underground utilities. One staff member is typically assigned PA ONE Call response daily. Customer Service requests numbered 279. Two staff members are typically dedicated to these customer calls that can include meter replacements, high bill investigations, meter repair, customer requested water turn ons and turn offs, among other customer-related issues.

N:\CRW\Monthly Reports\Operations\Drinking Water\Final Drafts\2019\2019-10-00 Monthly Report\2019-10-00 Monthly Report Text.docx
Page 2 of 2
Drinking Water Division Monthly Report October 2019
Water Quality In addition to overseeing the routine quality control of both the Accredited Laboratory and Quality Control Laboratory, the Water Quality Administrator performed required quarterly calibrations and cleaning of the in-line turbidimeters and in-line pH meters. Stage 2 Disinfection Byproduct (DBP) samples were collected and analyzed for the fourth quarter, completing 2019 compliance testing for DBPs. Although those results have been historically better than the regulatory limits, this quarter’s results were among the lowest results in the past couple years and can be seen in Exhibit A as Trihalomethanes and Haloacetic Acids. Preparations were also made to ensure that a full round of compliance testing is completed during the Susquehanna River source exercise scheduled for November as required by PADEP.

Drinking Water Exhibits

EXHIBIT A
Water Quality Anaylsis - 2019
PARAMETERS JAN FEB MAR APR MAY JUN JUL AUG SEP OCT NOV DEC Average MCL Limits
Total Coliform: Presence/Absence
DeHart Influent NA P P P P NA P P P P P NA
Susquehanna Influent NA NA NA NA NA NA NA NA NA NA NA NA
Distribution System A A A A A A A A A A A 5% P
Chlorine Residual, mg/L Free
Filter Plant Effluent 1.78 1.50 1.42 1.31 1.51 1.66 1.77 1.73 1.66 1.78 1.61 0.2 - 4.0
Distribution System 1.34 1.24 1.11 0.99 1.00 1.02 1.02 1.31 1.19 1.13 1.14 <0.02
Turbidity, NTU
Influent from DeHart 0.57 0.54 0.51 0.51 0.51 0.51 0.50 0.57 0.72 1.07 0.60 NA
Influent from Susquehanna NA NA NA NA NA NA NA NA NA NA NA NA
Filter Plant Effluent 0.03 0.03 0.02 0.03 0.03 0.03 0.04 0.03 0.02 0.03 0.03 0.30
pH, Std Units
Influent from DeHart 6.4 6.4 6.4 6.5 6.3 6.1 6.0 6.0 6.1 6.4 6.3 NA
Influent from Susquehanna NA NA NA NA NA NA NA NA NA NA NA NA
Filter Plant Effluent 8.0 7.7 7.9 8.1 8.1 7.9 7.7 8.0 7.8 7.7 7.9 6.5 - 8.5*
Distribution System 7.4 7.5 7.5 7.5 7.5 7.5 7.5 7.6 7.7 7.6 7.5 6.5 - 8.5*
Total Alkalinity, mg/L as CaCO3
Influent DeHart 5 5 5 5 5 5 5 5 5 5 5 NA
Influent from Susquehanna NA NA NA NA NA NA NA NA NA NA NA NA
Filter Plant Effluent 12 13 15 16 17 18 22 28 30 19 19 <15*
Distribution System 13 13 14 16 17 18 22 27 32 21 19 <15*
Temperature, degrees C
Influent from DeHart 6.4 5.1 6.0 9.8 13.1 14.6 16.5 17.6 18.0 17.2 12.4 NA
Influent from Susquehanna NA NA NA NA NA NA NA NA NA NA NA NA
Filter Plant Effluent 7.4 6.9 7.7 12.2 15.6 14.0 15.3 16.4 17.4 17.0 13.0 NA
Distribution System 11.0 10.3 10.8 14.3 17.9 20.7 23.0 23.5 22.7 20.6 17.5 NA
Fluoride, mg/L
Filter Plant Effluent 0.62 0.61 0.58 0.65 0.62 0.70 0.63 0.63 0.62 0.66 0.63 2
Aluminum, mg/L
Filter Plant Effluent 0.05 0.03 0.04 0.03 0.01 0.01 0.01 0.01 0.01 0.01 0.02 0.2*
Iron, mg/L
Influent from DeHart 0.23 0.17 0.14 0.12 0.12 0.12 0.12 0.22 0.41 0.51 0.22 NA
Influent from Susquehanna NA NA NA NA NA NA NA NA NA NA NA NA
Filter Plant Effluent 0.02 0.02 0.02 0.02 0.02 0.01 0.02 0.02 0.02 0.02 0.02 0.3*
Distribution System 0.03 0.03 0.05 0.04 0.04 0.03 0.02 0.02 0.01 0.01 0.03 0.3*
Total Dissolved Solids, mg/L
Influent from DeHart 11 12 11 12 12 13 14 16 16 16 13 NA
Influent from Susquehanna NA NA NA NA NA NA NA NA NA NA NA NA
Filter Plant Effluent 23 22 21 25 28 30 37 45 46 36 31 500*
Distribution System 23 24 23 26 30 32 47 65 65 52 39 500*
Total Hardness, mg/L
Influent from DeHart 7 8 8 8 8 7 7 8 8 8 8 NA
Influent from Susquehanna NA NA NA NA NA NA NA NA NA NA NA NA
Filter Plant Effluent 8 8 8 8 8 8 8 8 8 8 8 NA
Distribution System 7 9 8 8 8 8 7 7 7 7 8 NA
Orthophosphate, mg/L
Filter Plant Effluent 1.16 1.20 1.18 1.16 1.16 1.15 1.18 1.17 1.19 1.16 1.17 0.7 - 1.3*
Distribution System 1.16 1.13 1.16 1.11 1.17 1.23 1.17 1.20 1.20 1.15 1.17 0.7 - 1.3*
**Total Trihalomethanes, mg/L
Distribution System 0.043 NA NA 0.046 NA NA 0.052 NA NA 0.043 0.046 0.080
**Total Haloacetic Acids, mg/L
Distribution System 0.044 NA NA 0.028 NA NA 0.045 NA NA 0.014 0.033 0.060
Total Organic Carbon, mg/L
Influent from DeHart 2.10 NA NA 1.60 NA NA 1.76 NA NA 1.75 1.80 NA
Influent from Susquehanna NA NA NA NA NA NA NA NA NA NA NA NA
Filter Plant Effluent 0.97 NA NA 0.86 NA NA 1.04 NA NA 0.95 0.96 NA
Average Filter Run, Hours 122 102 122 143 135 140 136 133 125 71 123 NA
* Values are related to DEP Secondary MCL
** Running Annual Quarterly Average
2019-10-00 WSC Monthly Report Exhibit A Process Control/Water Quality Analysis

January 223.380 7.206 0.000 0.000 223.380 7.206 220.079 7.099 17.012 0.549 203.067 6.551
February 212.900 7.604 0.000 0.000 212.900 7.604 209.756 7.491 14.585 0.521 195.171 6.970
March 231.312 7.462 0.000 0.000 231.312 7.462 227.283 7.332 14.493 0.468 212.790 6.864
April 210.186 7.006 0.000 0.000 210.186 7.006 207.651 6.922 14.193 0.473 193.458 6.449
May 219.378 7.077 0.000 0.000 219.378 7.077 216.136 6.972 12.192 0.393 203.944 6.579
June 220.443 7.348 0.000 0.000 220.443 7.348 217.185 7.240 13.536 0.451 203.649 6.788
July 224.670 7.247 0.000 0.000 224.670 7.247 221.350 7.140 5.602 0.181 215.748 6.960
August 233.398 7.529 0.000 0.000 233.398 7.529 229.793 7.413 10.425 0.336 219.368 7.076
September 216.550 7.218 0.000 0.000 216.550 7.218 213.881 7.129 15.602 0.520 198.279 6.609
October 213.897 6.900 0.000 0.000 213.897 6.900 210.545 6.792 21.430 0.691 189.115 6.100
November 0.000 0.000 0.000 0.000 0.000 0.000 0.000 0.000
December 0.000 0.000 0.000 0.000 0.000 0.000 0.000 0.000
Total 2206.114 0.000 2206.114 2173.659 139.070 2034.589
Average 220.611 7.260 0.000 0.000 220.611 7.260 217.366 7.153 13.907 0.458 203.459 6.695
Peak Day Water Use 10/2/2019 7.155 (MG) = Million Gallons
Minimum Day Water Use 10/13/2019 5.347 (MGD) = Million Gallons per Day
Average
(MGD)Total (MG)
Average
(MGD)Total (MG)
Average
(MGD)Total (MG)
Average
(MGD)Total (MG)Month Total (MG)
Average
(MGD)Total (MG)
Average
(MGD)
EXHIBIT B
Water Production Data 2019
DeHart Withdrawal River Withdrawal Total Withdrawal Treated Water Process Water Finished Water
2019-10-00 WSC Monthly Report Exhibit B Flow Monitoring And Water Withdrawal Information

EXHIBIT C
Rainfall at the DeHart Reservoir - 2019
(inches)
Date January February March April May June July August September October November DecemberAnnual
Total
2019 Total 4.10 2.14 3.60 4.68 7.18 0.81 3.48 3.26 7.74 5.65 42.64
Daily Average 0.132 0.069 0.116 0.156 0.232 0.026 0.112 0.105 0.258 0.182 0.000 0.000 1.39
Ten Year Average 3.29 2.62 3.62 4.68 3.84 5.59 4.96 4.25 5.50 5.34 3.84 4.31 51.84
2018 Total 3.46 6.65 3.00 4.17 4.86 9.60 18.72 8.77 8.13 2.76 5.63 3.94 79.69
0.00
10.00
20.00
30.00
40.00
50.00
60.00
70.00
80.00
90.00
January February March April May June July August September October November December Annual
Total
Rainfall Trends
2019
2019 Total Ten Year Average 2018 Total
2019-10-00 WSC Monthly Report Exhibit C Rainfall At The DeHart Reservoir

EXHIBIT D
Water Level at the DeHart Reservoir - 2019
(Inches from Spillway)
Date January February March April May June July August September October November December
2019 AVG 4.7 4.0 4.9 5.2 4.8 2.9 0.3 -10.4 -29.2 -44.0
Ten Year AVG -43.6 -41.1 -31.0 -16.6 -14.4 -17.0 -29.0 -45.5 -64.0 -76.8 -81.4 -68.7
2018 AVG 0.1 5.0 4.0 4.0 3.8 2.8 6.0 4.6 3.2 3.3 6.6 0.1
-90.0
-80.0
-70.0
-60.0
-50.0
-40.0
-30.0
-20.0
-10.0
0.0
10.0
20.0
January February March April May June July August September October November December
DeHart Reservoir Water Level Trends
2019
2018 AVG Ten Year AVG 2019 AVG
2019-10-00 WSC Monthly Report Exhibit D Water Level At The DeHart Reservoir

EXHIBIT E
Daily Conservation Release - 2019
051015202530354045505560
1 7
13
19
25
31
37
43
49
55
61
67
73
79
85
91
97
10
3
10
9
11
5
12
1
12
7
13
3
13
9
14
5
15
1
15
7
16
3
16
9
17
5
18
1
18
7
19
3
19
9
20
5
21
1
21
7
22
3
22
9
23
5
24
1
24
7
25
3
25
9
26
5
27
1
27
7
28
3
28
9
29
5
30
1
30
7
31
3
31
9
32
5
33
1
33
7
34
3
34
9
35
5
36
1
Flo
w P
ast W
eir (
MG
D)
Time (months)
Flow Past WeirDaily Trend Summary - 2001
Carsonville Weir Flow
Target
Target conservation release is 6.5
million gallons per day ; this
corresponds to 6.8 MGD
indicated reading at the weir.
051015202530354045505560
01
/0…
01
/0…
01
/1…
01
/1…
01
/2…
01
/3…
02
/0…
02
/1…
02
/1…
02
/2…
03
/0…
03
/0…
03
/1…
03
/1…
03
/2…
03
/3…
04
/0…
04
/1…
04
/1…
04
/2…
04
/3…
05
/0…
05
/1…
05
/1…
05
/2…
05
/3…
06
/0…
06
/1…
06
/1…
06
/2…
06
/2…
07
/0…
07
/1…
07
/1…
07
/2…
07
/2…
08
/0…
08
/1…
08
/1…
08
/2…
08
/2…
09
/0…
09
/0…
09
/1…
09
/2…
09
/2…
10
/0…
10
/0…
10
/1…
10
/2…
10
/2…
11
/0…
11
/0…
11
/1…
11
/2…
11
/2…
12
/0…
12
/0…
12
/1…
12
/2…
12
/2…
Flo
w P
ast W
eir (
MG
D)
Time (months)
Flow Past WeirDaily Trend Summary - 2001
Series1
Series2
Target conservation release is 6.5
million gallons per day ; this
corresponds to 6.8 MGD
indicated reading at the weir.
051015202530354045505560
1 7
13
19
25
31
37
43
49
55
61
67
73
79
85
91
97
10
3
10
9
11
5
12
1
12
7
13
3
13
9
14
5
15
1
15
7
16
3
16
9
17
5
18
1
18
7
19
3
19
9
20
5
21
1
21
7
22
3
22
9
23
5
24
1
24
7
25
3
25
9
26
5
27
1
27
7
28
3
28
9
29
5
30
1
30
7
31
3
31
9
32
5
33
1
33
7
34
3
34
9
35
5
36
1
Flo
w P
ast W
eir (
MG
D)
Time (months)
Flow Past WeirDaily Trend Summary - 2001
Carsonville Weir Flow
Target
Target conservation release is 6.5
million gallons per day ; this
corresponds to 6.8 MGD
indicated reading at the weir.
Target conservation release is 6.5
million gallons per day ; this
corresponds to 6.8 MGD
indicated reading at the weir.
0.00
50.00
100.00
150.00
January February March April May June July August September October November December
Flo
w P
ast
We
ir (
MG
D)
Clark Creek Weir Flow
Daily Summary
2019
Series1 Minimum Allowable Flow
2019-10-00 WSC Monthly Report Exhibit E Maintenance of Minimum Daily Conservation Release

EXHIBIT F
Utility Usage - 2019
Location / Utility January February March April May June July August September October November December Average Total
Water Services Center
Electric Transmission
Total, kwH 160,200 145,800 180,000 147,252 180,000 160,200 176,400 201,600 165,600 142,200 165,925 1,659,252
Cost, Dollars $7,267.10 $6,745.40 $8,118.54 $7,409.33 $7,871.58 $7,409.33 $7,487.16 $8,358.60 $7,088.26 $7,528.37 $67,755.30
Electric Generation
Total, kwH 160,200 145,000 180,000 167,250 160,200 171,000 176,400 201,600 165,600 142,200 166,945 1,669,450
Cost, Dollars $1,165.63 $1,075.69 $1,256.04 $1,268.00 $1,196.18 $1,221.23 $1,288.23 $1,303.50 $1,296.24 $1,270.31 $1,234.11 $12,341.05
Natural Gas
Total, Cu Ft 13,451 12,597 7,663 7,520 5,800 2,414 1,413 1,371 1,345 * 5,953 53,574
Cost, Dollars $12,619.80 $11,469.20 $6,963.83 $6,782.00 $6,235.00 $3,712.98 $1,365.81 $1,327.60 $1,431.18 $5,767.49 $51,907.40
Sewer
Total, Gal 4,330,000 4,419,000 3,818,000 3,474,000 3,874,000 3,860,000 4,174,000 4,077,000 4,046,000 * 4,008,000 36,072,000
Cost, Dollars $33,254.40 $33,937.92 $29,322.24 $28,898.09 $29,957.91 $29,644.80 $32,052.60 $31,308.15 $31,142.21 $31,057.59 $279,518.32
Refuse
Cost, Dollars $967.70 $967.70 $967.70 $967.70 $967.70 $967.70 $967.70 $967.70 $967.70 $967.70 $8,709.30
Reservoir Park Pump Station
Electric Transmission
Total, kwH 91,312 88,800 83,600 84,301 95,359 89,254 80,800 85,200 93,200 * 87,981 791,826
Cost, Dollars $4,020.84 $3,714.33 $3,700.62 $4,074.87 $4,314.98 $3,942.00 $2,971.94 $2,813.64 $3,210.99 $3,640.47 $32,764.21
Electric Generation
Total, kwH 94,060 94,800 88,800 82,800 94,800 82,800 80,800 85,200 93,200 88,584 797,260
Cost, Dollars $1,176.18 $1,208.33 $2,385.00 $3,392.31 $1,185.39 $1,182.66 $1,325.52 $1,387.46 $1,655.36 $13,242.85
Natural Gas
Total, Cu Ft 416 254 260 0 0 0 0 0 0 0 93 930
Cost, Dollars $391.10 $245.57 $284.99 $30.25 $31.00 $31.91 $16.03 $16.03 $16.05 $21.69 $108.46 $1,084.62
Potable Water
Total, Gal 0 0 0 0 1,000 0 0 1,000 250 2,000
Cost, Dollars $0.00 $0.00 $33.10 $33.10 $50.40 $33.10 $33.10 $42.75 $28.19 $225.55
Sewer
Total, Gal 0 0 0 0 0 0 0 1,000 0 * 111 1,000
Cost, Dollars $0.00 $0.00 $0.00 $0.00 $0.00 $0.00 $0.00 $7.65 $33.10 $4.53 $40.75
Susquehanna River Pump Station
Electric Transmission
Total, kwH 860 860 862 980 862 1,200 1,200 600 600 * 892 8,024
Cost, Dollars $69.92 $53.69 $71.25 $38.02 $53.69 $54.62 $54.62 $52.35 $35.80 $53.77 $483.96
Electric Generation
Total, kwH 860 600 862 862 600 1,200 1,200 600 600 * 820 7,384
Cost, Dollars $42.83 $70.32 $32.91 $53.69 $70.45 $196.73 $196.73 $74.14 $92.23 $737.80
Natural Gas
Total, Cu Ft 723 710 640 650 52 0 0 0 1 107 288 2,883
Cost, Dollars $668.31 $658.10 $612.89 $615.87 $63.00 $16.03 $16.03 $16.03 $16.96 $114.87 $279.81 $2,798.09
Potable Water
Total, Gal 347,653 76,333 82,444 118,707 4,000 0 1,000 1,000 78,892 631,137
Cost, Dollars $3,484.85 $866.61 $1,556.27 $1,276.10 $168.60 $130.00 $139.65 $139.65 $970.22 $7,761.73
Sewer
Total, Gal 347,653 76,333 82,444 118,707 4,000 0 1,000 1,000 60,000 * 76,793 691,137
Cost, Dollars $2,659.54 $583.94 $1,556.27 $908.57 $30.60 $0.00 $7.65 $7.65 $1,228.97 $775.91 $6,983.19
Refuse
Cost, Dollars $110.65 $110.65 $110.65 $110.65 $110.65 $110.65 $110.65 $110.65 $110.65 $110.65 $995.85
Union Square Booster Station
Electric Transmission
Total, kwH 3,722 3,802 2,085 1,292 1,300 1,293 379 333 333 * 1,615 14,539
Cost,Dollars $102.68 $170.38 $156.21 $60.06 $61.85 $60.08 $69.53 $42.04 $41.82 $84.96 $764.65
Electric Generation
Total, kwH 3,722 3,631 2,033 1,200 1,008 403 379 333 * * 1,589 12,709
Cost, Dollars $161.28 $142.69 $89.44 $98.35 $81.82 $81.64 $45.22 $73.39 $96.73 $773.83
DeHart Facilities
Electric Transmission
Total, kwH 4,167 2,692 2,847 3,906 2,462 3,000 3,473 1,669 1879 2,899 26,095
Cost, Dollars $180.40 $157.98 $241.33 $182.06 $143.45 $175.35 $226.59 $227.69 $98.67 $181.50 $1,633.52
Electric Generation
Total, kwH 4,123 3,304 683 557 533 2,143 3,473 1,669 1,879 2,040 18,364
Cost, Dollars $220.22 $66.41 $60.18 $51.37 $54.35 $61.54 $123.99 $66.65 $173.54 $97.58 $878.25
Fuel Oil
Total, Gals. 676 490 450 250 100 75 0 0 255 2,041
Cost, Dollars $1,602.12 $1,161.30 $1,066.50 $592.50 $237.00 $177.75 $0.00 $0.00 $604.65 $4,837.17
City Island Heat Trace
Electric Transmission
Total, kwH 1,072 819 925 295 290 290 312 330 309 * 516 4,642
Cost, Dollars $93.72 $32.60 $54.36 $15.72 $14.36 $14.75 $27.91 $15.06 $14.22 $31.41 $282.70
Electric Generation
Total, kwH 1,134 636 330 330 337 336 312 330 468 3,745
Cost, Dollars $56.07 $95.99 $15.62 $16.35 $62.88 $63.10 $65.52 $65.82 $55.17 $441.35
Expenditures YTD $70,205 $63,424 $58,545 $56,764 $52,852 $49,177 $48,482 $48,314 $34,809 $1,407 $0 $0 $55,316 $495,966
* Not available at time report was developed
$103,684
$28,415
$55,790
$7,987
$286,542
$4,837
$487,256Total Utilities
Total Transmission
Total Generation
Total Gas
Total Water
Total Sewer
Total Fuel Oil
2019-10-00 WSC Monthly Report EXHIBIT F Utility Usage

Month Kilowatt-hour (KWH) Anticipated Savings *
January 35,000 $1,925
February 0 $0
March 0 $0
April 0 $0
May 0 $0
June 0 $0
July 0 $0
August 0 $0
September 44,000 $2,420
October 0 $0
November
December
Average 7,900 $435
Year to Date 79,000 $4,345
Exhibit G
Hydro-Turbine Generator Performance 2019
* Estimated savings based on electrical rate of $0.055 per KWH
$0
$2,000
$4,000
$6,000
$8,000
$10,000
$12,000
$14,000
$16,000
$18,000
0
20,000
40,000
60,000
80,000
100,000
120,000
140,000
160,000
KWH
Savings
2019-10-00 WSC Monthly Report Exhibit G Hydro-Turbine Generator Performance

Chemical January February March April May June July August September October November December Average Total
Chlorine
Total Lbs. 5,958 4,778 4,908 4,456 4,769 5,318 6,027 6,837 6,312 5,369 5,473 54,732
Average, Chlorine Lbs./Day 199 159 164 149 154 177 194 221 210 173 179.9
Average, Chlorine Dose, mg/L 3.4 2.5 2.7 2.6 2.6 2.9 3.3 3.3 3.4 2.7 3.0
Chlorine, Cost, $/Lbs. $0.305 $0.305 $0.305 $0.305 $0.305 $0.305 $0.305 $0.305 $0.305 $0.305 $0.305 $0.305 $0.305
Chlorine Total Cost, Dollars $1,817 $1,457 $1,497 $1,359 $1,455 $1,622 $1,838 $2,085 $1,925 $1,638 $1,669.36 $16,693.64
Alum 48.5%
Total Lbs. 22,785 17,653 17,060 16,456 21,631 21,697 21,569 21,586 19,621 19,369 19,943 199,427
Average, Alum, Lbs./Day 760 588 569 549 698 723 696 696 654 625 655.8
Average, Alum, mg/L 12.4 10.1 9.0 9.5 12.0 12.0 11.2 11.0 11.0 11.0 10.9
Alum Cost, $/Lbs. $0.164 $0.164 $0.164 $0.164 $0.164 $0.164 $0.164 $0.164 $0.164 $0.164 $0.164 $0.164 $0.164
Alum Total Cost, Dollars $3,737 $2,895 $2,798 $2,699 $3,547 $3,558 $3,537 $3,540 $3,218 $3,177 $3,270.55 $32,705.54
Lime
Total Lbs. 0 0 0 0 0 0 0 0 0 0 0 0
Average Lime, Lbs./Day 0 0 0 0 0 0 0 0 0 0 0.0
Average, Lime Dose, mg/L 0.0 0.0 0.0 0.0 0.0 0.0 0.0 0.0 0.0 0.0 0.0
Lime Cost, $/Lbs. $0.10 $0.10 $0.10 $0.10 $0.10 $0.10 $0.10 $0.10 $0.10 $0.10 $0.10 $0.10 $0.10
Lime Total Cost, Dollars -$ -$ -$ -$ -$ -$ -$ -$ -$ $0.00 $0.00
Soda Ash
Total Lbs. 11,350 16,138 22,811 20,922 21,065 22,556 29,189 31,000 28,380 21,108 22,452 224,519
Average Soda Ash, Lbs./Day 378 538 760 697 680 752 950 1,000 946 681 738.3
Average, Soda Ash Dose, mg/L 6.2 9.2 12.0 12.2 11.8 12.2 15.3 16.2 12.9 9.3 11.7
Soda Ash Cost, $/Lbs. $0.299 $0.299 $0.299 $0.299 $0.299 $0.299 $0.299 $0.299 $0.299 $0.299 $0.299 $0.299 $0.299
Soda Ash Total Cost, Dollars $3,394 $4,825 $6,820 $6,256 $6,298 $6,744 $8,728 $9,269 $8,486 $6,311 $6,713.07 $67,130.75
Fluoride
Total Lbs. 1,700 1,600 1,750 1,700 1,900 2,050 1,399 1,162 1,198 1,368 1,583 15,827
Average, Fluoride Lbs./Day 57 53 58 57 62 68 45 38 40 44 52.2
Average, Fluoride (F-) Dose, mg/L 0.9 0.9 0.9 0.9 1.0 1.0 0.6 0.7 0.5 0.5 0.8
Fluoride Cost, $/Lbs. $0.48 $0.48 $0.48 $0.48 $0.48 $0.48 $0.48 $0.48 $0.23 $0.23 $0.48 $0.48 $0.44
Fluoride Total Cost, Dollars $816 $768 $840 $816 $912 $984 $672 $558 $276 $315 $695.55 $6,955.48
Sodium Hydroxide 50%
Total NaOH 50% dry Lbs. 28,592 15,022 5,666 6,184 11,245 13,057 13,421 13,759 12,138 10,860 12,994 129,944
Average NaOH 50%, dry Lbs./Day 953 501 189 206 363 435 447 444 405 350 429
Average, NaOH 50%, mg/L 15.6 8.6 3.0 3.5 6.0 6.3 6.3 6.5 6.0 3.0 6.5
NaOH 50% Cost, dry $/Lbs $0.174 $0.174 $0.174 $0.174 $0.174 $0.174 $0.174 $0.174 $0.174 $0.174 $0.174 $0.174 $0.174
NaOH 50% Total Cost, Dollars $4,975 $2,614 $986 $1,076 $1,957 $2,272 $2,335 $2,394 $2,112 $1,890 $2,261.06 $22,610.63
Zinc Orthophosphate
Total Zn3(PO4)2, wet Lbs. 4,922 4,720 4,984 4,523 4,762 4,826 5,218 5,306 4,796 4,574 4,863 48,631
Average Zn3(PO4)2, wet Lbs./Day 164 157 166 151 154 161 168 171 160 148 160.1
Average, Zn3(PO4)2 Dose, mg/L 2.9 2.9 2.8 2.8 2.8 2.8 2.9 2.9 2.9 2.9 2.9
Zn3(PO4)2 Cost, wet $/Lbs. $0.374 $0.374 $0.374 $0.374 $0.374 $0.374 $0.374 $0.374 $0.374 $0.374 $0.374 $0.374 $0.374
Zn3(PO4)2 Total Cost, Dollars $1,841 $1,765 $1,864 $1,692 $1,781 $1,805 $1,952 $1,984 $1,794 $1,711 $1,818.80 $18,188.00
Potassium Permanganate
Total KMnO4, Lbs. 0 0 0 0 0 0 0 0 0 0 0 0
Average KMnO4, Lbs./Day 0 0 0 0 0 0 0 0 0 0 0.0
Average, KMnO4 Dose, mg/L 0.0 0.0 0.0 0.0 0.0 0.0 0.0 0.0 0.0 0.0 0.0
KMnO4 Cost, $/Lbs. $2.02 $2.02 $2.02 $2.02 $2.02 $2.02 $2.02 $2.02 $2.02 $2.02 $2.02 $2.02 $2.02
KMnO4 Total Cost, Dollars $0.00 $0.00 $0.00 $0.00 $0.00 $0.00 $0.00 $0.00 $0.00 $0.00 $0.00 $0.00 $0.00 $0.00
Expenditure $16,579.42 $14,324.75 $14,805.17 $13,897.08 $15,950.00 $16,985.38 $19,061.37 $19,830.66 $17,809.90 $15,040.31 $0.00 $0.00 $16,428.40 $164,284.04
Average Treated Cost per (MG) $75.33 $68.29 $65.14 $66.93 $73.80 $78.21 $86.11 $86.30 $83.27 $71.44 #DIV/0! #DIV/0! $2,291.00 $75.58
Total Treated Flow (MGD) 220.079 209.756 227.283 207.651 216.136 217.185 221.350 229.793 213.881 210.545 0.000 0.000 217.063 2,173.659
Average Treated Flow (MGD) 7.099 7.491 7.332 6.922 6.972 7.240 7.140 7.413 7.129 6.792 0.000 0.000 7.171 217.366
EXHIBIT H
Treatment Chemical Usage - 2019
2019-10-00 WSC Monthly Report Exhibit H Treatment Chemical Usage
Activity Jan Feb Mar Apr May Jun Jul Aug Sept Oct Nov Dec Total Average
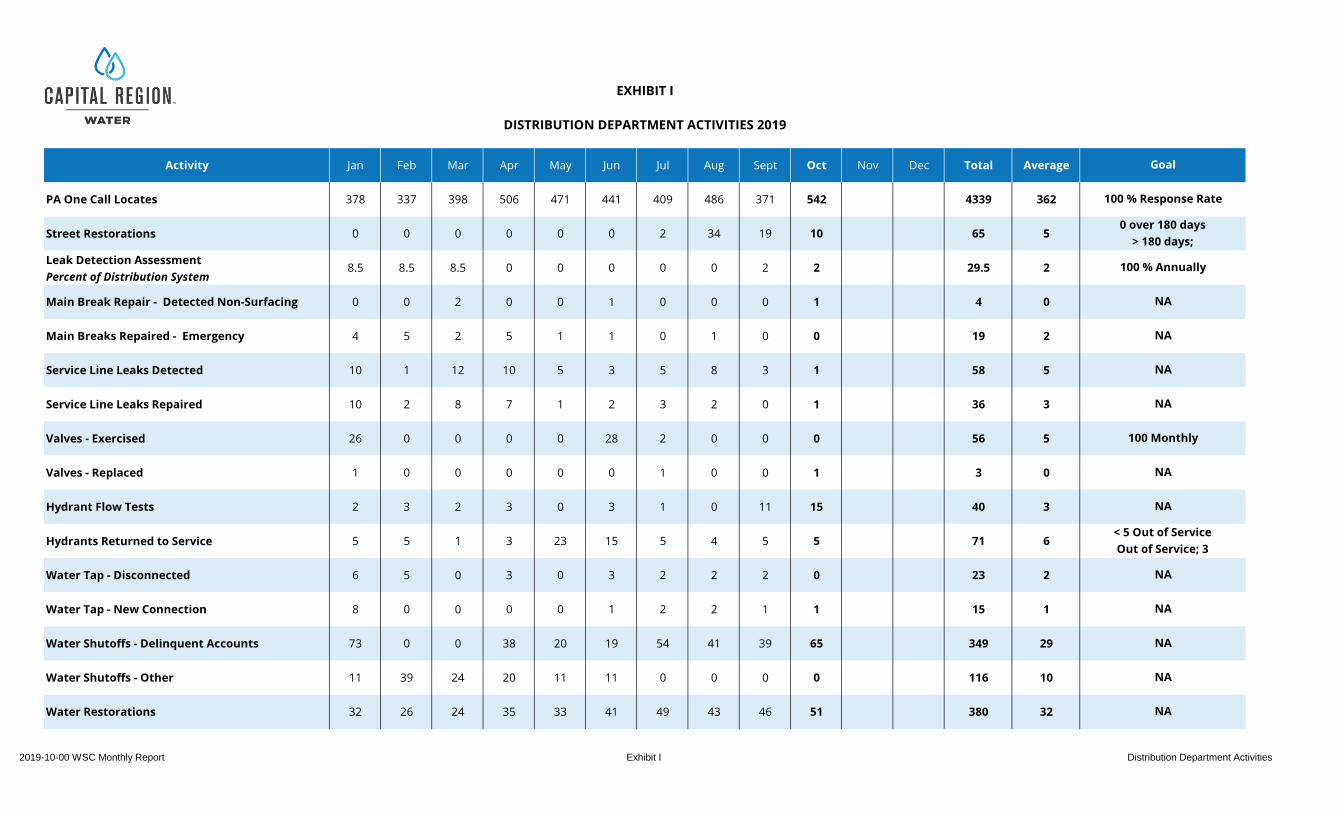
PA One Call Locates 378 337 398 506 471 441 409 486 371 542 0 0 4339 362
Street Restorations 0 0 0 0 0 0 2 34 19 10 0 0 65 5
Leak Detection Assessment
Percent of Distribution System 8.5 8.5 8.5 0 0 0 0 0 2 2 0 0 29.5 2
Main Break Repair - Detected Non-Surfacing 0 0 2 0 0 1 0 0 0 1 0 0 4 0
Main Breaks Repaired - Emergency 4 5 2 5 1 1 0 1 0 0 0 0 19 2
Service Line Leaks Detected 10 1 12 10 5 3 5 8 3 1 0 0 58 5
Service Line Leaks Repaired 10 2 8 7 1 2 3 2 0 1 0 0 36 3
Valves - Exercised 26 0 0 0 0 28 2 0 0 0 0 0 56 5
Valves - Replaced 1 0 0 0 0 0 1 0 0 1 0 0 3 0
Hydrant Flow Tests 2 3 2 3 0 3 1 0 11 15 0 0 40 3
Hydrants Returned to Service 5 5 1 3 23 15 5 4 5 5 0 0 71 6
Water Tap - Disconnected 6 5 0 3 0 3 2 2 2 0 0 0 23 2
Water Tap - New Connection 8 0 0 0 0 1 2 2 1 1 0 0 15 1
Water Shutoffs - Delinquent Accounts 73 0 0 38 20 19 54 41 39 65 0 0 349 29
Water Shutoffs - Other 11 39 24 20 11 11 0 0 0 0 0 0 116 10
Water Restorations 32 26 24 35 33 41 49 43 46 51 0 0 380 32 NA
< 5 Out of Service
Out of Service; 3
NA
NA
NA
NA
NA
NA
100 Monthly
NA
NA
100 % Response Rate
0 over 180 days
> 180 days;
100 % Annually
NA
NA
EXHIBIT I
DISTRIBUTION DEPARTMENT ACTIVITIES 2019
Goal
2019-10-00 WSC Monthly Report Exhibit I Distribution Department Activities

Board Monthly Report Distribution Monthly Report
Activity Activity Jan Feb Mar Apr May Jun Jul Aug Sept Oct Nov Dec Total Average
Meter Installations
Missing 4 6 2 2 9 8 5 11 3 9 59 6
Leaking 1 10 7 1 7 6 3 5 2 3 45 5
Frozen 9 31 8 10 10 0 1 3 6 3 81 8
Non-registering 6 4 8 2 8 4 6 7 13 7 65 7
Incompatible 0 0 0 4 3 1 4 5 5 3 25 3
New Service New Installation 6 0 1 1 0 1 2 2 0 1 14 1
Meter Service
MXU's Replaced MXU's Replaced 17 11 5 8 19 17 23 29 14 28 171 17
Batteries Replaced Batteries Replaced 92 37 37 50 25 42 27 34 65 58 467 47
Meter Pits Serviced Meter Pits Serviced 0 0 0 0 0 1 2 0 0 0 3 0
Meter Calibrations
Large Meters1 Calibrated meters (Large) 0 0 0 0 0 0 0 0 0 0 0 0
Small Meters2 Calibrated meters (Small) 25 0 0 0 0 0 0 0 0 0 25 3
1 Large Meters are Meters 3" or greater that are calibrated at the customer's location by a contracted calibration service, assisted and witnessed by CRW staff
2 Small Meters are Meters 2" or less that are calibrated at the Water Services Center by CRW staff on a certified calibration stand
EXHIBIT J
Metering Activities 2019
Replacement
2019-10-00 WSC Monthly Report Exhibit J Distribution Division Activities

Category of Water Use Description Jan Feb Mar Apr May Jun Jul Aug Sept Oct Nov Dec Total Average
Process Water Process Water 674,255 595,236 632,456 637,752 659,011 412,683 458,194 223,200 168,365 691,000 0 0 5,152,152 429,346
Billed Metered Exported Bulk Water Hauling 55,800 37,100 74,100 593,900 726,900 688,200 714,400 342,900 NA NA 0 0 3,233,300 323,330
Billed Metered Hydrant Connections 357,800 608 0 32,537 575,041 4,075 111,784 64,964 15,574 110,498 0 0 1,272,881 106,073
Billed Unmetered Hydrant Flow Tests 1,590 32,200 17,190 14,650 0 5,924 11,000 0 11,242 8,080 0 0 101,876 8,490
Unbilled UnmeteredHydrant Flushing
(and Unbilled Authorized)46,525 72,648 55,567 67,775 61,835 79,745 32,357 33,925 74,195 50,080 0 0 574,652 47,888
Unauthorized Water Theft TBD TBD TBD TBD TBD TBD TBD TBD TBD TBD 0 0 0 0
Leakage on Distribution
MainsMain Leaks 2,562,533 1,142,804 46,530 420,011 231,293 164,160 0 10,000 0 1,521,360 0 0 6,098,691 508,224
Leakage on Service Lines Service Leaks 2,128,995 501,120 404,640 293,707 317,448 34,560 212,120 535,680 11,520 733,723 0 0 5,173,513 431,126
Leakage on Storage Tanks High Reservoir Leakage 0 0 0 0 0 0 0 0 0 0 0 0 0 0
Total 5,827,498 2,381,716 1,230,483 2,060,332 2,571,528 1,389,347 1,539,855 1,210,669 280,896 3,114,741 21,607,065 2,160,707
EXHIBIT K
Miscellaneous Water Usage (gals) 2019
2019-10-00 WSC Monthly Report Exhibit K Distribution Division Activities

Wastewater
Wastewater

WASTEWATER DIVISION
MONTHLY REPORT
Primary Digester Rehab Project - Mixer Installation
October 2019
1662 South Cameron Street, Harrisburg, PA 17104 | 888-510-0606 capitalregionwater.com

N:\CRW\Monthly Reports\Operations\Wastewater\Final Drafts\2019-10-00 AWTF Monthly Report.docx
AWTF Monthly Report October 2019
Page 1 of 3
Operations During the month of October, the AWTF met all monthly average NPDES permit requirements. One Sanitary Sewer Overflow was reported. Details are contained in the Field Operations section below. Hydraulic loading to the AWTF averaged 19.3 million gallons per day (MGD). The treatment process achieved removal reductions of 97.2 percent CBOD, 97.7 percent Suspended Solids, 56.5 percent Phosphorus, 93.4 percent Ammonia, and 75.6 percent Nitrogen (Exhibit A). Revenue of the Contract Waste Hauling program collected $54,766.55 in revenue from 1,833,394 gallons discharged (Exhibit G). Revenues bounced back from lagging numbers in the month of September. The Cogeneration Facility experienced a slight improvement in production and run time over recent months. Revenue is estimated at $ 6,392.95 on 91,800 kilowatt-hours generated for the month with an average run time of 30 percent between both units. The drop is attributable to mechanical problems with the 36-year-old units. Activity for the Primary Digester Rehabilitation Project continued in October. All blasting and coating of the inside of Digester No. 2 cover has been completed. The scaffolding in the interior of the tank has been disassembled and removed. All work regarding the draw-off spools, steam lances and sludge piping have been completed. The new Linear Motion Mixer has been installed. The superficial insulated roofing will be installed throughout November. The tank is expected to be available for commissioning in early January.
Laboratory • Completed the second semi-annual series of industrial user compliance sampling at the Hershey
Creamery Company. • Completed bi-monthly sampling and testing of biosolids for pollutants and fecal coliforms as
required by our beneficial reuse (PAG08) permit. • Completed Biosolids and Grit Form 43 testing required for landfill disposal.
Pretreatment • Completed semi-annual industrial user self-monitoring inspections at The AMES
Companies, Inc., Hershey Creamery Company and the Norfolk Southern Railway Company’s Harrisburg Yard.
• Received self-monitoring reports submitted for September and the third quarter of 2019.

N:\CRW\Monthly Reports\Operations\Wastewater\Final Drafts\2019-10-00 AWTF Monthly Report.docx
AWTF Monthly Report October 2019
Page 2 of 3
• Investigated and responded to several Street Sweeping complaints including a visit to 18th and Paxton Streets assure the street was adequately swept during the concurrent street sweeping event of October 18, 2019.
• Investigated and authorized a sewer abatement at 3300 N. Second Street for water not discharged to the sanitary sewer as the result of a leak.
Plant Maintenance • Continued leak detection of boiler water loss. • Continued repairs to Barscreen No. 2 at the Front Street Pump Station • Removed Pump No. 1 for repairs at Front Street Pump Station. • Replaced corner sweep cables on Final Clarifier No. 1. • Lubricated compressor intake valves and unloaders on the gas compressor. • Drained and adjusted all chain drives on drive mechanisms on Primary Clarifier No. 3. • Removed pump assembly to clear the inlet line of blockage on the Primary Sludge Pump. • Removed Pump No. 1 to replace mechanical seal at the Return Sludge Pump Station. • Installed new cooper water lines to all four pumps at the Return Sludge Pump Station. • Replaced Diluent Water Pump No. 1 at the Settled Sewage Pump Station. • Repaired and replaced Pump No. 2 at the Spring Creek Pump Station. • Replaced solenoid valve on sample line at the Thickeners. • Performed 12 vehicular related repairs.
Field Maintenance • Completed street restorations at James and Sayford Streets, William Street, 4th and Sayford
Streets, and 2nd and Wiconisco Streets. • Performed an emergency repair on an 8-inch clay sewer line on Christian Street and replaced
with 6 feet of SDR. Line was damaged by a water main break. • Completed installation of new pre-cast stormwater inlet at the intersection of 2nd and North
Streets. Connected inlet to existing 12-inch SSP with SDR. Repaired a 4-foot section of 12-inch sewer line that was removed for a previous sewer back up.
• Rogele completed installation of 212-foot of 18-inch SDR. Brick line was collapsed and a new manhole on the 1400 block of Derry Street was installed. CRW’s crew assisted in bypass pumping, CCTV investigation, line flushing, and daylighting utilities.
• Installed new manhole casing and repaired the manhole structure at the intersection of 3rd and Pine Streets.
• Repaired a stormwater pipe and completely reconstructed at inlet at 159 Royal Terrace as part of a sinkhole remediation project.
• Milled and recessed steel street plates for the upcoming winter season. CRW will be monitoring weekly and after any snowstorms.
• Repaired or replaced 22 inlets at various locations throughout the City.

N:\CRW\Monthly Reports\Operations\Wastewater\Final Drafts\2019-10-00 AWTF Monthly Report.docx
AWTF Monthly Report October 2019
Page 3 of 3
Field Operations • Responded to 10 backup and overflow calls. CRW was liable for one at 901 Capital Street. A heavy
accumulation of grease had caused a blockage in the sewer main. The line was promptly cleaned, and flow was restored. No significant damage resulted from the backup. A source investigation was conducted by CRW’s Environmental Compliance officer (see below). A full report of this incident was submitted to PADEP.
• The Field Operations Department focused heavily on semi-annual preventative maintenance of its CSO structures in the month of October. A total of 44 were completed throughout the month. Three remain and will be completed in early November.
• Responded to and investigated two sinkhole calls. CRW was liable for none. • Cleaned nine stormwater inlets. • A total of 15,074.57 feet (2.86 miles) of sewer pipe were assessed by CCTV throughout the month
by both Field Operations staff and contractors. • Flushed 2,549.32 feet (.48 miles) of sanitary sewer lines. • Repaired an overflow weir at CSO #058 at Front and Tuscarora Streets. • Cleaned the sump in Thickener Number 2 and flushed the feed line.
Environmental Compliance • A Fats Oils and Grease (FOG) source registry was created and uploaded into Cityworks by the
GIS Manager and Cityworks Administrator. FOG dischargers will be visible on a new layer in the GIS map and inspection reports will be recorded and saved in Cityworks for each establishment.
• Directly following a rain event, a large amount of grease was found in CSO #055. As a result, Environmental Compliance inspected grease traps at 12 restaurants and provided each owner/manager with education information regarding best management practices for commercial grease control equipment.
• CRW’s Environmental Compliance Inspector received a call from Harrisburg’s Fire Department regarding petroleum products running down the street in the vicinity of 10th and Hanna Streets. The incident was the result of stormwater run-off from the Hebron junkyard during a rain event. Samples were taken to determine if a prohibited discharge to CRW’s collection system took place.
• Field Operations informed Environmental Compliance of an SSO caused by excessive grease in a sewer line located behind two restaurants in the 400 block of Forster Street. Environmental Compliance conducted grease trap inspections at the two establishments to verify if the equipment was being maintained properly and best management practices were being followed. Both locations’ grease traps appeared to be properly maintained and educational information was provided to owners.

Wastewater Exhibits

EXHIBIT A
CAPITAL REGION WATER
ADVANCED WASTEWATER TREATMENT FACILITY
Process Control - 2019
NPDES
Parameters January February March April May June July August September October November December Average Limits
Volume, MGD 31.4 32.3 32.0 27.5 31.0 22.6 20.8 17.3 15.7 19.3 25.0 37.7
Carbonaceous Biochemical Oxygen Demand
Influent, mg/L 106 103 121 122 116 119 123 125 139 125 120 -----
Effluent, mg/L 4 3 4 3 4 3 3 3 3 3 3 25
Percent Removal, % 95.9 96.8 96.0 97.4 96.2 97.3 97.6 97.7 97.8 97.2 97.0 -----
Effluent Loading, lb/d 1,011 865 1,103 755 996 592 489 422 346 479 706 7,860
Suspended Solids:
Influent, mg/L 137 135 138 163 135 154 149 169 172 169 152 -----
Effluent, mg/L 6 5 7 4 6 6 3 4 3 4 5 30
Percent Removal, % 94.9 95.8 93.4 97.3 94.4 96.6 97.6 97.5 98.2 97.7 96.3 -----
Effluent Loading, lb/d 1,786 1,509 2,454 1,114 1,786 1,154 616 595 400 684 1,210 9,433
Nitrogen
Total-N
Influent, mg/L 18 19 19 21 17 24 28 28 23 26 22 -----
Effluent, mg/L 8.7 13.2 10 8.5 5.9 4.9 5.9 6.3 5.9 6.4 8 Monitor
Percent Removal, % 51.4 32.0 47 58.5 65.3 79.5 79.0 77.1 74.6 75.6 64.0 -----
Effluent Loading, lb/d 2,194 3,268 2443 1,847 1,661 912 1,018 939 758 955 1,600 -----
NH3-N
Influent mg/L 8 10 9 11 10 13 13 14 14 12 11 -----
Effluent, mg/L 3.3 4.6 1.7 2.5 1.5 0.6 0.5 0.9 0.7 0.8 2 11 (2)
Percent Removal, % 58.8 51.6 81.9 78.1 84.4 95.3 96.2 93.7 94.9 93.4 82.8 -----
Effluent Loading, lb/d 839 1,202 453 562 361 111 84 136 92 134 397 4,716
Phosphorus:
Influent, mg/L 2.5 2.2 2.2 2.7 2.3 2.9 3.2 3.4 3.4 3.2 2.8 -----
Effluent, mg/L 0.8 0.7 0.8 1.0 1.0 1.6 1.7 1.9 1.8 1.4 1.3 2.0
Percent Removal, % 65.8 68.3 62.7 63.2 53.6 44.8 43.9 41.6 47.1 56.5 54.8 -----
Effluent Loading, lb/d 205 175 209 220 244 291 279 276 227 211 234 629
pH:
Influent, Std. Units 7.2 7.3 7.3 7.2 7.2 7.2 7.2 7.2 7.2 7.2 7.2 -----
Effluent, Std. Units 7.1 7.1 7.0 7.0 6.9 6.9 6.9 7.0 7.1 7.0 7.0 6.0 - 9.0
Dissolved Oxygen:
Effluent Minimum, mg/L 7.8 7.7 7.8 7.0 6.8 7.2 6.5 6.2 7.1 6.2 7.0 5.0 Min.
Fecal Coliform:
Effluent, No./100 ml 6 9 40 10 4 2 2 2 1 11 9 200/100 ml (1)
Chlorine Residual:
Effluent, mg/L 0.21 0.19 0.21 0.20 0.38 0.40 0.40 0.45 0.41 0.21 0.31 0.50
(1) Seasonal limit 2,000/100 ml Oct. 1 to Apr. 30 and 200/100 ml May 1 to Sept. 30.
(2) Seasonal Limit May 1 to Nov.1.
PROCESS2019-A.xls 5

EXHIBIT B
CAPITAL REGION WATER
ADVANCED WASTEWATER TREATMENT FACILITY
Flow Monitoring Information, MGD - 2019
Total
Total Precip
Month Flow City Suburbs 1 2 3 4 5 6 7 8 9 10 inches
January 31.400 14.160 17.240 11.736 0.185 0.356 1.476 0.407 2.100 6.461 2.129 6.002 0.548 3.220
February 32.300 15.534 16.766 13.016 0.185 0.355 1.524 0.454 1.900 6.467 2.129 5.799 0.471 3.050
March 32.000 14.695 17.305 12.623 0.185 0.355 1.166 0.366 2.000 6.813 2.129 5.855 0.508 4.630
April 27.500 12.532 14.968 10.572 0.211 0.321 1.033 0.395 1.800 5.651 2.429 4.678 0.410 4.800
May 31.000 15.033 15.967 13.346 0.185 0.341 0.734 0.427 1.800 6.298 2.129 5.302 0.438 6.470
June 23.100 10.581 12.519 8.706 0.185 0.320 1.146 0.224 1.600 4.610 2.129 3.876 0.304 3.870
July 20.800 9.069 11.731 7.623 0.178 0.258 0.812 0.198 1.300 4.332 2.046 3.783 0.270 3.730
August 17.300 7.306 9.994 5.894 0.138 0.250 0.868 0.156 1.300 3.826 1.586 3.070 0.212 3.990
September 15.700 6.054 9.646 4.656 0.138 0.256 0.870 0.134 1.200 3.440 1.586 3.229 0.191 2.330
October 19.300 8.426 10.875 7.222 0.175 0.262 0.603 0.164 1.300 3.871 2.010 3.498 0.195 6.820
November
December
Average 25.04 11.34 13.70 4.29
Percent 100.00 45.28 54.72 42.91
City
City Regions Suburb Regions
0
5
10
15
20
25
30
35
1 2 3 4 5 6 7 8 9 10 11 12
Flo
w, M
GD
Time, months
Flow Data
2019
Total
City
Suburbs
46%
54%
Twelve Month ConsecutiveNov. 2018 THRU Oct.. 2019
City
Suburbs
FLOW2019-B.xls 6

EXHIBIT C
CAPITAL REGION WATER
ADVANCED WASTEWATER TREATMENT FACILITY
Treatment Utility and Chemical Usage - 2019
Utility / Chemical January February March April May June July August September October November December Average Total
Electric
Total, kwH 1,267,200 1,035,900 1,190,400 1,038,300 1,069,800 1,055,400 957,000 920,700 984,000 1,004,700 1,052,340 10,523,400
Average, kwH/Day 40,877 36,996 38,400 34,610 34,510 35,180 30,871 29,700 32,800 32,410 34,635 -------
Cost, Dollars $65,548.84 $55,147.16 $60,631.65 $54,993.66 $56,685.86 $55,764.47 $49,686.30 $48,508.52 $51,950.14 $51,713.76 $55,063.04 $550,630.36
Natural Gas
Total, Cu Ft 491.1 610.1 227.9 38.2 0.6 0.9 0.9 0.4 24.3 * 139 1,394
Average, Cu Ft/Day 16 22 7 1 0 0 0 0 1 * 5 -------
Cost, Dollars $4,525.13 $5,598.12 $2,144.85 $425.59 $84.83 $72.44 $88.32 $83.94 $298.39 * $1,332.16 $13,321.61
Water
Total, Gal. 1,462,000 1,415,000 1,209,260 1,200,031 901,709 895,000 1,168,348 603,652 1,257,999 * 1,123,667 10,112,999
Average, Gal./Day 47,161 50,536 39,008 40,001 29,087 29,833 37,689 19,473 41,933 * 37,191 -------
Cost, Dollars $17,227.30 $16,773.75 $14,788.36 $14,699.30 $11,820.49 $11,755.75 $14,393.55 $8,944.25 $15,258.69 * $12,566.14 $125,661.44
Methanol/MicroC
Total, Gal. 1,630 1,459 1,540 4,072 9,789 6,508 8,257 6,114 349 7,110 4,683 46,828
Average, Gal./Day 52.6 52 50 135.7 315.8 216.9 266.4 197.2 12.0 229.4 153 -------
Cost, Dollars $2,315 $2,072 $2,187 $6,841 $17,718 $12,626 $16,019 $11,250 $677 $13,793 $8,549.70 $85,496.95
Sodium Hydroxide
Total, Gal. 0 0 0 0 0 0 0 0 0 0 0 0
Average, Gal./Day 0 0 0 0 0 0 0 0 0 0 0 -------
Cost, Dollars 0 0 0 0 0 0 0 0 0 0 $0.00 $0.00
Chlorine Disinfection
Total, Lbs. 7,161 7,538 8,259 6,743 13,867 10,730 14,204 11,260 7,065 6,990 9,382 93,817
Average, Lbs./Day 231 269 266 224 447 358 434 363 236 225 305 -------
Avg Residual, mg/L 0.21 0.19 0.21 0.20 0.38 0.40 0.40 0.45 0.41 0.21 0.31 -------
Cost, $/Lbs. $0.30 $0.30 $0.30 $0.30 $0.30 $0.31 $0.31 $0.31 $0.31 $0.31 $0.30 -------
Total Cost, Dollars $2,148.30 $2,261.40 $2,477.70 $2,022.90 $4,160.10 $3,326.30 $4,403.24 $3,490.60 $2,190.15 $2,166.90 $2,864.76 $28,647.59
Phosphorous Removal
Total FeCl3, Gals. 2,640 2,778 2,528 2,193 1,221 430 714 3,793 4,541 5,272 2,611 26,110
Avg FeCl3, Gals./Day 85 99 82 73 39 14 23 122 151 170 86 -------
FeCl3 Cost, $/Gal. $0.98 $0.98 $1.26 $1.26 $1.26 $1.26 $1.26 $1.26 $1.26 $1.26 $1.20 -------
FeCl3 Total Cost, Dollars $2,587.20 $2,722.44 $3,185.28 $2,763.18 $1,538.46 $541.80 $899.64 $4,779.18 $5,721.66 $6,642.72 $3,138.16 $31,381.56
* No data at time of report
<---------Methanol to MicroC Phase-In Period ------->
MAIN PLANT UTILITY & CHEM C-2019.xls 7

Percent Daily Avg Kilowatt Hours Estimated
Period Run Time Kilowatt Produced Revenue
January 2018 72 3,281 101,700 $7,082.39
February 2018 74 3,150 88,200 $6,142.25
March 2018 52 2,148 66,600 $4,638.02
April 2018 38 1,770 53,100 $3,697.88
May 2018 42 1,945 60,300 $4,199.29
June 2018 82 2,790 83,700 $5,828.87
July 2018 53 1,684 52,200 $3,635.21
August 2018 56 1,481 45,900 $3,196.48
September 2018 0 0 0 $0.00
October 2018 56 2,003 62,100 $4,324.64
November 2018 36 1,320 39,600 $2,757.74
December 2018 15 552 17,100 $1,190.84
Total - 2018 670,500 $46,693.62
Monthly Average - 2018 48 1,844 55,875 $3,891.14
January 2019 0 0 0 $0.00
February 2019 2 32 900 $62.68
March 2020 29 2,090 64,800 $4,512.67
April 2019 70 4,050 121,500 $8,461.26
May 2019 107 5,197 161,100 $11,219.00
June 2019 79 3,570 107,100 $7,458.44
July 2019 60 2,439 75,600 $5,264.78
August 2019 30 1,306 40,500 $2,820.42
September 2019 42 1,800 54,000 $3,760.56
October 2019 62 2,961 91,800 $6,392.95
November 2019
December 2019
Total - 2019 717,300 $49,952.77
Monthly Average - 2019 48 2,344 71,730 $4,995.28
EXHIBIT D
CAPITAL REGION WATER
ADVANCED WASTEWATER TREATMENT FACILITY
Cogeneration Electrical Production: 2018-2019
0
2000
4000
6000
8000
10000
12000
J F M A M J J A S O N D J F M A M J J A S O N D
Rev
enu
e, D
oll
ars
Month
2018 2019
COGEN2019-D.xls 8

EXHIBIT E
CAPITAL REGION WATER
ADVANCED WASTEWATER TREATMENT FACILITY
Sludge Handling Information - 2019
Process January February March April May June July August September October November December Average Total
Solids Removal
Process, Lbs. 923,295 1,251,234 761,394 864,274 1,087,905 648,653 726,853 547,163 555,269 721,495 808,754 8,087,535
CWH Program, Lbs. 113,067 88,846 179,642 186,391 195,054 207,439 179,822 164,940 121,013 186,639 162,285 1,622,852
Total Solids, Lbs. 1,036,362 1,340,080 941,036 1,050,665 1,282,959 856,093 906,675 712,103 676,282 908,134 971,039 9,710,387
Sludge Dewatering
Feed Volume, Gals. 3,259,000 2,925,000 3,596,000 3,361,000 3,048,000 3,246,000 4,696,000 3,492,000 3,099,000 2,680,000 3,340,200 33,402,000
Feed Solids, % 2.1 2.1 1.8 1.9 2.0 2.0 1.7 1.8 1.9 1.8 1.9 -
Labor, Hours 470 459 477 486 492 486 609 450 457 374 476 4,758
Operations, Hours 843 734 924 921 777 1,030 1,114 792 772 741 865 8,649
Total Cake, Dry Tons 226 204 233 217 212 226 262 221 219 150 217 2,170
Total Cake, Wet Tons 1,262 1,117 1,285 1,180 1,168 1,215 1,454 1,199 1,183 857 1,192 11,920
Cake TS, % 17.9 18.3 18.2 18.5 18.2 18.7 18.0 18.5 18.5 17.6 18.2 -
Press Rate, Lbs./Hour 2,996 3,043 2,780 2,564 3,005 2,360 2,610 3,027 3,064 2,312 2,776 27,760
Polymer Dosage, Lbs 5,182 4,209 4,728 4,414 4,446 4,766 5,483 3,891 3,467 2,523 4,311 43,109
Polymer Dosage, Lbs/Dry Ton 24.6 22.1 21.0 21.0 21.8 22.9 29.0 18.7 16.1 16.4 21.4 -
Disposal Cost
Labor, Dollars $9,041.09 $8,829.67 $9,160.25 $9,335.15 $9,450.47 $9,335.15 $11,699.21 $8,650.92 $8,775.85 $7,178.67 $9,145.64 $91,456.45
Electrical,Dollars $370.70 $323.05 $406.69 $405.06 $342.01 $453.11 $490.29 $348.61 $339.77 $326.22 $380.55 $3,805.52
Polymer, Dollars $9,949.44 $8,081.28 $9,077.76 $8,474.88 $8,536.32 $9,150.72 $10,527.36 $7,470.72 $6,656.64 $4,844.16 $8,276.93 $82,769.28
Disposal, Dollars $53,055.76 $35,958.84 $38,886.09 $26,605.03 $35,521.52 $32,386.58 $62,964.06 $27,002.36 $47,464.19 $29,933.91 $38,977.83 $389,778.32
Total Cost, Dollars $72,416.99 $53,192.84 $57,530.79 $44,820.13 $53,850.33 $51,325.56 $85,680.92 $43,472.61 $63,236.45 $42,282.95 $56,780.96 $567,809.57
Cost Per Dry Ton, Dollars $320.27 $260.75 $246.91 $206.54 $254.01 $227.10 $327.03 $196.71 $288.75 $281.89 $261.00
SLUDGE2019-E.xls 9
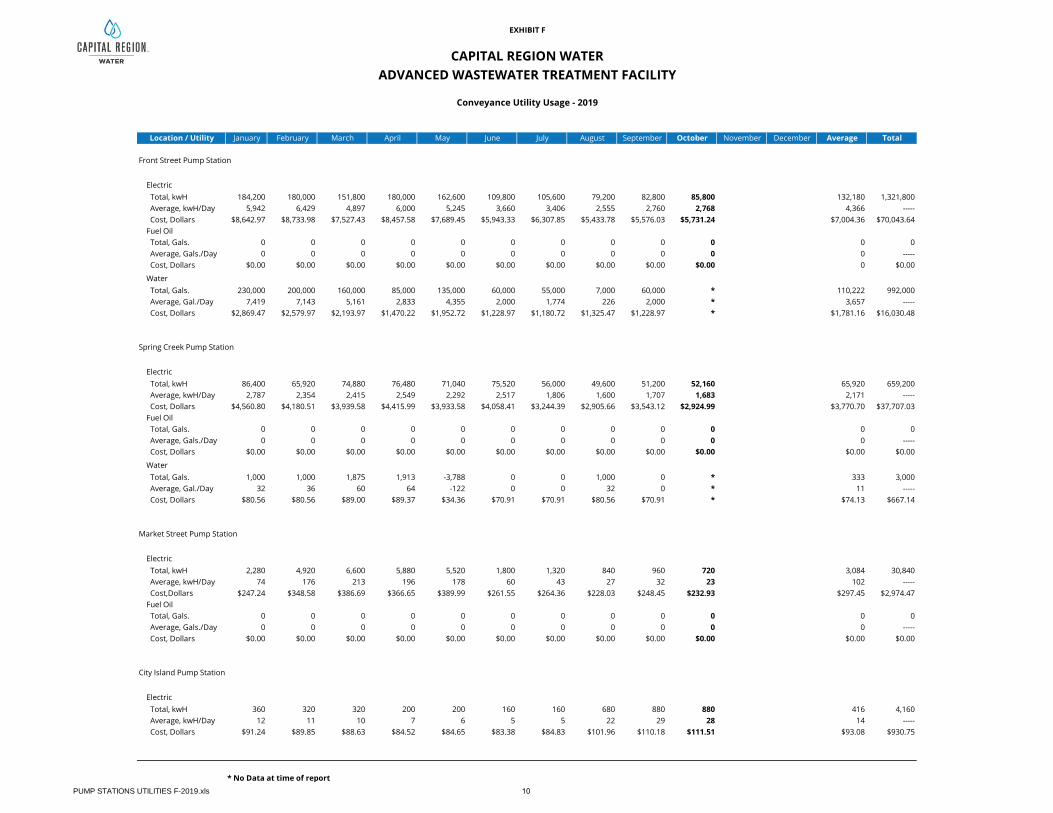
EXHIBIT F
CAPITAL REGION WATER
ADVANCED WASTEWATER TREATMENT FACILITY
Conveyance Utility Usage - 2019
Location / Utility January February March April May June July August September October November December Average Total
Front Street Pump Station
Electric
Total, kwH 184,200 180,000 151,800 180,000 162,600 109,800 105,600 79,200 82,800 85,800 132,180 1,321,800
Average, kwH/Day 5,942 6,429 4,897 6,000 5,245 3,660 3,406 2,555 2,760 2,768 4,366 -----
Cost, Dollars $8,642.97 $8,733.98 $7,527.43 $8,457.58 $7,689.45 $5,943.33 $6,307.85 $5,433.78 $5,576.03 $5,731.24 $7,004.36 $70,043.64
Fuel Oil
Total, Gals. 0 0 0 0 0 0 0 0 0 0 0 0
Average, Gals./Day 0 0 0 0 0 0 0 0 0 0 0 -----
Cost, Dollars $0.00 $0.00 $0.00 $0.00 $0.00 $0.00 $0.00 $0.00 $0.00 $0.00 0 $0.00
Water
Total, Gals. 230,000 200,000 160,000 85,000 135,000 60,000 55,000 7,000 60,000 * 110,222 992,000
Average, Gal./Day 7,419 7,143 5,161 2,833 4,355 2,000 1,774 226 2,000 * 3,657 -----
Cost, Dollars $2,869.47 $2,579.97 $2,193.97 $1,470.22 $1,952.72 $1,228.97 $1,180.72 $1,325.47 $1,228.97 * $1,781.16 $16,030.48
Spring Creek Pump Station
Electric
Total, kwH 86,400 65,920 74,880 76,480 71,040 75,520 56,000 49,600 51,200 52,160 65,920 659,200
Average, kwH/Day 2,787 2,354 2,415 2,549 2,292 2,517 1,806 1,600 1,707 1,683 2,171 -----
Cost, Dollars $4,560.80 $4,180.51 $3,939.58 $4,415.99 $3,933.58 $4,058.41 $3,244.39 $2,905.66 $3,543.12 $2,924.99 $3,770.70 $37,707.03
Fuel Oil
Total, Gals. 0 0 0 0 0 0 0 0 0 0 0 0
Average, Gals./Day 0 0 0 0 0 0 0 0 0 0 0 -----
Cost, Dollars $0.00 $0.00 $0.00 $0.00 $0.00 $0.00 $0.00 $0.00 $0.00 $0.00 $0.00 $0.00
Water
Total, Gals. 1,000 1,000 1,875 1,913 -3,788 0 0 1,000 0 * 333 3,000
Average, Gal./Day 32 36 60 64 -122 0 0 32 0 * 11 -----
Cost, Dollars $80.56 $80.56 $89.00 $89.37 $34.36 $70.91 $70.91 $80.56 $70.91 * $74.13 $667.14
Market Street Pump Station
Electric
Total, kwH 2,280 4,920 6,600 5,880 5,520 1,800 1,320 840 960 720 3,084 30,840
Average, kwH/Day 74 176 213 196 178 60 43 27 32 23 102 -----
Cost,Dollars $247.24 $348.58 $386.69 $366.65 $389.99 $261.55 $264.36 $228.03 $248.45 $232.93 $297.45 $2,974.47
Fuel Oil
Total, Gals. 0 0 0 0 0 0 0 0 0 0 0 0
Average, Gals./Day 0 0 0 0 0 0 0 0 0 0 0 -----
Cost, Dollars $0.00 $0.00 $0.00 $0.00 $0.00 $0.00 $0.00 $0.00 $0.00 $0.00 $0.00 $0.00
City Island Pump Station
Electric
Total, kwH 360 320 320 200 200 160 160 680 880 880 416 4,160
Average, kwH/Day 12 11 10 7 6 5 5 22 29 28 14 -----
Cost, Dollars $91.24 $89.85 $88.63 $84.52 $84.65 $83.38 $84.83 $101.96 $110.18 $111.51 $93.08 $930.75
* No Data at time of report
PUMP STATIONS UTILITIES F-2019.xls 10

EXHIBIT G
CAPITAL REGION WATER
ADVANCED WASTEWATER TREATMENT FACILITY
Contract Waste Hauling Program 2018 - 2019
Total
Month Gallons Revenue Gallons Revenue Gallons Revenue
January 1,161,037 $40,430.98 17,000 $612.00 1,178,037 $41,042.98
February 834,202 $27,840.84 0 $0.00 834,202 $27,840.84
March 2,206,654 $69,370.76 145,750 $5,229.00 2,352,404 $74,599.76
April 1,228,041 $39,231.22 183,750 $6,570.00 1,411,791 $45,801.22
May 1,359,171 $53,762.34 236,350 $8,236.80 1,595,521 $61,999.14
June 1,955,124 $65,780.22 292,050 $9,829.80 2,247,174 $75,610.02
July 747,864 $21,569.15 197,450 $6,892.20 945,314 $28,461.35
August 3,481,113 $97,107.66 296,200 $10,393.86 3,777,313 $107,500.86
September 2,184,195 $62,148.47 175,850 $6,159.60 2,360,045 $68,308.07
October 2,433,109 $72,789.18 356,250 $12,461.40 2,789,359 $85,250.58
November 2,094,327 $59,575.34 216,700 $7,614.00 2,311,027 $67,189.34
December 3,015,517 $87,695.91 165,300 $5,878.80 3,180,817 $93,574.71
Total - 2018 22,700,354 $697,302.07 2,282,650 $79,877.46 24,983,004 $777,178.87
Monthly Average - 2018 1,891,696 $58,108.51 190,221 $6,656.46 2,081,917 $64,764.91
January 1,870,734 $58,200.31 76,194 $2,635.00 1,946,928 $60,835.31
February 1,652,484 $47,296.19 61,450 $2,194.20 1,713,934 $49,490.39
March 2,638,668 $77,849.31 106,300 $3,763.80 2,744,968 $81,613.11
April 2,682,379 $75,853.22 268,061 $9,571.00 2,950,440 $85,424.22
May 3,043,986 $86,173.72 260,750 $6,234.00 3,304,736 $95,407.72
June 2,720,047 $78,840.38 284,800 $10,033.20 3,004,847 $88,873.58
July 2,853,248 $80,870.80 212,100 $7,455.60 3,065,348 $88,326.40
August 1,322,313 $40,005.18 283,250 $9,716.40 1,605,563 $49,721.58
September 960,300 $27,800.77 256,900 $9,176.40 1,217,200 $36,977.17
October 1,569,294 $45,330.95 264,100 $9,435.60 1,833,394 $54,766.55
November
December
Total - 2019 21,313,453 $618,220.83 2,073,906 $70,215.20 23,387,358 $691,436.03
Monthly Average - 2019 2,131,345 $61,822.08 207,391 $7,021.52 2,338,736 $69,143.60
Process Septic
0
20000
40000
60000
80000
100000
120000
J F M A M J J A S O N D J F M A M J J A S O N D
Rev
enu
e, D
oll
ars
Month
2018 2019
Septic
Process
CWH2019-G.xls 11