crust formation on sandy soils in the sahel i. rainfall and infiltration
TRANSCRIPT

Soil & Tillage Research, 4 (1984) 5--23 5 Elsevier Science Publishers B.V., Amsterdam -- Printed in The Netherlands
CRUST FORMATION ON SANDY SOILS IN THE SAHEL I. RAINFALL AND INFILTRATION*
W.B. HOOGMOED 1 and L. STROOSNIJDER 2
~Agricultural University, Tillage Laboralory, Diedenweg 20, 6703 GW Wageningen (The Netherlands)
2Agricultural University, Laboratory of Soil Physics, De Dreijen 3, 6703 BC Wageningen (The Netherlands)
(Accepted 24 March 1983)
ABSTRACT
Hoogmoed, W.B. and Stroosnijder, L., 1984. Crust formation on sandy soils in the Sahel. I. Rainfall and infiltration. Soil Tillage Res., 4: 5--23.
Sandy soils of the Sahel area in West Africa, mainly cropped to millet (Pennisetum typhoides) are very sensitive to crust formation. Crusts strongly reduce infiltration capa- city. In this area most fields are gently sloping (1--3%) and hence runoff is a widespread phenomenon; on the average 25% of the rain (mainly in the form of a few large storms during the rainy season) is lost by runoff. The causes of crust formation and its effect on the infiltration rate are discussed. On untilled soils the presence of a crust is a permanent feature. Rainfall characteristics play a key role in crust formation. Major rainfall charac- teristics of the Sahel differ significantly from those of other semi-arid areas.
INTRODUCTION
The Sahel area has a semi-arid climate characterized by average annual rainfall limits (isohyets) of 100 mm year -1 in the north to 600 mm year -1 in the south (Fig. 1). There is a short, wet summer period with a one-peak rain- fall distribution and a prolonged dry period (Fig. 2). Air temperature, humi- dity, wind speed and irradiation do not differ significantly from one year to another (Fig. 3). As a result, the potential evapotranspiration is a rather con- servative quantity, showing a pronounced drop during the (rainy) growing season (Fig. 4). Rainfall is the most variable environmental condition, on an annual basis (Fig. 5) and especially so on a month or decade (ten-day period)
*Contribution from the Tillage Laboratory and the Laboratory of Soil Physics, Agricul- tural University, Wageningen, The Netherlands and DGIS (Directorate General for Inter- national Cooperation) in the project: "Development of criteria and methods for im- proving the efficiency of soil management and tillage operations, with special reference to arid and semi-arid regions", a joint project with the Hebrew University, Department of Soils and Water Science, Rehovot, Israel.
0167-1987/84/$03.00 © 1984 Elsevier Science Publishers B.V.

of Cancer
Niger Chad
) rnm/ year
-600 mm/ yeor
}_ Equat~
Fig. I. The Sahel zone in West Africa with an indication of the sample area at Niono (Mali).
Sout hf500- 700 mrrv'yead
~ 4G t . .
,~ 26 rnm/year) .E O~ I I I I I 1
J F M A M J J A S 0 N D
Fig. 2. Average rainfall distribution for the north and south limits of the Sahel zone (after Davy et al., 1976).
scale (Stroosnijder and Van Heemst, 1982). Rainstorm size and intensity also vary considerably.
The Sahel is a rather fiat area with field slopes of 1--3%. The major part of the Sahel has no external drainage system and runoff therefore leads to a non-uniform infil tration pat tern on slopes and in depressions. In the nor th a limited number of ( temporary dry) river beds feed ( temporary) lakes. In the south some areas have a discharge towards major rivers such as the Senegal, the Niger, the Volta's and the Chari.

40
30
C)
~2o
10
x
" " " , M A X • _ ° . ~ " " .~. - -
"~÷+~ ~ ' ° x +
1 x ~ o
. . . . " : ' ~ ' a / , o ~'~
,, MIN . , • ~.
• x +
xx ~ .~x
x,
I l r l l l l l l l l l
d F M A M J J A S O N D
oo[
x ~ °
. ~ °
° , o °
I I I I I F M A M ,J
D •
, x
i X ÷
+ x
x
I I I I I I t J A S O N D
~2
c
, °
: , " " . ~ e ~ g . ~- .
• • o o ~ B o . +j.~: . • o x x + ,
~-2,5
~," 2,o
1,5
S ~.o
0,5
x~
I x = ~ , + . © x
, • o ~ . ~ " ¢ + .* x x x I D x " +
"o D . ~ ' . o ~ x ° " + + xx x ° ° ~ xx°
x x x
I I I I I I I I I I I I 0 I I I I I I I I E I I I J F M A M J J A S O N D J F M A M J J A S O N D
Fig. 3. Daily maximum and minimum air temperature, relative humidity, wind speed and irradiation. All values are averages over 10<lay periods, measured at Niono (Mali) during 1976 (+),1977 ( - ) ,1978 (x) and 1979 (o).
~ 7
~6 c .o
.L 5 CO C
ILl
. f ~ . main growing .zS~" ~ ~ x . , season
/ / \ ", l/ North
I I i I I I i I I I I I
J F M A M J J A S 0 N D
Fig. 4. Potential evapotranspiration according to Penman for the north and south limits of the Sahel zone (after Cochem~ and Franquin, 1967).

1000
800
-c
.~E 600
.~ 400 oc
Pl'obabflity ('/.)
f i 5 /
J 1o
4 0 ~ , 50 50
80
95
2 0 6
I I I I 0 200 400 600 800
Average rainfall (rnm/year)
Fig. 5. Rainfall probabi l i ty for Mali as a func t ion of average annual precipitation. k
Three types of soil/landscape combinations can be distinguished (Stroo- snijder, 1982): {1) deep sandy softs either in the form of pronounced dunes or eroded dune fields, accounting for 50% of the total area, (2) deep clay soils {recent or fossil river and lake deposits), extending over 20% of the area, and {3) shallow or s tony softs on laterite or sandstone, occupying the remaining 30%. In the north the sandy soils dominate but in the south the shallow or s tony soils do so.
Over a large area softs are covered with recent quaternary eolian deposits. These deposits range from deep and coarse in the north to very fine sandy and loamy in the south, although here these deposits may have disappeared due to erosion. The deep sandy and loamy soils in the south are best suited for cropping; some data of the sandy soil used in the experiments are given in Table I. These softs are slightly acid and chemically very poor, although base saturation is of ten close to 100%. Topsoils are very dense, soft when wet and very hard when dry.
The natural vegetation is in accordance with rainfall, soil type and topo- graphy, mainly via the soil moisture regime (Breman and Stroosnijder,

TABLE I
Data of a typical southern Sahelian soil in Mali used for millet growing
Particle size analysis (%, w/w) Clay (< 2 urn) 5 Fine loam (2--16 #m) 5 Coarse loam (16--50 #m) 10 Very fine sand (50--105/zm) 35 Fine sand (105--210 am) 25 Medium coarse sand (> 210 ~m) 20
Classification Textural : Loamy fine sand USA Soil Taxonomy : Ultie Haptustalf FAO/UNESCO World Map : Eutric Nitosol French system : Sols ferralitiques Local name : S~no
Soil structure Bulk density (kg m -3) at 5 cm depth 1650
at 15 cm depth 1550 at 25 cm depth 1450
Moisture content at pH 2.0 21.0 (%, v/v)
Chemical characteristics pH water 6.0 pH KCI 4.5 C (%, w/w) 0.25 N (%, w/w) 0.025 C/N 10 EC(1:5) (mmho/cm at 25°C) 0.03 Total P (ug/g) 100 P-Bray II (~g/g) 4 K (ug/g) 80 F%O 3 (%, w/w) 0.87 CEC (pH 7) (me/100 g) 2.0 Na (% CEC) i (% CEC) 10 Ca (% CEC) 60 Mg (% CEC) 30 Base saturation (%) 100 CEC (me/100 g clay) 40
1982) . C o n s e q u e n t l y , the g rowing cycles o f na tu ra l species vary f r o m 10 - -30 days in the n o r t h and f r o m 2 0 - - 8 0 days in the sou th . On the average, the area occup ied b y t rees varies f r o m 10% in the sou th to less t h a n 5% in the nor th . Howeve r , these averages con t a i n e x t r e m e s , f r o m a b u n d a n c e in depres- sions to average on d u n e s lopes to nil on the larger clay plains. T h e open Sahel vege ta t ion is d o m i n a t e d b y annua l species. Fas t ge rmina t ing grasses o f the C 4 - p h o t o s y n t h e t i c t y p e p r e d o m i n a t e over s low ge rmina t ing d ico ty les o f the C 3 - p h o t o s y n t h e t i c t y p e . On the average on ly 5% of the b iomass consis ts o f l eguminous annua l species.
Arab le c rops can be g rown in the sou th o f the Sahel on ly . A t the 4 0 0 - m m i sohye t the r isk o f c rop fa i lure is ve ry high and c r o p p i n g is a l ready marginal . E x c e p t i o n s are depress ions and t e m p o r a r y d r y r iver beds. Millet (Pennisetum typhoides) is t he m a j o r cereal c rop . Shor t - season variet ies need a m i n i m u m growing cycle o f 7 5 - - 1 0 0 days in o rde r t o give a grain harves t . S o r g h u m (Sor- ghum bicolor), an i m p o r t a n t cereal c r o p o f t he Savanna area, is g rown in the Sahel on ly in depress ions . G r o u n d n u t (Arachis hypogea) is the m a j o r cash c r o p b u t also f o r m s an i m p o r t a n t pa r t o f t he d ie t o f the local p o p u l a t i o n , the c rop res idue be ing va luable as ca t t l e feed. C o w p e a (Vigna sinensis) is the

10
major grain legume crop, serving as a food and a cash crop. The main crop- ping system is intercropping; there is hardly any sole cropping.
During four years of field work in Maii it was frequently observed that runoff starts very soon after the beginning of a rainstorm, even on sandy soils. Obviously, this is due to the very high rainfall intensity and, on most soils, to the presence of a surface crust. Crust characteristics and infiltration, runoff, evaporation and transpiration were studied for natural pastures in a multidisciplinary research program (Penning de Vries and Djit~ye, 1982). It was concluded that in the southern part of the Sahel nutr ient shortage is the major production limiting factor for the natural vegetation and not, as one might think, water shortage. However, in the south of the Sahel (>400 mm rain per year) sandy and loamy soils axe not only used as pasture for exten- sive grazing but also for growing arable crops, mainly millet (Pennisetum typhoides). Since the growing cycles of these arable crops are longer than those of natural species, water shortage due to runoff and impeded infiltra- tion can be a more important factor for arable crops than it is for the natural pastures. Thus a special s tudy was made of the mechanism of crust forma- tion, rainfall characteristics and water infiltration.
MATERIALS AND METHODS
Rainfall analysis
The sandy softs of the Sahel zone tend to become very hard and com- pacted during the dry season, so with the limited energy sources available (animal or human power), the farmer is forced to delay ploughing until the rain has wetted the soil to a sufficient depth. Crop growth in these regions is determined less by average rainfall than by the actual rainfall distribution in a specific year. Therefore, in the analysis, rains were divided into 3 size classes: small (<10 mm), medium (10--20 mm) and large (>20 mm). For the analysis of the Mali rainfall, observations over three years (1977--1979) were available. Charts of recording rain gauges were analysed through a computer program (Morin and Jarosch, 1977), in which each storm is divided into seg- ments of equal intensity. The distribution of intensity-classes can thus be as- sessed. For 1977, 29 storms (a total of 376 mm rain) measured at one loca- t ion near Niono were analysed. For 1978 and 1979, at 6 locations near Niono, 186 and 212 storms with a total rainfall of 1984 and 2408 mm, re- spectively, were analysed.
The kinetic energy E of a rainstorm is a good indicator of the erosive "power" or erosivity of the rainstorm. According to Wischmeier and Smith (1978), E = 210.3 + 89.0 log I, in which E is the kinetic energy (J m -2 mm -1) and I is the rainfall intensity (mm h-l). However, rainfall characteristics in Africa are different from the U.S.A., and Hudson (1971) found for East Africa a better correlation between rainfall erosivity and E, when E was cal- culated only for I > 25 mm h -1 (the E>25 index). Lal (1976) proposed for

11
Nigeria an even simpler erosivity index, the Aim index, in which A = total rainfall (cm) and Im = maximum intensity (mm h-l). This index is in fact a weighted mean intensity of the rain. These three indices were used to assess and compare rainfall characteristics from different locations.
Crust formation
On many soils in the semi-arid zone, crust formation is a well-known phenomenon. Depending on the soil type, two types of crusts may be distin- guished: 1. A crust which is hardly noticeable, with an effective thickness of no more than about 0.1 mm (Fig. 6). This crust does not impede seedling emergence, but seriously impedes infiltration. It is observed on fine sandy soils with only a small percentage of clay or silt (5% of particles < 5 0 ~m). The impact of raindrops separates clay and silt particles which are then transported by the infiltrating water {suction by the unsaturated subsurface layers}. This pro- cess, during which the particles clog up the pores in between the sand grains, is described in detail by Chen et al. (1980). 2. A crust which is easily visible, with a thickness of at least a few mm, is created by the destruction of aggregates by immersion or direct raindrop im-
Fig. 6. E x a m p l e of a c rus t o n a s a n d y soil w i th on ly a few p e r c e n t loam. T e x t u r e frac- t ions are sepa ra t ed u n d e r t he h igh k ine t ic i m p a c t of the ra in ; t he f iner f r ac t ion is sucked in to the u n d e r l y i n g pores by t he in f i l t ra t ing water . Coarse sand grains ( t op ) b e c o m e iso la ted o n t o p o f t he c rus t and m a y be b l o w n b y wind .

12
pact (Fig. 7). In a wet state, the crust will reduce infiltration and, when dry, form a barrier against seedling emergence. This type of crust is formed on ag- gregated (loamy, clayey) soils.
Fig. 7. Example of a crust on a loamy soil. The vesicular structure of the crust is clearly visible. When the surface is sealed by a crust, air cannot escape during water infiltration and forms bubbles, concentrating below the crust, sometimes giving it a "puffed" struc- ture.
The crusts on sandy soils studied in Mall near Niono are clearly of the very thin, hardly noticeable type (Fig. 6). In addition to its low permeability, this crust has a strong hydrophobic character (Stroosnijder, 1977). The hydro- phoby is at the surface of the thin crust only and is caused by the presence of soil algae {Cyanophyceae). However, in laboratory experiments, Rietveld (1978), using the soil described in Table I, found that physical crust resis- tance is of far higher importance to infiltration than the hydrophoby. It was shown that the repellency of the hydrophobic part of the crust disappeared within 5 min after rain started.
Infiltration rate
In 1979, a nozzle type rainfall simulator was used (Figs. 8 and 9), which was built after Morin et al. (1967) and Rawitz et al. (1972). In this simula- tor, drops are formed by pumping water through a nozzle with a large open-

13
ing to obtain drops of a proper size and with an acceptable terminal velo- city. Immediately under the nozzle a rotating disk intercepts all water from the nozzle except for a small part which passes through a radial segment cut out of the disk. By using disks with different openings, the intensity of the rain can be changed. All excess water, intercepted by the disk is collected in a circular pan, surrounding the disk and returned to the storage tank. Water is pumped by a small electric pump to the nozzle, while disk and nozzle are rotated by a small electric motor. In the field, electricity is obtained from a gasoline-powered generator.
The rain from the simulator covers a circular area with a diameter of about 3 m. Within this area, an infi l t rat ion/runoff plot of 1.5 × 1.5 m 2 is situated. By means of neutron probe measurements during natural rain-
Fig. 8. The nozzle type rainfall simulator used to determine infiltration characteristics of crusted Sahel soils.

14
orator £o rotote d/sc oI~ nozzle /
rotor~hE "~ozzte /
X r~-r--'/h" ,, I~suppty to nozzle cottect,7~g port --j. . . . . . . ~/..~z../.../~/alsc
p .... / ' pto£ pump
" " : " . ! ' " "" . . . . . " " " "
4000
s~y
I
~ barreLs
Fig. 9. Schematic of the rainfall simulator used in Mali to measure infiltration and runoff of crusted sandy soils. Dimensions: mm.
storms in the field (Stroosnijder and Kon~, 1982), it was assessed that the limited size of these plots does not influence the infiltration rate. Since the artificial rain also falls outside the plot area, there is no horizontal flow of water in the soil within the plots. Hence it was sufficient to border the plot with steel strips pressed or hammered into the soil to a depth of only 5 cm. Within the plots the soil surface should be sloping; at the lowest part of the plot a trough is placed to collect the runoff water and to transport it to a small bin, f rom which it is pumped to a calibrated container. The level in the calibrated container is recorded at fixed intervals and thus the runoff rate can be calculated. The intensity of the artificial rainfall was kept at a con- stant rate of 49 mm h -1. The infiltration rate is the difference between rain- fall rate and runoff rate. On the sandy soil described above, 40 simulated rainfal l /runoff measurements were made (Hoogmoed, 1981a). Experiments were carried out on undisturbed soils, on soils where the crust was carefully removed by hand and on ploughed and ridged soils.
RESULTS
Rainfall analysis
Fig. 10 gives averages for the cumulative rainfall and the rainfall per de- cade for a "no rm a l " year and a " d r y " year for two locations in Mali: Niono (14 ° 15' N) at the southern border of the Sahel; and Hombori (15 ° 17' N) al- most at the nor thern border of the millet growing area of the Sahel. The 50% and 90% probabil i ty values (Fig. 5) for Niono are 470 and 290 mm year -1 and for Hombori are 365 and 250 mm year -1, respectively. For Niono, the "no rma l " year curve (Fig. 10) is the average over 1957, 1959, 1962 and 1975. These years had their total rainfall in the period July--September closest to the 50% probabil i ty value of a series of 30 years (1950--1980). The " d r y "

1 5
C. 0 E
o I i i I
L
o b~
. . . . . . . . . . . . . . .
o
\~\\o
°it "
c3 ~) c3 c3 c3
i o
"o \,
E " C \\o\
~x °x\
• o
o '"°",o o
& ~ & & 4, &
{wtu} llO, tu/oJ e,~flolnuJn,.3
o ~ i r / ~ , , ~ ,~.
.6 , , . .< , / ', ut ~ , I
~ -I ~, ; !~ '. ~, ,o.. , i , ! r
t A~I, ;i
& & o &
i
i i
• ~ [ /
/ , ' 4 i ! . / ~ol-
-~ \ I ! l g ? ' ~ \ . ) 'o : '~
• \ ° 7 , , x ~ o
Q
i
(w~) apo..3op .led /ID~U/O~
c~
e~
J
Z
0
0
..~
e,
..=
16
4 ~o
i
i
i
i i i i i i
i
i
u
m
i
m
m
(/Dp/wEa) IIDJU/~St
i l l
i I
i i
i
i
i
i
Cb,
E E
f
i " m
m ~
J
J i
d~ d~ c~
C , { D p / c u w ) I I D j U l D , V
c b
. id
j
I
@
t ~
£
0
.£ Z

17
years 1966, 1972, 1973 and 1974 had rainfall in the same period closest to the 90% probabil i ty values. For Hombori , the "normal" year curve is averaged over 1924, 1942, 1953 and 1962; the " d r y " year curve is averaged over 1941, 1946, 1949 and 1959 (observation period 1923--1965). Although average annual rainfall for the locations differ by more than 160 mm, in a "normal" year this difference is only 105 mm and in a " d r y " year only 40 mm for the important part of the season. The lower part of Fig. 10 shows how long the growing season will be if a minimum precipitation per decade is set. For instance, if the lower limit is set at 40 mm decade -1, a quanti ty necessary to start growth if one accounts for 50% runoff (Stroosnijder and Hoogmoed, 1983), the period up to 15 September (general flowering date due to photoper iod) will be 75 or 50 days for a "normal" and a " d r y " year, respectively, for both Niono and Hombori . However, if a lower limit of 20 mm decade -1 is set, a quanti ty sufficient for growth if runoff is nil, this period will be 105 and 90 days for a "normal" year and 90 and 70 days for a " d r y " year, for Niono and Hombor i respectively.
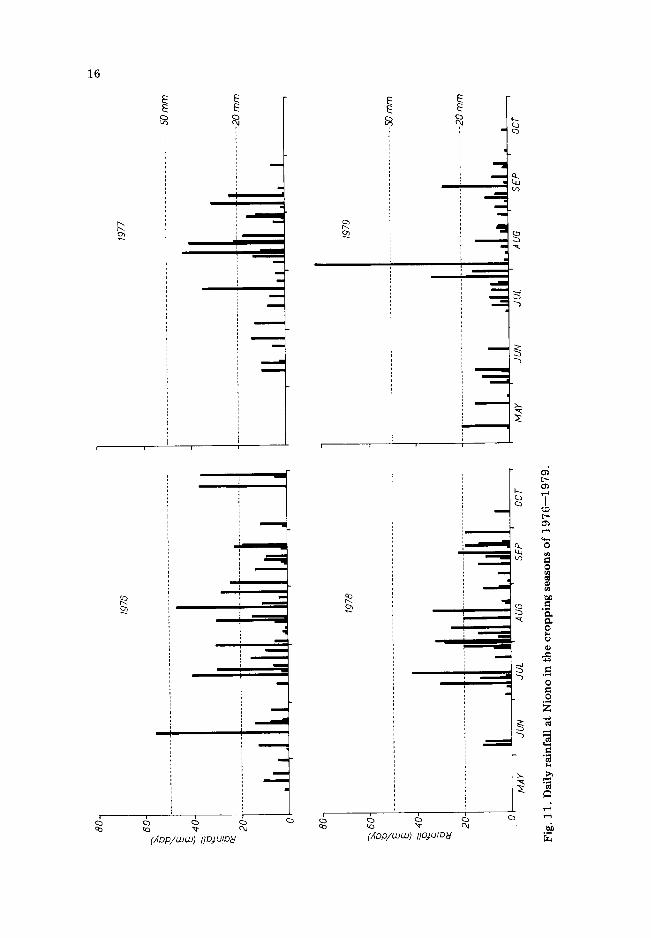
Fig. 11 shows the actual rainfall distribution at Niono for 1976--1979, which clearly demonstrates the large differences in rainfall pattern early in the season. The number of > 2 0 mm storms per season was quite small, no more than 25% of the total number. However, their contr ibut ion to the total amount of rain was more than 50% (Table II). Rainfall intensity has been described by Hoogmoed (1981b) and results are summarized in Fig. 12. It is clear that rainfall may show very high intensities: in 1979 a peak of 300 mm h -1 was recorded! However, duration of these peaks is usually no more than 5 min. The curves clearly show the differences between small and large storms. No correlation however was found between storm size and intensity. For comparison, data from Niamey (Niger) and Hyderabad (a comparable semi-arid region in India) were also analysed. Rainfall charts from Niamey were supplied by the Meteorological Service of Niger, from Hyderabad by ICRISAT (The International Crops Research Institute for the Semi-Arid Tropics). The reason for choosing the latter data was that at ICRISAT soil management systems for the semi-arid tropical regions are also being studied (ICRISAT, 1981).
TABLE II
Dis t r ibu t ion o f rainfall events over th ree size classes, Niono, Mali, 1976- -1979
Year Total <10 m m 10--20 m m >20 m m a m o u n t (mm) (ram) (rel) a ( m m ) (rel) a (ram) (rel) a
1976 578 100 17 113 20 365 63 1977 370 57 15 124 34 189 51 1978 412 97 24 138 34 177 43 1979 402 111 28 74 18 217 54
aTotal a m o u n t per year = 100%.

18
i I
I I
I /
I
I
~ p I
I
/I
i I I
/ 1 1 / /
/ I 7 1 //~....."""......... .-" ...""
0 i I
I i i
i"" 'J ....
III. .........................
t~
i / i/ ,/
~ . . . . .......
i.-,, . ~ "
~o ~ ~- c~ ilOlU!,O.; io.lo,~ 1o a6D.~uEf'OJ,~ d
E
¢b
p
I i
i J i
I I /I
i / ! :/// / /I . . /
/ ..-~'"
z / ....
IIDJU/DJ 1040] JO OBD~UODJ~,
D-
O0 O~
b,, v-4 0 0
z
~v
~A

19
The rainfall in Niamey was comparable to the Niono (Mali) rainfall, but rainfall intensity in India was lower than in West Africa (Fig. 12). Values for different expressions of the erosive power of the rain (E; E>25; Aim) are given in Table III. The values for Niono (Mali) are about the same as for Niamey (Niger). The higher values per mm of rain for Niono compared with Hyderabad (India) again confirm the higher agressiveness of the rain in West Africa. This is mainly caused by the higher intensity in Niono; comparing E/mm gives values of 26 and 24, comparing E > 2 5 / m m gives values of 16 and 10 respectively for Niono and Hyderabad.
TABLE III
Kinetic energy and erosivity of rain over a complete rainy season for Niono (Mali), Niamey (Niger) and Hyderabad (India)
Niono (Mali)
1977 1978 1979 Mean
Niamey Hyderabad (Niger) (India) 1970--1972 1974--1977
Total rain (mm) 376 331 397 368 392 628 Total kinetic
energy E (103 J m-2) a 10.1 8.2 10.5 9.6 10.6 15.0
Total kinetic energy E> 25 (103 J m-2) b 6.6 4.5 6.6 5.9 6.8 6.2
Total erosivity index A I m (103 mm h-') c 18.0 10.2 18.5 15.6 20.7 16.4
E / m m 27 25 27 26 27 24 E > 25/mm 18 14 17 16 17 10 A i m / m m 48 31 47 42 53 26
aWischmeier and Smith (1978). bHudson (1971). CLal (1976).
Infiltration
Fig. 13 (left) shows three curves for the infiltration rate of an undisturbed (naturally crusted) soil as a function of time. One curve represents infiltra- tion in the dry soil and two curves represent re-infiltration of the same sample area at 1 and 14 days after the first wetting, respectively. The infil- tration curve for 1 day is below the curve for the dry soil because the still very wet soil has a lower absorption capacity. Also, the final infiltration rate is somewhat lower due to the formation of a slightly more impermeable crust during subsequent artificial rains.
Fig. 13 (right) shows the infiltration rate of a soil where the original crust was carefully removed. The curve for dry soil shows (compared to the corre- sponding curve in Fig. 13 (left)) a dramatic increase in infiltration rate due

20
1.0-
E
~ 0.5-
£)
1.0"
Crust
~0.5-
o.,.-__._,~.O "~
I ~ L I 0 20 40 60 80 0
Time {min}
\ \
Crust removed
\ . " - - - - - ~ z _ .
~ , after one day •
\A ~ l a f t e r 14 days
0 0 i i i I 20 40 60 80
Time {rain)
Fig. 13. I n f i l t r a t i o n ra te as a f u n c t i o n o f t h e t i m e o f w e t t i n g f o r a p e r m a n e n t c r u s t e d soil a n d fo r a soil w h e r e t h e c r u s t was c a r e f u l l y r e m o v e d jus t b e f o r e t h e f i r s t w e t t i n g .
to the absence of a crust. One day after the first wetting, the infiltration curve was already far below the dry curve. Again, this is partly due to the very wet state of the soil which decreases the absorption capacity of the soil for water. However, this is also due to the formation of a new crust during wetting. This is indicated by the infiltration curve 14 days after the first infiltration. It might be expected that this curve, due to drying of the soil should be situated in between the other two, as was the case for the crusted soil. However, the 14 days curve is the lowest of all three. This indicates that during the wetting/drying cycles the soil forms a new, less permeable surface crust. Obviously, this is a fast process; already during the third shower after the original crust had been removed the infiltration rate dropped to the low values normal for crusted softs (cf. Fig. 13 (left)), indicating an almost com- plete restoration of such a crust.
Fig. 13 shows that the final infiltration rate was about 10 mm h -~. This value should be of about the same order of magnitude as the saturated hydraulic conductivity of the crust. The saturated conductivity of uncrusted soil is of the order of 100--200 mm h -~ (Stroosnijder, 1977). Thus, it may be concluded that the thin crust is at least 10 times less permeable than the di- rectly underlying soil.
Another proof of the presence of a crust is the soil moisture content im- mediately after wetting of the soil. It has been found (Hoogmoed and Kievit, 1981) that in the crusted soil the moisture content just below the crust was only 15--20% {w/w}, while in a non-crusted soil this value was 30--35% (w/w). This difference is due to the large drop in pressure head over the depth of the crust; below the crust it has already reached a significant negative value. Thus, in the subsoil, where the soil moisture content will never exceed the observed values of 15--20% (w/w), the infiltration of water is in fact an unsaturated infiltration.

21
DISCUSSION
Rainfall
Detailed data on rainfall in the West African Sahel are scarce; Cochem~ and Franquin (1967) reported only 35 meteorological stations to serve an area of over 2 million km2! Since not all stations are equipped with recording rain gauges, information on the intensity of rainfall is even more scarce. In Senegal, Charreau and Nicou (1971) found for the rainfall in Bambey (550 mm year -1) that 3/4 of the total rainfall had an intensity of >8 .6 mm h -1, 1/2 of >26 .7 mm h -1 and 1/4 of >52 .4 mm h -1. Kowal (1970) states that for rainfall in northern Nigeria, over the past 45 years, peak intensities of over 250 mm h -1 were not uncommon for very short periods of time.
In the present study, it has been shown that rainfall distribution over the growing season in the southern part of the Sahel is such that millet cropping should be possible. However, given the minimum length of the growing cycle of millet in order to obtain a reasonable grain harvest, it is important that crop growth starts as early as possible. Sowing can of ten be performed only in wet soil since dry soil is t oo hard to till. Moreover, rainfall may be so er- ratic that there is a considerable risk that the amount of water stored in the soil may not be enough to keep the young plants alive in the early season and fields have to be resown. When runoff losses could be decreased or avoided, the risk of exhausting the water s tock in the soil by the young crop would also decrease.
Runof f losses could be adequately decreased or avoided by tillage prac- tices especially designed for and adjusted to the larger rainstorms since the contr ibut ion to runoff by the largest storms is very large. For example, in 1979 the largest single rain event was > 80 mm (= 25% of total annual rain- fall) and runoff was about 80%, which is almost 44% of total annual runoff. Large runoff losses were also reported by Delwaulle {1973) for similar condi- tions in Niger.
These runoff losses may be explained by the high intensity of the rainfall during these large storms, causing, firstly, the infiltration capacity to be quickly exceeded and, secondly, on a tilled surface, an aggravation of the crust formation process. In view of the high intensities of West African rain, the design criteria for new soil management techniques applicable in other semi-arid areas do no t apply for the Sahel. The positive effect of tillage on water storage on these sandy soils disappears much quicker, while on the other hand the storage requirements are higher.
Crust properties
For natural untilled soils the effect of succesive wettings on crust forma- tion is small and one may assume that for these soils (used for extensive grazing in the Sahel) crust properties are constant and do not vary signifi-

22
can t ly over t he year . Howeve r , where ti l lage is p rac t i sed , one m u s t c lear ly be aware o f the danger o f c rus t f o r m a t i o n , a l t hough the crus t inf luences on ly w a t e r m o v e m e n t and n o t seedl ing emergence . A m a t h e m a t i c a l desc r ip t ion o f the in f i l t r a t ion process on p e r m a n e n t l y c rus ted soils and on tilled soils will be given in pa r t t w o o f this p a p e r (S t roosn i jde r and H o o g m o e d , 1983) .
CONCLUSIONS
(1) Crusts on the sandy soils used fo r mi l le t c ropp ing in Mali are very th in b u t t h e y ser iously l imi t w a t e r inf i l t ra t ion . (2) T h e m a i n cause o f c rus t f o r m a t i o n on sandy soils is t he high in tens i ty o f the rain, wh ich has a high i m p a c t (k ine t ic energy) on the soil surface. (3) On f resh ly t i l led soil a new crus t is qu ick ly f o r m e d a f t e r on ly a few rain- s to rms . This r educes t h e d u r a t i o n o f the pos i t ive e f f ec t o f tillage on w a t e r in- f i l t ra t ion to a few weeks . (4) With p r e sen t -day r u n o f f f r o m f a r m e r s ' fields, so m u c h w a t e r is los t t h a t in an average yea r the avai lable soil w a t e r is jus t suf f ic ien t fo r a marg ina l grain harves t . Howeve r , in a d ry yea r a serious c r o p fai lure m a y be expec ted . (5) Research should be c o n c e n t r a t e d on soil m a n a g e m e n t p rac t ices which avoid r u n o f f and thus d rama t i ca l ly decrease the risk o f c rop fai lure in mil le t g rowing in t he sou th o f the Sahel.
REFERENCES
Breman, H. and Stroosnijder, L., 1982. La relation entre le substrat et la v~g~tation. In: F.W.T. Penning de Vries and M.A. Djit~ye (Editors), La productivit~ des p~turages Sah~liens. PUDOC, Wageningen, Agric. Res. Rep. 918, pp. 322--346.
Charreau, C. and Nicou, R., 1971. L'am~lioration du profil cultural dans les sols sableux et sablo-argileux de la zone tropicale seche Ouest-Africaine et ses incidences agrono- miques. L'Agronomie Tropicale, XXVI: 209--255,531--565,903--978, 1183--1247.
Chen, Y., Tarchitzky, J., Brouwer, J., Morin, J. and Banin, A., 1980. Scanning electron microscope observations on soil crusts and their formation. Soil Sci., 130: 45--55.
Cochem~, J. and Franquin, P., 1967. An agroclimatology survey of a semi-arid area in Africa south of the Sahara. World Meteorological Orgnaization. Technical Note No. 86, 136 pp.
Davy, E.G., Mattei, F. and Solomon, S.I., 1976. An evaluation of climate and water re- sources for development of agriculture in the Sudano-Sahelian zone of West Africa. World Meteorological Organization Special Environment Report No. 9,289 pp.
Delwaulle, J.C., 1973. R~sultats de six ans d'observations sur l'~rosion au Niger. Bois et For~ts Tropiques, 150: 15--36.
Hoogmoed, W.B., 1981a. Field experiments on infiltration, runoff, tillage and millet emergence in Mali. In: E. Rawitz, W.B. Hoogmoed and Y. Morin (Editors), Develop- ment of critera and methods for improving the efficiency of soil management and tillage operations, with special reference to arid and semi-arid regions. Agricultural University, Tillage Laboratory, Wageningen and Hebrew University, Department of Soils and Water Science, Rehovot, Israel, Appendix 3, 37 pp.
Hoogmoed, W.B., 1981b. Analysis of rainfall in some locations of West Africa and India. In: E. Rawitz, W.B. Hoogmoed and Y. Morin (Editors), Development of criteria

23
and methods for improving the efficiency of soil management and tillage operations, with special reference to arid and semi-arid regions. Agricultural University, Tillage Laboratory, Wageningen and Hebrew University, Department of Soils and Water Science, Rehovot, Israel, Appendix 5, 23 pp.
Hoogmoed, W.B. and Kievit, D.T.I., 1981. The activities of a farmer in the Niono region of Mali. In: E. Rawitz, W.B. Hoogmoed and Y. Morin (Editors). Development of crite- ria and methods for improving the efficiency of soil management and tillage opera- tions, with special reference to arid and semi-arid regions. Agricultural University, Tillage Laboratory, Wageningen, and Hebrew University, Department of Soils and Water Science, Rehovot, Israel, Appendix 4, 31 pp.
Hudson, N.W., 1971. Soil Erosion. Cornell University Press. Ithaca, NY, 320 pp. International Crops Research Inst i tute for the Semi-Arid Tropics, 1981. Annual Report
1979/1980. ICRISAT, India, 304 pp. Kowal, J., 1970. Effect of an exceptional storm on soil conservation at Samaru, Nigeria.
Niger. Geogr. J., 13: 163--173. Lal, R., 1976. Soil erosion problems on an alfisol in Western Nigeria and their control.
IITA Monograph No. 1, Ibadan, Nigeria, 160 pp. Morin, J., Goldberg, D. and Seginer, I., 1967. A rainfall simulator with a rotating disk.
Trans. ASAE, 10: 74--77, 79. Morin, J. and Jarosch, H.S., 1977. Runoff rainfall analysis for bare soils. Volcani Center,
Bet Dagan, Israel, Pamphlet No. 164. Penning de Vries, F.W.T. and Djit~ye, M.A. (Editors), 1982. La productivitd des p~turages
Sah~liens. Une ~tude des sols, des v~g~tations et de l 'exploi ta t ion de cette ressource naturelle. PUDOC, Wageningen, Agric. Res. Rep. 918 ,525 pp.
Rawitz, E., Margolin, M. and Hillel, D., 1972. An improved variable intensity sprinkling infiltrometer. Soil Sci. Soc. Am. Proc., 36: 533--535.
Rietveld, J.J., 1978. Soil non wettabi l i ty and its relevance as a contributing factor to sur- face runoff on sandy dune soils in Mali. Agricultural University, Laboratory of Soil Physics, Wageningen, The Netherlands, Report Projet Production Primaire au Sahel, 179 pp.
Stroosnijder, L., 1977. Aspects of soil and water in the Sahel in Mali. Proc. Int. Syrup. Rainfed Agriculture in Semi-Arid Regions. Riverside, U.S.A., pp. 166--199.
Stroosnijder, L., 1982. La pddologie du Sahel et du terrain d'~tude. In: F.W.T. Penning de Vries and M.A. Djit~ye (Editors), La productivit~ des p~turages Sahdliens. PUDOC, Wageningen, Agric. Res. Rep. 918, pp. 52--71.
Stroosnijder, L. and Van Heemst, H.D.J., 1982. La m~t~orologie du Sahel et du terrain d'~tude. In: F.W.T. Penning de Vries and M.A. Djit~ye (Editors), La productivitd des p~turages Sah~liens. PUDOC, Wageningen, Agric. Res. Rep. 918, pp. 36--51.
Stroosnijder, L. and Hoogmoed, W.B., 1983. Crust formation on sandy soils in the Sahel. II. Tillage and its effect on the water balance. Soil Tillage Res., 4 : in press.
Stroosnijder, L. and Kon~, D., 1982. Le bilan d'eau du sol. In: F.W.T. Penning de Vries and M.A. Djit~ye (Editors), La productivit~ des p.~turages Sah~liens. PUDOC, Wage- ningen, Agric. Res. Rep. 918, pp. 133--165.
Wischmeier, W.H. and Smith, D.D., 1978. Predicting rainfall erosion losses; a guide to conservation planning. U.S. Department of Agriculture, Agricultural Handbook No. 537, 58 pp.