cruise tourism's contribution to the new zealand …...1989 1993 1997 2001 2005 2009 2013 2017...
TRANSCRIPT

CRUISE TOURISM’S CONTRIBUTION TO THE NEW ZEALAND ECONOMY 2018
31 October 2018

Document reference: CNZ 015.18 Regional EIA\Report\Cruise Tourism Contribution to the New Zealand Economy.docx
Date of this version: 31 October 2018
Report author(s): Rodney Yeoman and Greg Akehurst
Director approval: Greg Akehurst
www.me.co.nz
Disclaimer: Although every effort has been made to ensure accuracy and reliability of the information contained in this report, neither Market Economics Limited nor any of its employees shall be held liable for the information, opinions and forecasts expressed in this report.
CRUISE TOURISM’S CONTRIBUTION TO THE NEW ZEALAND ECONOMY 2018
Prepared for New Zealand Cruise Association

Contents EXECUTIVE SUMMARY ................................................................................................................ 1
1 INTRODUCTION ............................................................................................................ 2
1.1 GLOBAL CRUISE TOURISM ................................................................................................... 2
1.2 NATIONAL CRUISE TOURISM ................................................................................................ 3
2 CRUISE TOURISM ACTIVITY ........................................................................................... 5
2.1 VESSELS .......................................................................................................................... 6
2.2 PASSENGERS .................................................................................................................... 6
2.3 CREW ............................................................................................................................. 9
3 CRUISE TOURISM ECONOMY ...................................................................................... 10
3.1 EXPENDITURE ................................................................................................................. 11
3.2 ECONOMIC CONTRIBUTION ................................................................................................ 12
3.3 REGIONAL ECONOMIC CONTRIBUTION .................................................................................. 13
APPENDIX A: REGIONAL CRUISE TOURISM ................................................................................ 14
Figures FIGURE 1-1: GLOBAL CRUISE TOURISM PASSENGERS, 1989 TO 2018 ............................................................... 3
FIGURE 1-2: NATIONAL CRUISE TOURISM PASSENGERS, 1996-2018 AND FORECASTS 2018-19 AND 2019-20 ..... 4
FIGURE 2-1: CRUISE TOURISM ACTIVITY – VESSEL, 2017-18, 2018-19F, AND 2019-20F................................... 6
FIGURE 2-2: CRUISE TOURISM ACTIVITY – PASSENGER, 2017-18, 2018-19F, AND 2019-20F ............................ 7
FIGURE 2-3: CRUISE TOURISM ACTIVITY – UNIQUE PASSENGERS, 2008 - 2018, 2018-19F, AND 2019-20F ......... 7
FIGURE 2-4: CRUISE TOURISM ACTIVITY – SOURCE MARKET 2017-18 .............................................................. 8
FIGURE 2-5: CRUISE TOURISM ACTIVITY – CREW, 2017-18, 2018-19F, AND 2019-20F .................................... 9
FIGURE 3-1: CRUISE TOURISM EXPENDITURE, $ MILLION 2017-18 AND 2018-19F .......................................... 11
FIGURE 3-2: CRUISE TOURISM ECONOMIC CONTRIBUTION, 2017-18 AND 2018-19F....................................... 12

Page | 1
Executive Summary The purpose of this report is to quantify cruise tourism expenditure and economic contribution in New Zealand in the last season (2017-18) and the coming season (2018-19), specifically focusing on cruise tourism activity and the associated value that is contributed to the economy.
Nationally, cruise tourism has been growing rapidly since the late 90s. The number of passengers undertaking a cruise in New Zealand has grown by around 13% per annum, which is much faster than the rate of growth in the industry globally.1 Since 2010, cruise tourism passengers visiting New Zealand has more than doubled, from approximately 100,000 to nearly 275,000 in the last season. In the coming two seasons, cruise tourism in New Zealand is expected to grow even faster, reaching almost 370,000. In summary, this report shows the following results for cruise tourism,
Vessels
• The 2017-18 cruise season saw 36 different vessels visit New Zealand over 148 different voyages. There was a total of 707 port days across New Zealand. The bookings for the two upcoming cruise seasons indicate greater numbers of voyages and port days than the recently completed season, with total voyages likely to exceed 200 and over 900 port days.
Passengers
• During the 2017-18 season 274,600 passengers undertook a cruise in New Zealand. Over the coming two seasons it is expected that the number of passengers could increase to almost 370,000, which is equivalent to a growth rate of 16% per annum. Of the passengers that visited New Zealand in 2017-18 season 119,400 exchanged. Over the coming two seasons the number of passengers exchanging may exceed 170,000.
• The number of days that passengers spend in port is expected to increase from 1.4 million in the last season, to over 1.9 million in 2019-20.
Crew
• The number of crew that work on cruise voyages in New Zealand is expected to increase from 112,100 in the last season to over 160,000 in 2019-20.
Economic Contribution
• The total value added (synonymous with GDP) to the economy by cruise tourism for the 2017-18 season, was $491 million, which is expected to increase to $695 million by 2018-19.
• The level of employment supported by the cruise tourism activity, was around 9,100 in the 2017-18 season. In the coming season, the cruise tourism activity is expected to support over three thousand additional jobs, reaching 12,800 in total by 2018-19 season.
1 Market Economics (2002-2017) Cruise Tourism Studies for Cruise New Zealand and McDermott Fairgray (1997-2001) Cruise Tourism Studies for Tourism Board.

Page | 2
1 Introduction Over the past two decades, New Zealand Cruise Association (NZCA)2 and other tourism organisations have commissioned research on the contribution of cruise tourism to the New Zealand economy. Market Economics (M.E) has conducted the bulk of this research over the past decade and a half, either annually or biennially.
In early 2017 Stats NZ (SNZ) began collecting data and developing methods for estimating cruise industry activity. NZCA, M.E and other industry stakeholders have provided data and technical support to SNZ during the development phase. Based on this information, SNZ released first results in December 2017 and then revised August 20183. There are still documented sections of the cruise industry that SNZ has been unable to include at this point in the official estimates.
NZCA and M.E continue to discuss with SNZ further developments to expand official estimates. It is likely that SNZ will further revise the official estimates in 2019, as SNZ establish methods to measure the parts of the industry that have not been covered.
This report builds on the SNZ officially released data, along with NZCA and other data sets to establish the economic activity generated by the cruise industry in the recently completed season (2017-18) and the coming season (2018-19). This report covers all voyages by cruise vessels in New Zealand waters in the season ending June 30th.
In this report the cruise tourism activity (section 2) and cruise tourism economy (section 3) are discussed at the national level. Regional results are provided in Appendix A: Regional Cruise Tourism.
To provide some context to the cruise season results in this report, the following subsections outline a brief summary of the trends in cruise tourism over the past three decades, both at the global and national levels.
1.1 Global Cruise Tourism
Internationally, cruise tourism has been growing consistently since the early 90s, at approximately 7% per annum from 4 million passengers in 1989 to 27 million passengers in 2018 (see Figure 1-1).4 Since 2010, global cruise tourism has grown more rapidly, with passenger growth exceeding 1 million per annum.5
2 Previously known as Cruise New Zealand (CNZ). 3 SNZ has revised estimates upward, as they have improved the reliability of their modelling methods. 4 Spalburg, J. (2009) Cruise Market Study. BERA (2013-2015) The Global Economic Contribution of Cruise Tourism. 5 Cruise Lines International Association (2016) 2017 Cruise Industry Outlook.

Page | 3
Figure 1-1: Global Cruise Tourism Passengers, 1989 to 2018
Over the last three decades the bulk of growth in passengers has been from North American and European markets.6 However, these markets have begun to mature with growth in passenger numbers slowing over the past decade, while emerging markets have started to grow rapidly (now accounting for one-third of cruise passengers).
Importantly for New Zealand, passenger growth is strongest in markets around the Asia-Pacific region. Specifically, in the last season the three fastest growing passenger markets in the world were; China (89% growth), New Zealand (36% growth) and Australia (21% growth).7
Also of importance, is the changing configuration of the international fleet of cruise vessels. Over the last decade, newly constructed cruise vessels are larger, while older small ships have been retired – the capacity of the cruise fleet has increased from an average of around 700 passenger per vessel in 1990 to over 1,850 passengers per vessel in 2018.8 This trend is likely to continue, with orders for new ships mostly having a capacity of more than 4,000 passengers. The orders over the coming three years will increase global capacity by over 20%.9
1.2 National Cruise Tourism
Nationally, cruise tourism has also been growing rapidly since the late 90s. The number of passengers undertaking a cruise in New Zealand, has grown by around 13% per annum, which is much faster than the
6 According to CLIA data, in 1989 approximately 95% of passengers were from North America or Europe. By 2018 these two areas still accounted for 67% of passengers. 7 Cruise Lines International Association (2017) Cruise Industry Source Market Report Ocean Cruise Passengers New Zealand 2016. 8 Institute of Shipping Economics and Logistics (2012) Shipping Statistics and Market Review Volume 56 No 8 – 2012, Cruise Lines International Association (2013-2017) Year in Review. 9 Cruise Industry News (2018) Current Cruise Ship Orderbook.
0
5
10
15
20
25
30
1989 1993 1997 2001 2005 2009 2013 2017
Crui
se P
asse
nger
s (oc
ean)
-m
illio
n
Source: various CLIA Cruise Outlook and Global Economic Contribution reports.

Page | 4
global rate of growth.10 Since 2010, the number of cruise tourism passengers visiting New Zealand has more than doubled, from approximately 100,000 to around 275,000.11 Vessel bookings for the coming season (2018-19) show that passenger numbers will grow rapidly, reaching almost 350,000. The early bookings for 2019-20 season suggest that passenger numbers are likely to continue growing, reaching almost 370,000.
Figure 1-2: National Cruise Tourism Passengers, 1996-2018 and forecasts 2018-19 and 2019-20
Much of the growth in cruise tourism since 2010 has been driven by strong growth in emerging markets, cruise passengers from Australia and New Zealand have grown by around 13% per annum. In addition, the mature markets have also shown growth, with both North American and European passenger numbers growing consistently (11% per annum).
10 Market Economics (2002-2018) Cruise Tourism Studies for Cruise New Zealand and McDermott Fairgray (1997-2001) Cruise Tourism Studies for Tourism Board. 11 Stats NZ’s unique count of passengers on international voyages was 259,000 for 2017-18. SNZ count does not capture domestic cruise voyages – as there is no customs data. In this report the passengers on domestic voyages are captured via NZCA data and Ports data.
-
50,000
100,000
150,000
200,000
250,000
300,000
350,000
400,000
1996-97 1999-00 2002-03 2005-06 2008-09 2011-12 2014-15 2017-18
Crui
se P
asse
nger
s
Source: M.E Cruise Industry reports 2002-2018 , MDF 1997-2001 and SNZ 2015-2017.

Page | 5
2 Cruise Tourism Activity This section discusses cruise tourism activity that has occurred in the past season 2017-1812 and the potential activity that could occur in the coming seasons 2018-19 and 2019-2013. This section focuses on three key activity types – Vessels (voyages, port days), Passengers (exchange, port days, source market) and Crew (exchange, port days).14
These activity types are important metrics because they indicate the level of activity associated with the industry, both physical and economic, which has implications for businesses that serve the cruise industry15 and other stakeholders16. These businesses and stakeholders will make decisions about future investments or policies based on the existing and potential future level of cruise tourism activity.
While the results in this section are consistent with the officially released data from SNZ, this report extends to include voyages that do not leave New Zealand waters and also establishes an estimate of “movements” (which is not the same as “unique” count used in SNZ).
The results in this report differ from SNZ official release as follows,
• Domestic Voyage – this report accounts for domestic voyages that are not captured in the SNZ data. SNZ is aware of this gap, which accounts for approximately 5-10% of the cruise passengers in New Zealand.
For example, ‘Vessel A’ with 2,021 passengers undertakes a voyage from Auckland which does not leave New Zealand waters. SNZ is unable to capture the passengers on this voyage because there is no customs data collected from the vessel.
This report has estimated the numbers of passengers on these vessels using data from NZCA. This data provides a robust method for capturing the passengers on domestic voyages.
• Passenger Movements – this report establishes a count of the number of passenger movements. The movement count is more useful for understanding activity in each port than the unique count presented by SNZ.
For example, Passenger X embarks on a voyage in Auckland which travels around the Pacific and returns to Auckland where Passenger X disembarks. Passenger Y also embarks on the same voyage in Auckland, however Passenger Y does not return to New Zealand. SNZ records both passengers as one unique passenger in the official statistics.
12 Based on port calls that occurred in 2017-18, manifest of passenger/crew recorded by New Zealand Customs, Ports of Auckland passenger handling data and SNZ official count of unique passengers. 13 Based on the current schedule of bookings and estimates of passengers/crew developed from the 2018-19 manifest and vessel capacity data. 14 In previous studies the applied season which was October The Season has been changed to June to June 15 Including ports, shipping agents, ground handlers, onshore tourist operators, accommodation, retailers and airports etc. 16 Local and Central Government, including New Zealand Customs, MBIE and Stats NZ as well as Council Controlled Organisation (Economic Development Agencies, Transport etc).

Page | 6
The unique count measure does not capture the detail of the trip profile, specifically Passenger X is likely to have a very different activity profile than Passenger Y (i.e. two visits to Auckland vs one visit to Auckland). The movement measure developed in this report is more relevant for understanding activity profile (and associated spend) than unique count.
Although the purpose of this report is to provide a concise understanding of cruise tourism at the national level, many businesses and stakeholders in the cruise industry operate at a sub-national level. To match the needs of the businesses and stakeholders in the cruise industry, this report provides sub-national cruise tourism information (see Appendix A: Regional Cruise Tourism).
2.1 Vessels
The 2017-18 cruise season saw 36 different vessels visit New Zealand on over 148 different voyages. The vessels spent a total of 707 days in port across New Zealand, see Figure 2-1. During the 2017-18 cruise season the average vessel undertook four voyages and spent an average of five days in port.
Bookings for the upcoming 2018-19 cruise season indicate significant growth in the number of voyages and port days. Voyages visiting New Zealand are expected to increase by 34% over the coming season, reaching 199. The number of ports days is also expected to increase by 31%, reaching 929. In the coming season the average vessel is booked to undertake five voyages and spend an average of five days in port.
The early bookings for 2019-20 indicates that growth will continue, with 45 vessels undertaking 203 voyages and spending 1,028 days in port.
Figure 2-1: Cruise Tourism Activity – Vessel, 2017-18, 2018-19f, and 2019-20f
However, the bookings for 2018-19 and 2019-20 are still subject to change and could be expected to decrease as weather and other unforeseen issues can result in cancellation. For example, last season experienced particularly bad weather resulting in 5% of port call bookings being cancelled.
2.2 Passengers
During the 2017-18 season there were 274,600 passengers that undertook a cruise in New Zealand, of which 119,400 exchanged in New Zealand, see Figure 2-2. Over the coming season it is expected that the
Cruise Tourism Activity Type 2017-18 2018-19f 2019-20f
Vessels 36 41 44 Voyages* 148 199 203 Port Days** 707 929 1,028
*includes voyages that do not leave New Zealand territorial waters (i.e. domestic).**Vessel Calls in Port, excludes small islands (Great Barrier Island, Motuara Island, Waiheke Island, White Island, and Sub Antarctic Islands) and other small stops (Golden Bay, Kaiteriteri, Marlborough Sounds, Ship Cove, Tairua, Tarakohe, Tologa Bay, Whakatane, Whangaroa, Whitianga, Riverton).

Page | 7
number of passengers could increase to over 348,900, which is equivalent to a growth rate of 27%. The number of passengers exchanging may reach 170,000 by 2018-19.
The number of days that passengers spend in port is expected to increase from 1.38 million in the last season to 1.93 million in 2018-19. During the 2017-18 cruise season the average passenger spent five days in port, which could increase to six days in the 2018-19 season.
The early bookings for 2019-20 indicates that growth is likely to continue, with 369,500 passengers who are expected to spend 1.94 million days in port and total exchanges of 171,400.
Figure 2-2: Cruise Tourism Activity – Passenger, 2017-18, 2018-19f, and 2019-20f
Figure 2-3 compares the official SNZ (solid black line) and M.E (solid blue line) unique passengers along with the past three years of M.E forecasts (2016, 2017 and 2018). The figure shows,
• a consistent trend between SNZ and M.E unique passenger records. The only difference is SNZ is marginally lower because they do not capture passengers on domestic voyages (e.g. comedy cruises, wine and food cruises and some Sub Antarctic cruises).
• the past M.E forecasts have consistently shown that 2017-18 would exceed 270,000 passengers and the last two forecasts are both showing that 2018-19 is likely to reach 350,000.
There is little difference between the previous forecasts and the actual outcome, which suggests that the significant growth that is predicted in the coming two seasons is likely to eventuate.
Figure 2-3: Cruise Tourism Activity – Unique Passengers, 2008 - 2018, 2018-19f, and 2019-20f
Cruise Tourism Activity Type 2017-18 2018-19f 2019-20f
Passengers* 274,600 348,900 369,500 Exchange 119,400 170,000 171,400 Port Days 1,379,000 1,933,000 1,942,100
*count of unique passengers, controls for passengers that undertake multiple voyages.
100,000
150,000
200,000
250,000
300,000
350,000
400,000Total PassengersSNZ*M.E 2016 ForecastM.E 2017 ForecastM.E 2018 Forecast
*SNZ does not include domestic voyages

Page | 8
The source market profile of cruise tourism passengers that visit New Zealand is expected to remain relatively constant over the next few cruise seasons. In terms of source market the following markets are important,
• Australians accounted for around 40% of New Zealand cruise passengers, with a total of 116,000 passengers in the last season. Of this total, most were transit passengers, who were on round-trip voyages from Australia.
• Domestic passengers made up 16% of the total passenger market, which is higher than the previous season.
• Passengers from the Americas now make up 24% of the total passenger market with a total of 65,900 passengers. Americas were also the largest international exchange market.
• European (incl. UK) passengers were the third largest international market, making up over 13% of the total.
• The remaining 5% of passengers are from other source markets. Notably, the Chinese source market is growing rapidly, now at 1.7% of the passengers that cruise here.
Figure 2-4: Cruise Tourism Activity – Source Market 2017-18
Note that the distribution presented in this report varies from the SNZ officially released country of origin. The results presented in this report add in voyages which SNZ is unable to capture via customs data (domestic voyages i.e. comedy cruises, wine and food cruises and some Sub Antarctic cruises). Most of the passengers on these domestic voyages are from New Zealand and Australia, which is reflected in these countries of origin being more significant in the results presented in this report than the SNZ official results.
Australia, 116,000 ,
42%
New Zealand, 44,700 , 16%
North America, 65,900 , 24%
Europe, 34,500 , 13%
Other, 13,400 , 5%

Page | 9
2.3 Crew
During the 2017-18 season, there were 112,100 crew that worked on cruise voyages in New Zealand, of which 5,800 exchanged in New Zealand, see Figure 2-5 Cruise Tourism Activity – Crew. In the coming season it is expected that the number of crew could increase to over 161,900. The number of crew exchanging is also expected to grow at a similar rate in the coming season.
The number of days that crew spend in port, is expected to increase from 593,500 in the last season to more than 841,900 in 2018-19.
The early bookings for 2019-20 indicates that growth likely to continue, with 163,000 crew who are expected to spend 871,700 days in port and total potential exchanges of 8,500.
Figure 2-5: Cruise Tourism Activity – Crew, 2017-18, 2018-19f, and 2019-20f
Cruise Tourism Activity Type 2017-18 2018-19f 2019-20f
Crew* 112,100 161,900 163,000 Exchange 5,800 8,400 8,500 Port Days 593,500 841,900 871,700
*some crew are counted multple times, as they serve on multiple voyages

Page | 10
3 Cruise Tourism Economy In the following section we estimate economic activity that could be associated with cruise tourism. Past research shows that the cruise industry plays a significant role in New Zealand’s economy. In summary, significant income is gained from cruise tourism, which in turn generates direct and indirect economic activity and sustains employment.
The economic model applied in this report is the same model applied in past studies of the New Zealand Cruise Industry.17 Similar economic modelling methods are applied internationally for cruise industry and other tourism sectors.18 Details of the model are not described within the body of this report. For further details, the reader should refer to one of the previous studies of the New Zealand cruise industry.
The key difference between this report and previous studies, is that this report draws on SNZ newly released estimates of the expenditure. SNZ estimates cover the majority of the cruise industry and have captured commercially confidential data that was not previously available (most importantly bunkering19).
However, it is important to understand that the SNZ officially released cruise data does not cover all aspects of the cruise industry.
As with the cruise activity in the previous section this report has extended the SNZ estimates to cover the entire industry. The SNZ data has been extended to include the following components;
• Airfares: there are large numbers of passengers (and some crew) that undertake an exchange in New Zealand. The cruise passengers and crew that exchange will spend money on airfares for flights, either before or after the voyage. SNZ estimates that in total tourists spend $5.1 billion on airfares20, of which some will be related to flights undertaken by cruise passengers and crew. However, at this time SNZ has not been able to establish the value that is attributable to cruise industry.
The spend associated with passengers that exchange in New Zealand has been estimated using passenger data from the cruise activity in the previous section and an assumed airfare ticket21. This provides an estimate of $24.3 million of spend in 2017-18 season, which adds approximately 6% to the cruise spend reported by SNZ.
• Domestic Passengers Spend: as discussed in the previous section passengers from New Zealand make up a significant proportion of cruise industry. These passengers undertake both local voyages that travel along the New Zealand coast and Pacific voyages that start/finish in
17 Market Economics (2016) Economic Impact of 2015-16 Cruise in New Zealand. 18 See Cruise Lines International Association (2016) 2017 Cruise Industry Outlook. AEC Group (2016) Economic Impact of the Cruise Industry in Australia, 2015-16. 19 The cruise industry takes on much less bunkering fuel than was estimated in previous studies. The difference in bunkering fuel drives over half of the difference in the previous estimate. However, as bunkering fuel flows offshore as imports this difference in the expenditure has very little impact on the economic value of the industry. 20 SNZ (2017) Tourism Satellite Account. 21 A single one-way ticket to Australia, which was set at $350.

Page | 11
Auckland. SNZ estimates that in total domestic tourists spend $21.4 billion22, of which some will be related to cruise voyages undertaken in New Zealand. However, at this time SNZ has not been able to establish the value that is attributable to cruise industry.
The spend associated with New Zealand tourists is estimated in this report using passenger data from the cruise activity in the previous section and spend per day from the most recent survey23. This provides an estimate of $11.9 million of spend in 2017-18 season, which adds approximately 3% to the cruise spend reported by SNZ.
• Domestic voyages: the spend associated with passengers and crew on voyages that travel in New Zealand waters is estimated using the cruise activity data in the previous section and the average spend observed in the SNZ official data. This provides an estimate of $3.3 million of spend in 2017-18 season, which adds approximately 1% to the cruise spend reported by SNZ.
SNZ’s Tourism Satellite Account record all three spends discussed above when assessing the total expenditure associated with tourism in New Zealand. However, when assessing the cruise industry SNZ has been unable to apply the same approach. Therefore it is reasonable to extend the SNZ cruise expenditure to establish a consistent comparison to the rest of the tourism sector. NZCA will continue to discuss with SNZ possibilities to expand the official statistics to include all aspects of the cruise industry.
Estimates of cruise tourism’s economic contribution are reported in terms of expenditure (direct spend), GDP (value added) and employment (job equivalents). All values are reported in 2018 dollar terms.
3.1 Expenditure
Total expenditure for 2017-18 was $474 million. This was comprised of $367 million from passenger and crew spend and $106 million from vessel spend. Expenditure generated by cruise tourism is expected to grow by 43% over the coming season, reaching $676 million by 2018-19. The bulk of the growth in total expenditure will be generated by passenger and crew activity (82%) and the remaining relates to vessel activity (18%).
Figure 3-1: Cruise Tourism Expenditure, $ million 2017-18 and 2018-19f
It is important to note that expenditure reported in this section incorporates everything spent by passenger, crew and vessels. Some of this expenditure will be related to imports such as international airfares, fuel, airfares and other imports, which have very little impact on the New Zealand economy.
22 SNZ (2017) Tourism Satellite Account. 23 Gravitas (2017) Survey of cruise passengers.
Cruise Tourism Expenditure 2017-18 2018-19f
Passenger & Crew 367$ 532$ Vessel 106$ 144$ Total 474$ 676$
*includes total amount spent on ship fuel and International airfares

Page | 12
Expenditure associated with imports typically does not ‘stick’ to the local economy and goes straight overseas (which is accounted for in the next section).
As noted above, the previous study assumed that vessels undertook substantial bunkering in New Zealand (primarily in Auckland). SNZ has access to commercially confidential data which indicates that cruise vessels have purchased less bunker fuel than previously estimated. This has meant that the previous estimates of expenditure were high. However, as most of the value associated with bunkering is related to imports, the economic activity associated with the bunkering was minimal which means that previous estimate of economic contribution was not greatly affected.
3.2 Economic Contribution
This section measures the economic contribution of cruise tourism in the past season and the coming season. Economic contributions are measured using two commonly applied metrics in economic research, Value Added and Employment.
The first metric (value added) is broadly synonymous with GDP – which is the sum of compensation of employees (salary and wages), operating surplus (company profits), consumption of fixed capital (depreciation), and taxes less subsidies.24 The second metric (employment) is measured in terms of Employment Count (EC) which is head count of salary and wage earners sourced from taxation data.25
Total value added to the economy by the cruise tourism for the 2017-18 season was $491 million. The economic contribution of cruise tourism is expected to grow by 41% over the coming season, reaching $695 million by 2018-19.
The level of employment supported by the cruise tourism activity was around 9,100 in the 2017-18 season. The cruise tourism activity is expected to support over three thousand additional jobs, reaching 12,800 in total by the 2018-19 season.
Figure 3-2: Cruise Tourism Economic Contribution, 2017-18 and 2018-19f
24 Value added is a measure of all payments to factors of production (land, labour and capital), and excludes all purchases of intermediate inputs. It broadly equates with gross domestic product (GDP) as a measure of economic activity at the national level, and gross regional product at the regional level. 25 Employment Count is the official employment metric developed by Stats NZ. The EC is usually higher than other metrics of employment, such as Full-Time Equivalent (FTE).
Cruise Tourism Expenditure 2017-18 2018-19f
Value Added ($ million) 491$ 695$ Employment (EC) 9,100 12,800

Page | 13
3.3 Regional Economic Contribution
Appendix A: Regional Cruise Tourism briefly provides economic results for each region. The regional results show that the majority of the spend, value added and employment generated by the industry occurs in the regions which have the major ports;
• Auckland has around 20% of the passenger and crew voyage days in New Zealand and 37% of the value added that is generated by the industry. This reflects the fact that most many voyages start and end in Auckland which results in significant pre and post voyage spend.
• Bay of Plenty, Otago, Wellington and Canterbury each host around 10% to 13% of the passenger and crew voyage days in New Zealand which results in around 10% to 15% of the value added that is generated by the industry being located in each region.
• The industry also has a significant role in Northland, Marlborough, Hawkes Bay and Southland. While Southland hosts the second largest number of passenger and crew voyage days in New Zealand, many of these days are spent in locations that have very little opportunity for spend (Stewart Island and Fiordland).
There are also indirect impacts that flow to regions that have a small number (or no) of vessels visit. For example, Waikato and West Coast receive very few vessel visits, however these regions receive Value Added and Employment benefits from cruise activity.
These benefits are generated when directly impacted businesses purchase products from suppliers in these regions to meet the increased demand for goods and services. For example, providores in Auckland supply provisions to a visiting vessel, e.g. beef or dairy products. In order to supply the provisions the providores in turn purchase products from Waikato farms, which generates indirect economic value in Waikato Region (value added and employment).
Finally, the substantial growth that is expected in the 2018-19 season is likely to result in significant growth in spend, value added, and employment sustained by the industry in all the regions. In most regions the economic contribution of the industry is likely to increase by more than 30% in the coming season.
Page | 14
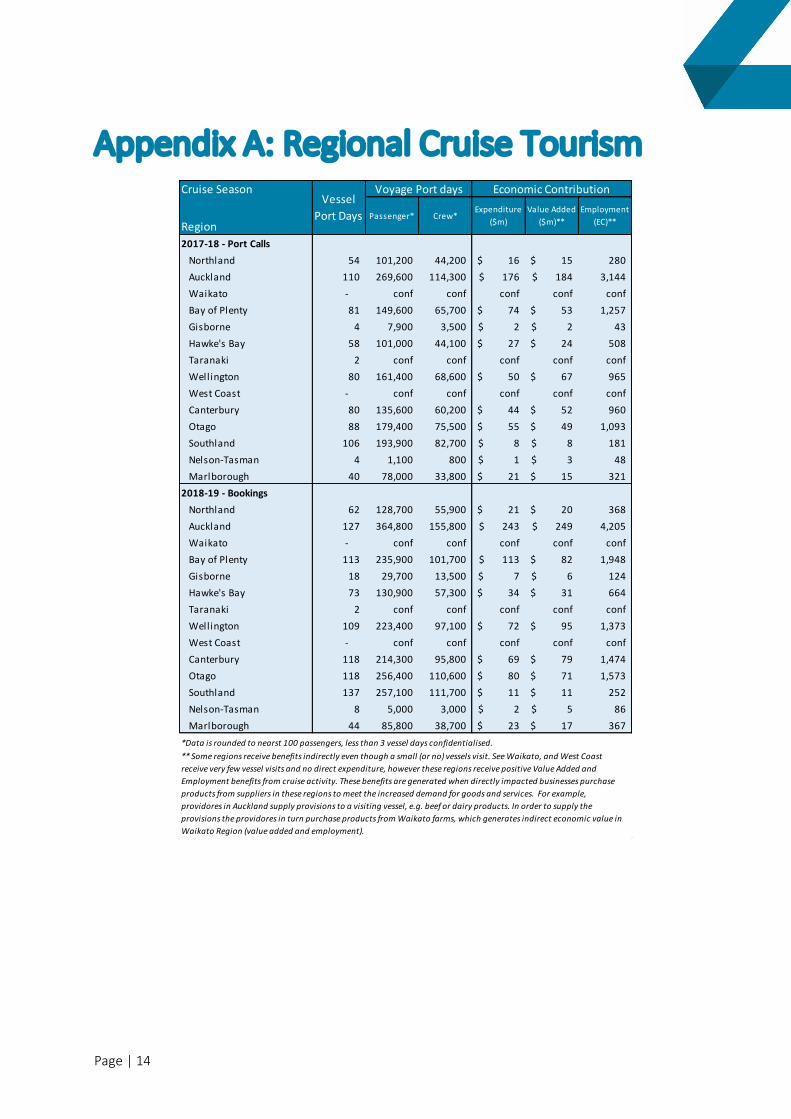
Appendix A: Regional Cruise Tourism
Cruise Season
RegionPassenger* Crew*
Expenditure($m)
Value Added ($m)**
Employment (EC)**
2017-18 - Port CallsNorthland 54 101,200 44,200 16$ 15$ 280 Auckland 110 269,600 114,300 176$ 184$ 3,144 Waikato - conf conf conf conf confBay of Plenty 81 149,600 65,700 74$ 53$ 1,257 Gisborne 4 7,900 3,500 2$ 2$ 43 Hawke's Bay 58 101,000 44,100 27$ 24$ 508 Taranaki 2 conf conf conf conf confWellington 80 161,400 68,600 50$ 67$ 965 West Coast - conf conf conf conf confCanterbury 80 135,600 60,200 44$ 52$ 960 Otago 88 179,400 75,500 55$ 49$ 1,093 Southland 106 193,900 82,700 8$ 8$ 181 Nelson-Tasman 4 1,100 800 1$ 3$ 48 Marlborough 40 78,000 33,800 21$ 15$ 321
2018-19 - BookingsNorthland 62 128,700 55,900 21$ 20$ 368 Auckland 127 364,800 155,800 243$ 249$ 4,205 Waikato - conf conf conf conf confBay of Plenty 113 235,900 101,700 113$ 82$ 1,948 Gisborne 18 29,700 13,500 7$ 6$ 124 Hawke's Bay 73 130,900 57,300 34$ 31$ 664 Taranaki 2 conf conf conf conf confWellington 109 223,400 97,100 72$ 95$ 1,373 West Coast - conf conf conf conf confCanterbury 118 214,300 95,800 69$ 79$ 1,474 Otago 118 256,400 110,600 80$ 71$ 1,573 Southland 137 257,100 111,700 11$ 11$ 252 Nelson-Tasman 8 5,000 3,000 2$ 5$ 86 Marlborough 44 85,800 38,700 23$ 17$ 367
** Some regions receive benefits indirectly even though a small (or no) vessels visit. See Waikato, and West Coast receive very few vessel visits and no direct expenditure, however these regions receive positive Value Added and Employment benefits from cruise activity. These benefits are generated when directly impacted businesses purchase products from suppliers in these regions to meet the increased demand for goods and services. For example, providores in Auckland supply provisions to a visiting vessel, e.g. beef or dairy products. In order to supply the provisions the providores in turn purchase products from Waikato farms, which generates indirect economic value in Waikato Region (value added and employment).
Economic Contribution
*Data is rounded to nearst 100 passengers, less than 3 vessel days confidentialised.
Voyage Port daysVessel
Port Days