crossbred bulls finished under similar feeding condition
TRANSCRIPT
Page 1/22
Growth Performance of Arsi, Borana, Harar and HF-Crossbred Bulls Finished under Similar Feeding ConditionAhmedin Abdurehman ( [email protected] )
Oda Bultum University https://orcid.org/0000-0002-3335-808XYesihak Yusuf Mummed
Haramaya University College of Agricultural and Environmental SciencesMohammed Yusuf Kurtu
Haramaya University College of Agricultural and Environmental SciencesMelese Temesgen
Haramaya UniversityTravis Gene O’Quinn
Kansas State University
Research Article
Keywords: weight gain, body condition score, change in linear body measurement
Posted Date: April 13th, 2021
DOI: https://doi.org/10.21203/rs.3.rs-409421/v1
License: This work is licensed under a Creative Commons Attribution 4.0 International License. Read Full License
Page 2/22
AbstractThe study was conducted to evaluate the fattening performance of Arsi, Borana, Harar and HF-Crossbred bulls �nishedunder similar feeding condition at the beef farm in Haramaya University. A total of 24 bulls with age categories of 2-3and 4-5 years were used in the complete block design for the experiment. Total mixed ration was provided at 3% of theirBW during experimental periods. The average daily weight gain of the four breeds range from 0.49 to 0.71 kg. Feedconversion e�ciency also ranges from 0.11 – 0.15. Simple linear regression models were used to explore therelationship between live body weight change and change in BCS as well as seven linear body measurements for allage groups. An average change for a unite of body condition score was equivalent to 20.3, 20.61, 22.42 and 27.78kgfor Borana, Arsi, Harar and HF-crossbred bulls respectively. BCS was signi�cantly (P<0.01) in�uenced by breeds. Therewas a signi�cant (P<0.05) breed by age interaction effect on the initial body condition score of the four breeds. Therewas a signi�cant and positive strong association between change in BW and BCS. There was a signi�cant and strongcorrelation between change in BW and change in Total topline, neck length, heart girth, �ank circumference and rumplength having correlation coe�cient ranges (r = 0.57 to 0.97). Higher (P<0.01) net pro�t of 7,380.47 ETB per head wasrecorded by Borana bulls followed by Harar bulls, Arsi and HF Crossbred with net pro�t of 5,406.86, 5193.29 and3,384.98 ETB per head respectively.
1. IntroductionThe total cattle population for Ethiopia is estimated to be about 59.45 million. The majority (98.2%) of the total cattle inthe country are local breeds. The remaining are hybrid and exotic breeds that accounted for about 1.62 percent and0.18 percent, respectively. Regarding age groups, the majority of the cattle population (that is about 62.95%) was in 3 to10 years and 16.75% is 1 to 3 years. The remaining 2.25 % was 10 and above years old (CSA, 2017).
In Ethiopia, cattle production plays an important role in the economies of the farmers and the country at large. FAO (2007) reported that cattle contribute 40% of the annual agricultural output and 15% of the total gross domestic product.There are 33 recognized indigenous cattle breeds in Ethiopia (DAGRIS 2011). Because of its multi-purpose role, farmershas been used for milk, beef, draft power, farm yard manure and source of cash income in the country (FAO, 2018). Sotherefore, it has been evident that those diversi�ed cattle breeds in all diversi�ed agro-ecology of the country has goodmarket and brings superior prices both at domestic and foreign markets. Such a scenario created an opportunity forsmall-scale cattle fattening systems in different parts of the country. Therefore, Cattle fattening has gained reputationas an important business project of the livestock industry in Ethiopia (Habtamu et al., 2008). This is special in easternpart of the country in general and in Hararghe highlands in particular (Dinku 2019).
Crossbreeding work in Ethiopia was initiated in the early 1950s. Following this initiation a number of governmental andnon-governmental institutions have worked on the development of the dairy sector (Aynalem et al. 2011). This resultedimprovement in milk production as well as surplus crossed bulls’ availability in different parts of the country. However,lack of disposal mechanism for surplus male calves at dairy farm level has been reported as one of the mainconstraints in improving the dairy farm pro�tability (Merera and Galmessa, 2013). The importance of dairy beef tominimize the problem of continuous supply of young bulls to the market was reported in different studies (Mummed2015; Mummed and Webb 2014; Mummed and Webb 2015).
Animal feed both in terms of quantity and quality is a major bottleneck for livestock production in Ethiopia. Currently,with the rapid increase of human population and increasing demand for food, grazing lands are progressively shrinkingby being converted to arable lands, and are restricted to areas that have little value (Mengistu et al., 2017). It is clearthat feed resource utilization (Fikru 2015); fattening and marketing of cattle are undeveloped in different parts of thecountry (Ayalew et al., 2013). Furthermore, developing economic feeding system that enhance the existing traditional
Page 3/22
production and emerging private business is among timely interventions required to increase production andproductivity of beef cattle (Negassa et al., 2011) and thereby achievement to growing demand for meat and also to thecountry’s plan of increasing meat export, by encouraging small scale beef fatteners based on scienti�c evidences. Mostcattle supplied to market from pastoral, agro-pastoral and mixed crop livestock production were reported poor in theirmeat quality (Mummed and Webb 2014; Mummed and Webb 2015). Giving due emphasis on economically feasibleconcentrate supplementation is important in the fattening systems.
Environmental condition during fattening period, type and amount of feed, pre-fattening condition of cattle and feedlotmanagement determine the length of fattening period. Therefore, scarcity of feed, animal in poor condition beforefattening and improper management prolong the �nishing period. Longer fattening periods reduces pro�t realized fromcattle �nishing (Ebrahim et al., 2004).
Arsi, Harar and Borana bulls are also among the 33 recognized indigenous cattle breeds in the country. Their fatteningperformance has be studied and different results were reported by different scholars for example (Mohammed et al.,2008; Haile et al., 2009; Girma et al., 2015;Bedhane and Dadi, 2016) for Borana bulls, (O’Donovan et al., 1978;O’Donovan et al., 1980; Merera and Galmessa 2013) for HF-Crossbred with Borana, Barca and Horro breed respectively,(Tolla et al., 2002, 2003) for Arsi bulls, (Teklebrhan, 2019) for Harar bulls. As result of these works differ in time andspace under different feeding condition; the performance of these breeds under similar fattening conditions were notstudied before. Therefore, this study was conducted to evaluate the growth performance of Arsi, Borana, Harar and HF-Crossbred bulls �nished under similar feeding condition.
2. Materials And Methods2.1. Description of the Study Area
The study was conducted at Haramaya University beef fattening unit. It is located at 9.0°N latitude and 42.0°Elongitude at an altitude of 1980 m above sea level and 515km east of Addis Ababa, Ethiopia. The area receives annualaverage rainfall of 790 mm and annual mean temperature of 16°C (Mishra et al., 2004).
2.2. Animal management and experimental design
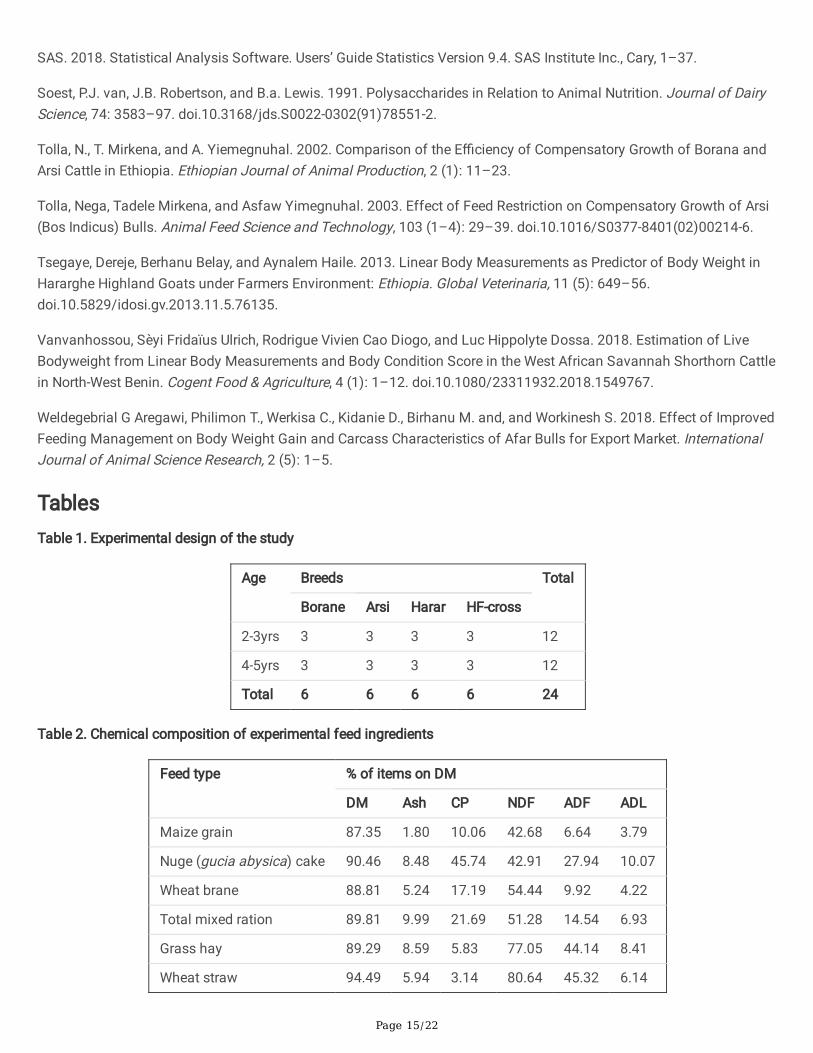
A total of 24 intact bulls from Arsi, Borana, Harar breeds and Holstein Frisian cross were grouped into two age groups(2-3 years and 4-5 years) were used in this experiment at the Beef Farm of Haramaya University using completelyrandomized design as shown in Table 1.
The bulls were purchased from Kofele local market (Arsi breed), Dida Tuyura ranch (Boran breed) and Chefe Bante localmarkets (Harar breed) and Sululta local market (HF-Crossbred) and transported to Haramaya University usingappropriate truck. The age of the animals was estimated using the dentition method as suggested by (Hammond et al.,1971; MLA, 2011).
They were quarantined for two weeks being vaccinated against blackleg disease and also dewormed by injecting withIvermectin against internal and external parasites. After quarantine, each animal was kept in an individual pen andacclimatized for two weeks. The experiment lasted for 90 days
2.3. Experimental feed and chemical analysis
The experimental diet consists of roughage; natural grass hay, wheat straw and concentrate; maize grain, noug (guciaabysica) cake, wheat bran, limestone, salt, ruminant premix, and were analyzed for chemical composition at Haramayauniversity animal nutrition laboratory.
Page 4/22
For chemical analysis 100 grams of samples of feeds were dried at 65 °C for 48 hr. Then dried samples were thenground (1 mm screen) and stored for subsequent analyses of dry matter (DM), crude protein (CP), ash, neutral detergent�re (NDF) and acid detergent �re (ADF). DM, N and total ash were determined according to the o�cial methods of(AOAC, 1990) and NDF and ADF according to (Soest etal., 1991). Dry matter content of the feed was determined bydrying the samples in an oven at 105 °C overnight while ash content was determined by burning the samples at 550 °Cfor 5 h in a muff furnace. Nitrogen (N) were determined by Kjeldahl method (CP = N × 6.25). The chemical compositionof each dietary components is indicated in Table 2.
2.4. Feed formulation and feed intake measurement
The diet were formulated aiming to meet the maintenance requirements and to provide a weight gain of up to 1 kg perday as suggested by Hutcheson (2006) for beef fattening center in Ethiopia. The roughage (60% of total ration)component were natural grass hay (55% of roughage) and wheat straw (45% of roughage); the concentrate (40% oftotal ration) consisted of 34.78% wheat bran, 27.8% Noug cake, 33.14% maize grain, 1.7 % limestone and 1.7 % salt and0.88% ruminant premix. It was formulated to contain CP and energy to meet the optimum recommendation of feedlot.
Three percent of their body weight per day for total mixed ration was given in two equal meals at 8:00 AM in themorning and 3:00 PM in afternoon of the day and the amount were adjusted based on body weight once per everyweek. Clean water was available all the time. The weight of concentrate and roughage offered and refused wererecorded daily to derive feed intake.
2.5. Feed conversion e�ciency
Feed conversion e�ciency (FCE) were calculated for each animal as proportion of weight gain to DM intake
2.6. Evaluation of daily weight gain and linear measurements
Animals were weighed once every week before morning feeding. Initial weight (IW) and �nal weight (FW) were recordedfor different feeding periods.
Where; ADG= Average daily gain, n= number of days, n= 90
Body linear measurements such as total top line (the total length of the animal taken from front of the pool to back ofthe rump), neck length (the distance from front of the pool to the middle dip in vertebrate between the shoulder blades),hip height (height of the cattle on the vertical line passing through the hips), heart girth (the thoracic circumference),�ank circumference (the total distance around the animal taken at the hips) , rump length (the distance taken from thehips to the pin bones), rump or pin bone width (the horizontal distance between the pin bones), shoulder width (thehorizontal distance between shoulders) and chest depth (the distance taken with vertical caliper through the verticaltransverse plane passing just to the rear of the point of the elbow) were taken immediately after acclimatization periodand two days before slaughter.
Page 5/22
2.7. Body condition scoring
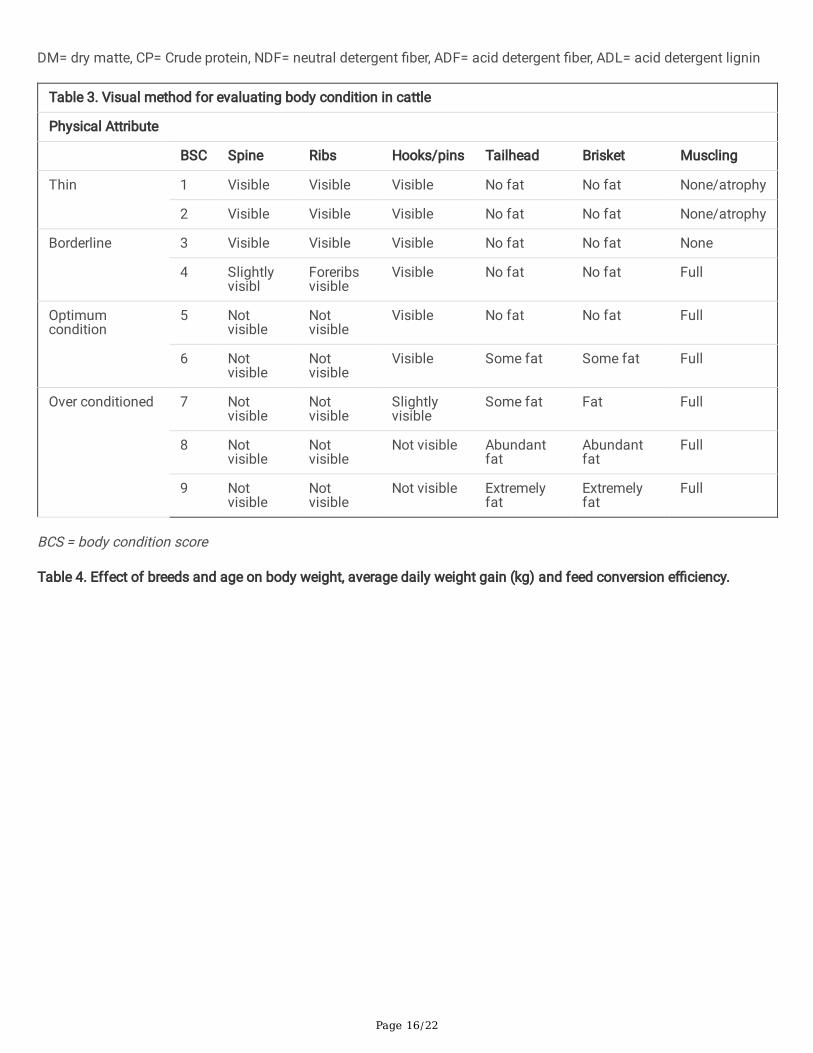
Body condition scoring for each experimental animals (n=24) were recorded once in every week following body weightmeasurement during experimental feeding based on a 9 scale scoring method, with 1 being severely emaciated and 9extremely obese, using the method proposed by Herd and Sprott, (1986)and modi�ed by Jaymelynn et al. (2016) asbrie�y indicated in (Table 3) bellow. To avoid subjective biasness, an expert has scored the condition throughout theexperimental periods.
2.8. Economic analysis
At the end of the experiment, partial budget analysis was performed to evaluate the economic advantage of feeding thefour breeds of intact bulls with total mixed ration. It was done by considering the variable cost of bull price,concentrates and roughage prices, labor, medication and estimated bull sell prices at the end of the experiment. At theend of experimental feeding, four experienced animal dealers were estimate the sell price of each experimental animalsand the average price determined by the dealers was used as the selling price of individual bull. The difference in selland purchase price was considered as total return (TR) in the analysis.
TR = sell price – purchase price
The cost of feed was computed by multiplying the actual DM intake of feed for whole feeding period 90 days with thepurchase price of the feed. The total cost associated with each animal during the experimental period were added andthe total variable cost (TVC) were calculated for each animal. Net return (NR), was calculated by subtracting TVC fromTR as follows.
NR= TR – TVC
2.9. Statistical analysis
The data were analyzed using General Linear Model (GLM) procedure of Statistical Analysis System (SAS, 2018)version 9.4. Simple linear regression was used for the determination of the most suitable model in the prediction of thelive weight change using various body measurements change as continuous variables and simple regression was alsoused for change in body weight and body condition score to establish regression equations. The model included themain effects of age and breed to determine the in�uence of the main effects on all dependent variables considered.The difference among treatment means was tested using Tukeys’ test at 0.05 level of signi�cance.
The models used for the analysis were:
Model I
To evaluate effects of ages and breeds on weight gains and FCE
Yijk = µ +Ai + Bj + (A*B)ij + eijk
Where
Yijk= Response variable
µ = Overall mean
Ai = age effect (i= 2 level)
Page 6/22
Bj = breed effect (j= 4 level)
A*B = interaction effect of age and breed
eijk= random error
Model II
To calculate Relationships between change in body weight and change in BCS, linear body measurement (Totaltopline, Neck length, Flank circumference, Heart girth, Rump width).
Yi = α +βX + ε
Where,
Yi = dependent variable (Live weight change)
α = intercept
X = independent variable (BCS change, Total topline, Neck length, Flank circumference, Heart girth, Rump width change)
β = regression slopes of (BCS change, Total topline, Neck length, Flank circumference, Heart girth, Rump width change)
ε = Residual.
3. Results And Discussion3.1. Bodyweight change, Average daily weight gain, body condition score and feed conversion e�ciency
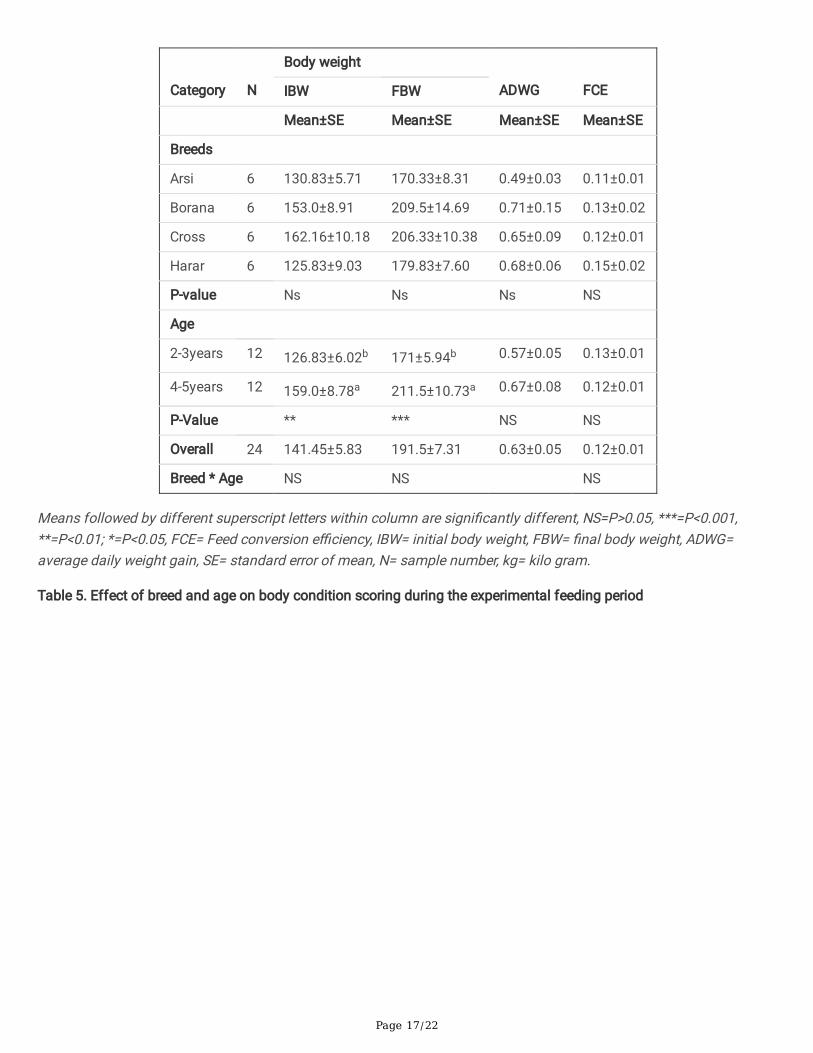
Average initial and �nal live weights and daily weight gain of bulls from the four breeds under two age groups aresummarized in Table 4. The signi�cant difference in �nal and initial body weight of bulls from the four breeds and theirrespective two age categories cannot be explained as the bulls were different in their initial body weight at the start ofthe experiment. However, animals in higher age groups attain higher (P<0.001) body weight records in both initial and�nal body weight. This is in agreement with the previous �nding by (Bassa et al., 2016).
There was no statistically signi�cant difference in average daily weight gain of the four breeds grouped to two agecategories. However, the average daily weight gain in the current study ranges from 0.49 to 0.71 kg with an overallADWG of 0.63kg. The average body weight gain in the present study was in line with the �nding by Bedhane and Dadi(2016) who reported ADG 0.63 kg for Ethiopian Borana breeds with an estimated age of 4 years old.
The attained results in this study for Borana bulls were higher than the report of Haile et al. (2009) which reported thedaily body weight gain of the same breed about 0.44 kg in low input management system. The current result alsoshowed the higher value of ADWG than the �nding of Mohammed et al. (2008) who reported 0.49 kg for 2 years oldBorana bulls under natural grazing management. In addition, lower values of ADG were also reported by Osuji andCapper (1992) which was a 0.51 kg for Ethiopian Highland Zebu (Bos indicus) oxen at age between 7 to 8 years thatwas fed on teff straw with concentrate supplement and Mekasha et al. (2011) and 0.47 kg for Ogaden bulls grazingnative pasture supplemented with agro-industrial by-products mix and hay at a ratio of 25:75 as compared to currentstudy result, Bedhane and Dadi (2016) for Ethiopian Borana breeds with an estimated age of 2 to 6 years old ranged0.49kg to 0.65kg ADWG. However, almost comparable �nding was reported by Girma et al. (2015) who reported thattwo years old Borana bulls attained an ADWG of 0.77 to 0.8 kg.
Page 7/22
The average daily weight gain for the HF-Crossbred bulls in this study was lower than reports by Merera and Galmessa(2013) which was 0.87kg for Horro-Friesian crossbred bulls in the age from 2 to 3 years; O’Donovan et al., (1978) whichwas 0.88 kg for crosses between Borana bulls and Friesian dam as well as 0.98kg for a cross between Barca sire withFriesian dam at Holota research center. However, higher than the report by O’Donovan et al., (1980) who reported 0.54kgADWG for crossbreds at Bakko research center.
The ADWG of Afar bulls supplemented with different levels of concentrate under improved feeding management werebetween 0.54 and 0.62 kg (Weldegebrial, 2018). This is in agreement with the value of Harar bulls in the current study.Moreover, Tolla et al. (2003) reported comparable ADG 0.44 to 0.57 kg for Arsi bulls. In contrast to the current �ndingTeklebrhan (2019) reported that Hararghe highland bulls feeding different concentrate feeds revealed a higher ADG of1.21 to 1.33 kg.
The feed conversion e�ciency of the experimental bulls in this study was not signi�cantly different (P>0.05) betweenbreed, age as well as the interaction between breed and age. This is in line with the �nding of Adebabay et al. (2013)who revealed the absence of a signi�cant difference between Fogera and Adet breed bulls. Tolla et al. (2002) alsoreported insigni�cant (P>0.05) differences among Borana and Arsi breed bulls. Similarly, Merera and Galmessa (2013)reported that feed conversion e�ciency was higher for the lower age group but the differences were not signi�cant(P>0.05) for Horro-Friesian crossbred bulls. The overall mean value obtained in this study was comparable with thefeed conversion e�ciency of Fogera (0.10) oxen reported by Adebabay et al. (2013) but higher than the value for Adet(0.09) oxen. Whereas higher values were reported by Tolla et al. (2002) for Boran (0.14) and Arsi (0.13).
Means followed by different superscript letters within column are signi�cantly different, NS=P>0.05, ***=P<0.001,**=P<0.01; *=P<0.05, FCE= Feed conversion e�ciency, IBW= initial body weight, FBW= �nal body weight, ADWG=average daily weight gain, SE= standard error of mean, N= sample number, kg= kilo gram.
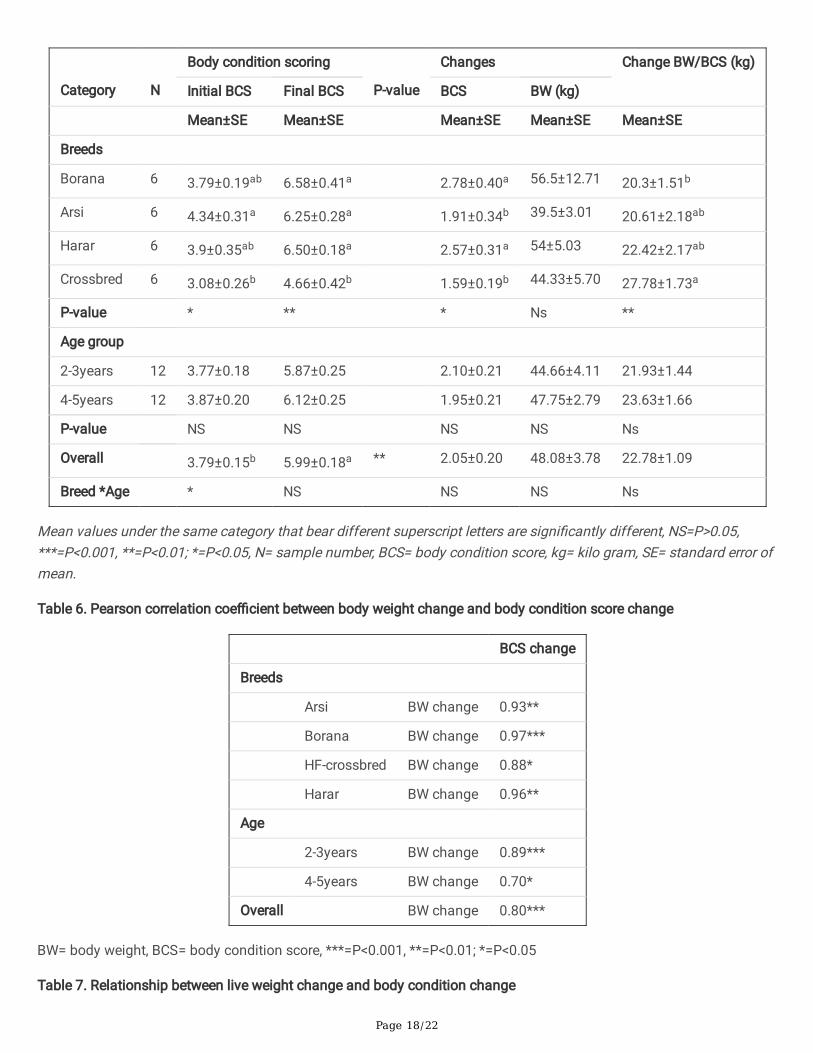
The pattern of body condition score of three indigenous breeds and HF crossbred bulls for the two age categories werepresented in Table 5. The mean body condition score was the highest (P < 0.05) for Arsi bulls compared to FHCrossbred while Harar and Borana bulls show intermediate body condition scores obtained during the start ofexperimental feeding. This variation might be due to the difference in animal management at their respective sourcebefore experimental feeding. HF crossbred bulls scored lower (P<0.01) body condition compared to all Borana, Hararand Arsi bulls in the �nal period of feeding.
Meanwhile, body condition score is an excellent indicator of the nutritional status of the animals and is an indirectre�ection of the body reserve, the highest body condition score obtained for Arsi bulls, as well as the higher BCS changein Borana and Harar bulls, reveals that these animals were in a better nutritional status and had better body reserve atthe initial score and BCS change respectively. Therefore, change in body condition score is an indirect estimation of livebody weight change. This is con�rmed by several scholars in their works (Nicholson and Sayers, 1987; Osuji andCapper, 1992; Berry et al., 2006).
The estimated body weight change based on the change in body weight to change in BCS ratio was signi�cantly(P<0.01) in�uenced by breeds as shown in Table 5. This result indicates that change of one condition score wassigni�cantly higher (P<0.01) for HF-crossbred bulls (27.78 kg) than Borana bulls (20.3kg) whereas intermediate values22.42kg and 20.61kg were recorded for Harar and Arsi bulls respectively. The higher body weight change per onecondition score change for HF-Crossbred bull obtained in the current �nding might be due to the heavier body size ofHF-crossbred bulls than other local cattle bulls of similar age. Therefore, fattening HF-crossbred bulls wasadvantageous in beef production improvement.
Page 8/22
Mean values under the same category that bear different superscript letters are signi�cantly different, NS=P>0.05,***=P<0.001, **=P<0.01; *=P<0.05, N= sample number, BCS= body condition score, kg= kilo gram, SE= standard error ofmean.
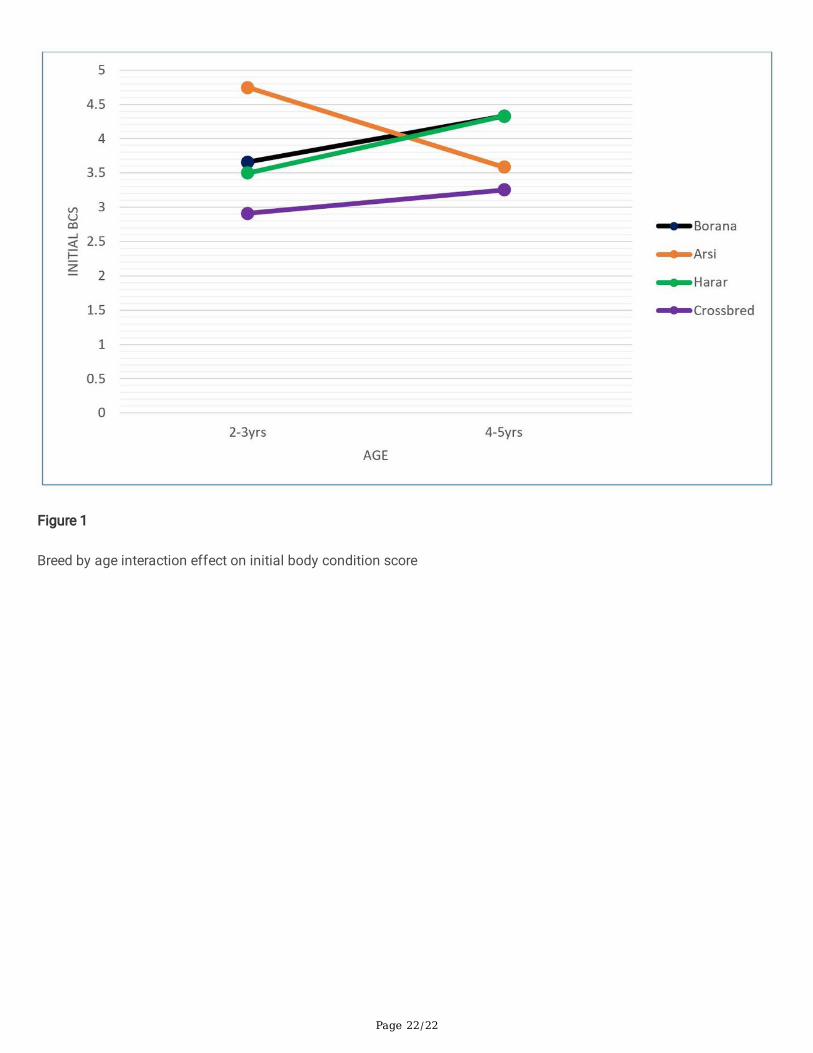
The two age groups are not different in the initial BCS. Similarly, the BCS of the bull was the same under the two-agegroup during �nal feeding periods. The same holds true for change in BCS and BW change. On the other hand, therewas a signi�cant breed by age interaction effect on the initial body condition score of the four breeds. i.e., thedifference in initial BCS between the four breed bulls depends on the age in which they are grouped. The Arsi bullsscore higher body condition in the lower age group than the higher age group. However, the reverse was true in theBorana, Harar and HF crossbred (Figure 1).
The relationship between BW change and BCS change was presented in (Table 6). The relationship between BCSchange and BW change was statically signi�cant (P<0.01) in all factors. Bodyweight change and body condition scorechange were positively and strongly correlated in the breeds of Arsi, Borana, Harar and HF-crossbred bulls. Themaximum correlation coe�cient (r = 0.97) for Borana and minimum correlation coe�cient (r = 0.88) for HF-crossbredbulls were observed. Indicating a high level of association between body weight and body condition score changes. Similarly, there was a strong, positive and signi�cant (P<0.01) correlation between BW and BCS change in the agecategories of 2-3 years, 4-5 years and overall bulls. This is corroborated by the previous work that con�rms that therewere strong relationship between BCS and BW change in cattle (Díaz-López et al. 2017; Evangelista et al. 2019)
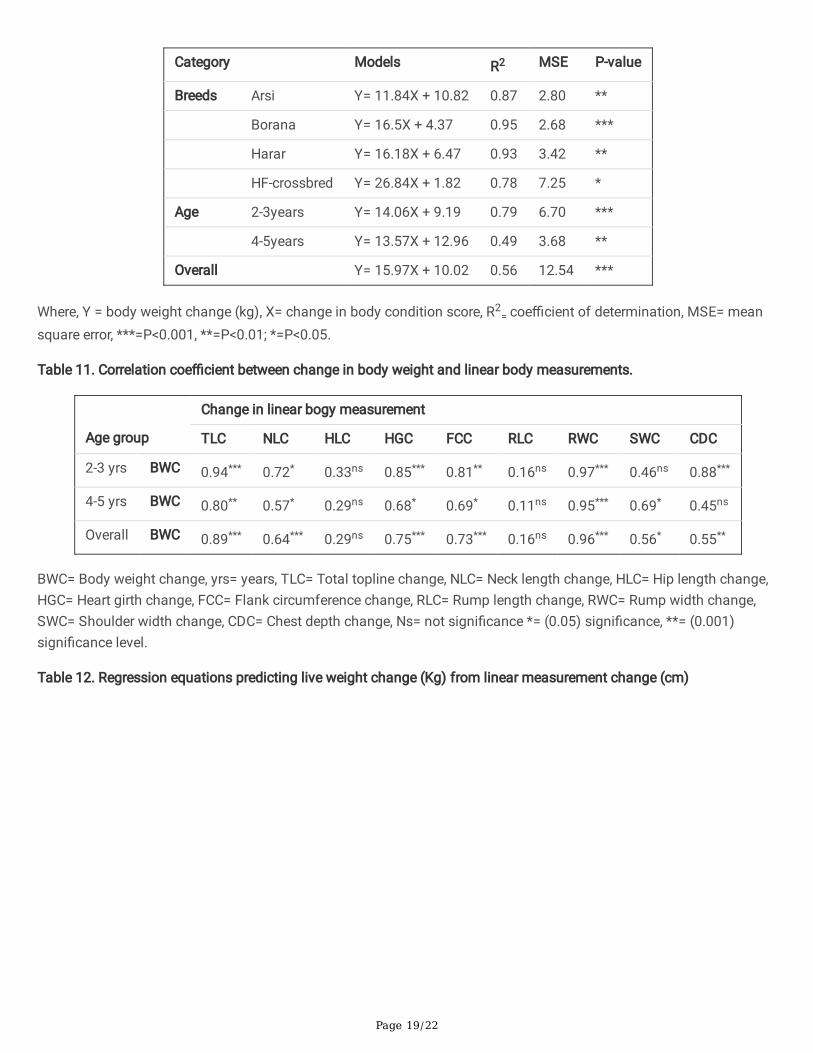
The regression equation predicting live weight change per body condition change for the two-age group and the entireexperimental bulls were presented in Table 7. Accordingly, it means that change of one condition score is equivalent to22.66, 20.87, 22.65 and 28.66 kg body weight in Arsi, Borana, Harar and HF-crossbred bulls respectively. When theseexperimental bulls were arranged in two age categories one body condition score change in 2-3 years and 4-5 years oldbulls represent 23.65 and 26.53 kg bodyweight change, respectively. The average change of one condition score for allexperimental bulls was equivalent to 25.99 kg body weight. Comparable with the current �nding Ali and Muna (2013)reported one condition score was equivalent to 26 kg in males for Sudan cattle. The value of BW associated with theunit of BCS change in the current study was lower than previous report by Berry et al., (2006) who reported a change of31 kg BW for every unit change in BCS for Holstein-Friesian cattle in New Zealand, Fox, et al., (1999) also reported therelationship between BW change and BCS in Holstein cows was 84.6 kg/BCS. However, the value of 25.99 kg from thepresent study agrees well with the range of 21 to 35 kg BW per unit BCS in Holstein-Friesian cattle reported byEnevoldsen and Kristensen (1997). Jaurena et al. (2005) reported higher values for the regression 32 to 47 kg/BCS. Differences between studies in the relationship between BCS and BW change were due to BW is affected by breed, agesex and statistical models used (Berry et al., 2011). Bodyweight values obtained as per change in one unit of bodycondition score was increasing as the age of animals increasing. This is in agreement with earlier �ndings (Osuji andCapper, 1992; Berry et al., 2006).
Body condition scores of experimental bulls were improved over the feeding period where bulls in the �nal period offeeding had the higher (P < 0.01) body condition score than initial BCS. This is corroborated by the works that con�rmbody condition scores were improved over the feeding period (Mekasha et al., 2011; Merera and Galmessa, 2013).
3.2. Correlation between change in body weight and linear measurement
Pearson's correlation coe�cient (r) between body weight change and linear body measurement change was presentedin Table 11. In both age categories and overall measurement, all of the changes in linear body measurements have apositive association with changes in body weight. Highly signi�cant association were found between body weightchange and total topline (r = 0.94, P<0.0001), heart girth (r = 0.85, P<0.0001), chest depth (r = 0.88, P<0.0001) and �unk
Page 9/22
circumference (r = 0.81, P<0.01) change in the younger age category. There was a highly signi�cant and positivecorrelation between BW change and total topline change (r = 0.80, P<0.01) and (r =0.89, P<0.0001) in the second agecategory and overall, respectively. Whereas change in neck length (r = 0.72, P<0.05) and (r = 0.57, P<0.05) moderatelyin�uence body weight change in the �rst (2-3years) and second age group (4-5years) respectively. Change in heart girth(r =0.68, P<0.05), �ank circumference (r = 0.69, P<0.05) and shoulder width (r = 0.69, P<0.05) has signi�cant positiveassociation with BW change in the second age group. Considering the overall experimental bulls in the relationship alsoshows a signi�cant correlation between change in body weight and some of the linear body measurements. Likewise,the highest relationship was found between body weight change and change in total topline (r = 0.89, P<0.0001),change in Heart girth (r = 0.75, P<0.0001), change in �ank circumference (r = 0.73, P<0.0001). moreover, there was amoderately signi�cant correlation between BW change and change in shoulder width (r = 0.56, P<0.05) and chest depth(r =0.55, P<0.05). Change in ramp width was signi�cantly correlated with BW change. However, there was no signi�cantcorrelation between body weight change and change in hip length and rump length in both age groups as well asoverall experimental bulls. Meaning that they did not signi�cantly affect the change in body weight, so they were notmore important in the prediction of live body weight change of the animal because of weak association with bodyweight change. This study is in agreement with some of the previous works by Vanvanhossou et al.( 2018) thatreported as correlation coe�cients within age groups con�rm the in�uence of these parameters on the relationshipsbetween live body weight and linear body measurements. Tsegaye et al. (2013) also suggest that the best estimationsof body weight from linear body measurements should be developed from those that showed a strong correlation.Generally, as the result of correlation showed a change in total topline, neck length, heart girth, �ank circumference,rump width and chest depth was the most important than other linear body measurement change for both agecategories to estimate body weight change per unit change of linear measurement during fattening.
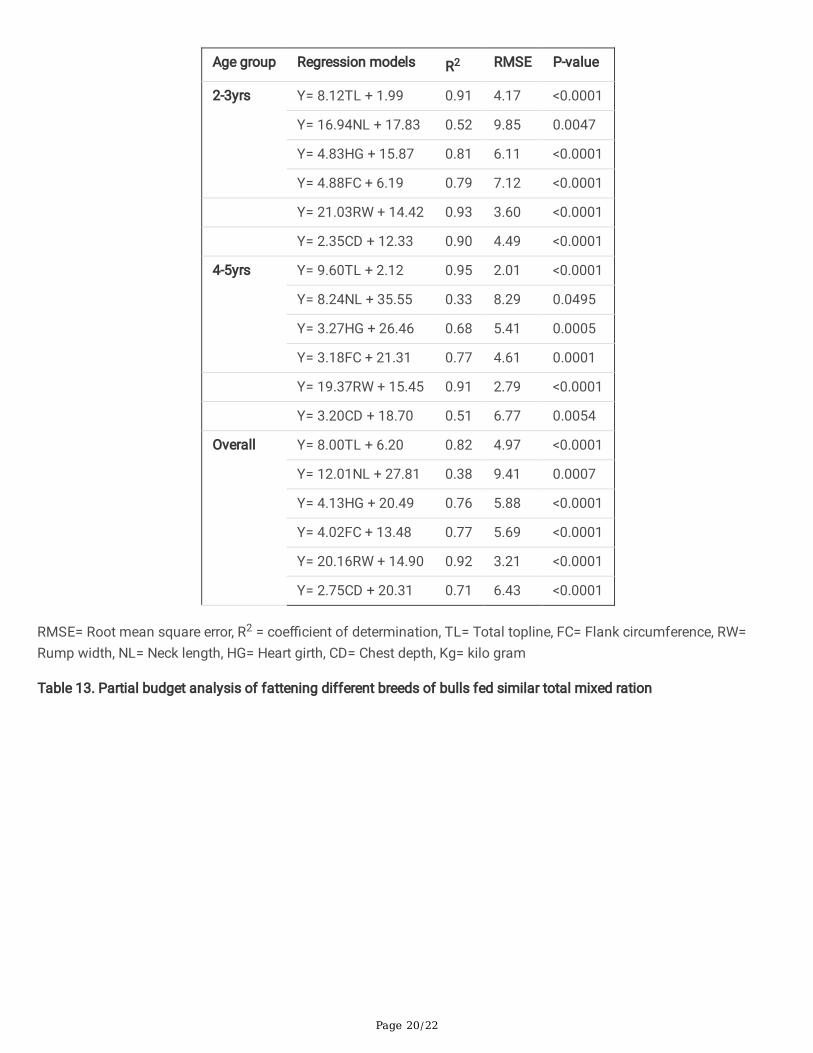
The prediction equations to estimate body weight change per unit change of linear body measurements were presentedin Table 12. Individual linear body measurement parameters were used to establish the most appropriate modelspredicting the live body weight change of bulls during the fattening period. The different age categories as well asoverall bulls were analyzed separately.
In the �rst age category regression model reveals that about 91% of the change in BW was in�uenced by a change intotal topline and the remaining 9% was in�uenced by other factors outside the model such as cattle condition whenmeasured and weighed, measurements method, the accuracy of measuring instruments and others. According to theModel, increasing 1 cm of the total topline of bulls was equivalent to increasing 8.21 kg of BW. Whereas change in 1cm of total topline represents 9.6kg and 8.0kg BW change in the second age group and when overall experimental bullsconsidered in the model respectively. In accordance with the present study, Bhagat et al. (2016) observed the highest R2
value when body length alone was included in the regression model in 2-3 year Sahiwal male cattle. The variation inlive body weight was also explained by the change in neck length, in this regression model, increment in 1cm necklength represent 16.96kg for bulls under 2-3years age, 8.24kg for 4-5years age and 12.01kg in overall experiment.However, a maximum R2 value of 0.52 and a minimum R2 value of 0.33 were observed in the 2-3years and 4-5years agegroup respectively.
The coe�cient of determination (R2) value in simple linear regression using HG as the independent variable in both agegroups was included in the high category (0.68<R2<0.81). In line with the present �nding, Patel et al. (2019) reported thehighest R2 value when the heart girth alone included in the regression models of HF crossbred 2-4 years, Bhagat et al.(2016) also observed the highest R2 value when the heart girth alone included into the regression models in 2-3 Years Sahiwal female cattle. similarly, high category of R2 value (0.61<R2<0.80) in regression models were reported in somebreeds cattle of Abyssinian 0.65, Holstein Friesian 0.61, Ongole 0.79, crossbred dairy 0.67 and 0.73 for Lagune (Goe etal., 2001; Ozkaya and Bozkurt 2009; Putra, 2020; Lukuyu et al. 2016; Assogba et al., 2017). According to the Model,
Page 10/22
increasing 1 cm of HG was followed by increasing 4.83kg, 3.27kg and 4.13kg of BW for 2-3year, 4-5years and overallestimation respectively. In line with the current �nding Putra (2020) reported change in 1cm HG was equivalent to 4.55kg for bull and 3.26 kg of BW for a heifer. Goe et al., ( 2001) also estimated a 1 cm change in heart girth would result ina weight change of 3.4 to 4.7 kg for Ethiopian highland oxen. Odadi (2018) reported a 1 cm change in heart girth wouldresult in a weight change of 3.37 kg for Bos indicus cattle in Kenya.
Change in �ank circumference in all age categories indicates that about 77% to 79% in�uenced BW change. One unitchange in �ank circumference was equivalent to 3.18 to 4.88kg of BW in the current �nding. 1cm change in chestdepth was also equivalent to 2.35kg BW change in bulls under 2-3years, 3.2kg for 4-5years and 2.75kg BW change inoverall estimation.
The higher R2 value and smaller RMSE attained using a single predictor in each age categories showed that the linearbody measurements used as independent variables were good estimators of body weight. Generally, rump width wasthe most determinant linear body measurement variables in establishing a regression model in predicting BW changeper unit of rump width change during fattening in all age categories.
3.3. Economics of Fattening
The partial budget analysis for the experimental feeding was reported in Table 13 which involved the evaluation ofoverall pro�tability. The economic analysis shows the highest (P<0.001) net bene�t obtained from Borana bulls with anet return of 7,380.47 ETB per head followed by Harar bulls, Arsi and HF Crossbred with a net pro�t of 5,406.86,5,193.29 and 3,384.98 ETB per head respectively. The variation of net bene�t among different breeds was mainlysimilar to their trend in weight gain difference among breeds. BCS and physical appearance of individual bulls alsohave a direct in�uence on the �nal sell price of each bull. Similar to this result, Adebabay et al.(2013) revealed that thenet bene�t of Fogera old oxen increased with increasing weight gain that resulted from the increased quantity ofsupplementation and �nal selling practice is based on body condition. According to the current result, feeding 3% ofbody weight of total mixed ration was highly (P<0.01) pro�table for Borana bulls which may be affected by total weightgain, physical appearance and body condition score. HF-crossbred bull was economically less (P<0.01) pro�tablecompared with other breed bulls but statistically similar net pro�t was obtained from Arsi bulls. This indicates that HF-crossbred bull was less pro�table under a limited feeding system because of their feed consumption is high ascompared with other indigenous zebu bulls. This is concomitant with the report by Gojam et al. (2017) revealed thatfarmers around Holota agricultural research center were not even willing to use the crossbred cows, because of highfeed consumption and di�culties to handle the animals.
Even though it is obvious from this result that the bulls in both age groups are statistically similar in net pro�t, one cango for the older groups which gives higher net return.
Generally, feeding 3% of body weight of total mixed ration for 90 days was economically pro�table providing an overallmean of 5,341.40 ETB per head of bulls. However, further investigation on fattening HF-crossbred bulls under differentlevels of total mixed ration offering was recommended to evaluate economic pro�tability based on their weight gainand condition score performance.
4. Conclusion And RecommendationFrom the result, it was concluded that the average daily weight gain of the four breeds range from 0.49 to 0.71 kg.Change in body weight and body condition score was positively and strongly correlated in all breeds and age groups.Fattening HF-crossbred bulls was advantageous in beef production because of higher body weight change per one
Page 11/22
condition score change. Changes in linear body measurements have a positive association with changes in bodyweight. Moreover, rump width was the most determinant linear body measurement variable in establishing a regressionmodel predicting BW change per unit of change in linear body measurement variables during fattening in all agecategories. Feeding 3% of body weight of total mixed ration for 90 days was economically pro�table in all experimentalbull with the higher net return from Borana bulls. However, HF-Crossbred bulls need further investigation under differentlevels of offering total mixed ration to evaluate their potential for economic pro�tability.
DeclarationsACKNOWLEDGMENTS
Many of the research �ndings highlighted in this article were funded in whole or part by the United States Agency forInternational Development (USAID) Bureau for Food Security under Agreement # AID-OAA-L-15-00003 as part of Feedthe Future Innovation Lab for Livestock Systems. Any opinions, �ndings, conclusions, or recommendations expressedhere are those of the authors alone. Furthermore, the authors would like to acknowledge the Ministry of Science andHigher Education of Ethiopia and Oda Bultum University for the partial support of the research activities and paymentof salary of the research during the study.
Con�ict of interest
The authors declared that there is no con�ict of interest between authors and organizations regarding this paper.
ReferencesAdebabay Kebede, Addisu Bitew, Tewodros Bimrew, Asresu Yitayew, Yihalem Denekew, Yeshiwas Ferede and GetinetZele. 2013. Comparative Evaluation of the Fattening Performance of Fogera and Adet Old Oxen At Andassa LivestockReseach Center, Ethiopia. Int. J. Pharm. Med. & Bio. Sc., 2 (4):66–75.
Ali, P. Milla, and Muna, M. Mahjoub. 2013. Estimation of Live Body Weight from Heart Girth, Body Length and ConditionScore in Nilotic Cattle Southern Sudan. Agricultural Technology Transfer Society Magazine, 1 (1):15–19.
AOAC. 1990. AOAC O�cial Methods of Analysis. Association of O�cial Agricultural Chemists. Washington, D.C. 15th(Volume 1): 136–38.
Assogba Brice Gérard Comlan, Adjassin Josias Steve, Alkoiret T. Ibrahim. 2017. Use of Body Measurements to EstimateLive Weight of Lagune Cattle in Use of Body Measurements to Estimate Live Weight of Lagune Cattle in SouthernBenin. The Saudi Journal of Life Sciences, 2 (2): 23–32. doi.org/10.21276/haya.2017.2.2.1.
Ayalew, Teshager, Belay Duguma, and Taye Tolemariam. 2013. Traditional Cattle Fattening and Live Animal MarketingSystem in Different Agro-Ecologies of Ilu Aba Bora Zone, Oromia, Ethiopia. Global Veterinaria, 10 (5): 620–25.doi.10.5829/idosi.gv.2013.10.5.6688.
Bassa, Zekarias, Shewangizawu Wolde, Tesfaye Alemu, Melese Yilma, Asrat Terra, Berekt Zeleke, and Deibe Gemiyu.2016. Evaluation of Locally Available Energy Source Feeds on Fattening Performance of Local Oxen and CarcassAnalysis in Wolaita, Southern. Hydrol Current Res, an Open Access Journal, 7 (3): 3–7. doi.10.4172/2157-7587.1000255.
Berry, D P, F Buckley, and P Dillon. 2011. Relationship between Live Weight and Body Condition Score in Irish Holstein-Friesian Dairy Cows. Irish Journal of Agricultural and Food Research, 50 (2): 141–47.
Page 12/22
Berry, Donagh P., Kevin A. Macdonald, John W. Penno, and John R. Roche. 2006. Association between Body ConditionScore and Live Weight in Pasture-Based Holstein-Friesian Dairy Cows. Journal of Dairy Research, 73 (4): 487–91.doi.10.1017/S0022029906002020.
Bhagat, Vandana, Vikas Khune, S K Chourasia, M K Gendley, and K Mukherjee. 2016. Linear Regression Equations forEstimation of Body Weights in Sahiwal Calves. Journal of Animal Research, 2: 161–63. doi.10.5958/2277-940X.2015.00187.4.
CSA, (Central Statistical Agency). 2017. Federal Democratic Republic of Ethiopia. LIVESTOCK AND LIVESTOCKCHARACTERISTICS (PRIVATE PEASANT HOLDINGS). 2 (December).
DAGRIS. 2011. Domestic Animal Genetic Resource Information System (DAGRIS): International Livestock ResearchInstitute Addis Ababa, Ethiopia. 2011.
David, Hutcheson. 2006. Feeding to Produce Export Quality Ethiopian Beef Requirements and Recommendations.
Díaz-López, Gustavo, Rosario Salazar-Cuytun, Ricardo García Herrera, Angel Piñeiro-Vázquez, Fernando Casanova-Lugo, and Alfonso J. Chay-Canul. 2017. Relationship between Body Weight and Body Condition Score with EnergyContent in the Carcass of Pelibuey Ewes. Austral Journal of Veterinary Sciences, 49 (2): 77–81. doi.10.4067/S0719-81322017000200077.
Dinku, A. 2019. Assessment of Constraints and Opportunities in Small-Scale Beef Cattle Fattening Business: Evidencefrom the West Hararghe Zone of Ethiopia. International Journal of Veterinary Science and Research, 5 (2): 058–068.doi.10.17352/ijvsr.000042.
Enevoldsen, Carsten, and Troels Kristensen. 1997. Estimation of Body Weight from Body Size Measurements and BodyCondition Scores in Dairy Cows. Journal of Dairy Science, 80 (9): 1988–95. doi.10.3168/jds.S0022-0302(97)76142-3.
Evangelista, Giovana Tagliari, Jusecléia Ferreira Lopes, Giordano Bruno Fornar, Ricardo Pedroso Oaigen, Thaís LopesGonçalves, Tamara Esteves De Oliveira, Luís Kluwe De Aguiar, and Júlio Otávio Jardim Barcellos. 2019. Key FactorsIn�uencing the Sale of Bulls in Livestock Auctions. Revista Mexicana De Ciencias Pecuarias, 10 (3): 610–22.doi.10.22319/rmcp.v10i3.4609.
FAO. 2007. Fao/Wfp Crop and Food Supply Assessment Mission To Ethiopia. http://www.fao.org/giews/.
FAO (Food and Agriculture Organization). 2018. Livestock Production Systems Spotlight. Cattle Sectors in Ethiopia.Africa Sustainable Livestock 2050, no. 2050: 9.
Fikru, Sisay. 2015. Assessment of Cattle Fattening and Marketing Practice in Harshin District of Somali Regional State,Ethiopia. Advances in Dairy Research, 03 (02). doi.10.4172/2329-888x.1000137.
Fox, D. G., M. E. Van Amburgh, and T. P. Tylutki. 1999. Predicting Requirements for Growth, Maturity, and Body Reservesin Dairy Cattle. Journal of Dairy Science, 82 (9): 1968–77. doi.10.3168/jds.S0022-0302(99)75433-0.
Gebremariam, Tsegay Teklebrhan. 2019. Feedlot Performance and Carcass Yield of Hararghe Highland ( Bos Indicus )Bulls Using Different Concentrate Feeds. Acta Scientiarum. Animal Sciences, 41: 1–7.doi.org/10.4025/actascianimsci.v41i1.42557.
Girma D, Mieso G, Tesfaye A, Arse G, Frehowit M, Ashebir W and Aman G. 2015. Effect of Different Feeds Option onGrowth Response and Carcass Characteristic of Two Years Aged Borana Bulls for Export Market Weight Gain at Adami
Page 13/22
Tulu Agricultural Research Center. Basic Research Journal of Agricultural Science and Review.
Goe, M. R., J. R. Alldredge, and D. Light. 2001. Use of Heart Girth to Predict Body Weight of Working Oxen in theEthiopian Highlands. Livestock Production Science, 69 (2): 187–95. doi.10.1016/S0301-6226(00)00257-8.
Gojam, Yohannes, Million Tadesse, Kefena Efffa, and Direba Hunde. 2017. Performance of Crossbred Dairy CowsSuitable for Smallholder Production Systems at Holetta Agricultural Research Centre. Ethiopian Journal of AgriculturalSciences, 27 (1): 121–31.
Habtamu Abera, Mulugeta Kebede, Chala, Arse Gebeyehu, Ul�na Galmessa, Merer, Temesgen Ayena and TemesgenJembere, and Tesfaye Lema. 2008. On Farm Demonstration and Popularization of Backyard Oxen FatteningTechnologies in Dano Districts, Western Oromia - Google Search. In Proceedings of the 16th Annual Conference of theEthiopian Society of Animal Production (ESAP) Held in Addis Ababa, Ethiopia, October 8 to 10, 2008. Addis Ababa.
Haile, A., B. K. Joshi, W. Ayalew, A. Tegegne, and A. Singh. 2009. Genetic Evaluation of Ethiopian Boran Cattle and TheirCrosses with Holstein Friesian in Central Ethiopia: Milk Production Traits. Animal, 3 (4): 486–93.doi.10.1017/S1751731108003868.
Haile, Aynalem, Workneh Ayalew, Noah Kebede, Tadelle Dessie, and Azage Tegegne. 2011. Breeding Strategy to ImproveEthiopian Boran Cattle for Meat and Milk Production. IPMS (Improving Productivity and Market Success) of EthiopianFarmers Project Working Paper 26. Nairobi, Kenya, ILRI., no. 26: 56.
HammondJr., I. L. Mason and T. J. Robinson London, Edward Arnold. 1971. Hammond’s Farm Animals (4th Edit.).Experimental Agriculture, 8 (2): 179–80. doi.10.1017/s0014479700005160.
Herd, Dennis B., and L.R. Sprott. 1986. Body Condition, Nutrition and Reproduction of Beef Cattle. Texas AgriculturalExperiment Station Bulletin,
Jaurena, G., J. M. Moorby, W. J. Fisher, and R. Cantet. 2005. Association of Body Weight, Loin Longissimus Dorsi andBackfat with Body Condition Score in Dry and Lactating Holstein Dairy Cows. Animal Science, 80 (2): 219–23.doi.10.1079/ASC41750219.
Jaymelynn K. Farney, Dale A. Blasi, Sandy Johnson, Christopher Reinhardt, A.J. Tarpof, Justin Waggoner, RobertWeaber. 2016. Guide to Body Condition Scoring Beef Cows and Bulls. K-STATE Research and Extension, 1–8.
Lukuyu, M. N., J. P. Gibson, D. B. Savage, A. J. Duncan, F. D.N. Mujibi, and A. M. Okeyo. 2016. Use of Body LinearMeasurements to Estimate Liveweight of Crossbred Dairy Cattle in Smallholder Farms in Kenya. Springer Plus, 5 (1): 1–14. doi.10.1186/s40064-016-1698-3.
Mekasha, Yoseph, Mengistu Urge, Mohammed Y. Kurtu, and Merga Bayissa. 2011. Effect of Strategic Supplementationwith Different Proportion of Agro-Industrial By-Products and Grass Hay on Body Weight Change and CarcassCharacteristics of Tropical Ogaden Bulls (Bos Indicus) Grazing Native Pasture. African Journal of Agricultural Research,6 (4): 825–33. doi.10.5897/AJAR09.750.
Mengistu, Alemayehu, Gezahagn Kebede, Fekede Feyissa, and Getnet Assefa. 2017. Review on Major Feed Resources inEthiopia : Conditions , Challenges and Opportunities. Acad. Res. J. Agri. Sci. Res., 5 (3): 176–85.doi.10.14662/ARJASR2017.013.
Merera, Chala, and Ul�na Galmessa. 2013. Fattening Performances of Culled Dairy Bulls to Boost Bene�ts of DairyFarmers in Western Oromia , Ethiopia. International Journal of Livestock Production, 4 (10): 161–64.
Page 14/22
doi.org/10.5897/IJLP2013.0170.
MLA (Meat and Lvestock Australia). 2011. Tropical Beef Production Manual. Module 3 Cattle Husbandry, Welfare andManagement. Meat and Lvestock Australia,
Mohammed Bedhane and Hailu Dadi. 2016. Growth and Slaughter Characteristics of Ethiopian Boran Breed Bull.International Journal of Livestock Research, 6 (3): 41–50. doi.10.5455/ijlr.20150215090156.
Mohammed Negash, Tesfaye Lemma, Takele Feyera, Hailu Dadi, Tatek Woldu, Tesfaye Al. 2008. Comparison of BodyWeight Gain Performance and Carcass Characteristics of the Two Ethiopian Cattle Breeds under Natural PastureGrazing Management. Livestock Research for Rural Development. http://www.lrrd.org/lrrd20/8/nega20117.htm.
Mummed Y. Y. 2015. Beef Carcass Quality , Yield and Causes of Condemnations in Ethiopia. PhD Dessertation, PretoriaUniversity, South Africa.
Mummed, Y Y, and E C Webb. 2015. Carcass Quality Audit a Strategy to Improve Beef Sector in Ethiopia. AfricanJournal of Agricultural Research, 10 (28): 2731–37. doi.10.5897/AJAR2015.9524.
Mummed, Yesihak Yusuf, and Edward Cottington Webb. 2014. Ethiopian Beef Carcass Characteristics. African Journalof Agricultural Research,. doi.10.5897/AJAR2014.9102.
Negassa, Asfaw, Shahidur Rashid, and Berhanu Gebremedhin. 2011. Livestock Production and Marketing. DevelopmentStrategy and Governance Division, International Food Policy Research Institute – Ethiopia Strategy Support Program II,Ethiopi. ESSP II Working Paper 26. www.ifpri.org.
Nicholson, M. J., and A. R. Sayers. 1987. “RNicholson, M. J., & Sayers, A. R. 1987. Relationships between Body Weight,Condition Score and Heart Girth Changes in Boran Cattle. Tropical Animal Health and Production, 19 (2): 115–20.doi.10.1007/BF02297329.
O’Donovan, P.B. and Taylor, M.S. and Abraham WoleGebriel and Alemu Gebrewolde and Gala, E.S.E and Alemu Tadesse.1980. Fattening Trials with Zebu and Crossbred Cattle at Bako, Wollega. Ethiopian Journal of Agricultural Sciences,
O’Donovan, P. B.O., A. Gebrewolde, B. Kebede, and E. S.E. Galal. 1978. Fattening Studies with Cross-Bred(EuropeanXZebu) Bulls: 1. Performance on Diets of Native Hay and Concentrate. The Journal of Agricultural Science,90 (2): 425–29. doi.10.1017/S0021859600055532.
Odadi, W O. 2018. Using Heart Girth to Estimate Live Weight of Heifers (Bos Indicus) in Pastoral Rangelands ofNorthern Kenya. Livestock Research for Rural Development, 30 (16).
Ozkaya, S., and Y. Bozkurt. 2009. The Accuracy of Prediction of Body Weight from Body Measurements in Beef Cattle.Archives Animal Breeding, 52 (4): 371–77. doi.10.5194/aab-52-371-2009.
Osuji, P.O., B.Capper. 1992. Effect Of Age On Fattening And Body Condition Of Draught Oxen Fed Teff Straw (EragrostisTeff) Based Diets. Trop. Anita. Hlth Prod., 24: 103–8.
Patel Ashwini J., Patel Sanjay G.J., Amipara P.M., Lunagariya D.J., Parmar and Rank D.N., and 1Department. 2019.Prediction of Body Weight Based on Body Measurements of Yak. Int.J.Curr.Microbiol.App.Sci., 8(03): 8 (3): 1597–1611.
Putra, Widya Pintaka Bayu. 2020. The Assessment of Body Weight of Sumba Ongole Cattle (Bos Indicus) by BodyMeasurements. Manas Journal of Agriculture Veterinary and Life Sciences, 9 (2): 104–11.
Page 15/22
SAS. 2018. Statistical Analysis Software. Users’ Guide Statistics Version 9.4. SAS Institute Inc., Cary, 1–37.
Soest, P.J. van, J.B. Robertson, and B.a. Lewis. 1991. Polysaccharides in Relation to Animal Nutrition. Journal of DairyScience, 74: 3583–97. doi.10.3168/jds.S0022-0302(91)78551-2.
Tolla, N., T. Mirkena, and A. Yiemegnuhal. 2002. Comparison of the E�ciency of Compensatory Growth of Borana andArsi Cattle in Ethiopia. Ethiopian Journal of Animal Production, 2 (1): 11–23.
Tolla, Nega, Tadele Mirkena, and Asfaw Yimegnuhal. 2003. Effect of Feed Restriction on Compensatory Growth of Arsi(Bos Indicus) Bulls. Animal Feed Science and Technology, 103 (1–4): 29–39. doi.10.1016/S0377-8401(02)00214-6.
Tsegaye, Dereje, Berhanu Belay, and Aynalem Haile. 2013. Linear Body Measurements as Predictor of Body Weight inHararghe Highland Goats under Farmers Environment: Ethiopia. Global Veterinaria, 11 (5): 649–56.doi.10.5829/idosi.gv.2013.11.5.76135.
Vanvanhossou, Sèyi Fridaïus Ulrich, Rodrigue Vivien Cao Diogo, and Luc Hippolyte Dossa. 2018. Estimation of LiveBodyweight from Linear Body Measurements and Body Condition Score in the West African Savannah Shorthorn Cattlein North-West Benin. Cogent Food & Agriculture, 4 (1): 1–12. doi.10.1080/23311932.2018.1549767.
Weldegebrial G Aregawi, Philimon T., Werkisa C., Kidanie D., Birhanu M. and, and Workinesh S. 2018. Effect of ImprovedFeeding Management on Body Weight Gain and Carcass Characteristics of Afar Bulls for Export Market. InternationalJournal of Animal Science Research, 2 (5): 1–5.
TablesTable 1. Experimental design of the study
Age Breeds Total
Borane Arsi Harar HF-cross
2-3yrs 3 3 3 3 12
4-5yrs 3 3 3 3 12
Total 6 6 6 6 24
Table 2. Chemical composition of experimental feed ingredients
Feed type % of items on DM
DM Ash CP NDF ADF ADL
Maize grain 87.35 1.80 10.06 42.68 6.64 3.79
Nuge (gucia abysica) cake 90.46 8.48 45.74 42.91 27.94 10.07
Wheat brane 88.81 5.24 17.19 54.44 9.92 4.22
Total mixed ration 89.81 9.99 21.69 51.28 14.54 6.93
Grass hay 89.29 8.59 5.83 77.05 44.14 8.41
Wheat straw 94.49 5.94 3.14 80.64 45.32 6.14
Page 16/22
DM= dry matte, CP= Crude protein, NDF= neutral detergent �ber, ADF= acid detergent �ber, ADL= acid detergent lignin
Table 3. Visual method for evaluating body condition in cattle
Physical Attribute
BSC Spine Ribs Hooks/pins Tailhead Brisket Muscling
Thin 1 Visible Visible Visible No fat No fat None/atrophy
2 Visible Visible Visible No fat No fat None/atrophy
Borderline 3 Visible Visible Visible No fat No fat None
4 Slightlyvisibl
Foreribsvisible
Visible No fat No fat Full
Optimumcondition
5 Notvisible
Notvisible
Visible No fat No fat Full
6 Notvisible
Notvisible
Visible Some fat Some fat Full
Over conditioned 7 Notvisible
Notvisible
Slightlyvisible
Some fat Fat Full
8 Notvisible
Notvisible
Not visible Abundantfat
Abundantfat
Full
9 Notvisible
Notvisible
Not visible Extremelyfat
Extremelyfat
Full
BCS = body condition score
Table 4. Effect of breeds and age on body weight, average daily weight gain (kg) and feed conversion e�ciency.
Page 17/22
Category
N
Body weight
ADWG
FCEIBW FBW
Mean±SE Mean±SE Mean±SE Mean±SE
Breeds
Arsi 6 130.83±5.71 170.33±8.31 0.49±0.03 0.11±0.01
Borana 6 153.0±8.91 209.5±14.69 0.71±0.15 0.13±0.02
Cross 6 162.16±10.18 206.33±10.38 0.65±0.09 0.12±0.01
Harar 6 125.83±9.03 179.83±7.60 0.68±0.06 0.15±0.02
P-value Ns Ns Ns NS
Age
2-3years 12 126.83±6.02b 171±5.94b 0.57±0.05 0.13±0.01
4-5years 12 159.0±8.78a 211.5±10.73a 0.67±0.08 0.12±0.01
P-Value ** *** NS NS
Overall 24 141.45±5.83 191.5±7.31 0.63±0.05 0.12±0.01
Breed * Age NS NS NS
Means followed by different superscript letters within column are signi�cantly different, NS=P>0.05, ***=P<0.001,**=P<0.01; *=P<0.05, FCE= Feed conversion e�ciency, IBW= initial body weight, FBW= �nal body weight, ADWG=average daily weight gain, SE= standard error of mean, N= sample number, kg= kilo gram.
Table 5. Effect of breed and age on body condition scoring during the experimental feeding period
Page 18/22
Category
N
Body condition scoring
P-value
Changes Change BW/BCS (kg)
Initial BCS Final BCS BCS BW (kg)
Mean±SE Mean±SE Mean±SE Mean±SE Mean±SE
Breeds
Borana 6 3.79±0.19ab 6.58±0.41a 2.78±0.40a 56.5±12.71 20.3±1.51b
Arsi 6 4.34±0.31a 6.25±0.28a 1.91±0.34b 39.5±3.01 20.61±2.18ab
Harar 6 3.9±0.35ab 6.50±0.18a 2.57±0.31a 54±5.03 22.42±2.17ab
Crossbred 6 3.08±0.26b 4.66±0.42b 1.59±0.19b 44.33±5.70 27.78±1.73a
P-value * ** * Ns **
Age group
2-3years 12 3.77±0.18 5.87±0.25 2.10±0.21 44.66±4.11 21.93±1.44
4-5years 12 3.87±0.20 6.12±0.25 1.95±0.21 47.75±2.79 23.63±1.66
P-value NS NS NS NS Ns
Overall 3.79±0.15b 5.99±0.18a ** 2.05±0.20 48.08±3.78 22.78±1.09
Breed *Age * NS NS NS Ns
Mean values under the same category that bear different superscript letters are signi�cantly different, NS=P>0.05,***=P<0.001, **=P<0.01; *=P<0.05, N= sample number, BCS= body condition score, kg= kilo gram, SE= standard error ofmean.
Table 6. Pearson correlation coe�cient between body weight change and body condition score change
BCS change
Breeds
Arsi BW change 0.93**
Borana BW change 0.97***
HF-crossbred BW change 0.88*
Harar BW change 0.96**
Age
2-3years BW change 0.89***
4-5years BW change 0.70*
Overall BW change 0.80***
BW= body weight, BCS= body condition score, ***=P<0.001, **=P<0.01; *=P<0.05
Table 7. Relationship between live weight change and body condition change
Page 19/22
Category Models R2 MSE P-value
Breeds Arsi Y= 11.84X + 10.82 0.87 2.80 **
Borana Y= 16.5X + 4.37 0.95 2.68 ***
Harar Y= 16.18X + 6.47 0.93 3.42 **
HF-crossbred Y= 26.84X + 1.82 0.78 7.25 *
Age 2-3years Y= 14.06X + 9.19 0.79 6.70 ***
4-5years Y= 13.57X + 12.96 0.49 3.68 **
Overall Y= 15.97X + 10.02 0.56 12.54 ***
Where, Y = body weight change (kg), X= change in body condition score, R2= coe�cient of determination, MSE= mean
square error, ***=P<0.001, **=P<0.01; *=P<0.05.
Table 11. Correlation coe�cient between change in body weight and linear body measurements.
Age group
Change in linear bogy measurement
TLC NLC HLC HGC FCC RLC RWC SWC CDC
2-3 yrs BWC 0.94*** 0.72* 0.33ns 0.85*** 0.81** 0.16ns 0.97*** 0.46ns 0.88***
4-5 yrs BWC 0.80** 0.57* 0.29ns 0.68* 0.69* 0.11ns 0.95*** 0.69* 0.45ns
Overall BWC 0.89*** 0.64*** 0.29ns 0.75*** 0.73*** 0.16ns 0.96*** 0.56* 0.55**
BWC= Body weight change, yrs= years, TLC= Total topline change, NLC= Neck length change, HLC= Hip length change,HGC= Heart girth change, FCC= Flank circumference change, RLC= Rump length change, RWC= Rump width change,SWC= Shoulder width change, CDC= Chest depth change, Ns= not signi�cance *= (0.05) signi�cance, **= (0.001)signi�cance level.
Table 12. Regression equations predicting live weight change (Kg) from linear measurement change (cm)
Page 20/22
Age group Regression models R2 RMSE P-value
2-3yrs Y= 8.12TL + 1.99 0.91 4.17 <0.0001
Y= 16.94NL + 17.83 0.52 9.85 0.0047
Y= 4.83HG + 15.87 0.81 6.11 <0.0001
Y= 4.88FC + 6.19 0.79 7.12 <0.0001
Y= 21.03RW + 14.42 0.93 3.60 <0.0001
Y= 2.35CD + 12.33 0.90 4.49 <0.0001
4-5yrs Y= 9.60TL + 2.12 0.95 2.01 <0.0001
Y= 8.24NL + 35.55 0.33 8.29 0.0495
Y= 3.27HG + 26.46 0.68 5.41 0.0005
Y= 3.18FC + 21.31 0.77 4.61 0.0001
Y= 19.37RW + 15.45 0.91 2.79 <0.0001
Y= 3.20CD + 18.70 0.51 6.77 0.0054
Overall Y= 8.00TL + 6.20 0.82 4.97 <0.0001
Y= 12.01NL + 27.81 0.38 9.41 0.0007
Y= 4.13HG + 20.49 0.76 5.88 <0.0001
Y= 4.02FC + 13.48 0.77 5.69 <0.0001
Y= 20.16RW + 14.90 0.92 3.21 <0.0001
Y= 2.75CD + 20.31 0.71 6.43 <0.0001
RMSE= Root mean square error, R2 = coe�cient of determination, TL= Total topline, FC= Flank circumference, RW=Rump width, NL= Neck length, HG= Heart girth, CD= Chest depth, Kg= kilo gram
Table 13. Partial budget analysis of fattening different breeds of bulls fed similar total mixed ration
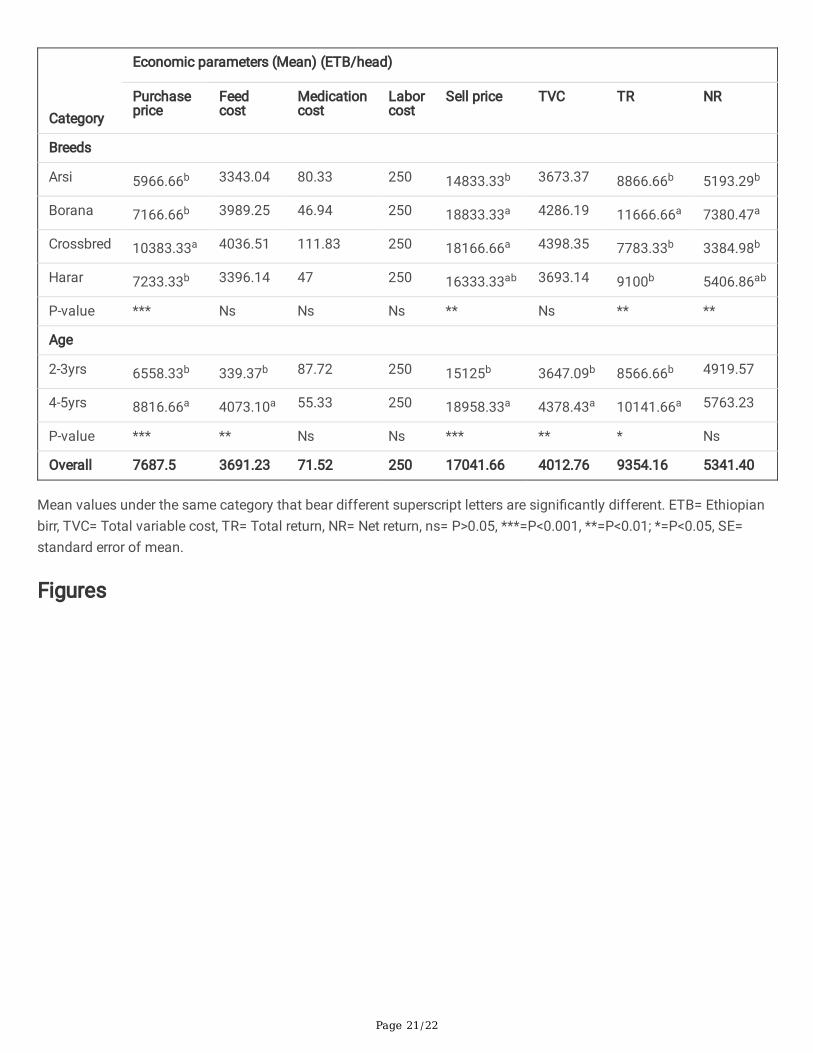
Page 21/22
Category
Economic parameters (Mean) (ETB/head)
Purchaseprice
Feedcost
Medicationcost
Laborcost
Sell price TVC TR NR
Breeds
Arsi 5966.66b 3343.04 80.33 250 14833.33b 3673.37 8866.66b 5193.29b
Borana 7166.66b 3989.25 46.94 250 18833.33a 4286.19 11666.66a 7380.47a
Crossbred 10383.33a 4036.51 111.83 250 18166.66a 4398.35 7783.33b 3384.98b
Harar 7233.33b 3396.14 47 250 16333.33ab 3693.14 9100b 5406.86ab
P-value *** Ns Ns Ns ** Ns ** **
Age
2-3yrs 6558.33b 339.37b 87.72 250 15125b 3647.09b 8566.66b 4919.57
4-5yrs 8816.66a 4073.10a 55.33 250 18958.33a 4378.43a 10141.66a 5763.23
P-value *** ** Ns Ns *** ** * Ns
Overall 7687.5 3691.23 71.52 250 17041.66 4012.76 9354.16 5341.40
Mean values under the same category that bear different superscript letters are signi�cantly different. ETB= Ethiopianbirr, TVC= Total variable cost, TR= Total return, NR= Net return, ns= P>0.05, ***=P<0.001, **=P<0.01; *=P<0.05, SE=standard error of mean.
Figures
Page 22/22
Figure 1
Breed by age interaction effect on initial body condition score