cross-cutting analysis - european...
TRANSCRIPT

Cross-Cutting Analysisversus Other Science, Technology and Innovation Indicators
of Scientific Publications
Research and Innovation
EUR 25968 EN

EUROPEAN COMMISSIONDirectorate-General for Research and InnovationDirectorate C — Research and InnovationUnit C.6 — Economic analysis and indicators
E-mail: [email protected] [email protected]
Contact: Carmen Marcus, Matthieu Delescluse and Pierre Vigier (Head of Unit)
European CommissionB-1049 Brussels

EUROPEAN COMMISSION
Directorate-General for Research and Innovation2013
Cross-Cutting Analysis of Scientific Publications
versus Other Science, Technologyand Innovation Indicators
Authors of the study
David Campbell, Julie Caruso, Éric ArchambaultScience Metrix, Canada
EUR 25968 EN

This report is part of the study Analysis and Regular Update of Bibliometric Indicators carried out by Science Metrix-Canada under the coordination and guidance of the European Commission, Directorate-General for Research and Innovation, Directorate Research and Innovation, Economic analysis and indicators Unit.
EUROPE DIRECT is a service to help you find answers to your questions about the European Union
Freephone number (*):
00 800 6 7 8 9 10 11
(*) Certain mobile telephone operators do not allow access to 00 800 numbers or these calls may be billed
LEGAL NOTICE
Neither the European Commission nor any person acting on behalf of the Commission is responsible for the use which might be made of the following information.
The views expressed in this publication, as well as the information included in it, do not necessarily reflect the opinion or position of the European Commission and in no way commit the institution.
More information on the European Union is available on the Internet (http://europa.eu).
Cataloguing data can be found at the end of this publication.
Luxembourg: Publications Office of the European Union, 2013
ISSN 1831-9424 ISBN 978-92-79-29836-3doi:10.2777/12700
© European Union, 2013
Reproduction is authorised provided the source is acknowledged.
Cover images: earth, © #2520287, 2011. Source: Shutterstock.com; bottom globe, © PaulPaladin #11389806, 2012. Source: Fotolia.com

Analytical Report 2.3.2 Final Report
i
Table of Contents Executive Summary ............................................................................................................................... ii Tables..................................................................................................................................................... v Figures ................................................................................................................................................... v Acronyms .............................................................................................................................................. vi 1 Introduction ................................................................................................................................. 1 2 Drivers of research output and inventory of key STI indicators for the cross-cutting
analysis with scientific output ..................................................................................................... 3 2.1 Identifying the key drivers of research output ................................................................................................. 3 2.2 Understanding patterns of scientific output and scientific productivity: key STI indicators of
research inputs ....................................................................................................................................................... 5 2.2.1 R&D investment and expenditure indicators ............................................................................... 5 2.2.2 Human resource indicators .............................................................................................................. 7 2.2.3 Innovation indicators ........................................................................................................................ 8 2.2.4 Knowledge flow indicators ............................................................................................................ 10 2.2.5 Research infrastructure indicators ................................................................................................ 12 2.2.6 Industrial specialisation .................................................................................................................. 13 2.2.7 Selection of key STI indicators for the cross-cutting analysis with scientific output .......... 13
3 Methods & Results .....................................................................................................................18 3.1 Publication output and productivity of countries and NUTS2 regions .................................................... 19
3.1.1 Factor analysis for identifying the main dimensions (i.e., factors) among selected STI indicators and the publication output of countries ........................................................... 20
3.1.2 Regression analysis for investigating the productivity of countries in terms of publication output per unit of the most relevant R&D input indicators .............................. 24
3.1.3 Regression analysis for investigating the productivity of NUTS2 regions in terms of publication output per unit of the most relevant R&D input indicators .............................. 34
3.2 Publication patterns of countries across scientific fields ............................................................................. 35 4 Key findings of the cross-cutting analysis of scientific output vs. other STI indicators ........... 40
4.1 Publication output and productivity of countries and NUTS2 regions .................................................... 40 4.1.1 Factor analysis for identifying the main dimensions (i.e., factors) among selected
STI indicators and the publication output of countries ........................................................... 40 4.1.2 Regression analysis for investigating the productivity of countries in terms of
publication output per unit of the most relevant R&D input indicators .............................. 41 4.1.3 Regression analysis for investigating the productivity of NUTS2 regions in terms of
publication output per unit of the most relevant R&D input indicators .............................. 43 4.2 Publication patterns of countries across scientific fields ............................................................................. 44
5 Discussion ................................................................................................................................. 46 5.1 Publication output and productivity of countries and NUTS2 regions .................................................... 46
5.1.1 Factor analysis for identifying the main dimensions (i.e., factors) among selected STI indicators and the publication output of countries ........................................................... 46
5.1.2 Regression analysis for investigating the productivity of countries and NUTS2 regions in terms of publication output per unit of the most relevant R&D input indicators ........................................................................................................................................... 48
5.2 Publication patterns of countries across scientific fields ............................................................................. 51 Acknowledgments ................................................................................................................................ 53 References ............................................................................................................................................ 54

Analytical Report 2.3.2 Final Report
ii
Executive Summary
Background
Science-Metrix has been selected as the provider of bibliometric indicators for the European Commission’s Directorate-General for Research & Innovation (DG Research), beginning September 2010 and extending through September 2013. This work involves the collection, analysis and updating of bibliometric data that will be integrated into the European Commission’s evidence-based monitoring of progress towards the objectives set forth in the Lisbon framework and the post Lisbon Strategy for the European Research Area (ERA). The bibliometric component of this monitoring system is part of a package of six complementary studies reporting on the dynamics of research activities along the continuum of knowledge, from R&D investments to publications, patents and licensing.
The analyses provided by Science-Metrix to the European Commission focus on the scientific performance—including impact and collaboration patterns—of countries, regions and research performers (such as universities, public research institutes and companies). The statistics produced by Science-Metrix are based on a series of indicators designed to take into account national and sector specificities, as well as allow for a comprehensive analysis of the evolution, interconnectivity, performance and impact of national research and innovation systems in Europe. They also provide an overall view on Europe’s strengths and weaknesses in knowledge production across fields and subfields of science. In measuring progress towards past and current objectives, this information aims to support the coherent development of research policies for the ERA.
The present report
Investigations of the existing relationships between research and development (R&D) inputs and outputs such as publications and patents from an econometric perspective have increased in the past decades in response to the challenges faced by Governments. In particular, as they are operating on increasingly tight budgets, Governments are looking to maximise returns on investments; furthermore, accountability for public spending has become a primary issue for residents who expect to get the most value for their tax dollars. Most studies of economies and diseconomies of scale in scientific production have been performed with a view to providing evidence-based policy advice that will improve the allocation and management of resources in the research sector and, ultimately, enhance efficiency (i.e., productivity).
This study adds to the growing knowledge base on the factors driving the scientific productivity (i.e., the efficiency with which entities are converting research inputs into research outputs) at the national and regional levels by reporting on the results of an analysis performed using the most comprehensive dataset on science, technology and innovation (STI) indicators that is currently available for ERA countries and Nomenclature of Territorial Units for Statistics Level 2 (NUTS2) regions. This study’s main objectives were to investigate:
1. the factors behind the publication outputs and productivity of countries/regions, as revealed through an analysis of scientific production; and
2. the factors behind the production patterns of countries, as revealed through an analysis of scientific concentration (by research area), across fields of science.
In total, 17 R&D input indicators distributed across four categories (i.e., R&D Investment and Expenditure, Human Resources, Innovation and Research Infrastructures) were considered. The bibliometric indicator that was used to improve the understanding of differences between countries’ and NUTS2 regions’ scientific output, productivity and concentration was the total

Analytical Report 2.3.2 Final Report
iii
number of publications, as measured using Scopus. The dataset included 42 countries (i.e., ERA countries plus a few comparables) and 291 NUTS2 regions for which data were available. The period covered by the dataset extended from 2000 to 2009. For a summary of key findings, please refer to Section 4. For a comprehensive discussion of findings, please refer to Section 5. A brief overview of the main findings is presented below.
Report highlights: Scientific production and productivity of countries and NUTS2 regions
Factor analysis was used to identify the main dimensions explaining patterns of variation among selected STI indicators and the publication output of countries, whereas regression analysis was used for investigating the productivity of countries and NUTS2 regions in terms of outputs (i.e., publications) per unit of the most relevant STI indicators (i.e., R&D input indicators). Regression analysis was also used to investigate whether the innovation capability of countries (i.e., the capacity to produce inventions from a given amount of research) changes as the size of their scientific production increases.
Based on Exploratory Factor Analysis (EFA), the most relevant STI indicators as well as the selected R&D output indicator (i.e., the number of publications) could be adequately summarised using a single factor; these indicators are highly collinear.
Although there is redundant information within the relevant set of indicators (i.e., strong multicollinearity in the dataset), slight differences exist in the way countries allocate R&D spending across sectors (e.g., higher education, government, private) and resources (e.g., human resources, infrastructure). It therefore remains pertinent to investigate how the publication output of countries scale relative to individual R&D input indicator.
Economies of scale were observed with the following R&D input indicator: employment in technology and knowledge-intensive services, which includes the education sector and all occupations (at the country level) and the number of researchers in the higher education sector (likely at the country level and confirmed at the NUTS2 level).
Potential mechanisms for explaining the increased productivity of human capital (i.e., employment in technology and knowledge-intensive services and researchers in the higher education sector) as a country’s or NUTS2 region’s pool of human resources increases include the diversification and sharing of complementary expertise and competencies, as well as an increase in specialisation and division of labour. Other studies have shown similar reuslts at various aggregation levels.
Diminishing returns were observed at the country and NUTS2 levels with the following R&D input indicators: Business Enterprise Expenditure on R&D (BERD), Government Intramural Expenditure on R&D (GOVERD) and Higher Education Expenditure on R&D (HERD) (likely at the country level and confirmed at the NUTS2 level).
A potential mechanism for explaining the observed reduction in the productivity of countries and NUTS2 regions in terms of publications produced per euro investment in R&D is that the number of researchers of a given entity (i.e., its units of production) does not increase as rapidly as its financial resources. Interestingly, it was shown that the population of researchers in the higher education sector scales less rapidly than the Gross Expenditures on R&D (GERD) and HERD. A rationale for awarding smaller grants to a larger population of researchers logically follows from this explanation in order to increase the productivity of a given entity as the size of its financial resources increases. However, as explained in the discussion, low productivity (in terms of publications) that is concurrent to increasing R&D expenditures might be offset by an increase in the number of citations per euro investment in R&D. The policy

Analytical Report 2.3.2 Final Report
iv
implications of findings on economies and diseconomies of scale are examined in the discussion.
Luxembourg is one of the least productive countries when all sources of R&D expenditure are considered (i.e., GERD, which covers HERD, BERD and GOVERD).
On the other hand, Luxembourg is among the countries that showed the strongest performance in terms of productivity when HERD alone was considered. Thus, its lower productivity in terms of its number of publications produced per currency unit (i.e., euro) of GERD is not attributable to a higher education sector that is a less efficient at converting R&D inputs into R&D outputs.
The weaker productivity of Luxembourg is most likely due to the stronger than usual contribution of the business sector to GERD, as the sector is less oriented towards publishing the results of scientific research.
Recent actions taken by the Luxembourg government appear to have been effective in increasing its population of researchers, its HERD and its scientific production relative to its GERD. Luxembourg has begun to close the gap with other ERA countries in terms of publication output.
The innovation capability (i.e., the capacity to produce inventions from a given amount of research) of countries appears to remains stable as the size of their science base increases.
Report highlights: Publication patterns of countries across scientific fields
To investigate the variations in the publication patterns of countries across scientific fields, the relationship between scientific concentration by research area (i.e., percentage of output by field) and the concentration of the relevant R&D input indicators by research area (e.g., percentage of HERD by field) were determined using regression analysis. This analysis could only be performed for HERD, the number of researchers in the higher education sector and GOVERD.
The statistics indicated that the concentration patterns of the selected R&D input variables by field of science did not adequately explain the observed patterns of concentration in output in most fields (i.e., in the number of scientific publications).
These results are astonishing, as the number of researchers in the higher education sector and HERD (in their raw form, not expressed as percentages) explained much of the variation seen in the number of peer-reviewed publications of countries (in its raw form), both when all fields were combined as well as within each of the fields.
Factors that could contribute to explaining the patterns of variation in the concentration of R&D outputs by scientific field include differences in the publication habits of researchers across fields and/or countries, as well as noise in the data on R&D inputs and outputs at this aggregation level.

Analytical Report 2.3.2 Final Report
v
Tables Table I STI Indicators—Inventory of Available Data ............................................................................................... 14 Table II Factor loadings of selected STI indicators on the 1st factor of the exploratory factor analysis
using PCA factoring ........................................................................................................................................... 23 Table III Factor loadings of selected STI indicators on the 1st factor of the exploratory factor analysis,
based on PCA and IPA factoring .................................................................................................................... 24 Table IV Scale-adjusted performance score of countries in terms of productivity (i.e., published output
per unit of an R&D input indicator) for three R&D input indicators, 2000−2009 ................................ 30 Table V Robust group mean regressions between the concentration in the number of publications
(FRAC) of countries and the corresponding concentration in their number of researchers in the higher education sector by field of science, 2000−2009 .............................................................................. 37
Table VI Robust group mean regressions between the concentration in the number of publications (FRAC) of countries and the corresponding concentration in their HERD by field of science, 2000−2009 ............................................................................................................................................................ 38
Table VII Robust group mean regressions between the concentration in the number of publications (FRAC) of countries and the corresponding concentration in their GOVERD by field of science, 2000−2009 ............................................................................................................................................. 39
Figures Figure 1 Frequency distribution of selected STI indicators and matrix of the relationships between all
pairs of indicators, 2000−2009.......................................................................................................................... 21 Figure 2 Scree plot of the exploratory factor analysis of selected STI indicators using PCA factoring .............. 22 Figure 3 Robust group mean regressions between the scientific output (number of publications [FRAC])
of countries and selected R&D input indicators, 2000−2009 ..................................................................... 27 Figure 4 Robust regression between the scientific output (number of publications [FRAC]) and GERD
of countries (A) and trend in the publication output of Luxembourg (B), 2000−2009 ......................... 31 Figure 5 Robust regression between the HERD and GERD of countries (A) and trend in the HERD of
Luxembourg (B), 2000−2009 ............................................................................................................................ 32 Figure 6 Robust regression between the number of researchers in the higher education sector and the
GERD of countries (A) and trend in the number of researchers of Luxembourg (B), 2000−2009 .... 32 Figure 7 Robust group mean regressions between the technological output (number of high-tech patent
applications to the EPO) and the scientific output (number of publications [FRAC]) of countries, 2000−2009 ......................................................................................................................................... 34
Figure 8 Robust group mean regressions between the scientific output (number of publications [FRAC]) of NUTS2 regions and selected R&D input indicators, 2000−2009 ......................................................... 35

Analytical Report 2.3.2 Final Report
vi
Acronyms
ARC Average of Relative Citations
ARIF Average of Relative Impact Factors
BERD
CI
Business Enterprise Expenditure on R&D
Collaboration Index
DG Research Research Directorate-General
EFTA European Free Trade Association
ERA European Research Area
EU European Union
EU-27 The 27 member countries of the European Union
FP7 Seventh Framework Programme of the European Community for Research, Technological Development (2007 to 2013)
FRC Fractional Counting
FUC Full Counting
GERD Gross Expenditures on R&D
GI Growth Index
GIS Geographic Information System
GOVERD
HERD
IF
Government Intramural Expenditure on R&D
Higher Education Expenditure on R&D
Impact Factor
NACE Nomenclature generale des activites economiques dans les communautes europeennes (Industrial Sector Classification)
NSE Natural Sciences and Engineering
NSF United States National Science Foundation
NUTS2 Eurostat Nomenclature of Territorial Units for Statistics (Level 2)
PAI Probabilistic Affinity Index
R&D Research and Development
RC Relative Citations
RIF
RFP
Relative Impact Factor
Request for Proposal
RPO Non-university Research Performing Organisation
RTD Research and Technological Development
S&T Science and Technology
SI Specialisation Index
SME
SSH
Small and Medium Enterprise
Social Sciences and Humanities
STC Science, Technology and Competitiveness
STI Science, Technology and Innovation

Analytical Report 2.3.2 Final Report
1
1 INTRODUCTION
The last two decades have seen a steady rise in the development of STI indicators. Their use is intended not only to better manage and govern the complex European system but to measure progress towards the achievement of an increasingly wide variety of social and economic objectives. A greater number and variety of actors are now involved in indicator development, contributing new guidelines, new data sources and new areas of inquiry. A major focus of these efforts has been to find appropriate, quantitative statistical tools that are comparable across systems (i.e., countries, regions, sectors, organisations and industries) and that can strike the best balance between internationally comparable and nationally relevant indicators (Edler & Flanagan, 2011; Lugones & Suarez, 2010). In order to create robust and meaningful measures, ‘positioning’ indicators must also account for the distinct contextual factors that underlie each system, which may be at least as important as formal inputs and outputs to their ultimate performance (Edler & Flanagan, 2011; Lepori, Barré, & Filliatreau, 2008). In the face of often considerable underlying conceptual and methodological difficulties, newer indicators must both consider and attempt to confirm the specific drivers of research output and performance of countries and regions.
This report contributes to this growing body of literature by performing a cross-cutting assessment of performance centering on the European Research Area (ERA) in addition to a number of selected countries. The study uses bibliometric statistics computed by Science-Metrix as part of a project conducted for the European Commission (EC). These data on scientific output are used to examine performance in light of input indicators such as R&D investments. Specifically, this report investigates:
1. the factors behind publication outputs and productivity (i.e., the efficiency with which entities are converting research inputs into research outputs) of countries/regions, as revealed through an analysis of scientific production; and
2. the factors behind the production patterns of countries, as revealed through an analysis of scientific concentration (by research area), across thematic domains (e.g., FP7 thematic priority areas; this analysis could not be performed at the regional level due to the unavailability of data by research area at the NUTS2 regional level, see Section 2.2.7).
To perform the cross-cutting analysis of scientific output versus other STI indicators, Science-Metrix analysts identified the types and quantity of data that could potentially be analysed in relation to publication output, overall and by FP7 thematic priority, and then gathered these data for 42 countries and 291 NUTS2 regions. Section 2 of this report identifies the drivers of scientific production in the existing literature. In addition, it provides a selection of available STI indicators that were incorporated, subject to data availability, in the cross-cutting analysis to facilitate the understanding of differences between countries/regions’ publication patterns and scientific productivity (Section 2.2.7).
The bibliometric indicators that were used to improve the understanding of differences between countries’ scientific output, productivity and production patterns are based on the data produced in WP1 as part of datasets (1)-(8) and include the number of publications and the proportion of publications by scientific field. These indicators were cross-linked with a selected set of other STI indicators falling under six broad indicator categories:
R&D investment and expenditure (e.g., GERD); human resources (e.g., number of researchers); innovation (e.g., patenting activity); knowledge flows (e.g., cross-sectorial and/or regional partnerships);

Analytical Report 2.3.2 Final Report
2
research infrastructures (e.g., number of research infrastructures by domain); and industrial specialisation.
Factor analysis was used to identify the main dimensions explaining patterns of variation among selected STI indicators and the publication output (i.e., production or productivity) of countries and/or NUTS2 regions, whereas regression analysis was used for investigating the potential relationship of the most relevant STI indicators with the scientific output, productivity and concentration (by research area) of countries and/or NUTS2 regions. Regression analysis was also used to investigate whether the innovation capability of countries (i.e., the capacity to produce inventions from a given amount of research) varies as the size of their science base increases. Section 3 provides a detailed description of the methods and results, whereas Section 4 presents an overview of the key findings of these analyses. Section 5 provides a discussion of the results in light of other studies’ findings and in connection with qualitative knowledge of the science system.

Analytical Report 2.3.2 Final Report
3
2 DRIVERS OF RESEARCH OUTPUT AND INVENTORY OF KEY STI INDICATORS FOR THE CROSS-CUTTING ANALYSIS WITH SCIENTIFIC OUTPUT
The review presented here pursues two mains goals: 1) to report on drivers of scientific production of countries and regions (Section 2.2.1 to 2.2.6) and 2) to produce an inventory of available data and propose a selection of key STI indicators for the cross-cutting analysis to facilitate the understanding of differences between countries’ and regions’ scientific production, scientific productivity and publication patterns (Section 2.2.7).
2.1 IDENTIFYING THE KEY DRIVERS OF RESEARCH OUTPUT
Europe’s increasingly complex S&T system, characterised by its “multiplicity of interconnected spatial levels of organisation and governance arrangements” (Lepori, Barré, & Filliatreau, 2008), has led to significant levels of fragmentation and duplication in European research efforts and activities. This fragmentation—a larger problem for public than for private research—limits resource flows across borders and hinders the formation of competitive, world-class centres of knowledge (Foray, 2009; European Commission, 2008). This problem was central to the development of the Lisbon Strategy, originally laid out in March 2000, as well as the vision to achieve a common European Research Area (ERA), as discussed in the 2007 ERA Green Paper (European Commission, 2007). The “fragmented European market for innovation” and “fragmentation of European research” were again identified as challenges to be addressed in the creation of more favourable Framework conditions as part of the Innovation Union Flagship Initiative (European Commission, 2011).
The research literature has focused on the issue of thematic and/or regional directionality—often referred to as ‘specialisation’—as an operative mechanism and key driver of productivity and one that some believe holds multiple benefits for Europe’s many ‘unexploited scale economies’ (e.g., Hallet, 2000; Klitkou & Kaloudis, 2007; Laurens & Asikainen, 2010; Laursen & Salter, 2005; Peter & Bruno, 2010; Soete, 2006; Wong & Singh, 2004). Within the European Union (EU), specialisation is part of an important and ongoing debate on objectives relating to knowledge-driven growth, cohesion policy, competitiveness and sustainable development (Europe INNOVA/PRO INNO Europe, 2008; Grupp et al., 2010). A key goal of the 2020 Vision for the ERA is to facilitate ERA-wide open competition that will gradually promote “the necessary specialisation and concentration of resources into units of excellence” (European Commission Expert Group, 2009). The Innovation Union Competitiveness Report 2011 (European Commission, 2011) discussed the concept of ‘smart specialisation’, defining it as a “dynamic process of finding the right areas to focus on,” a process that is “based on evidence and strategic intelligence about a region's assets.”
This somewhat rosy view of specialisation as a solution to fragmentation and duplication has been challenged, with some proposing that it is likely to increase systemic disparities and calling for R&D policies that maximise diversity and dispersion—rather than concentration—of resources (Jacob, 1969; Kyriakou, 2009; Pontikakis, Chorafakis, & Kyriako, 2011). To get a better handle on the question, investigators (e.g., Cooke, 2009; Smith, 2009) are attempting to identify the implications of specialisation for different research systems at various levels of aggregation or to determine whether differences in R&D strategies, organisations and outcomes reflect the presence of redundancy or ‘healthy diversity’ within the system. Results of other studies (e.g.,
Analytical Report 2.3.2 Final Report
4
Varga, Pontikakis, & Chorafakis, 2010), suggest that both may be equally necessary, as they operate at distinct parts of the knowledge production process and are important determinants of productivity for different types of R&D.
Nevertheless, policy makers are more keen than ever to analyse scientific (based on publications) and technological (based on patents) specialisation profiles, as well as the more novel measure of R&D specialisation, defined as the “relative concentration of activity in a specific thematic area, be it scientific, technological or even industrial, within a given ‘division of labour’ in knowledge production” (Pontikakis, Chorafakis and Kyriakou, 2009). Using this information, policymakers can better analyse the concentration of outputs by sector and assess the relationship between private and public inputs to policy goals (Laurens & Asikainen, 2010). Cross-specialisation analyses, such as those by Laursen and Salter (2005), the ERAWATCH Network (2006), Klitkou and Kaloudis (2007) and Peter and Bruno (2010) have explored the relationship between the different types of specialisation, combining indices based on publication and patent output indicators with those based on national, industrial input data that are drawn from numerous databases. These studies are contributing to a better understanding of the relationship between science and economic spheres of production and how scientific and technological specialisation patterns tend to co-evolve with broader R&D structures, such as investment patterns.
Studies of regional or other sub-national agglomeration efforts are also being performed, such as those by the European Cluster Observatory and the European Cluster Alliance (2009). Clusters—defined as a “group of firms, related economic actors and institutions that are located near each other and have reached a sufficient scale to develop specialised expertise, services, resources, suppliers and skills” (Europe INNOVA/PRO INNO Europe, 2008)—exist within regions and depend upon specialisation and cooperation between actors. These studies have generally found a positive relationship between cluster strength and regional innovation strength and competitiveness, and have also revealed that regions that perform better tend to be more specialised and have more fertile business environments (Europe INNOVA/PRO INNO Europe, 2008). Similar studies at the regional and cluster level have been scarce because of the lack of available statistical data at these levels of aggregation (European Cluster Alliance, 2009; Hallet, 2000; Lugones & Suarez, 2010).
However, specialisation is only one of a great number of areas of interest in the debate on drivers of research productivity. As a whole, at both the national and regional levels, investment in R&D and factors related to human capital (such as workforce quality and education and training) have been considered elemental to the overall S&T performance of countries and regions. These two classical STI input indicators—R&D expenditures and the S&T labour force—continue to have obvious importance in how successfully regions and countries ultimately perform and compete. Studies continue to propose countless additional facilitators of research capacity development, sustainable growth and competitiveness in R&D—from broad ‘social needs’ and related public policy to specific configurations of inputs—and may suggest related indicators and interventions (e.g., Cooke, Booth, Nancarrow, & Wilkinson, 2006). As different investigations use different, often highly heterogeneous sources, they obtain different results. Some (e.g., Benavente, Crespi, & Maffioli, 2007; Soete, 2006; etc.) call into question even the capacity of the two presumed engines of growth—R&D expenditures and investments in human capital—to deliver the promised results.
The majority of these studies also engage in ex-post evaluation methods that focus on the ratios of outputs to inputs, results achieved and impacts and can therefore only make tenuous

Analytical Report 2.3.2 Final Report
5
assertions about the drivers of efficiency within research units (Jiménez-Sáez, Zabala, & Zofío, 2010). This is due in no small part to the immense complexity of making direct correlations and the frequently noted methodological difficulties involved in determining causality, such as time lags, static versus dynamic phenomena, the lack of data comparability and availability and the potential for diminishing returns to funding inputs (Crespi & Guena, 2004; Freeman & Soete, 2007; Ho, 2004; Statistics Canada, 2006; Laurens & Asikainen, 2010). A coherent account has yet to be made of the exact mechanisms and structural conditions that lead to regional and national strengths and increasing levels of scientific output in particular domains of knowledge.
Researchers have called for novel indicators based on disaggregated data and “different, imaginative, classifications of R&D data” (Kyriakou, 2009) to answer these and other fundamental questions. In recent years, indicator development has increasingly focused on categories of indicators that stress areas such as innovation and value added, and new indicators are emerging that intend to capture processes of knowledge creation and diffusion, as well as the so-called ‘intangible capital’ that examine factors such as organisational innovation and technical progress (Eurostat, 2009; Organisation for Economic Co-operation and Development (OECD), 2007; Jona-Lasinio, Iommi, & Manzocchi, 2011). The following section examines the selection of indicator categories—both classical STI indicators and newer ‘positioning’ indicators—that may be most likely to contribute to a greater understanding of determinants and patterns of national and regional specialisation.
2.2 UNDERSTANDING PATTERNS OF SCIENTIFIC OUTPUT AND SCIENTIFIC PRODUCTIVITY: KEY STI INDICATORS OF RESEARCH INPUTS
Although traditional indicators of research activity (e.g., those based on publications and patents) have many advantages and are “currently the most established proxies for measuring scientific and technological outputs” (European Commission, 2008), they do not reveal what policy makers are most interested in knowing—how inputs and throughputs lead to a more effective output and, more specifically, whether there is any correlation between investment and output in a given scientific field or technology (Peter & Bruno, 2010). Their joint use with input indicators in the following categories could better capture the agents and determinants of scientific specialisation and competitive advantage.
2.2.1 R&D investment and expenditure indicators
As noted, expenditure data on basic, applied or experimental research comprise a fundamental input indicator used to characterise the S&T system in Europe. Research investment levels and activity vary considerably between nations, with some of the most striking differences visible among the G7 economies (Royal Society, 2011). Within the EU, increasing R&D investment was a crucial part of the achievement of an ERA. In 2002, the goal was established to spend 3% of GDP on R&D by 2010, but spending has since remained stable at around 1.85% (Eurostat ERA News, 2009). In 2010, the EU decided to maintain the 3% objective for 2020 (European Commission, 2011).
The four broad sources of R&D funding (i.e., the business sector, government, private non-profit, and overseas funding) support activity that is carried out across four sectors of performance (i.e., the business sector, government, the higher education sector, and private non-profit foundations) (Cooke, 2009). The standard indicator of R&D intensity and a basic structural indicator for the ERA is Gross Domestic Expenditure in R&D (GERD), expressed as a percentage of GDP, which covers all R&D by all four sources and in all four sectors. Government, business enterprise and

Analytical Report 2.3.2 Final Report
6
foreign funding sources account for over 95% of expenditure in most Member States (European Commission, 2008; OECD, 2010).
Public expenditures—Government intramural Expenditure on R&D (GOVERD) and Higher Education Expenditure on R&D (HERD) as a share of GDP—can be divided by socioeconomic objective, field of science and type of receiving institution. Data on budget provisions may be used to measure planned government investment in R&D, but not actual spending (as in expenditure data). The Government Budget Appropriations or Outlays on R&D (GBAORD) indicator, expressed as a percentage of GDP, covers R&D in all sectors of performance carried out either domestically or abroad. Appropriations are first distinguished between defence and civil programmes and then between the main objectives of civil R&D (called NABS categories), broken down by EU-27 socio-economic objectives (Eurostat, 2009; OECD, 2010). Although different, GBAORD and GERD are often used in a complementary manner (OECD, 2007). GBAORD data are taken from documents on initial budget provisions, forecasts, proposals and appropriations and are timelier than GERD, but sources of data are less harmonised (Eurostat, 2009).
Around the world, the business sector is the primary R&D performer, and in research-intensive countries, over two-thirds of total R&D investment comes from the private sector (European Commission, 2008; Peter & Bruno, 2010). An indicator of private involvement in R&D is the percentage of Business Expenditure (or Business Enterprise Expenditure) in R&D (BERD) as a share of GERD. BERD can be broken down by sector of activity based on Nomenclature of Economic Activities (NACE) categories, the European statistical classification of economic sectors. The EU Industrial R&D Investment Scoreboard provides information on the top 1,000 EU and 1,000 non-EU companies in terms of investment in R&D, classifying companies’ economic activities according to the ICB (Industrial Classification Benchmark) classification.1
Since 2000, an increasing share of domestic R&D in EU Member States has been funded from foreign sources, which include private business, public institutions and international institutions. Data on venture capital investment (or the private equity raised for investment in companies, particularly early stage) or foreign ownership are also used. Companies often make the decision to extend their research capacities and invest in R&D activities in particular geographical areas that offer attractive framework conditions for private R&D (including a transparent business environment, sound and enforceable rules for competition and the availability of a large pool of skilled human resources). Foreign direct investment data can point to these ‘hot spots’ of knowledge accumulation. However, it is not possible to break down sources within the ‘abroad’ category into public and private, nor is it possible to separate intra-EU cross-border flows from funds from sources outside of the EU (European Commission, 2008).
How R&D expenditure and investment indicators can contribute to an understanding of specialisation: Indicators that determine R&D intensities and their growth rates provide one of the best indications of how the various players in countries and regions are targeting their investments towards specific scientific areas. This understanding is possible because R&D expenditure data for all performance sectors can be disaggregated into sufficiently fine levels of detail, such as socio-economic objective, field of research and type of research (i.e., pure basic research, strategic basic research, applied research or experimental development) (Cooke, 2009).
1 http://iri.jrc.ec.europa.eu/research/scoreboard_2010.htm

Analytical Report 2.3.2 Final Report
7
For example, a study by Laurens and Asikainen (2010) used national priorities and GERD by domain/socio-economic objective as an indicator of specialisation. Studies by Peter and Bruno (2010) and Klitkou and Kaloudis (2007) aimed to determine countries’ relative specialisations of GBAORD (which indicates the thematic domains and horizontal activities that are being prioritised by public authorities) and BERD (which shows patterns of R&D investments by the private sector) by comparing national allocations to world shares and country totals to world totals. However, as there are only 13 broad socio-economic objectives, direct links to scientific fields, technologies or industries cannot be made. Few studies have explored the disaggregated data across Member States to determine whether there is any “real specialisation (or conversely duplication) of R&D efforts across the EU” (Cooke, 2009).
2.2.2 Human resource indicators
Human resources (HR) are considered another key element of knowledge creation and dissemination and comprise a basic area of STI indicator development. According to Eurostat (2009), the different levels of innovation performance among countries can be chiefly explained by factors related to knowledge workers. The OECD (2007) considers highly qualified people to be “stores of knowledge” and “vectors of knowledge flow.” More specifically, skilled labourers interact with relevant actors; create knowledge, inventions or patents; and shape the innovativeness and technological capability of regions and nations (Ho, 2004). This category of indicator measures, within a given region or country, the presence of HR directly involved in R&D activities (employed in R&D or providing services). It can be used to determine whether the pool of HR is growing and to identify the sectors in which changes are occurring. Employment rates comprise the most common indicator used in this category, but indicators go beyond employment to labour force education, training and mobility.
Data on employment are readily available—in fact, Europe INNOVA/PRO INNO Europe (2008) noted that employment is “the only indicator that is available in Europe across all regions and industries.” According to definitions in the Canberra and Frascati Manuals, the three broad statistical HR categories are:
HR in S&T (HRST), or individuals who either have higher education or persons who are employed in positions that normally require such education;
R&D personnel, or all persons employed directly in R&D, as well as those providing direct services such as R&D managers, administrators, and clerical staff; and
Researchers, who are professionals engaged in the conception or creation of new knowledge, products, processes, methods and systems and also in the management of the projects concerned.
Both HRST and R&D personnel indicators focus on the stock of qualified personnel; however, the population of R&D personnel is much smaller than that of HRST and excludes everyone not currently employed in R&D activities. The category of researchers is the narrowest of the three and, in general, it is the population of greatest interest, particularly in terms of their stocks, their mobility and their career trajectories (OECD, 2007). Eurostat (2009) examines researchers by institutional sector, by economic activity and by field of science. Employed personnel may be further broken down by Full Time Equivalent (FTE) or Head Count; countries and institutions may use either method, and the OECD uses both.
Data on education inflows can also be used. The development of human capital in the form of better education and skills is a determinant of economic growth in a knowledge-based economy and is a major concern for the EU. In particular, graduates from tertiary education and doctoral
Analytical Report 2.3.2 Final Report
8
graduates are commonly used as a measure of the current and future supply of HRST (European Commission, 2008; Eurostat, 2009). HRST data are often used as a proxy for the current HRST pool and graduate data as a proxy for the prospective pool. Graduates are generally defined by the levels of education classified in UNESCO’s International Standard Classification of Education (ISCED).
Researcher mobility, a newer indicator, is based on the assumption that because qualified labour is generally marked by a higher mobility, they will move faster to exploit countries’ and regions’ incentives and higher wages (Stirböck, 2002). In 2000, the European Commission established the central ERA objective of increasing the number of mobile researchers in Europe, and this goal was reconfirmed in the 2007 Green Paper (European Commission, 2007) and again in the Innovation Union Competitiveness Report (European Commission, 2011). However, inter-country and even intra-country mobility within the EU remain low (European Union, 2011). Current statistics on the mobility of HRST, available through Eurostat, provide information by country on non-national researchers and on the balance of outgoing and incoming researchers, but precise data are lacking at the geographical and sectoral levels (European Commission, 2008). Doctorate holders are a particular concern in mobility, according to the OECD (2007). While data are partially available for doctoral candidates, doctorate holders and mobility funded by select European instruments (European Commission, 2008), there is as yet no coherent framework for collecting data on doctorate holders (Gault, 2011).
How HR indicators can contribute to an understanding of specialisation: Specialisation in S&T is completely dependent on the researchers and engineers that are available to undertake specialised research activities (Peter & Bruno, 2009). In its Science, Technology and Competitiveness Key Figures report, the European Commission (2008) considers information on researcher mobility to be a very rough proxy for the level of openness and attractiveness of national research institutions. HR trends are an important dimension of structural change, and these indicators can be used to determine changing patterns of specialisation across Member States (European Commission, 2009). Few studies have empirically investigated the relationship between mobility and specialisation; however, it has been determined that the countries with the highest research capacities encourage both inward and outward mobility, while those with weaker capacities—often those that exhibit specialisation on specific thematic areas—have the most severe mobility problems (namely low mobility and high net outward flows) (Fernández-Zubieta & Guy, 2010).
2.2.3 Innovation indicators
Innovation is a large and complex subject, but given its close ties to productivity, growth, competitiveness, even “social well-being,” broaching the topic is crucial in any discussion of S&T performance. Although innovation and R&D are often considered separately, both in concept and policy approach, the two are considered “intricately and systemically linked processes in the framework of a larger, knowledge-driven socioeconomic system” (Eurostat, 2009). The concept of innovation has become perhaps even more popular than that of R&D (see, for example, the “blue sky of innovation”2) (Freeman & Soete, 2007). In response to the ‘innovation gap’ and ‘competitiveness challenge’ in Europe, a host of European instruments supporting innovation were
2 http://www.oecd.org/document/29/0,3746,fr_2649_34451_37075032_1_1_1_1,00.html

Analytical Report 2.3.2 Final Report
9
introduced under the Competitiveness and Innovation Framework Programme, the Seventh Research Framework Programme and related Structural Funds and the Innovation Union Flagship Initiative (Reid, Denekamp, & Galvao, 2008). Innovation will play a large role in the upcoming Eighth Framework Programme (‘Horizon 2020’).
Measuring the activity of innovation presents challenges. Most essentially, not all R&D leads to innovation and not all innovation stems from R&D (Gault, 2011; Laursen & Salter, 2005). Furthermore, the locus of innovation could take place anywhere throughout the economy—well upstream or downstream from the firm or sector that carried out the research—and the generation of innovation relies on a variety of inputs beyond technological activity (Freeman & Soete, 2007; OECD, 2007). Nevertheless, the measurement of innovative activity rests heavily on traditional technology-based output indicators, such as R&D and patent activity. As a result, indicators of the activity of innovation are not as well developed as those for R&D (Gault, 2011).
According to Eurostat (2009), innovation generally belongs to two input indicator categories—innovation drivers and knowledge creation—as well as three output indicators—innovation & entrepreneurship, applications and intellectual property. The OECD’s Oslo Manual covers indicators of innovation and provides guidelines on the measurement of innovative processes, particularly in the private sector. A number of innovation surveys—including the Community Innovation Survey—focus on small and medium enterprises (SMEs) as the main innovative agent and provide innovation counts and innovation input indicators. Innovations within enterprises are generally broken down by their NACE class. The recently introduced Innovation Union Scoreboard will provide comparative benchmarking of EU and Member State performance against 25 core research and innovation indicators on an annual basis, benchmarking some against major international partners.
In terms of indicators, a focus for innovation and technological progress has been high-tech and knowledge service activities and industries. High-tech industries are defined by their R&D-intensity (or the average shares of their expenses dedicated to R&D), and high-tech products result from significant R&D investment (European Commission, 2008; Peter & Bruno, 2010). Indicators focus on shares of product or process innovators, sales of new-to-market or new-to-firm products, and shares and types of employment in high- or medium-tech industries or knowledge-intensive services (Grupp et al., 2010). International high-tech trade data, or data on the exports and imports of products manufactured using a high intensity of R&D, are also used. The European Union (2011) noted that “fast-growing enterprises in the most innovative sectors of the economy are key actors for the development of emerging industries and for the acceleration of the structural changes that Europe requires.” This is why the European Commission proposed that a new single innovation headline indicator be the share of fast-growing enterprises in the most innovative sectors; the definition of innovative sectors is being elaborated in collaboration with the OECD and covers non-technology (non-manufacturing) sectors.3
Value added is an additional indicator of knowledge intensity. The European Commission (2008) defined value added as “current gross value added measured at producer prices or at basic prices, depending on the valuation used in the national accounts.” According to the European Union (2011), competitive advantage relies on the ability to compete on high value-added
3 http://epp.eurostat.ec.europa.eu/portal/page/portal/statistics_policymaking_europe_2020/documents/Presentation_Delescluse.pdf

Analytical Report 2.3.2 Final Report
10
products, and value is added to products through intensified labour or capital. Technology- and knowledge-intensive SMEs are believed to be a source of high value added, as they generate new products and services, create high-paying jobs, use resources more efficiently and conduct research that has spill-over benefits (Eurostat, 2009). The indicator provides an indication of how industry sectors within a country contribute to its GDP. Both the Value Added Scoreboard4, which is published by the Department for Innovation, Universities & Skills and the Department for Business, Enterprise & Regulatory Reform, and the EU KLEMS database5 (available up to 2007) provide data and rankings on value added.
How innovation data can contribute to an understanding of specialisation: Innovation is a ‘distributed activity’—processes of innovation typically have a spatial element, as they involve several contributing and coordinated firms or organisations (Coombs, Harvey, & Tether, 2001). Innovation also takes place within sectoral systems—indicators are meant to capture high-growth sectors and areas of leading-edge research activity. For instance, Peter and Bruno (2010) calculated countries’ relative value added specialisation as an indicator of their economic specialisation and their relative high-tech trade specialisation as an indicator of their product specialisation by country. Knowledge-intensive or high-tech services, in particular, are an important indicator of the overall knowledge intensity of an economy, one that is closely linked to the “growing specialisation of industries and the need for more specialisation in other services and in manufacturing sectors” (European Commission, 2008). Very few empirical assessments of innovation and specialisation, however, have been done in service areas beyond the application of information and communication technologies (ICT) (Tether, Hipp, & Miles, 1999). Because they deal primarily with technology development and activity, non-technological innovation is largely overlooked, and innovation indicators are most often used to gain an understanding of strictly technological, rather than scientific, specialisation.
2.2.4 Knowledge flow indicators
The 2000 ERA Communication, the 2007 Green Paper and the 2011 Innovation Union Competitiveness Report stressed the need for partnerships between existing centres of excellence across European countries, better coordination between national and European research activities and the generation of knowledge spillovers (European Commission, 2007). This goal has largely involved making use of “spatial and cultural proximity between firms and supporting institutions” within the EU context, particularly at the regional level (European Commission, 2009). Studies continue to demonstrate that a robust STI system is built on networks of relationships between universities, governments and firms; that emerging and high-growth scientific fields are characterised by high degrees of diversity and complementarities requiring active cooperation; and that linkages between various actors in various sectors have therefore become crucial to the production of S&T knowledge and innovation production (Bonaccorsi, 2005; Lepori, Barré & Filliatreau, 2008; Mota, 2001, as cited in Sartori & dos Santos Pacheco, 2006).
Knowledge flow indicators are relative newcomers to the assemblage of established STI indicators. The European Commission presented a chapter on knowledge flows and new indicators to measure transnational knowledge flows and integration of research in its various dimensions
4 http://www.research-interfaces.org/resources/article/default.aspx?objid=2764 5 http://www.euklems.net

Analytical Report 2.3.2 Final Report
11
for the first time in its 2008 Science, Technology and Competitiveness Key Figures Report. The report noted that these indicators are currently experimental due to the lack of coverage that these dimensions have in European and international statistical systems, particularly with respect to the public sector; linkages at the firm level, however, are more easily determined because of the prevalence of innovation surveys. A report on scientific collaboration by the Royal Society (2011) confirmed a specific lack of data on the flow and migration of talented scientists and their diaspora networks, asserting that better indicators are required from organisations like UNESCO and the OECD in order to properly evaluate global science.
The analysis of S&T flows enables an understanding of the transfer of both embodied and disembodied knowledge and the dissemination and exploitation of S&T advances by examining the dynamics of research-driven innovation through activities and network of actors (Jiménez-Sáez, Zabala, & Zofío, 2010). Codified knowledge flows are registered in scientific and technical literature and patents, and output indicators are generally based on data on co-publication and co-patenting cooperation, including patent-to-patent and patent-to-non-patent citations and references. The Technological Balance of Payments (TBP) indicator may be considered a ‘commercial’ flow indicator, as it measures the current exchange of technological know-how and services into and out of a country by recording the flow of funds for transactions concerning industrial property rights (OECD, 2010). Exchanges of the tacit knowledge embodied in individual workers can be gauged by HR mobility indicators. Meanwhile, less ‘visible’ flows come in a variety of forms and may involve public domain sources, co-operative knowledge exchanges, university spin-offs, trade literature and electronic academic links (e.g., data on Open Access to scientific publications and journals and webometrics) (European Commission, 2008; European Union, 2011; OECD, 2007; Pontikakis, Chorafakis, & Kyriakou, 2009). In aggregate, this information leads to an idea of the competitiveness of countries or regions based on their “potential as creators and disseminators of new knowledge” (Lugones & Suarez, 2010).
How knowledge flow data can contribute to an understanding of specialisation: Although this is likely changing in the encroaching age of ‘virtual organisations’ and ‘virtual critical mass’, knowledge flow has been largely geographically dependent. Based on network analyses, the European Union (2011) found that there is a strong concentration of knowledge flows amongst a few Western European countries, with only marginal involvement of other EU-12 (new) Member States and most southern European countries. Additionally, while science is happening in more places, with greater numbers of widely dispersed major hubs of scientific production, scientific activity is actually becoming more concentrated—and hubs are growing more interconnected. Regions and cities, rather than countries, are frequently perceived as the more relevant loci for corporate R&D investment, scientific facilities or global talent because they are better able to facilitate knowledge exchange between clustered institutions and organisations (Royal Society, 2011). Measures on the interconnectedness of agents in the STI system show the degree of ‘clustering’ within a network, the linkage between the specific clusters and the common innovation infrastructure and the centrality of nations or regions within larger networks of collaborations (OECD, 2007).
Pontikakis, Chorafakis and Kyriakou (2009) argued that many questions in the debate on specialisation versus diversity could be answered through a better understanding of the characteristics and consequences of these so-called ‘untraded flows of knowledge’. Knowledge flow indicators could potentially measure not only variations in the specialisation/diversity axis, but the degree of structural change over time. Combined with other significant variables in an appropriate modelling framework, the authors noted that these measures could help “gauge the

Analytical Report 2.3.2 Final Report
12
effects of different specialisation patterns on R&D productivity, EU cohesion and the flexibility of research systems” and ultimately identify determinants of variation in specialisation. Knowledge flow indicators could also help researchers to determine whether increased networking and collaboration is more achievable and more efficient than geographic agglomeration for reaching critical mass. Similarly, the European Commission (2009) suggested that maps of network links and specialisation patterns, based on readily available summary statistics, would enable a direct picture of the linkages (and their intensity) between institutions and how they evolve over time “without imposing some ad hoc geographical partition.” Using such maps, these patterns and structures could be compared to those observed in other regions of the world.
2.2.5 Research infrastructure indicators
Another stated objective for the ERA was to develop strategic and large-scale research infrastructures (RI) in Europe. This was followed by the establishment in 2002 of the European Strategic Forum on Research Infrastructures (ESFRI)6. This goal, and a common method for financing large RI in Europe, was a major part of FP6 and FP7 and related Structural Funds. The Innovation Union Competitiveness Report (European Commission, 2011) discussed the importance of building a framework for pan-European RI. There are currently seven major intergovernmental European research organisations operating new large-scale infrastructures. Resources under the Structural Funds cover physical capital for research activities, including land, buildings, instruments and equipment in laboratories. Infrastructure in higher education and in government laboratories has been a major focus of these efforts, with Member States introducing numerous reforms aimed at improving the functioning of the public research base (European Union, 2011). Despite considerable funding for their design, preparation and construction, severe imbalances persist, however, in the distribution of RI in Europe.
The term RI refers to “facilities, resources and related services used by the scientific community to conduct top-level research in their respective fields, ranging from social sciences to astronomy, genomics to nanotechnologies.”7 The European Commission (2008) Key Figures report used data on Structural Funds and expenditures on RI to determine the creation of new large-scale RI at the European level, particularly those that have national or regional dimensions (especially in the new Member States). RI-related indicators also included the most active research universities, funding models for universities (types of funding) and additional economic indicators such as the share of GOVERD in total public sector expenditure on R&D (GOVERD + HERD). European RI-related instruments include the Survey of European Research Infrastructures8 conducted in 2006−2007 (first trial conducted in 2004−2005) by the European Commission, European Science Foundation and European Heads of Research Councils and the resulting RI Database Portal9 and impact studies, as well as the 2010 Roadmap of the European Strategy Forum on Research Infrastructures (ESFRI).
How RI data can contribute to an understanding of specialisation: While very few investigations have empirically examined the relationship between RI and specialisation, it is clear
6 http://ec.europa.eu/research/infrastructures/index_en.cfm?pg=esfri 7 http://ec.europa.eu/research/infrastructures/index_en.cfm?pg=what 8 http://cordis.europa.eu/infrastructures/survey.htm 9 http://ec.europa.eu/research/infrastructures/index_en.cfm?pg=landscape

Analytical Report 2.3.2 Final Report
13
that the development of national and regional research and technical infrastructure is crucial to enabling STI systems to realise their full potential as creators and disseminators of R&D. In particular, high-quality RI better enable public research institutions and organisations to build critical mass in specialised domains of knowledge by establishing networks and partnerships, creating private and cooperative research organisations and supporting technology transfer agencies. Through sharing specialised RI and testing facilities, countries or regions may seek to build strong clusters or cluster cooperation and facilitate knowledge transfer for cross-border cooperation (Europe INNOVA/PRO INNO Europe, 2008). At the Week of Innovative Regions in Europe 2011 conference in Debrecen, Hungary, members consulted and agreed on the “Debrecen Declaration”. The resulting document10 stresses the important synergies between clusters, regional specialisation and RI. In it, the EU is encouraged to develop a holistic approach to the design of “smart specialization strategies through roadmaps where clusters and RI play a crucial role” in contributing to European competitiveness and facilitating the emergence of strong innovative European regions.
2.2.6 Industrial specialisation
Although this review focuses primarily on R&D specialisation, the concept of industrial specialisation is no doubt an issue of crucial importance to overall country specialisation. The relationship between science, technology and innovation is believed to be linear, with R&D and technological specialisation driving industrial specialisation, which in turn drives competitiveness, leadership, growth, incomes and standards of living (Bonaccorsi, 2009; Giannitsis, 2009). Industrial specialisation—often called ‘industrial concentration’—is looked to as an effective approach to regional growth and is commonly analysed in relation to regional specialisation (Goschin, Constantin, Roman, & Ileanu, 2009).
Employment indicators are some of the most frequently used measures to determine the concentration of industries and specialisation of regions. These include regional concentrations of employment in high-tech and medium-high-tech industries or employment in knowledge-intensive services (e.g., employment in knowledge intensive economic activities as a percentage of total employment). Relative wage rate dynamics, or impacts on regional income caused by exogenous increases in demand in particular industries, may also be used (as in Stanton & Mason, 2007), measured as the total increase in the value of wages and salaries paid by each industry in the region to its employees.
Aside from employment and income indicators, value added (GVA, as described in the section on innovation indicators) is often used as a relative measure of industrial specialisation/concentration. GVA is an indicator of the contribution of each industry to GDP, enabling comparisons of one region with the overall economy.
2.2.7 Selection of key STI indicators for the cross-cutting analysis with scientific output
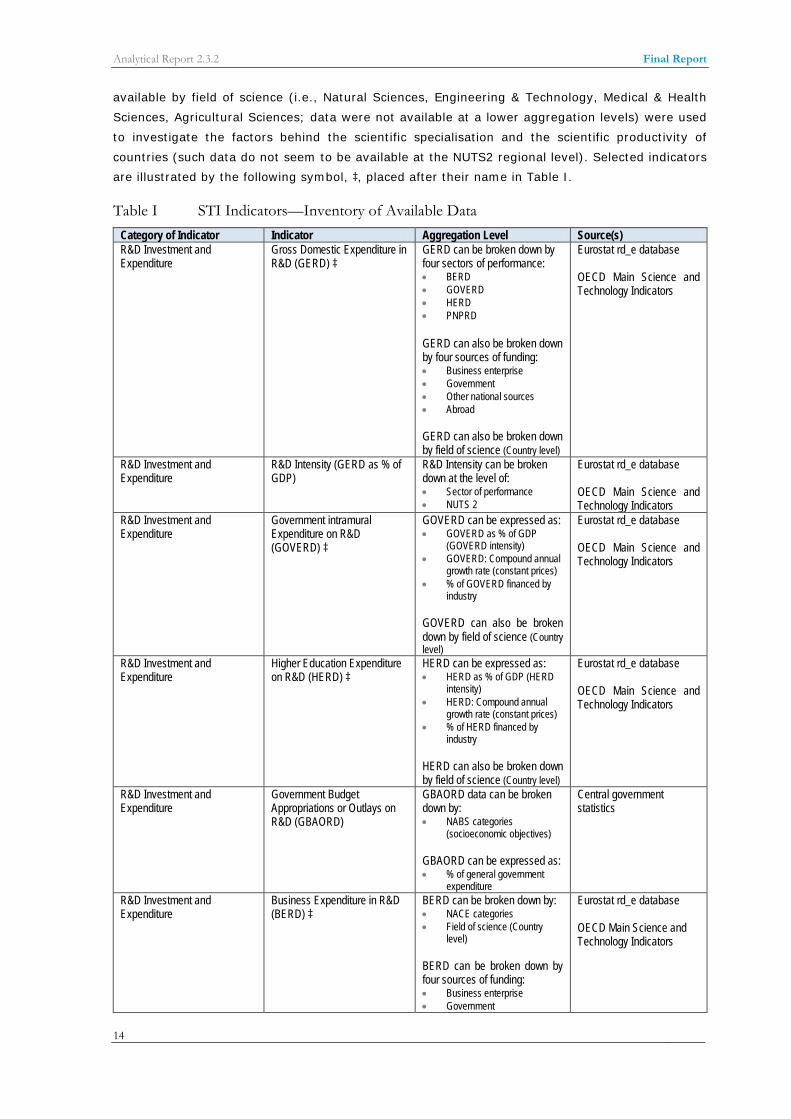
Table I presents an inventory of STI indicators for which data are available at the level of countries (always available for EU-27) and regions (NUTS2; when specified). Data for these indicators were not found by FP7 thematic priorities. As such, indicators for which data are
10 http://www.wire2011.eu/upload/document/34/Debrecen%20Declaration.pdf
Analytical Report 2.3.2 Final Report
14
available by field of science (i.e., Natural Sciences, Engineering & Technology, Medical & Health Sciences, Agricultural Sciences; data were not available at a lower aggregation levels) were used to investigate the factors behind the scientific specialisation and the scientific productivity of countries (such data do not seem to be available at the NUTS2 regional level). Selected indicators are illustrated by the following symbol, ‡, placed after their name in Table I.
Table I STI Indicators—Inventory of Available Data Category of Indicator Indicator Aggregation Level Source(s) R&D Investment and Expenditure
Gross Domestic Expenditure in R&D (GERD) ‡
GERD can be broken down by four sectors of performance: • BERD • GOVERD • HERD • PNPRD GERD can also be broken down by four sources of funding: • Business enterprise • Government • Other national sources • Abroad GERD can also be broken down by field of science (Country level)
Eurostat rd_e database OECD Main Science and Technology Indicators
R&D Investment and Expenditure
R&D Intensity (GERD as % of GDP)
R&D Intensity can be broken down at the level of: • Sector of performance • NUTS 2
Eurostat rd_e database OECD Main Science and Technology Indicators
R&D Investment and Expenditure
Government intramural Expenditure on R&D (GOVERD) ‡
GOVERD can be expressed as: • GOVERD as % of GDP
(GOVERD intensity) • GOVERD: Compound annual
growth rate (constant prices) • % of GOVERD financed by
industry GOVERD can also be broken down by field of science (Country level)
Eurostat rd_e database OECD Main Science and Technology Indicators
R&D Investment and Expenditure
Higher Education Expenditure on R&D (HERD) ‡
HERD can be expressed as: • HERD as % of GDP (HERD
intensity) • HERD: Compound annual
growth rate (constant prices) • % of HERD financed by
industry HERD can also be broken down by field of science (Country level)
Eurostat rd_e database OECD Main Science and Technology Indicators
R&D Investment and Expenditure
Government Budget Appropriations or Outlays on R&D (GBAORD)
GBAORD data can be broken down by: • NABS categories
(socioeconomic objectives) GBAORD can be expressed as: • % of general government
expenditure
Central government statistics
R&D Investment and Expenditure
Business Expenditure in R&D (BERD) ‡
BERD can be broken down by: • NACE categories • Field of science (Country
level) BERD can be broken down by four sources of funding: • Business enterprise • Government
Eurostat rd_e database OECD Main Science and Technology Indicators

Analytical Report 2.3.2 Final Report
15
Category of Indicator Indicator Aggregation Level Source(s) • Other national sources • Abroad
BERD can be expressed as: • BERD as % of GDP (BERD
intensity) • BERD: Compound annual
growth rate (constant prices) • BERD as % of value added in
industry R&D Investment and Expenditure
Private Non-Profit Expenditure on R&D (PNPRD)
PNPRD can be broken down by: • NACE categories • Field of science (Country
level) PNPRD can be expressed as: • PNPRD as % of GDP (BERD
intensity)
Eurostat rd_e database OECD Main Science and Technology Indicators
Human Resources (HR) HR in S&T (HRST) ‡ (precise selection of indicators in this category remains to be established)
HRST can be broken down by: • Core (HRSTC) • Education (HRSTE) • Occupation (HTSTO) • Scientists & Engineers (S&E) • Gender • Nationality based on
citizenship: Nationals or non-nationals
• NUTS2
Eurostat hrst database
Human Resources (HR) R&D Personnel Total R&D Personnel can be broken down by: • Field of science (Country
level) • NUTS2 R&D Personnel can be expressed in: • Full-Time Equivalent (FTE) • Personnel in Head Count
(HC)
Eurostat rd_p database
Human Resources (HR) Researchers ‡ R&D Personnel can be broken down by: • Field of Science (Country
level) • NUTS2 R&D Personnel can be expressed in: • Full-Time Equivalent (FTE) • Personnel in Head Count
(HC)
Eurostat rd_p database
Human Resources (HR) Education Inflows ‡ HRST education inflows can be broken down by: • Levels of tertiary education • Field of study: Total (all fields)
vs. Science & Engineering
Eurostat hrst Database
Human Resources (HR) Doctoral Graduates ‡ Doctoral graduates can be broken down by: • Flows: incoming plus
outgoing, as % of total PhD/doctoral graduates
• Gender • Country of origin R&D Personnel can be expressed in: • Number of degrees awarded,
per thousand population • Average Annual Growth Rate
(AAGR)
Eurostat hrst Database
Human Resources (HR) Researcher Mobility ‡ (subject to data quality)
Mobility patterns of individual researchers over time are
Eurostat hrst Database

Analytical Report 2.3.2 Final Report
16
Category of Indicator Indicator Aggregation Level Source(s) based on: • Nationality • Place of birth Similarly, patterns of student or doctorate holder mobility over time are based on: • Country of permanent
residence • Country of prior education
Human Resources (HR) Number of graduates ‡ Number of graduates by field of study
OECD Online Education Database
Innovation Patents as Inventive R&D Output ‡ (Can the Commission grant Science-Metrix access to data collected in the ‘Measurement and analysis of knowledge and R&D exploitation flows, assessed by patent and licensing data’ study)
Patents can be broken down by, for example: • Patent applications per million
population • Patents granted • High-tech patents per million
population (NACE) • Patent applications filed
under PCT
European Patent Office (EPO) US Patent and Trademark Office (USPTO)
Innovation Value Added Value added can be broken down by: • Manufacturing value added:
% distribution by type of industry
• High-tech value added as % of total national manufacturing value added
• Value added of knowledge intensive high-tech services as % of total national services value added
• NUTS 2
Eurostat Eurostat Structural Business Statistics (SBS) OECD
Innovation Enterprises in Knowledge-Intensive Services (KIS)
Enterprises in KIS can be broken down by: • NACE categories • Size (e.g., SMEs) They can also be broken down into: • High-Tech KIS (HTKIS) • Less Knowledge-intensive
Services (LKIS)
Eurostat htec database
Innovation Employment in Knowledge-Intensive Services (KIS) ‡
Employment in KIS are aggregated at the level of: • NUTS 2 Employment in KIS can be broken down by: • Employment in HTKIS
Eurostat htec database
Innovation Venture Capital Investment (VCI) ‡
VCI is expressed as: • % of GDP
VCI can be broken down by: • Early stage (seed + start-up)
capital • Expansion and replacement
capital
European Private Equity and Venture Capital Association (EVCA) Eurostat htec database
Innovation Trade in High-Tech Products Trade in High-Tech Products is expressed as: • Exports/imports of high-tech
products as % of total High-tech products are determined based on: • Standard International Trade
Classification (SITC)
Eurostat COMEXT Database United Nations COMTRADE Database
Knowledge Flow Technology Balance of N/A Central government

Analytical Report 2.3.2 Final Report
17
Category of Indicator Indicator Aggregation Level Source(s) Payments (TBP) statistics
Knowledge Flow Scientific Co-Publications Scientific Co-Publications can be broken down into: • Any required unit
Science-Metrix
Knowledge Flow Scientific Co-Patenting (Can the Commission grant Science-Metrix access to data collected in the ‘Measurement and analysis of knowledge and R&D exploitation flows, assessed by patent and licensing data’ study)
Scientific Co-Patenting can be broken down into: • Single-country co-patents • Transnational co-patents • AAG
European Patent Office (EPO) OECD US Patent and Trademark Office (USPTO)
Knowledge Flow Scientific Publications Cited in Patents
Scientific Publications Cited in Patents can be broken down into: • All cited publications • Highly-cited publications • Science-intensive fields
European Patent Office (EPO) US Patent and Trademark Office (USPTO)
Knowledge Flow Open Access (OA) Repositories
Establishment of OA repositories can be broken down by: • Countries
Directory of Open Access Journals (DOAJ)
Research Infrastructures (RI) RI Projects Funded (Construction or Upgrade) ‡ (Subject to the feasibility of downloading information in bulk from the data source)
RI Projects Funded can be broken down by: • Countries • Field of science
European Strategic Forum on Research Infrastructures (ESFRI) Roadmap 2010 European Portal on Research Infrastructures’ services
Research Infrastructures (RI) Expenditures on RI ‡ (Subject to the feasibility of downloading information in bulk from the data source)
Expenditures on RI can be broken down by: • Countries • Field of Science
European Strategic Forum on Research Infrastructures (ESFRI) Roadmap 2010 European Portal on Research Infrastructures’ services

Analytical Report 2.3.2 Final Report
18
3 METHODS & RESULTS
This report adds a highly meaningful level of analysis to the bibliometric data collected so far in this study by performing a cross-cutting analysis of scientific output versus other STI indicators. Specifically, this report investigates:
1. the factors behind the publication outputs and productivity (i.e., the efficiency with which entities are converting research inputs into research outputs) of countries and NUTS2 regions, as revealed through an analysis of scientific production (Section 3.1); and
2. the factors behind the production patterns of countries (data were not available at the NUTS2 level), as revealed through an analysis of scientific concentration (by research area), across scientific fields (data were not available to perform the analysis by thematic domain [i.e., FP7 thematic priority areas]) (Section 3.2).
For this report, a total of 17 STI indicators distributed across four categories (i.e., R&D Investment and Expenditure, Human Resources, Innovation and Research Infrastructures) were considered, although some were not available for analysing NUTS2 regions and the production patterns of countries by scientific field (see Section 2.2.7 and description of the indicators below). Data were downloaded in bulk from Eurostat11 for the 42 countries and 291 NUTS2 regions for which bibliometric data were available. The downloaded data covered the years 2000 to 2009, where available. The European Portal on Research Infrastructures’ Services12 was also used to download data for some of the selected STI indicators. These data were then uploaded on Science-Metrix’ SQL server and structured into a relational database that could be linked with Science-Metrix’ relational database of bibliometric indicators produced for DG Research as part of the same study (i.e., Analysis and Regular Update of Bibliometric Indicators; Science-Metrix, 2011). These indicators are as follows:13
R&D Investment and Expenditure GERD: Gross Domestic Expenditure in R&D (GERD) expressed in millions of PPS at 2000
prices (Source: Eurostat rd_e_gerdsc table [country & field levels] and rd_e_gerdreg [NUTS2 level])
HERD: Higher Education Expenditure on R&D (HERD) expressed in millions of PPS at 2000 prices (Source: Eurostat rd_e_gerdsc table [country & field levels] and rd_e_gerdreg [NUTS2 level])
GOVERD: Government intramural Expenditure on R&D (GOVERD) expressed in millions of PPS at 2000 prices (Source: Eurostat rd_e_gerdsc table [country & field levels] and rd_e_gerdreg [NUTS2 level])
BERD: Business Expenditure in R&D (BERD) expressed in millions of PPS at 2000 prices (Source: Eurostat rd_e_gerdsc table [country level; too many missing entries at the field level] and rd_e_gerdreg [NUTS2 level])
Human Resources Researchers in the Higher Education Sector: Number of researchers (both genders in all
fields) in the higher education sector expressed in head count (Source: Eurostat rd_p_perssci table [country & field levels] and rd_p_persreg [NUTS2 level])
11 http://epp.eurostat.ec.europa.eu/portal/page/portal/statistics/bulk_download 12 http://www.riportal.eu/public/ index.cfm?fuseaction=ri.search 13 For more details on these indicators, see Eurostat’s metadata at: http://epp.eurostat.ec.europa.eu/portal/page/portal/statistics/metadata

Analytical Report 2.3.2 Final Report
19
HRST with Tertiary Education: Number of human resources (both genders in all fields; 15 to 74 years) in science and technology (HRST) with tertiary education (employed) expressed in thousands (Source: Eurostat hrst_st_nfiesex table)
PhD Students: Number of PhD students (both genders in all fields) participating in tertiary education (ISCED 97: Level 6) expressed in thousands (Source: Eurostat hrst_fl_tepart table)
PhD Graduates: Number of PhD graduates (both genders in all fields) from tertiary education (ISCED 97: Level 6) expressed in thousands (Source: Eurostat hrst_fl_tegrad table)
Foreign Students in Tertiary Education: Number of foreign students (both genders in all fields) participating in tertiary education (ISCED 97: Levels 5 and 6) expressed in thousands (Source: Eurostat hrst_fl_tefor table)
Job-to-Job Mobility of HRST: Job-to-Job Mobility of HRST (25-64 years; Employed) in all knowledge-intensive services expressed in thousands (Source: Eurostat hrst_fl_mobsect table)
Innovation Employment in Technology and Knowledge-Intensive Sectors: Employment in
technology and knowledge-intensive sectors (all NACE activities; all occupations) expressed in thousands (Source: Eurostat htec_emp_nisco table)
High-Tech Patent Applications to the EPO: Number of high-tech (total) patent applications to the EPO (Unit = All (no breakdown); Source: Eurostat pat_ep_ntec table)
VCI (Expansion & Replacement): Venture Capital Investments (VCI) for expansion & replacement expressed in millions of euro (Source: Eurostat htec_VCI_exre table)
VCI (Buyout): VCI for buyout expressed in millions of euro (Source: Eurostat htec_VCI_buyout table)
VCI (Early Stage): VCI for early stage research expressed in millions of euro (Source: Eurostat htec_VCI_earl table)
Research Infrastructure14 Research Infrastructures (RI): Number of new research infrastructures (Unit = All (no
breakdown); Source: http://www.riportal.eu/public/ index.cfm?fuseaction=ri.search); Average Lower Bound of RI investment: Average lower bound of research infrastructure
investment (i.e., for initial construction/setting up) expressed in millions of euro (Source: http://www.riportal.eu/public/ index.cfm?fuseaction=ri.search).
3.1 PUBLICATION OUTPUT AND PRODUCTIVITY OF COUNTRIES AND NUTS2 REGIONS
The bibliometric indicator that was used to improve the understanding of differences between countries’ and NUTS2 regions’ scientific output and productivity is the total number of publications indexed in Scopus (the data cover the 2000−2009 period). The data were produced by Science-Metrix (2011) for DG research. The indicator is defined as follows:
Number of peer-reviewed scientific publications written by authors located in a given geographical or organisational entity (e.g., the world, a country, a NUTS2 region, a university, an RPO or a company). Fractional counting (FRAC) was used. The fractioning was done at the level of author addresses.
14 For more details on these indicators, see: European Commission, European Science Foundation. (2007). Trends in European Research Infrastructures: Analysis of data from the 2006/07 survey. 96 pages, http://ec.europa.eu/research/infrastructures/pdf/survey-report-july-2007_en.pdf#view=fit&pagemode=none.

Analytical Report 2.3.2 Final Report
20
Factor analysis was used to identify the main dimensions (i.e., factors) explaining patterns of variation among selected STI indicators and the publication output of countries (Section 3.1.1), whereas regression analysis was used for investigating the productivity of countries and NUTS2 regions in terms of outputs (i.e., publications) per unit of the most relevant STI indicators (i.e., R&D input indicators) (Section 3.1.2 and 3.1.3). Section 3.1.2 also presents the results of a regression analysis aimed at investigating whether the innovation capability of countries (i.e., the capacity to produce inventions from a given amount of research) varies as the size of their science base increases.
3.1.1 Factor analysis for identifying the main dimensions (i.e., factors) among selected STI indicators and the publication output of countries
Exploratory Factor Analysis (EFA) was used for identifying the main dimensions (i.e., factors) explaining patterns of variation among selected STI indicators and the publication output (i.e., production) of countries. Prior to performing EFA, the frequency distributions of all indicators were examined to see whether or not the indicators needed to be transformed prior to undertaking the analyses. Indeed, the normality of individual variables is an assumption underlying many factoring methods used in performing EFA. As expected, all indicators had a high positive skew, with most countries having low scores and a few having high scores (e.g., similarly to heavy tails). As such, they were log transformed, and although the resulting distributions did not always satisfy the condition of normality (based on a Kolmogorov-Smirnov Test of normality, data not shown), neither did they appear to present a strong departure from normality (based on a visual inspection of the distributions, see Figure 1). Additionally, this transformation made (if it was not already the case) the relationships between all observed variables linear, which is another assumption often underlying EFA using different factoring methods (based on a visual inspection of the relationships, Figure 1).
The two indicators on research infrastructure (Q and R in Figure 1) were left aside, as the volume of data available for them was small (N = 31; many missing values). Additionally, the GERD was also removed from the analysis because it is redundant with HERD, GOVERD and BERD. Therefore, the remaining indicators included R&D input indicators (13), as explanatory variables for the number of publications (FRAC) produced by various entities, and the number of high-tech patent applications to the EPO, as another R&D output variable to be cross-linked with scientific output (i.e., the number of publications).
The dataset used in this report consisted of a panel data structure made up of cross-sections (i.e., countries) and time-series (i.e., years = 10), the latter being nested within the former. Thus, the input and output variables to be analysed have two dimensions. Each observation has a cross-sectional unit (i.e., country i) and a temporal reference (i.e., year t). The result is that the input and output variables, which consist of time-series, do not fully satisfy the assumption of random and independent sampling of observations. However, since the goal of the current analysis is to describe the underlying structure of the dataset rather than to perform inferential statistics, this violation has a limited impact. Because the data were not always available for all countries and years among the set of retained variables, the panel data was unbalanced. Consequently, missing data were dealt with using pairwise deletion. The sample size for each of the variables submitted to the EFA are indicated in the note for Figure 1.

Analytical Report 2.3.2 Final Report
21
Figure 1 Frequency distribution of selected STI indicators and matrix of the relationships between all pairs of indicators, 2000−2009
Note: A = Publications (FRAC; N = 405), B = GERD (N = 339), C = HERD (N = 339), D = BERD (N = 336), E = GOVERD (N = 340), F = HRST with Tertiary Education (N = 218), G = Researchers in the Higher Education Sector (N = 263), H = Foreign Students in Tertiary Education (N = 237), I = PhD Graduates (N = 288), J = PhD Students (N = 262), K = Job-to-Job Mobility of HRST (N = 186), L = High-Tech Patent Applications to the EPO (N = 355), M = Employment in Technology and Knowledge-Intensive Sectors (N = 269), N = VCI (Buyout) (N = 183), O = VCI (Early Stage) (N = 201), P = VCI (Expansion & Replacement) (N = 210), Q = Research Infrastructure (N = 31) and R = Average Lower Bound of RI investment (N = 31)
Source: Computed by Science-Metrix using Scopus (Elsevier) and Eurostat data
Because the variables did not fully satisfy the condition of normality, an attempt was first made to perform EFA using Iterated Principal Axis (IPA) factoring, which does not rely on any distributional assumption (Fabrigar et al., 1999). Unfortunately, the IPA procedure failed, as the correlation matrix consisted of a singular matrix that could not be inverted. This is due to the very small determinant (0) of the correlation matrix, which provided evidence of high multicollinearity in the dataset (Field, 2000).
Consequently, a second attempt was made using PCA factoring, which relies on the assumption of normality of the variables. Using the Kaiser criterion (i.e., eigenvalue > 1; a factor should be dropped when it carries less information than the average single input variable) for retaining the meaningful factors resulted, in this case, in an overextraction of factors, as is often the case with this approach (Costello & Osborne, 2005).
In identifying the meaningful factors, the scree plot approach was used in conjunction with the Kaiser criterion (Figure 2). Based on this approach, it was found that the 15 selected variables

Analytical Report 2.3.2 Final Report
22
could be adequately summarised using a single factor. Indeed, although the two main factors have an associated eigenvalue greater than 1, there is a sharp break in the distribution of eigenvalues between these two factors, and the first factor alone explains 83% of the variance in the dataset (Table II). The presence of negative eigenvalues for the two last factors provided further evidence of high multicollinearity in the dataset. In fact, all variables had at least 50% of their variance explained by the first factor, and the output variable (i.e., number of publications) was almost perfectly correlated (R2 = 0.98) with the first factor (Table II).
Figure 2 Scree plot of the exploratory factor analysis of selected STI indicators using PCA factoring
Source: Computed by Science-Metrix using Scopus (Elsevier) and Eurostat data
To assess whether the departure from normality in the selected variables was sufficiently pronounced to create distortion in the results obtained using PCA factoring, an attempt was made to reduce the multicollinearity in the dataset to allow an EFA to be performed using IPA factoring, again using pairwise deletion. This was achieved by removing variables (i.e., job-to-job mobility of HRST, VCI Buyout, VCI Early Stage, VCI Expansion & Replacement, and high-tech patent applications to the EPO), which appeared to cause problems. Among them, the job-to-job mobility of HRST was highly correlated with both the publication output and HERD of countries (data not shown) and was, with these two variables, almost perfectly correlated with the first factor based on PCA factoring (Table II).
0
2
4
6
8
10
12
14
0 2 4 6 8 10 12 14 16
Eige
nval
ue
Number of factors

Analytical Report 2.3.2 Final Report
23
Table II Factor loadings of selected STI indicators on the 1st factor of the exploratory factor analysis using PCA factoring
Source: Computed by Science-Metrix using Scopus (Elsevier) and Eurostat data
The reasons behind the impact of the three indicators on venture capital investments (VCI) and the impact of the number of high-tech patent applications to the EPO on the high multicollinearity of the dataset is more difficult to grasp. However, their removal was not a major concern, as they are the least correlated with the publication output of countries, each explaining 70% or less of the variance in this variable. In addition, they are not intrinsically linked with this variable, at least not to the extent that R&D expenditures and HRST indicators are linked with it. Indeed, although early- and expansion- stage venture capital supports a significant level of R&D, which is captured in BERD, this R&D is mostly oriented towards development rather than research (OECD, 2002). This redundancy with BERD—as revealed by the high correlation coefficients of early- and expansion- stage VCI with this indicator, as well as between them—might very well be the cause for their impact on the high multicollinearity in the dataset. The number of high-tech patent applications to the EPO was also highly correlated with BERD. Finally, the job-to-job mobility of the HRST variable and the three indicators on VCI had the highest number of missing values in the dataset.
This time, the IPA factoring did work, although the multicollinearity in the dataset was still high (determinant of the correlation matrix < 0.00001; Field, 2002), and it provided results that were highly comparable to those obtained using PCA factoring (Table III). All variables were again adequately summarised using a single dimension (only one meaningful factor with an eigenvalue above 1) and the output variable (i.e., the number of publications [FRAC]) was again almost perfectly correlated with the first factor, meaning that it is almost equivalent to it (i.e., the first factor is a good approximation of the scientific production of countries). It should be noted that the dataset used to perform the EFA included repeated measures over time (from 2000 to 2009) for each country. Thus, the assumption of independence in the observations was violated. However, since the goal was to explore the data rather than to perform confirmatory factor analysis (CFA), this violation does not offset the main conclusion drawn from this analysis—that the selected indicators are highly collinear.
Indicator R R2
Publications (FRAC) 0.99 0.98Job-to-Job Mobility of HRST 0.98 0.95HERD 0.97 0.95HRST with Tertiary Education 0.95 0.89BERD 0.95 0.91GOVERD 0.94 0.89PhD Graduates 0.94 0.88Researchers in the Higher Education Sector 0.92 0.84Employment in Technology and Knowledge-Intensive Sectors 0.91 0.82Foreign Students in Tertiary Education 0.92 0.84PhD Students 0.89 0.79High-tech patent applications to the EPO 0.88 0.77VCI (Expansion & Replacement) 0.85 0.72VCI (Buyout) 0.79 0.62VCI (Early Stage) 0.74 0.54% of Total Variance Explained by the 1st Factor 83%

Analytical Report 2.3.2 Final Report
24
As all R&D input indicators are highly correlated with the first factor (R ranging from 0.88 to 0.97), it is likely that they are strongly correlated with the scientific production of countries. Indeed, all remaining R&D input indicators had a correlation coefficient greater than 0.89 with the publication output of countries (data not shown). This does not come as a surprise, as all of these indicators are to some extent dependant upon the GERD of countries: the more a country invests in R&D, the more resources (e.g., human resources, infrastructure) it is likely to have in S&T.
Table III Factor loadings of selected STI indicators on the 1st factor of the exploratory factor analysis, based on PCA and IPA factoring
Source: Computed by Science-Metrix using Scopus (Elsevier) and Eurostat data
However, given that there are differences in the way countries allocate R&D spending across sectors (e.g., higher education, government, private) and resources (e.g., human resources, infrastructure), it is of interest to investigate how the publication output of countries scale relative to individual R&D input indicators (12 indicators, including those on VCI but excluding the job-to-job mobility of HRST because of its very high correlation with HERD and the response variable). This was achieved through regression analysis. Regression analysis was also used to investigate whether countries with a larger publication output also have a stronger innovation capabilities (measured in terms of high-tech patent applications to the EPO).
3.1.2 Regression analysis for investigating the productivity of countries in terms of publication output per unit of the most relevant R&D input indicators
This section presents the results of a regression analysis aimed at investigating the productivity of countries in terms of outputs (i.e., publications) per unit of the most relevant STI indicators (i.e., R&D input indicators) (Section 3.1.2.1). Based on this analysis, it subsequently ranks countries based on their scientific productivity (Section 3.1.2.2). Finally, the section concludes with the results of a regression analysis aimed at investigating whether the innovation capability of countries (i.e., the capacity to produce inventions from a given amount of research) varies as the size of their science base increases (Section 3.1.2.3).
3.1.2.1 Economies and diseconomies of scale in scientific production
Investigating the impact of individual R&D input indicators on the production of countries (i.e., the output variable) involved determining whether the two variables were scaling linearly (i.e., no change in the ratio as one of the variable increases; isometric pattern) or whether one variable was scaling exponentially relative to the other (i.e., change in ratio as one of the variable
Indicator R R2 R R2
Publications (FRAC) 0.99 0.98 1.00 0.99HRST with Tertiary Education 0.97 0.94 0.97 0.94PhD Graduates 0.97 0.93 0.96 0.93Employment in Technology and Knowledge-Intensive Sectors 0.96 0.92 0.95 0.91Researchers in the Higher Education Sector 0.95 0.91 0.95 0.90HERD 0.95 0.90 0.94 0.89PhD Students 0.95 0.89 0.94 0.88GOVERD 0.94 0.89 0.94 0.88BERD 0.92 0.84 0.91 0.82Foreign Students in Tertiary Education 0.90 0.81 0.88 0.78% of Total Variance Explained by the 1st Factor 90% 89%
PCA Factoring IPA Factoring

Analytical Report 2.3.2 Final Report
25
increases; allometric pattern). In the latter case, the relationship between the two measured quantities is expressed as a power law:
y = kxa;
or, equivalently, as a linear relationship using the logarithm of the variables:
log(y) = a log(x) + log (k),
where y = output variable and x = explanatory variable.
When attempting to interpret the pattern of change in the ratio between two variables as one increases, estimating the regression coefficient using the logarithm of the two variables can yield the answer (Smith, 2009). In the present case, when the slope of the regression line using the logarithmic form equals 1, there is isometric scaling between the two variables, meaning that the relationship between the two variables is linear (e.g., if y is equal to twice the value of x, it will remain so for any value of x). When the slope of the regression line using the logarithmic form is smaller than 1, there is negative allometric scaling between the two variables, meaning that y increases less rapidly than x (e.g., the ratio of y to x decreases as x increases). In this report, negative allometric scaling will be referred to as “diminishing returns”, whereby an increase in a factor of production (i.e., an R&D input indicator) while holding all others constant will yield lower per-unit returns (i.e., peer-reviewed publications per unit of the R&D input indicator). Alternatively, when the slope of the regression line using the logarithmic form is greater than 1, there is positive allometric scaling between the two variables, meaning that y increases more rapidly than x (e.g., the ratio of y to x increases as x increases). In this report, positive allometric scaling will be refered to as “economies of scale”, whereby an increase in a factor of production (i.e., an R&D input indicator) while holding all others constant will yield higher per-unit returns (i.e., peer-reviewed publications per unit of the R&D input indicator). When the 95% confidence interval of the slope does not overlap with the value of 1, which is indicative of an isometric scaling between the variables, it is concluded that there is a significant allometric scaling, indicating either “diminishing returns” (i.e., slope smaller than 1) or “economies of scale” (i.e., slope greater than 1).
Multiple regression could not be used to investigate the productivity of countries in terms of outputs (i.e., publications) per unit of the most relevant R&D input indicators due to the high multicollinearity in the dataset. This could have resulted in spurious conclusions regarding the significance of the regression coefficients and led to coefficients of unexpected sign (Zar, 1999). Additionally, the dataset used in this report consisted of a panel data structure made up of cross-sections (i.e., countries) and time-series (i.e., years = 10), the latter being nested within the former. Thus, the input and output variables to be regressed have two dimensions. Each observation has a cross-sectional unit (i.e., country i) and a temporal reference (i.e., year t). The result is that the input and output variables, which consist of time-series, are likely to be autocorrelated as a result of the non-independence in the observations. For instance, the HERD of a country at time t+1 is likely dependent upon its HERD at time t such that it is correlated with itself; in other words, a lagged variable of HERD could likely be regressed with itself (i.e., autoregression). Due to autocorrelations in the data, estimating the regression coefficients on the pooled dataset (i.e., all coutries and years) would likely compress the confidence intervals of the slopes, increasing the likelihood of falsely concluding that there are either “diminishing returns” or “economies of scale”.

Analytical Report 2.3.2 Final Report
26
Several regression models have been developed to deal with the peculiarities of panel datasets, in particular with the autocorrelation that often occurs in time-series as well as with unbalanced panels as in this study (i.e., data were not always available for all countries and years among the set of retained variables). Common models in panel data analysis include the fixed-effects model, the between-effects model, the random-effects model and the dynamic panel data model. When the goal of the analysis is the population response means, as in this study, the need to account for the within cross-section (i.e., country) variation and autocorrelation does not matter as much as when the analysis aims to investigate subject-specific (i.e., country-specific) effects of explanatory variables. In such cases, one can go for robust inference (Gardiner et al., 2009) using, for example, a between-effects model, which fits a group-mean regression.
In this study, group-mean regressions were fitted by means of S-estimators (robust regression) (Rousseeuw & Yohai, 1984). This method is adequate for fitting a regression line when outliers might be present in both the response and explanatory variables, which is highly likely with the data used in this report. Furthermore, this regression technique is also robust to violations of the assumptions of normality and homoscedasticity of the residuals, which was the case in several of the fitted regressions. The regressions were performed using a c-value of 2.937, which provided a good compromise between the breakdown point (i.e., the percentage of outliers above which the estimator is likely to be biased; 25%) and efficiency (i.e., 75%) of the estimator (Rousseeuw & Yohai, 1984).
Figure shows the regression coefficients obtained by fitting a group-mean regression between the scientific production (i.e., number of publications [FRAC]) of countries and each of the R&D input indicators retained in the factor analysis (12 indicators in total, see Section 3.1.1) in decreasing order of the strength of the correlation between the scientific output of countries and each of these variables (correlation coefficients based on group means ranged from 0.72 to 0.96). In total, twelve group-mean regressions were fitted using S-estimators, one for each of the relevant R&D input indicators. In nearly half of the regressions, when the 95% confidence intervals of the regression coefficients presented in Figure 3 did not overlap with the value of 1, which is indicative of an isometric scaling between the variables, it was concluded that there was a significant allometric scaling indicative of either “diminishing returns” (i.e., slope smaller than 1) or “economies of scale” (i.e., slope greater than 1).
Significant “diminishing returns” in terms of publication output are observed for five out of six R&D input indicators related to expenditures (i.e., GOVERD, BERD and all three VCI indicators). “Diminishing returns” appear to be stronger with the VCI indicators followed by BERD and GOVERD, whereas there appears to be isometric scaling with HERD.

Analytical Report 2.3.2 Final Report
27
Figure 3 Robust group mean regressions between the scientific output (number of publications [FRAC]) of countries and selected R&D input indicators, 2000−2009
Source: Computed by Science-Metrix using Scopus (Elsevier) and Eurostat data
Log(
Publ
icat
ions
)
Log(HERD)
Robust R2 = 0.94Slope = 0.9395% CI = [0.84 - 1.02]
Log(
Publ
icat
ions
)
Log(PhD Graduates)
Robust R2 = 0.93Slope = 1.0095% CI = [0.93 - 1.06]
Log(
Publ
icat
ions
)
Log(Researchers in the HES)
Robust R2 = 0.92Slope = 0.9895% CI = [0.85 - 1.10]
Log(
Publ
icat
ions
)
Log(HRST with Tertiary Education)
Robust R2 = 0.90Slope = 1.1295% CI = [0.96 - 1.29]
Log(
Publ
icat
ions
)
Log(PhD Students)
Robust R2 = 0.79Slope = 0.8795% CI = [0.74 - 1.00]
Log(
Publ
icat
ions
)
Log(GOVERD)
Robust R2 = 0.93Slope = 0.8695% CI = [0.77 - 0.95]
Log(
Publ
icat
ions
)
Log(Employment in Tech & KIS)
Robust R2 = 0.85Slope = 1.295% CI = ]1.00 - 1.39]
Log(
Publ
icat
ions
)
Log(BERD)
Robust R2 = 0.93Slope = 0.7195% CI = [0.63 - 0.80]
Log(
Publ
icat
ions
)
Log(Foreign Students in TE)
Robust R2 = 0.84Slope = 0.8995% CI = [0.72 - 1.06]
Log(
Publ
icat
ions
)
Log(VCI [Expansion & Replacement])
Robust R2 = 0.80Slope = 0.5795% CI = [0.44 - 0.71]
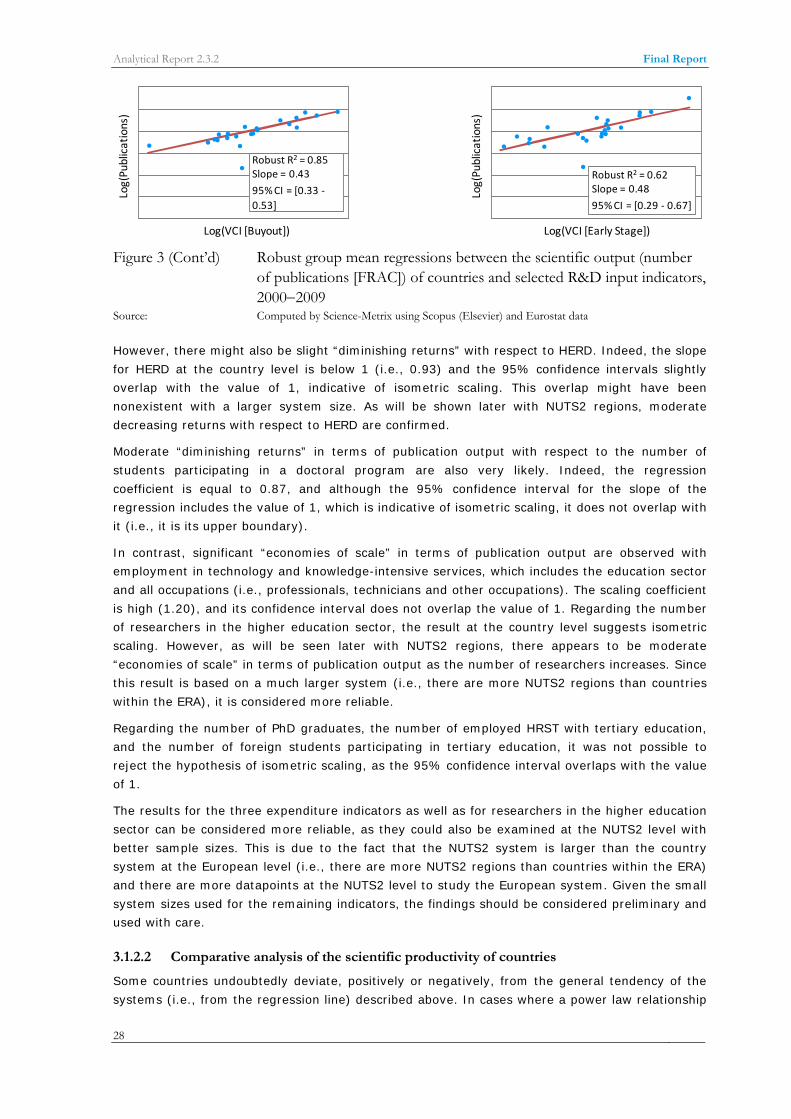
Analytical Report 2.3.2 Final Report
28
Figure 3 (Cont’d) Robust group mean regressions between the scientific output (number of publications [FRAC]) of countries and selected R&D input indicators, 2000−2009
Source: Computed by Science-Metrix using Scopus (Elsevier) and Eurostat data
However, there might also be slight “diminishing returns” with respect to HERD. Indeed, the slope for HERD at the country level is below 1 (i.e., 0.93) and the 95% confidence intervals slightly overlap with the value of 1, indicative of isometric scaling. This overlap might have been nonexistent with a larger system size. As will be shown later with NUTS2 regions, moderate decreasing returns with respect to HERD are confirmed.
Moderate “diminishing returns” in terms of publication output with respect to the number of students participating in a doctoral program are also very likely. Indeed, the regression coefficient is equal to 0.87, and although the 95% confidence interval for the slope of the regression includes the value of 1, which is indicative of isometric scaling, it does not overlap with it (i.e., it is its upper boundary).
In contrast, significant “economies of scale” in terms of publication output are observed with employment in technology and knowledge-intensive services, which includes the education sector and all occupations (i.e., professionals, technicians and other occupations). The scaling coefficient is high (1.20), and its confidence interval does not overlap the value of 1. Regarding the number of researchers in the higher education sector, the result at the country level suggests isometric scaling. However, as will be seen later with NUTS2 regions, there appears to be moderate “economies of scale” in terms of publication output as the number of researchers increases. Since this result is based on a much larger system (i.e., there are more NUTS2 regions than countries within the ERA), it is considered more reliable.
Regarding the number of PhD graduates, the number of employed HRST with tertiary education, and the number of foreign students participating in tertiary education, it was not possible to reject the hypothesis of isometric scaling, as the 95% confidence interval overlaps with the value of 1.
The results for the three expenditure indicators as well as for researchers in the higher education sector can be considered more reliable, as they could also be examined at the NUTS2 level with better sample sizes. This is due to the fact that the NUTS2 system is larger than the country system at the European level (i.e., there are more NUTS2 regions than countries within the ERA) and there are more datapoints at the NUTS2 level to study the European system. Given the small system sizes used for the remaining indicators, the findings should be considered preliminary and used with care.
3.1.2.2 Comparative analysis of the scientific productivity of countries
Some countries undoubtedly deviate, positively or negatively, from the general tendency of the systems (i.e., from the regression line) described above. In cases where a power law relationship
Log(
Publ
icat
ions
)
Log(VCI [Buyout])
Robust R2 = 0.85Slope = 0.4395% CI = [0.33 -0.53]
Log(
Publ
icat
ions
)
Log(VCI [Early Stage])
Robust R2 = 0.62Slope = 0.4895% CI = [0.29 - 0.67]
Analytical Report 2.3.2 Final Report
29
exists between two variables (i.e., when “diminishing returns” or “economies of scale” are confirmed), it is better to use scale-adjusted indicators instead of ratios to appropriately take account of the relative size of entities when comparing their performance; ratios, like the number of publications produced per euro investment in R&D in the higher education sector, assume a linear relationship (Katz, 2000). To take account of the non-linear relationship between the two variables, the performance score (in terms of productivity) is obtained by dividing the score for the output variable (not log transformed) by its expected score, as determined from the general tendency of the system (i.e., from the projection of the datapoint on the regression line; not log transformed). A score above one therefore indicates a stronger performance than expected for the size of the input (e.g., for HERD), whereas a score below one indicates the opposite. When the relationship between the two variables is linear (isometric scaling), this approach is still valid and provides rankings that are equivalent to those obtained using simple ratios.
Table V presents the scale-adjusted performance score of countries in terms of productivity (i.e., published output per unit of an R&D input indicator) for the three R&D input indicators that correlate the most with the number of publications of countries (i.e., HERD, the number of PhD graduates and the number of researchers in the higher education sector). The country that showed the strongest performance in terms of productivity when considering all three scale-adjusted indicators is Luxembourg. Indeed, the country ranks 2nd in terms of scientific output given the size of its population of PhD graduates and researchers in the higher education sector. It also has a good productivity performance given the size of its HERD. In other words, given the amount of financial and human resources (PhD graduates and researchers) it devoted to the higher education sector, Luxembourg managed to produce more scientific publications than would be expected, to a greater extent than most of the selected countries. Other countries that fared well include Russia, Slovenia, the Netherlands and Belgium. Among the countries that showed the weakest performance in terms of productivity are Latvia, Lithuania, Portugal, Estonia and Austria.

Analytical Report 2.3.2 Final Report
30
Table IV Scale-adjusted performance score of countries in terms of productivity (i.e., published output per unit of an R&D input indicator) for three R&D input indicators, 2000−2009
Note: Only countries for which data were available are included. The rankings based on the scale-adjusted incidator
were almost the same as those based on simple ratios for the number of PhD graduates and the number of researchers in the higher education sector. A score above one indicates a stronger performance than expected for the size of the input (e.g., for HERD), whereas a score below one indicates the opposite.
Source: Computed by Science-Metrix using Scopus (Elsevier) and Eurostat data
Country Score Rank Score Rank Score RankAustria 0.60 33 0.77 26 0.83 19Belgium 0.99 17 1.56 7 1.03 10Bulgaria 4.65 1 0.75 28 1.06 9China 3.04 3Croatia 1.38 10 1.41 9 0.84 18Cyprus 1.05 16 6.38 3 0.86 17Czech Republ ic 1.76 8 0.86 24 0.99 12Denmark 0.83 25 1.77 5 1.20 6Estonia 0.81 28 0.83 25 0.39 31Finland 0.89 23 0.89 23 1.00 11France 0.96 20 1.13 14 1.15 7Germany 0.99 18 0.63 30 0.94 13Hungary 1.38 11 0.98 19 0.54 26Iceland 0.47 36 7.91 1 0.58 24Ireland 0.91 22 1.05 18 0.92 15Ita ly 0.93 21 1.30 12 1.45 4Japan 0.81 27 1.34 11 0.72 22Latvia 0.51 35 0.76 27 0.14 34Liechtenstein 1.12 15Li thuania 0.65 32 0.59 31 0.24 33Luxembourg 1.64 9 6.63 2 1.99 2Macedonia 0.42 33Malta 0.53 34 2.03 4 0.28 32Netherlands 0.82 26 1.60 6 2.62 1Norway 0.76 30 1.47 8 0.76 20Poland 1.83 7 0.63 29 0.49 27Portugal 0.85 24 0.26 34 0.48 28Rep. of Korea 1.13 15 0.91 16Romania 2.42 5 0.21 35 0.57 25Russ ia 2.85 4 1.89 3Slovakia 3.07 2 0.47 32 0.41 30Slovenia 2.11 6 1.20 13 1.44 5Spain 1.19 14 0.93 21 0.65 23Sweden 0.77 29 0.91 22 0.93 14Switzerland 0.96 19 0.95 20 1.07 8Turkey 0.73 31 1.08 17 0.47 29United Kingdom 1.30 12 1.09 16 0.72 21United States 1.20 13 1.38 10
Publications/HERD Publications/PhD Graduates Publications/Researchers

Analytical Report 2.3.2 Final Report
31
The case of Luxembourg
Luxembourg was the country most often identified, by the robust regression technique, as an outlier with regards to R&D expenditures. To investigate this case in more detail, a robust regression analysis was performed between the number of publications of countries and their GERD, which combines three of the previous indicators on R&D expenditures (i.e., HERD, BERD and GOVERD). The regression was performed on the pooled dataset, as the estimation of the confidence interval on the slope is not important in this case.
Figure 4A shows the regression line between the log of the number of publications and the log of the GERD of countries. The robust regression technique identified 10 outliers in the dataset (highlighted in orange in Figure 4A), all of which belong to Luxembourg (i.e., one datapoint for each year in the 2000−2009 period). According to an ERAWATCH report on Luxembourg’s research system and policies, the country’s GERD is low relative to the EU27 (Alexander, 2008); it actually ranks 19th among EU27 member states). The current results indicate that its R&D output in terms of peer-reviewed publications, considering its GERD, is lower than would be expected based on the general pattern observed for the 42 selected countries.
Figure 4 Robust regression between the scientific output (number of publications [FRAC]) and GERD of countries (A) and trend in the publication output of Luxembourg (B), 2000−2009
Source: Computed by Science-Metrix using Scopus (Elsevier) and Eurostat data
When the analysis is performed independently on HERD, BERD and GOVERD, similar findings are observed for BERD and, to some extent, for GOVERD, but not for HERD (data not shown). In fact, with HERD, none of Luxembourg’s datapoints is an outlier. Thus, the lower productivity of Luxembourg in terms of its number of publications produced per currency unit (i.e., Euro) investment in R&D (based on the GERD, including all three sources), is not attributable to a higher education sector that is less efficient at converting R&D inputs into R&D outputs. In fact, Luxembourg ranks within the top 10 among selected countries for the size of its scientific output relative to HERD (see Table IV).
Since the business sector is less oriented than the higher education sector towards producing scientific publications, this observation is likely due to the stronger than usual contribution of the business sector—or, conversely, to the smaller than usual contribution of the higher education sector—to R&D expenditures in Luxembourg (see Figure 5A; Luxembourg’s datapoints are highlighted in orange).
Log(
Publ
icat
ions
)
Log(GERD)
Robust R2 = 0.95Slope = 0.82
A
Publ
icat
ions
Year
y = 9E-141e0.16x
R2 = 0.93
B

Analytical Report 2.3.2 Final Report
32
The case of Luxembourg (Continued)
For instance, Luxembourg has the largest average ratio of BERD to GERD (85%, as opposed to an average of about 54% for EU27 countries) and the lowest average ratio of HERD to GERD (3%, as opposed to an average of about 26% for EU27 countries) among the 42 selected countries for the 2000−2009 period.
Figure 5 Robust regression between the HERD and GERD of countries (A) and trend in the HERD of Luxembourg (B), 2000−2009
Source: Computed by Science-Metrix using Scopus (Elsevier) and Eurostat data
An investigation of the relationships between the R&D input indicators selected in this study and the GERD of countries also revealed that the size of Luxembourg’s population of researchers in the higher education sector, which is linked with HERD, contributes to its lower productivity in terms of its number of publications produced per currency unit (i.e., Euro) of overall investment in R&D. Indeed, Luxembourg systematically has fewer researchers in the higher education sector than would be expected given its overall expenditures in R&D (i.e., its GERD); all datapoints available for Luxembourg were identified as outliers, and they all fall below the regression lines between the number of researchers in the higher education sector and the GERD of countries (Figure 6A).
Figure 6 Robust regression between the number of researchers in the higher education sector and the GERD of countries (A) and trend in the number of researchers of Luxembourg (B), 2000−2009
Source: Computed by Science-Metrix using Scopus (Elsevier) and Eurostat data
Log(
HER
D)
Log(GERD)
Robust R2 = 0.96Slope = 0.89
A
HER
D
Year
B
Threefold increase in HERD between 2008 (13.2 millions of PPS at 2000 prices) and 2009 (40.2 millions)
Log(
Res.
in th
e H
ES)
Log(GERD)
Robust R2 = 0.84Slope = 0.67
A
Rese
arch
ers i
n th
e H
ES
Year
y = 1E-280e0.32x
R2 = 0.92
B

Analytical Report 2.3.2 Final Report
33
The case of Luxembourg (Continued)
In fact, Luxembourg’s lag appears to be stronger with respect to researchers in the higher education sector than with respect to HERD. Indeed, the most recent datapoint for the year 2009 is no longer an outlier for the latter indicator (compared to the former, for which all datapoints are outliers). Interestingly, the limited access to qualified researchers had previously been identified has a weakness of Luxembourg’s research system (Alexander, 2008).
This led, in the years 2000, to several policy actions aimed at resource mobilisation by the Luxembourg government. Among these was the creation of a national university in 2003, the opening of visas to researchers from new member states and the easing of requirements for issuing visas to other researchers (Alexander, 2008). These policies appear to have been effective, as Luxembourg’s population of researchers and its scientific production grew exponentially in 2000−2009 (Figure 4B and Figure 6B), in conjunction with a rapid growth in HERD (with a threefold increase seen between 2008 and 2009; Figure 5B). In fact, all three indicators experienced a stronger growth rate than Luxembourg’s GERD, which has been increasing linearly (data not shown). Although Luxembourg was the lowest ranked country in the EU27 in 2009 for the share of GERD allocated to the higher education sector (i.e., HERD), it came closer to the EU27 level of about 28% in 2009, having increased it from 0.2% in 2000 to 9% in 2009 (data not shown). Similarly, while it was the highest ranked country in the EU27 in 2009 for the share of GERD allocated to the business sector, its share declined significantly from 93% in 2000 to 74% in 2009, coming closer to the EU27 level of about 53%. In addition, among the datapoints for Luxembourg in Figure 4A, Figure 6A and Figure 6A, the most recent are also the closest to the regression line. Thus, it can safely be concluded that the research system in Luxembourg has begun to close the gap with the other countries of the ERA in terms of publication output.
3.1.2.3 Regression analysis for investigating the innovation capability of countries in relation to the size of their science base
The number of high-tech patent applications to the EPO is one of the four indicators (the others are the three VCI indicators) that are the least correlated with the number of publications. This is not surprising, as all four indicators are conceptually more related to the business sector, and thus to innovation, than to the higher education sector, which is clearly more oriented towards publishing research results. Nevertheless, the correlation between the number of publications and the number of high-tech patent applications to the EPO is still important (R = 0.84 based on group means to ensure the independence of observations) and statistically significant (p < 0.001).
Assuming a linear model of innovation whereby research occurs upstream of invention, a regression analysis was used to investigate whether the innovation capability of countries (i.e., the capacity to produce inventions from a given amount of research) increases (analogously to “economies of scale”), decreases (analogously to “diminishing returns”) or remains stable (i.e., isometric scaling) as the size of their science base increases. In this case, the number of pubications is the explanatory variable and the number of high-tech patent applications to the EPO is the response variable (Figure 7). Although the slope of the regression line is above 1, it cannot be concluded that the innovation capability of countries increases with the size of their science base, as the 95% confidence interval of the slope overlaps with the value of one, which is indicative of isometric scaling. Thus, based on the current results, it is not possible to reject the hypothesis that the innovation capability of countries increases linearly with the size of their science base. Given the small system size used for this analysis (N = 41 countries; data was missing for one of the selected countries), this finding should be considered preliminary and used with care.

Analytical Report 2.3.2 Final Report
34
Figure 7 Robust group mean regressions between the technological output (number of high-tech patent applications to the EPO) and the scientific output (number of publications [FRAC]) of countries, 2000−2009
Source: Computed by Science-Metrix using Scopus (Elsevier) and Eurostat data
Of course, both small and large countries can deviate from the general tendency of the system (i.e., from the regression line) as a result of various factors that may affect their research and innovation systems (e.g., resources, policies, culture). For example, Germany, which has one of the largest levels of scientific production (ranked 5th out of the 41 countries shown in Figure 7), ranks 7th for its ratio of patent applications to scientific publications, whereas Luxembourg, which has one of the smallest levels of scientific production (ranked 38th), ranks 4th for its ratio of patent applications to scientific publications. In the case of Luxembourg, divergence from the general tendency of the system is easily explained by the fact that it has, as shown above, a higher-than-usual share of its GERD allocated to the business sector. Thus, assuming a linear model of innovation, Luxembourg’s innovation may have relied heavily on the knowledge bases of other countries in the past. However, it was demonstrated above that the research system in Luxembourg has begun to close the gap with the other countries in the ERA in terms of publication output.
3.1.3 Regression analysis for investigating the productivity of NUTS2 regions in terms of publication output per unit of the most relevant R&D input indicators
Since data were only available for four R&D input indicators at the NUTS2 level (i.e., HERD, BERD, GOVERD, and the number of researchers in the higher education sector), the exploratory factor analysis was not performed again, and it was assumed that the four indicators were again highly collinear. Thus, to investigate the productivity of NUTS2 regions in terms of outputs (i.e., publications) per unit of these four R&D input indicators, the same approach was applied to the regions as that applied at the country level (see Section 3.1.2).
Log(
Publ
icat
ions
)
Log(High-tech patent applications to the EPO)
Robust R2 = 0.69Slope = 1.0895% CI = [0.82 - 1.35]

Analytical Report 2.3.2 Final Report
35
Again, there appear to be significant “diminishing returns” in terms of publication output with increases in BERD and GOVERD. “Diminishing returns” are also significant, although more moderate, in HERD at the NUTS2 level. Similarly to observations at the country level, “diminishing returns” are strongest with respect to BERD, followed by GOVERD and HERD (Figure 8). Finally, there are significant but moderate “economies of scale” in terms of publication output with respect to the number of researchers in the higher education sector (Figure 8). It should be noted that the R&D input indicators that have the strongest allometric relationship with the number of peer-reviewed publications are also those which explain the least variation in the scientific production of NUTS2 regions, namely BERD (robust R2 = 0.54) and GOVERD (robust R2 = 0.67). These variables are therefore less relevant to the analysis of the scientific output of NUTS2 regions; this is expected, given that they are less tightly linked, conceptually, with this type of output than HERD and the population of researchers in the higher education sector.
Figure 8 Robust group mean regressions between the scientific output (number of publications [FRAC]) of NUTS2 regions and selected R&D input indicators, 2000−2009
Source: Computed by Science-Metrix using Scopus (Elsevier) and Eurostat data
3.2 PUBLICATION PATTERNS OF COUNTRIES ACROSS SCIENTIFIC FIELDS
To investigate the factors behind the publication patterns of countries across scientific fields, the relationship between scientific concentration by research area (i.e., percentage of output by field) and concentration of the relevant R&D input indicators by research area (e.g., percentage of HERD by field) was investigated using regression analysis. The rationale behind this analysis is that if a country allocates 50% of its HERD to a given field, its should publish roughly 50% of its scientific output in the area. It should be noted that, as was observed above when all scientific fields were combined, the scientific output of countries (in its raw form; i.e., not expressed as a percentage) still correlates strongly with each of the R&D input indicators (in their raw form) for which data were available in each of the fields analysed.
Log(
Publ
icat
ions
)
Log(HERD)
Robust R2 = 0.86Slope = 0.8495% CI = [0.81 - 0.88]
Log(
Publ
icat
ions
)Log(Researchers in the HES)
Robust R2 = 0.82Slope = 1.0895% CI = [1.03 - 1.13]
Log(
Publ
icat
ions
)
Log(GOVERD)
Robust R2 = 0.67Slope = 0.6995% CI = [0.63 - 0.74]
Log(
Publ
icat
ions
)
Log(BERD)
Robust R2 = 0.54Slope = 0.5795% CI = [0.51 - 0.64]

Analytical Report 2.3.2 Final Report
36
Data on R&D input indicators were only available for the following fields of S&T (FOS; see OECD, 2002B):
Agricultural sciences Engineering and technology Medical and health sciences Natural sciences
These data were only available at the country level, and the amount of data was sufficient for analysis of only two R&D expenditure indicators, namely HERD and GOVERD, as well as the number of researchers in the higher education sector (the data covers the 2000−2009 period). HERD and the number of researchers in the higher education sector were among the most highly correlated with the scientific production of countries (see Section 3.1.1).
Data on the number of publications of countries for the above areas were available from the bibliometric data produced by Science-Metrix (2011) for DG Research (the data covers the 2000−2009 period). They were obtained by matching the four above areas, as defined in the revised FOS classification in the Frascati Manual (OCDE, 2007B), to the fields and subfields of science found in Science-Metrix’s ontology (http://www.science-metrix.com/OntologyExplorer). The match is as follows:
Agricultural sciences = Agriculture, Fisheries & Forestry (field level); Engineering and technology = Engineering (field level), plus the following subfields:
Computer Hardware & Architecture, Networking & Telecommunications, Energy, Materials, Nanoscience & Nanotechnology, Optoelectronics & Photonics, Architecture, Building & Construction;
Medical and health sciences = Biomedical Research, Clinical Medicine, and Public Health & Health Services (field level);
Natural sciences = Biology, Chemistry, Earth & Environmental Sciences, Mathematics & Statistics and Physics & Astronomy; plus the following subfields: Bioinformatics, Medical Informatics, Artificial Intelligence & Image Processing, Computation Theory & Mathematics, Distributed Computing, Information Systems, Software Engineering (field level).
For each area, the relationship between the concentration of output (% of a country’s publication) in the corresponding area and the concentration of each R&D input indicator (e.g., % of a country’s HERD) in the same area was investigated using regression analysis. Given that the structure of the dataset was the same as that used in Section 3.1.2, the regressions were fitted using a between-effects model, and the robust regression coefficients were estimated by means of S-estimators. It should be noted that the variables (which are proportions) are not log-transformed, as it was not required. Thus, regression coefficients in this section should not be interpreted in terms of isometric/allometric scaling. Additionally, a Pearson correlation coefficient was computed for each pair, and the significance of the correlation was assessed using a Bartlett test. Since the variables were not perfectly normal, a Spearman correlation coefficient was also computed.
Prior to performing the regression analysis, an EFA was performed using IPA factoring to study the correlation structure among the selected variables (i.e., proportion of papers, HERD, GOVERD and researchers in the higher educaton sector by field), combining all four areas in the analysis (i.e., each country has up to four datapoints per indicator and year; data not shown). This analysis indicated that a single factor was significant and explained 52% of the variance in the dataset. The concentration of HERD and the number of researchers in the higher education sector had the strongest factor loading with the first factor (correlation coefficient of, respectively, 0.93

Analytical Report 2.3.2 Final Report
37
and 0.95) and were followed by the concentration in the publication output (R = 0.55) and in the GOVERD (R = 0.22). This indicates collinearity between the concentrations of HERD and the number of researchers in the higher education sector. It also shows that these two variables are only moderately correlated with the concentration in the peer-reviewed scientific publications of countries, but to a greater extent than GOVERD. This is not surprising, as the former variables are more directly linked with this type of output than the latter variable.
Table V shows the result of the analysis of the relationship between the percentage of publications of countries in a given field and the percentage of their population of researchers in the higher education sector in the corresponding field for each of the four areas considered. The results indicate that a concentration of this type of human resources contributes, to a large extent, to explaining the pattern of publication of countries in the medical and health sciences, but not in the other areas. Indeed, more than 50% of variation in the level of concentration in number of publications across countries in the medical and health sciences can be accounted for by concentration in the number of researchers in the same area (R2 = 0.58). In this area, the concentration of output increases by one percentage point, with each additional percentage point in the concentration of input (regression coefficient = 0.91; 95% confidence interval = [0.55 – 1.27]).
Table V Robust group mean regressions between the concentration in the number of publications (FRAC) of countries and the corresponding concentration in their number of researchers in the higher education sector by field of science, 2000−2009
Source: Computed by Science-Metrix using Scopus (Elsevier) and Eurostat data
In the other areas, the statistics that were produced indicate that the relationship between these variables are subtle and do not adequately explain the observed patterns of variation. The absence of clear relationships between these variables is exemplified by looking at extreme cases of a high concentration of output combined with a low concentration of researchers, and vice-versa. For instance, Ireland and Norway each have a concentration of output that is above the average for the countries considered (i.e., 6.7% and 6.1%, respectively, compared to an average of 3.5%) but a concentration of researchers well below the average (i.e., 1.8% and 2.2%, respectively, compared to an average of 4.6%) in the agricultural sciences. On the other hand, Romania and Latvia each have a concentration of output well below the average for the countries considered (i.e., 0.3% and 1.6%, respectively, compared to an average of 3.5%) but a concentration of researchers near or above the average (i.e., 4.4% and 6.3%, respectively, compared to an average of 4.6%) in the area. In engineering and technology, Latvia and Cyprus have a concentration of output above the average (i.e., 35% and 32%, respectively, compared to an average of 24%), whereas their concentration of researchers is below the average (i.e., 16% and 14%, respectively, compared to an average of 22%). At the other end of the spectrum, Croatia and the Czech Republic have a concentration of output below the average (i.e., 16% and 17%, respectively, compared to an average of 24%), whereas their concentration of researchers
Spearman
Field of Science & Technology N Coef. p -value Coef. Coef. 95% Conf. Interval R2
Agricultural sciences 31 0.35 0.06 0.39 0.35 [0.07 - 0.64] 0.47Engineering and technology 31 0.45 0.01 0.24 0.18 [-0.01 - 0.38] 0.09Medical and health sciences 31 0.71 0.00 0.77 0.91 [0.55 - 1.27] 0.58Natural sciences 31 0.31 0.09 0.21 0.27 [-0.14 - 0.67] 0.23
Pearson Robust regression
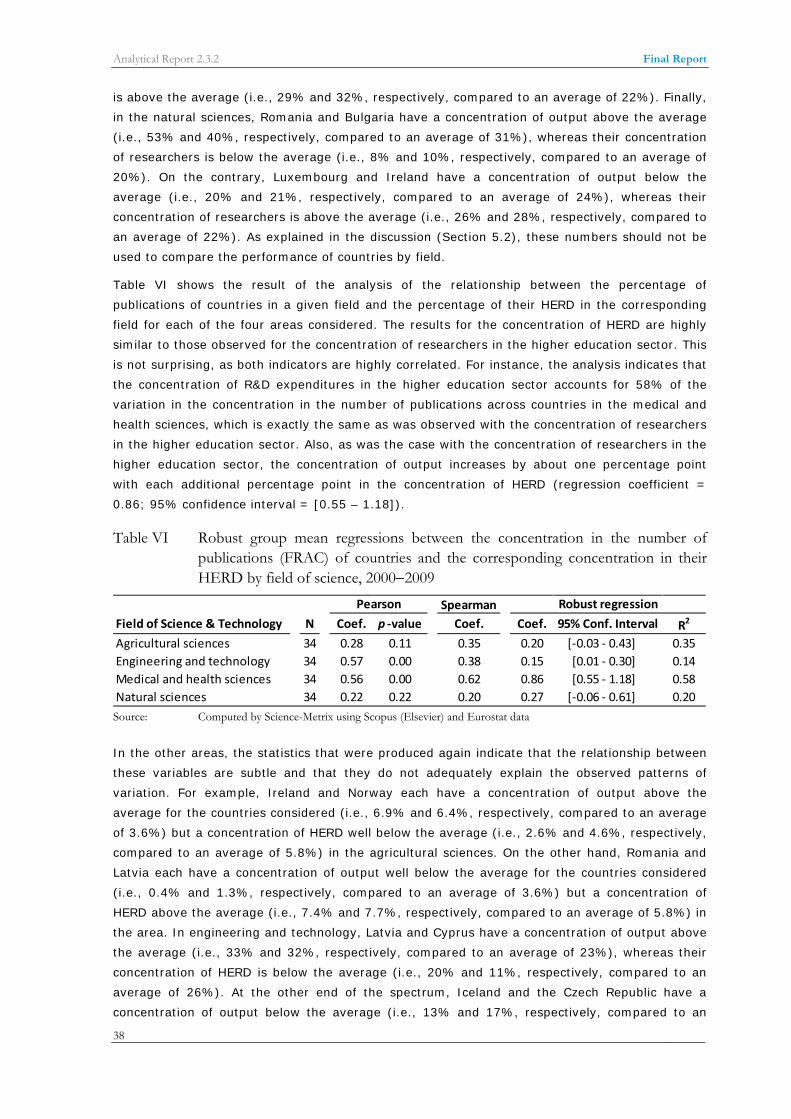
Analytical Report 2.3.2 Final Report
38
is above the average (i.e., 29% and 32%, respectively, compared to an average of 22%). Finally, in the natural sciences, Romania and Bulgaria have a concentration of output above the average (i.e., 53% and 40%, respectively, compared to an average of 31%), whereas their concentration of researchers is below the average (i.e., 8% and 10%, respectively, compared to an average of 20%). On the contrary, Luxembourg and Ireland have a concentration of output below the average (i.e., 20% and 21%, respectively, compared to an average of 24%), whereas their concentration of researchers is above the average (i.e., 26% and 28%, respectively, compared to an average of 22%). As explained in the discussion (Section 5.2), these numbers should not be used to compare the performance of countries by field.
Table VI shows the result of the analysis of the relationship between the percentage of publications of countries in a given field and the percentage of their HERD in the corresponding field for each of the four areas considered. The results for the concentration of HERD are highly similar to those observed for the concentration of researchers in the higher education sector. This is not surprising, as both indicators are highly correlated. For instance, the analysis indicates that the concentration of R&D expenditures in the higher education sector accounts for 58% of the variation in the concentration in the number of publications across countries in the medical and health sciences, which is exactly the same as was observed with the concentration of researchers in the higher education sector. Also, as was the case with the concentration of researchers in the higher education sector, the concentration of output increases by about one percentage point with each additional percentage point in the concentration of HERD (regression coefficient = 0.86; 95% confidence interval = [0.55 – 1.18]).
Table VI Robust group mean regressions between the concentration in the number of publications (FRAC) of countries and the corresponding concentration in their HERD by field of science, 2000−2009
Source: Computed by Science-Metrix using Scopus (Elsevier) and Eurostat data
In the other areas, the statistics that were produced again indicate that the relationship between these variables are subtle and that they do not adequately explain the observed patterns of variation. For example, Ireland and Norway each have a concentration of output above the average for the countries considered (i.e., 6.9% and 6.4%, respectively, compared to an average of 3.6%) but a concentration of HERD well below the average (i.e., 2.6% and 4.6%, respectively, compared to an average of 5.8%) in the agricultural sciences. On the other hand, Romania and Latvia each have a concentration of output well below the average for the countries considered (i.e., 0.4% and 1.3%, respectively, compared to an average of 3.6%) but a concentration of HERD above the average (i.e., 7.4% and 7.7%, respectively, compared to an average of 5.8%) in the area. In engineering and technology, Latvia and Cyprus have a concentration of output above the average (i.e., 33% and 32%, respectively, compared to an average of 23%), whereas their concentration of HERD is below the average (i.e., 20% and 11%, respectively, compared to an average of 26%). At the other end of the spectrum, Iceland and the Czech Republic have a concentration of output below the average (i.e., 13% and 17%, respectively, compared to an
SpearmanField of Science & Technology N Coef. p -value Coef. Coef. 95% Conf. Interval R2
Agricultural sciences 34 0.28 0.11 0.35 0.20 [-0.03 - 0.43] 0.35Engineering and technology 34 0.57 0.00 0.38 0.15 [0.01 - 0.30] 0.14Medical and health sciences 34 0.56 0.00 0.62 0.86 [0.55 - 1.18] 0.58Natural sciences 34 0.22 0.22 0.20 0.27 [-0.06 - 0.61] 0.20
Pearson Robust regression

Analytical Report 2.3.2 Final Report
39
average of 23%), whereas their concentration of HERD is above the average (i.e., 40% and 38%, respectively, compared to an average of 26%). Finally, in the natural sciences, Romania and Bulgaria have a concentration of output above the average (i.e., 54% and 40%, respectively, compared to an average of 31%), whereas their concentration of HERD is below the average (i.e., 15% and 17% compared to an average of 25%). On the contrary, Luxembourg and Ireland have a concentration of output below the average (i.e., 19% and 21%, respectively, compared to an average of 31%), whereas their concentration of HERD is near or above the average (i.e., 26% and 34%, respectively, compared to an average of 25%). Again, these numbers should not be used to compare the performance of countries by field (see Discussion, Section 5.2).
Table VII shows the result of the analysis of the relationship between the percentage of publications of countries in a given field and the percentage of their GOVERD in the corresponding field for each of the four areas considered. The results for the concentration of GOVERD indicates that it does not adequately explain the observed patterns of variation in the publication output of countries in any of the fields considered. Although the strength of the relationships between the scientific output of countries and their GOVERD were much larger when expressed in absolute terms (both overall and by field, data not shown), this finding is not as surprising as it was for HERD and the number of researchers in the higher education sector, as R&D output in the form of peer-reviewed publications is not as important in the government sector as it is in the education sector.
Table VII Robust group mean regressions between the concentration in the number of publications (FRAC) of countries and the corresponding concentration in their GOVERD by field of science, 2000−2009
Source: Computed by Science-Metrix using Scopus (Elsevier) and Eurostat data
SpearmanField of Science & Technology N Coef. p -value Coef. Coef. 95% Conf. Interval R2
Agricultural sciences 31 0.25 0.17 0.36 0.12 [0.06 - 0.17] 0.25Engineering and technology 31 0.38 0.03 0.10 -0.02 [-0.13 - 0.10] 0.04Medical and health sciences 31 0.33 0.07 0.27 0.45 [-0.17 - 1.07] 0.16Natural sciences 32 0.26 0.16 0.36 0.24 [0.05 - 0.43] 0.02
Pearson Robust regression

Analytical Report 2.3.2 Final Report
40
4 KEY FINDINGS OF THE CROSS-CUTTING ANALYSIS OF SCIENTIFIC OUTPUT VS. OTHER STI INDICATORS
This section provides an overview of the key findings of the Methods & Results section (Section 3). These findings relate to the two following aims of the study:
1. Examining the factors behind the publication outputs and productivity (i.e., the efficiency with which entities are converting research inputs into research outputs) of countries and NUTS2 regions, as revealed through an analysis of scientific production (Section 4.1); and
2. Examining the factors behind the production patterns of countries, as revealed through an analysis of scientific concentration (by research area), across scientific fields (Section 4.2).
In total, 17 R&D input indicators distributed across four categories (i.e., R&D Investment and Expenditure, Human Resources, Innovation and Research Infrastructures) were considered, although some were not available for analysing NUTS2 regions and the production pattern of countries by scienfic field. The bibliometric indicator that was used to improve the understanding of differences between countries’ and NUTS2 regions’ scientific output, productivity and concentration was the total number of publications as measured using Scopus. The dataset included 42 countries and 291 NUTS2 regions for which data were available, and the period covered by the dataset extended from 2000 to 2009.
4.1 PUBLICATION OUTPUT AND PRODUCTIVITY OF COUNTRIES AND NUTS2 REGIONS
Factor analysis was used to identify the main dimensions explaining the patterns of variation among selected STI indicators and the publication output of countries (Section 4.1.1), whereas regression analysis was used for investigating the productivity of countries and NUTS2 regions in terms of outputs (i.e., publications) per unit of the most relevant STI indicators (i.e., R&D input indicators) (Section 4.1.2 and 4.1.3). Section 4.1.2 also presents the results of a regression analysis aimed at investigating whether the innovation capability of countries (i.e., the capacity to produce inventions from a given amount of research) changes as the size of their science production increases.
4.1.1 Factor analysis for identifying the main dimensions (i.e., factors) among selected STI indicators and the publication output of countries
Exploratory Factor Analysis (EFA) was used to identify the most relevant STI indicators to study the patterns of variation in the publication output of countries.
After extensive analyses, of the 17 STI indicators, 13 were deemed relevant to the analysis. Twelve indicators are R&D input indicators useful for studying the productivity of countries and NUTS2 regions in terms of outputs (i.e., publications) per unit of an explanatory variable. They are distributed across three categories, as follows.
R&D Investment and Expenditure − HERD: Higher Education Expenditure on R&D; − GOVERD: Government intramural Expenditure on R&D; − BERD: Business Expenditure in R&D;

Analytical Report 2.3.2 Final Report
41
Human Resources − Researchers in the Higher Education Sector: Number of researchers (both
genders in all fields) in the higher education sector; − HRST with Tertiary Education: Number of human resources (both genders in all
fields; 15 to 74 years) in science and technology (HRST) with tertiary education (employed);
− PhD Students: Number of PhD students (both genders in all fields) participating in tertiary education (ISCED 97: Level 6);
− PhD Graduates: Number of PhD graduates (both genders in all fields) from tertiary education (ISCED 97: Level 6);
− Foreign Students in Tertiary Education: Number of foreign students (both genders in all fields) participating in tertiary education (ISCED 97: Levels 5 and 6);
Innovation − Employment in Technology and Knowledge-Intensive Sectors: Employment
in technology and knowledge-intensive sectors (all NACE activities; all occupations). − VCI (Expansion & Replacement): Venture Capital Investments (VCI) for
expansion & replacement stage; − VCI (Buyout): VCI for buyout; and − VCI (Early Stage): VCI for early stage.
The last indicator is another measure of R&D outputs and is useful for studying the innovation capability of countries as the size of their scientific output increases. It falls in the innovation category of indicators and is defined as follows:
− High-Tech Patent Applications to the EPO: Number of high-tech (total) patent applications to the EPO.
Based on EFA, the most relevant STI indicators as well as the selected R&D output indicator (i.e., the number of publications) could be adequately summarised using a single factor; a single variable (the primary factor) explained 83% of the variance in the dataset.
In fact, the 13 STI indicators presented above were highly correlated, although to a lesser extent in the case of VCI indicators and the number of high-tech patent applications to the EPO, with the number of peer-reviewed publications of countries (all correlation coefficients greater than 0.72, or greater than 0.89 if VCI indicators and that on patents are excluded); the 12 most relevant R&D input indicators are highly collinear.
4.1.2 Regression analysis for investigating the productivity of countries in terms of publication output per unit of the most relevant R&D input indicators
The results of a regression analysis on the productivity of countries in terms of outputs (i.e., publications) per unit of the most relevant STI indicators (i.e., R&D input indicators) are presented in Section 4.1.2.1. Based on this analysis, countries are ranked based on their scientific productivity (Section 4.1.2.2). Finally, the results of a regression analysis aimed at investigating whether the innovation capability of countries (i.e., the capacity to produce inventions from a given amount of research) varies as the size of their science base increases is presented in Section 4.1.2.3.
4.1.2.1 Economies and diseconomies of scale in scientific production
Although there is strong multicollinearity in the dataset (i.e., redundant information among the selected R&D input variables), there can exist slight differences in the way countries allocate R&D spending across sectors (e.g., higher education, government, private) and resources (e.g.,

Analytical Report 2.3.2 Final Report
42
human resources, infrastructure). It is therefore of interest to investigate how the publication output of countries scale relative to individual R&D input indicators. This was achieved through regression analysis.
“Diminishing returns”, whereby an increase in a production factor (i.e., an R&D input indicator), while holding all others constant, yields lower per-unit returns (i.e., peer reviewed publications per unit of the R&D input indicator), were observed with the following R&D input indicators: BERD, GOVERD and the number of students participating in a PhD program. It was also observed for VCI indicators, which is not surprising as two of these are captured in BERD.
“Economies of scale”, whereby an increase in a production factor (i.e., an R&D input indicator), while holding all others constant, yields higher per-unit returns (i.e., peer reviewed publications per unit of R&D input indicator), were observed with the following R&D input indicator: employment in technology and knowledge-intensive services, which includes the education sector and all occupations (i.e., professionals, technicians and other occupations).
4.1.2.2 Comparative analysis of the scientific productivity of countries
The performance of countries in terms of productivity (i.e., published output per unit of an R&D input indicator) was measured for the three R&D input indicators that correlate the most with the number of publications of countries (i.e., HERD, the number of PhD graduates and the number of researchers in the higher education sector).
The country that showed the strongest performance in terms of productivity when considering all three dimensions was Luxembourg.
Other countries that fared well included Russia, Slovenia, the Netherlands and Belgium.
Countries that showed the weakest performance in terms of productivity were Latvia, Lithuania, Portugal, Estonia, and Austria.
A case study on Luxembourg was performed, as it is the country most often identified as an outlier with regards to R&D expenditures. To study this case in more detail, an analysis was performed between the number of publications of countries and their GERD, which combines the three main categories of R&D expenditures (i.e., HERD, BERD and GOVERD).
Luxembourg is one of the least productive countries when taking into account all three sources of R&D expenditure (i.e., HERD, BERD and GOVERD).
The lower productivity of Luxembourg in terms of its number of publications produced per currency unit (i.e., euro) of GERD is not attributable to a higher education sector that is a less efficient at converting R&D inputs into R&D outputs.
In fact, Luxembourg ranks within the top 10 among selected countries for the size of its scientific output relative to HERD.
The weaker productivity of Luxembourg is most likely due to the stronger than usual contribution of the business sector (85% of GERD, compared to an average of 54% for EU27 countries) or, conversely, the smaller than usual contribution of the higher education sector (3% of GERD, compared to an average of 26% for EU27 countries) to GERD, as the former sector is less oriented towards publishing the results of scientific research.
Also, Luxembourg systematically has fewer researchers in the higher education sector than would be expected, given its GERD.
Analytical Report 2.3.2 Final Report
43
Recent actions taken by the Luxembourg government appear to have been effective in increasing its population of researchers, its HERD and its scientific production relative to its GERD.
Luxembourg has begun to close the gap with the other ERA countries in terms of publication output.
4.1.2.3 Regression analysis for investigating the innovation capability of countries in relation to the size of their science base
Assuming a linear model of innovation whereby research occurs upstream of invention, a regression analysis was used to investigate whether the innovation capability of countries (i.e., the capacity to produce inventions from a given amount of research) increases (analogously to “economies of scale”), decreases (analogously to “diminishing returns”) or remains stable (i.e., isometric scaling) as the size of their science base increases.
Based on this analysis, it is not possible to reject the hypothesis that the innovation capability of countries remains stable as the size of their science base increases.
Countries with both small or large production performed well in terms of their innovation capability.
Here, Luxembourg performs strongly, ranking 4th for its ratio of patent applications to scientific publications despite its very small scientific output (it is ranked 38th for its number of publications).
The strong performance of Luxembourg in this respect is easily explained by the fact that it has, as shown above, a higher than usual share of its GERD allocated to the business sector.
Thus, Luxembourg’s innovation may have relied more heavily on the knowledge bases of other countries in the past.
4.1.3 Regression analysis for investigating the productivity of NUTS2 regions in terms of publication output per unit of the most relevant R&D input indicators
Since data were only available for four R&D input indicators at the NUTS2 level (i.e., HERD, BERD, GOVERD and the number of researchers in the higher education sector), the EFA was not performed again, and it was assumed that the four indicators were again highly collinear. Thus, to investigate the productivity of NUTS2 regions in terms of outputs (i.e., publications) per unit of these four R&D input indicators, the same approach was applied as that used at the country level.
“Diminishing returns” in terms of publication output per unit of a given R&D input indicator are confirmed for BERD and GOVERD.
“Diminishing returns” appear to be stronger for BERD than GOVERD.
Whereas the scientific output appeared to scale linearly with HERD at the country level, moderate “diminishing returns” are confirmed at the NUTS2 level. Because the regression coefficient for HERD at the country level was below 1 (0.93) and its 95% confidence interval only slightly overlapped with the value of 1, indicative of isometric scaling, diminishing returns might have been confirmed at the country level given a larger system size.
“Diminishing returns” are strongest with respect to BERD, followed by GOVERD and HERD. The observed order in the intensity of “diminishing returns” in terms of publication output for these three R&D expenditure indicators does not come as a surprise, as the tradition to publish scientific results in peer-reviewed journals is strongest in the academic sector, followed by the government and private sectors. In fact, the private sector is oriented
Analytical Report 2.3.2 Final Report
44
towards development rather than research and secrecy as opposed to making results publicly available.
Regarding the number of researchers in the higher education sector, although the result at the country level did not indicate either “diminishing returns” or “economies of scale”, significant and moderate “economies of scale” are confirmed at the NUTS2 level. Because the latter result is based on a much larger sample size, it is considered more reliable.
From these findings, it seems that R&D expenditures indicators are associated with “diminishing returns” in terms of publication output, whereas some human resource indicators appear to be associated with “economies of scale”.
The results for the three expenditure indicators as well as for researchers in the higher education sector can be considered more reliable, as they could also be examined at the NUTS2 level with better sample sizes. This is due to the fact that the NUTS2 system is larger than the country system at the European level (i.e., there are more NUTS2 regions than countries within the ERA), such that there are more datapoints at the NUTS2 level to study the European system. Given the small system sizes used for the remaining indicators, the findings should be considered preliminary and used with care.
4.2 PUBLICATION PATTERNS OF COUNTRIES ACROSS SCIENTIFIC FIELDS
To investigate the variations in publication patterns of countries across scientific fields, the relationship between scientific concentration by research area (i.e., percentage of output by field) and the concentration of the relevant R&D input indicators, again by research area (e.g., percentage of HERD by field), a regression analysis was performed.
Data on R&D input indicators were only available for the following fields of science and technology:
Agricultural sciences Engineering and technology Medical and health sciences Natural sciences
These data were only available at the country level, and a sufficient amount of data for analysis was only available for two R&D expenditure indicators, namely HERD and GOVERD, as well as the number of researchers in the higher education sector.
For each area, the relationship between the concentration of output (% of a country’s publication) in the corresponding area and the concentration of each R&D input indicator (e.g., % of a country’s HERD) in the same area was investigated using regression analysis. The findings are as follows:
The concentration of researchers and R&D expenditures in the higher education sector accounted for 58% of the variance in the concentration of publications across countries in the medical and health sciences.
In the medical and health sciences, where the relationship is the strongest, the concentration of output increases by one percentage point with each additional percentage point in the concentration of input for both R&D input indicators (i.e., the number of researchers in the higher education sector and HERD).
In the other areas, the statistics that were produced indicate that the relationship between these variables (i.e., the number of researchers in the higher education sector and HERD) are subtle and that they do not adequately explain the observed patterns of variation.

Analytical Report 2.3.2 Final Report
45
These results are astonishing, as the number of researchers in the higher education sector and HERD (in their raw form, not expressed as percentages) explained much of the variation in the number of peer-reviewed publications of countries (in its raw form) when all fields were combined, as well as within each of the fields. Refer to Section 5.2 for a discussion of hypotheses that could explain these findings.
The results for the concentration of GOVERD indicates that it does not adequately explain the observed patterns of variation in the publication output of countries in any of the fields considered. As R&D output in the form of peer-reviewed publications is not as important in the government sector as it is in the education sector, this finding is not as surprising as it was for HERD and the number of researchers in the higher education sector.

Analytical Report 2.3.2 Final Report
46
5 DISCUSSION
An important aspect of the assessment of R&D performance that is often overlooked in bibliometric studies is the link between R&D inputs and outputs, such as papers and patents. For instance, bibliometric indicators do not inform on the driving factors that make some countries/regions more efficient in certain scientific domains. This report adds a highly meaningful level of analysis to the bibliometric data collected so far for the European Commission’s Directorate-General for Research & Innovation (DG Research) by performing a cross-cutting analysis of scientific output versus other STI indicators, such as R&D investments. This study’s main objectives were to investigate:
3. the factors behind the publication outputs and productivity (i.e., the efficiency with which entities are converting research inputs into research outputs) of countries/regions, as revealed through an analysis of scientific production (Section 5.1); and
4. the factors behind the production patterns of countries, as revealed through an analysis of scientific concentration (by research area), across fields of science (Section 5.2).
In total, 17 R&D input indicators distributed across four categories (i.e., R&D Investment and Expenditure, Human Resources, Innovation and Research Infrastructures) were considered, although some were not available for analysing NUTS2 regions and the production patterns of countries by scientific field. The bibliometric indicator that was used to improve the understanding of differences between countries’ and NUTS2 regions’ scientific output, productivity and concentration was the total number of publications, as measured using Scopus. The dataset included 42 countries (i.e., ERA countries plus a few comparables) and 291 NUTS2 regions for which data were available, and the period covered by the dataset extended from 2000 to 2009.
5.1 PUBLICATION OUTPUT AND PRODUCTIVITY OF COUNTRIES AND NUTS2 REGIONS
Factor analysis was used to identify the main dimensions explaining the patterns of variation among selected STI indicators and the publication output of countries (Section 5.1.1), whereas regression analysis was used for investigating the productivity of countries and NUTS2 regions in terms of outputs (i.e., publications) per unit of the most relevant STI indicators (i.e., R&D input indicators) (Section 5.1.2). Section 5.1.2 also presents the results of a regression analysis aimed at investigating whether the innovation capability of countries (i.e., the capacity to produce inventions from a given amount of research) changes as the size of their science production increases.
5.1.1 Factor analysis for identifying the main dimensions (i.e., factors) among selected STI indicators and the publication output of countries
Exploratory Factor Analysis (EFA) was used to identify the most relevant STI indicators for studying the patterns of variation in the publication output of countries. After extensive analyses, it was found that 15 of the selected indicators could be adequately summarised using a single factor; a single variable (the primary factor) explained 83% of the variance in the dataset. The high level of multicollinearity observed in the dataset does not come as a surprise, as all of the indicators considered are, to varying extent, intrinsically linked with the total R&D expenditures of countries (i.e., GERD). Indeed, as a country increases its investment in R&D, it is likely to gain more resources (e.g., human resources, infrastructure) in S&T, such that other STI indicators are expected to correlate positively with the GERD. Of course, countries may differ in the way they
Analytical Report 2.3.2 Final Report
47
allocate R&D spending across sectors (e.g., higher education, government, private), resources (e.g., human resources, infrastructure) and fields (e.g., natural sciences, engineering and technology), creating variations in the strength and slope of the relationships between the GERD and each of the selected STI indicators. Consequently, even though there is strong multicollinearity in the dataset (i.e., redundant information among the selected STI indicators), an investigation of the relationship between individual STI indicators and the publication output of countries and NUTS2 regions can shed light on the complex factors that make some countries more efficient at converting R&D inputs into outputs.
Thirteen of the 17 selected indicators were deemed relevant to the subsequent analysis of countries’ and NUTS2 regions’ publication output. Twelve of these are R&D input indicators that can be used to study the productivity of countries and NUTS2 regions in terms of outputs (i.e., publications) per unit of an explanatory variable. They are distributed across three categories and are as follows:
R&D Investment and Expenditure HERD: Higher Education Expenditure on R&D; GOVERD: Government intramural Expenditure on R&D; BERD: Business Expenditure in R&D;
Human Resources Researchers in the Higher Education Sector: Number of researchers (both genders in all
fields) in the higher education sector; HRST with Tertiary Education: Number of human resources (both genders in all fields; 15
to 74 years) in science and technology (HRST) with tertiary education (employed); PhD Students: Number of PhD students (both genders in all fields) participating in tertiary
education (ISCED 97: Level 6); PhD Graduates: Number of PhD graduates (both genders in all fields) from tertiary
education (ISCED 97: Level 6); Foreign Students in Tertiary Education: Number of foreign students (both genders in all
fields) participating in tertiary education (ISCED 97: Levels 5 and 6);
Innovation Employment in Technology and Knowledge-Intensive Sectors: Employment in
technology and knowledge-intensive sectors (all NACE activities; all occupations). VCI (Expansion & Replacement): Venture Capital Investments (VCI) for expansion &
replacement stage; VCI (Buyout): VCI for buyout; and VCI (Early Stage): VCI for early stage.
The last indicator is another measure of R&D outputs and is useful for studying the innovation capability of countries as the size of their scientific output increases. It falls in the innovation category of indicators and is defined as follows:
High-Tech Patent Applications to the EPO: Number of high-tech (total) patent applications to the EPO.

Analytical Report 2.3.2 Final Report
48
5.1.2 Regression analysis for investigating the productivity of countries and NUTS2 regions in terms of publication output per unit of the most relevant R&D input indicators
This section first discusses the results of a regression analysis aimed at investigating the productivity of countries in terms of outputs (i.e., publications) per unit of the most relevant STI indicators (i.e., R&D input indicators) (Section 5.1.2.1). Based on this analysis, it subsequently ranks countries based on their scientific productivity (Section 5.1.2.2). Finally, the section ends with a discussion of the results of a regression analysis aimed at investigating whether the innovation capability of countries (i.e., the capacity to produce inventions from a given amount of research) varies as the size of their science base increases (Section 5.1.2.3).
5.1.2.1 Economies and diseconomies of scale
The cross-linking of R&D inputs with outputs from an econometric perspective has increased in the past decades, as governments operate on increasingly tight budgets and seek ways to maximise returns on investments, particularly as accountability for public spending has become a primary issue for residents who expect to get the most value for their tax dollars (OECD, 2008). Most studies of economies and diseconomies of scale in scientific production have been performed with a view to providing evidence-based policy advice that will improve the allocation and management of resources in the research sector, with the ultimate goal of improving efficiency (i.e., productivity) (Bonaccorsi and Daraio, 2005). These studies have used various methods to measure research productivity in S&T systems, including regression analysis (e.g., the knowledge production function, as in Griliches, 1979) and the production frontier approach (i.e., Stochastic Frontier Analysis [SFA] and Data Envelopment Analysis [DEA]), at a number of units of analysis, from the organisational level (Pandit, Wasley and Zach, 2009; Xia and Buccola, 2005) to the country level (Meng, et al., 2006; Rousseau and Rousseau, 1997; Sharma and Thomas, 2008; Wang and Huang, 2007).
This study adds to the growing knowledge base on the factors behind the scientific productivity (i.e., the efficiency with which entities are converting research inputs into research outputs) of countries and NUTS2 regions by reporting on the results of a regression analysis performed using the most comprehensive dataset on STI indicators that is currently available at the national and regional levels for the ERA.
In investigating the impact of individual R&D input indicators on the production of countries and NUTS2 regions (i.e., the output variable), it was necessary to determine whether two variables scale linearly (i.e., an isometric pattern, wherein there is no change in the ratio, productivity, as one variable increases) or whether one variable scales exponentially relative to the other (i.e., an allometric pattern, wherein there is a change in ratio, productivity, as one variable increases). Allometry was investigated using log-log linear regressions. When the slope of the regression line was significantly smaller than 1, it was concluded that there were “diminishing returns”, whereby an increase in a factor of production (i.e., an R&D input indicator), while holding all others constant, yielded lower per-unit returns (i.e., peer-reviewed publications per unit of the R&D input indicator). Alternatively, when the slope of the regression line was significantly greater than 1, it was concluded that there were “economies of scale” whereby an increase in a factor of production (i.e., an R&D input indicator), while holding all others constant, yielded higher per-unit returns (i.e., peer-reviewed publications per unit of the R&D input indicator). When the 95%

Analytical Report 2.3.2 Final Report
49
confidence interval of the slope overlapped with the value of 1, it was concluded that there was no significant allometric scaling.
Economies of scale in terms of publication output at the country level were observed with employment in technology and knowledge-intensive services, which includes the education sector and all occupations (i.e., professionals, technicians and other occupations). Regarding the number of researchers in the higher education sector, the result at the country level suggested isometric scaling. However, there appears to be moderate economies of scale in terms of publication output, as the number of researchers in the higher education sector increases at the NUTS2 regional level. Since the latter result is based on a much larger system (i.e., there are more NUTS2 regions than countries within the ERA), it is considered more reliable (no data were available for employment in technology and knowledge-intensive services at the NUTS2 level).
Potential mechanisms for explaining the increased productivity of human capital (i.e., employment in technology and knowledge-intensive services and researchers in the higher education sector) as a country’s or NUTS2 region’s pool of human resources increases include, for example, the diversification and sharing of complementary expertise and competencies, as well as an increase in the specialisation and division of labour. Bonaccorsi and Daraio (2005) also found preliminary evidence of economies of scale as the size of teams in laboratories increases. In terms of policy implications, the authors asserted that specific policies regarding the growth of laboratories within institutions would be required if economies of scale were to be realised through the creation of mega organisations. This is because the relevant unit through which the mechanisms behind economies of scale would operate, with respect to human resources, is the laboratory.
Significant diminishing returns in terms of publication output were observed for five out of six R&D input indicators related to expenditures (i.e., GOVERD, BERD and all three VCI indicators). Diminishing returns appear to be stronger with the VCI indicators followed by BERD and GOVERD, whereas there appears to be isometric scaling with HERD. However, diminishing returns are also likely with respect to HERD. Indeed, the slope for HERD at the country level was below 1 (i.e., 0.93), with the 95% confidence intervals only slightly overlapping the value of 1, indicative of isometric scaling. In addition, diminishing returns with respect to HERD, as well as for BERD and GOVERD, were confirmed at the level of NUTS2 regions; no data were available for VCI indicators at this aggregation level). Again, diminishing returns appeared strongest with respect to BERD, followed by GOVERD and HERD.
The observed order in the intensity of diminishing returns in terms of publication output for BERD, GOVERD and HERD does not come as a surprise, as the tradition to publish scientific results in peer-reviewed journals is strongest in the academic sector, followed by the government and private sectors. In fact, the private sector is mostly oriented towards development rather than research, and there are stronger incentives to keep results secret. The fact that the regression coefficients for the VCI indicators are closer to that of BERD than to those of GOVERD and HERD is not unexpected, as both early- and expansion- stage venture capital are captured in BERD, making them somewhat redundant with this indicator.
A potential mechanism for explaining the observed reduction in the productivity of countries and NUTS2 regions in terms of publications produced per euro investment in R&D would be that the number of researchers of a given entity (i.e., its units of production) does not increase as rapidly as its financial resources; the maximum production capacity of a an entity’s researchers would therefore be reached in spite of increasing financial resources. Interestingly, the population of researchers in the higher education sector was shown to scale less rapidly than GERD (see

Analytical Report 2.3.2 Final Report
50
Luxembourg’s case study, Section 3.1.2) and HERD (data not shown) at the NUTS2 level. A rationale for awarding smaller grants to a larger population of researchers logically follows from this explanation in order to increase the productivity of a given entity as the size of its financial resources increases. However, research teams operating on larger budgets are more likely to carry out projects that could not be conducted with less financial resources (e.g., the Human Genome Project [HGP]). Although the cost of publications produced from such projects likely exceeds that of publications produced by less expensive projects, they likely impact a much larger community. In turn, these publications are likely to have a higher scientific impact (as measured by citations), such that entities with larger R&D expenditures might generally have a higher scientific impact per euro investment in R&D. In fact, Hung, Lee, and Tsai (2009) found that human capital carries more weight in terms of the quantity of academic research, whereas capital accumulation plays a more important role in the citation impact of academic research. Future research efforts will look at how citations scale relative to HERD at the country and NUTS2 levels to test the above hypothesis.
The publication output of countries may also show very slight diminishing returns with respect to one of the selected R&D input indicators in the human resource category, namely the number of students participating in a doctoral program. A hypothesis that could potentially explain diminishing returns as the size of a population of PhD students increases would be a concomitant decrease in the amount of researchers per student if the population of PhD students scales more rapidly than the population of researchers in the higher education sector. Indeed, if students receive, on average, less supervision from their thesis director, it seems likely that fewer students would successfully publish the results of their research. However, based on the data analysed in this study, the population of PhD students appears to scale at about the same rate as the population of researchers in the higher education sector (i.e., regression coefficient = 1.03 and 95% confidence interval = [0.87 – 1.19], graph not shown).
Within the research policy context, any attempt at increasing the productivity of a country or region should take account of the complex interplay between the many factors that contribute to their efficiency, such as the country’s or region’s characteristics (e.g., funding schemes and disciplinary portfolios) and development stages (Leydesdorff and Wagner, 2009). For instance, Archambault and Larivière (2010) showed that the average cost per publication was higher in the basic medical sciences compared to the humanities. Thus, if a larger share of its R&D budget is allocated to the humanities, a country might exhibit stronger productivity in terms of publications per dollar investment in R&D but lesser productivity in terms of received citations per dollar investment in R&D than another country.
5.1.2.2 Comparative analysis of the scientific productivity of countries
Countries undoubtedly vary in regards to the efficiency with which they transform R&D inputs into scientific publications. Using the log-log regressions used in analysing economies and diseconomies of scale, scale-adjusted indicators of scientific productivity were computed for the three R&D input indicators that showed the strongest correlation with the number of publications of countries (i.e., HERD, number of PhD graduates and number of researchers in the higher education sector).
When all three dimensions were considered, the country that showed the strongest performance in terms of productivity was Luxembourg. On the other hand, Luxembourg did not perform well at all in terms of publication ouput in relation to GERD, which covers BERD, GOVERD and HERD. A case study on Luxembourg was performed, as it is the country most often identified as an outlier with regards to R&D expenditures. The results indicated that the outlying behavior of Luxembourg is attributable to a larger than usual share of BERD within its total R&D expenditures. Thus, in

Analytical Report 2.3.2 Final Report
51
spite of the smaller than usual share of its total R&D expenditures that is allocated to the higher education sector (i.e., HERD), it has a good level of productivity given the absolute size of its HERD. In addition, the study’s findings indicate that recent actions taken by the Luxembourg government appear to have been effective in increasing its population of researchers, its HERD and its scientific production relative to its GERD. Thus, Luxembourg has clearly begun to close the gap with the other countries of the ERA in terms of publication output.
Countries that fare well in terms of productivity based on the above three measures also included Russia, Slovenia, the Netherlands and Belgium. Countries that showed the weakest performance in terms of productivity were Latvia, Lithuania, Portugal, Estonia and Austria.
5.1.2.3 Regression analysis for investigating the innovation capability of countries in relation to the size of their science base
Assuming a linear model of innovation whereby research occurs upstream of invention, a regression analysis was used to investigate whether the innovation capability of countries (i.e., the capacity to produce inventions from a given amount of research) increases (analogously to “economies of scale”), decreases (analogously to “diminishing returns”) or remains stable (i.e., isometric scaling) as the size of their science base increases. In this case, the number of publications is the explanatory variable and the number of high-tech patent applications to the EPO is the response variable.
Based on this analysis, it is not possible to reject the hypothesis that the innovation capability of countries remains stable as the size of their scientific production increases. Countries with both small or large levels of production performed well in terms of their innovation capability. Here, Luxembourg’s performance is strong, as it ranks 4th for its ratio of patent applications to scientific publications despite its very small scientific output (it is ranked 38th for its number of publications). The strong performance of Luxembourg in this respect is easily explained by the fact that it has, as shown above, a higher than usual share of GERD allocated to the business sector. Therefore, Luxembourg’s innovation may have relied more heavily on the knowledge bases of other countries in the past. However, the high efficiency of Luxembourg in converting knowledge into innovation might decrease in the future, given its rising HERD and scientific output in combination with its stable BERD.
5.2 PUBLICATION PATTERNS OF COUNTRIES ACROSS SCIENTIFIC FIELDS
To investigate the factors behind the publication patterns of countries across scientific fields, the relationship between scientific concentration by research area (i.e., percentage of output by field) and concentration of the relevant R&D input indicators by research area (e.g., percentage of HERD by field) was investigated using regression analysis. The rationale behind this analysis is that if a country allocates 50% of its HERD to a given field, its should publish roughly 50% of its scientific output in this area.
The analyses could be performed for countries using three R&D input indicators (i.e., HERD, GOVERD, and the number of researchers in the higher education sector) for the following fields of science and technology (FOS; see OECD, 2002B):
Agricultural sciences Engineering and technology Medical and health sciences Natural sciences
Analytical Report 2.3.2 Final Report
52
The results show that the concentrations of researchers and R&D expenditures in the education sector by field of science do not explain the concentration of peer-reviewed publications by field of science in three out of the four areas considered; they explain only about 60% of the variation in the concentration of peer-reviewed publications in the medical and health sciences. This comes as a surprise, as these R&D input indicators (in their raw form; i.e., not expressed as percentages) explained much of the variation in the number of peer-reviewed publications of countries (in its raw form) when all fields were combined, as well as within each of the fields. The absolute amount of publications produced by a country is highly dependent on the absolute amount of money it spends on R&D, as well as on the absolute size of its population of researchers in the higher education sector irrespective of the field. However, the current results indicate that the concentration of a country’s scientific output in a given field and its specialisation in the given field cannot easily be predicted based on its percentage of HERD or its population of researchers in the higher education sector that is allocated to the given field.
It is difficult to explain such findings, as they are counterintuitive. Other factors besides the concentration in HERD and in the population of researchers in the higher education sector can probably explain the patterns of variation in the concentration of R&D outputs by scientific field, such as differences in the publication habits of researchers across fields and/or countries. For example, it is well known that conference proceedings are used proportionately more frequently by researchers in engineering, in particular in the computer sciences, than in the natural sciences or the medical and health sciences, which rely more heavily on journal articles to disseminate the results of scientific research (Lisée, et al., 2008). Because the publication outputs of countries were measured using Scopus, which has a coverage of conference proceedings that is not as comprehensive as its coverage of journal articles, variations across countries in the use and coverage of conference proceedings in engineering could create distortions in the relationships between the concentration of R&D inputs and outputs. Not only would these alterations affect the field of engineering, they would also likely impact other areas, as an underestimation of the percentage of outputs in a given field must be balanced out by a concomitant overestimation in other areas (i.e., the sum of percentages across fields cannot exceed 100%).
A good example of disparities that could potentially be explained by the above hypothesis is the very low ratio of the concentration of output to that of HERD in engineering and technology in Iceland (0.32) compared to the average for the countries considered (0.87). This is counterbalanced by Iceland’s larger than usual ratio in the medical and health sciences (i.e., 4.8 compared to an average of 2). However, it seems unlikely that only one factor could create disparities as strong as those observed. Since the accuracy of most indicators increases as the size of the system being measured increases, the selected indicators may carry more noise at the field level, especially for smaller countries. As many of the strongest departures from the average behaviour in the ratio of the concentration of output to that of input were observed for small countries, noise may create potential distortions. Given the likelihood that various factors created noise in the relationships between scientific concentration by research area and concentration in the above input indicators, the results of the current study should not be used to compare the performance (e.g., in terms of productivity) of countries by scientific field. Clearly, more data and research are needed to interpret this study’s observations at the field level.

Analytical Report 2.3.2 Final Report
53
Acknowledgments
The authors are grateful to Matthieu Delescluse and Carmen Marcus of DG research as well as to Grégoire Côté and Guillaume Roberge of Science-Metrix for their thoughtful comments and advices.

Analytical Report 2.3.2 Final Report
54
References
Alexander, S. (2008). ERAWATCH Country Report 2008: An assessment of research system and policies, Luxembourg. European Commission’s Joint Research Center-Institute for Prospective Technological Studies Scientific and Technological Reports. 42 pages. Retrieved from http://erawatch.jrc.ec.europa.eu/erawatch/export/sites/default/galleries/migration_files/JRC51068LU.pdf
Archambault, É., and Larivière, V. (2010). Individual researchers’ research productivity: a comparative analysis of counting methods. Book of Abstracts of the 11th International Conference on Science and Technology Indicators, pp. 22-24.
Benavente, J. M., Crespi, G., & Maffioli, A. (2007). The impact of national research funds: An evaluation of the Chilean FONDECYT. Office of Evaluation and Oversight Working Paper No. OVE/WP-03/07. Retrieved from http://www.iadb.org/intal/intalcdi/PE/2009/03161.pdf
Bonaccorsi, A. (2005). Search regimes and the industrial dynamics of science. Minerva, 46(3), 285–315.
Bonaccorsi, A., and Daraio, C. (2005) Exploring Size and Agglomeration Effects on Public Re-search Productivity. Scientometrics, 63, 87-120.
Bonaccorsi, A. (2009). Linking industrial competitiveness, R&D specialisation and the dynamics of knowledge in science: A look at remote influences. In D. Pontikakis, D. Kyriakou, & R. van Bavel (Eds.), The question of R&D specialisation: Perspectives and policy implications (pp. 45-52). European Commission’s Joint Research Center-Institute for Prospective Technological Studies Scientific and Technological Reports. Retrieved from http://ftp.jrc.es/EURdoc/JRC51665.pdf
Cooke, J., Booth, A., Nancarrow, S., & Wilkinson, A. (2006). Re:Cap—Identifying the evidence base for research capacity development in health and social care. Paper commissioned by the National Coordinating Centre for Research Capacity Development, in collaboration with the National Research and Development Support Units Network Steering Group. Retrieved from http://www.rdinfo.org.uk/rds/Downloads/RECAP.pdf
Coombs, R., Harvey, M., & Tether, B. (2001). Analysing distributed innovation processes. Industrial and Corporate Change, 12(6), 1125–1155.
Cooke, P. (2009). The knowledge economy, spillovers, proximity and specialisation. In D. Pontikakis, D. Kyriakou, & R. van Bavel (Eds.), The question of R&D specialisation: Perspectives and policy implications (pp. 29-40). European Commission’s Joint Research Center-Institute for Prospective Technological Studies Scientific and Technological Reports. Retrieved from http://ftp.jrc.es/EURdoc/JRC51665.pdf
Costello, A.B. & Osborne J.W. (2005). Best Practices in Exploratory Factor Analysis: Four Recommendations for Getting the Most From Your Analysis. Practical Assessment, Research & Evaluation, 10(7). Available online: http://pareonline.net/getvn.asp?v=10&n=7.
Crespi, G., & Guena, A. (2004). The productivity of science: A cross-country analysis. Paper presented at DRUID Summer Conference 2004 on Industrial Dynamics, Innovation and Development, Elsinore, Denmark, June 14-16, 2004. Retrieved from http://www2.druid.dk/conferences/viewpaper.php?id=2357&cf=16

Analytical Report 2.3.2 Final Report
55
Edler, J., & Flanagan, K. (2011). Indicator needs for the internationalisation of science policies. Research Evaluation, 20(1), 7–17.
ERAWATCH Network. (2006). R&D specialisation: Methodology and data used. Retrieved from http://cordis.europa.eu/erawatch/index.cfm?fuseaction=intService.rdSpecialisation
Europe INNOVA/PRO INNO Europe. (2008). The concept of clusters and cluster policies and their role for competitiveness and innovation: Main statistical results and lessons learned. Europe INNOVA/PRO INNO Europe paper N° 9. Commission Staff Working Document SEC (2008) 2637. Retrieved from http://proinno.intrasoft.be/admin/uploaded_documents/2008.2494_deliverable_EN_web.pdf
European Cluster Alliance. (2009). The use of data and analysis as a tool for cluster policy. Retrieved from http://proinno.intrasoft.be/admin/uploaded_documents/GreenpaperECA_web.pdf
European Commission. (2007). Green Paper—The European Research Area: New perspectives. Retrieved from http://ec.europa.eu/research/era/pdf/era_gp_final_en.pdf
European Commission. (2008). A more research-intensive and integrated European Research Area: Science, Technology and Competitiveness key figures report, 2008/2009. Retrieved from http://ec.europa.eu/research/era/docs/en/facts&figures-european-commission-key-figures2008-2009-en.pdf
European Commission. (2009). Europe’s regional research systems: Current trends and structures. Retrieved from http://ec.europa.eu/research/era/docs/en/fact&figures-european-commission-regional-research-systems-2009.pdf
European Commission Expert Group. (2009). ERA indicators and monitoring: Expert Group report. Retrieved from http://ec.europa.eu/research/era/docs/en/facts&figures-expert-group-indicators&monitoring-eur24171-2009.pdf
European Union (2011). Innovation Union Competitiveness Report 2011. Retrieved from http://ec.europa.eu/research/innovation-union/index_en.cfm?section=competitiveness-report&year=2011
Eurostat. (2009). Science, technology and innovation in Europe. Statistical book produced by the European Commission. Retrieved from http://ec.europa.eu/research/evaluations/pdf/archive/fp7-evidence-base/statistics/eurostat_-_science,_technology_and_innovation_in_europe.pdf
Eurostat ERA News. (2009). EU R&D spending unchanged in 2007. Retrieved from http://cordis.europa.eu/fetch?CALLER=NEWS_ERA&ACTION=D&RCN=31223&DOC=1&CAT=NEWS&QUERY=4
Fabrigar, L.R., Wegener D.T., MacCallum R.C., Strahan E.J. (1999). Evaluating the Use of Exploratory Factor Analysis in Psychological Research. Psychological Methods, 4(3): 272-299.
Fernández-Zubieta, A., & Guy, K. (2010). Developing the European Research Area: Improving knowledge flows via researcher mobility. European Commission’s Joint Research Center-Institute for Prospective Technological Studies Scientific and Technological Reports. Retrieved from http://erawatch.jrc.ec.europa.eu/erawatch/export/sites/default/galleries/generic_files/JRC58917.pdf
Field, A.P. (2000). Discovering Statistics using SPSS for Windows. London – Thousand Oaks –New Delhi: Sage publications, 821 pages.

Analytical Report 2.3.2 Final Report
56
Foray, D. (2009). Understanding “smart” specialisation. In D. Pontikakis, D. Kyriakou, & R. van Bavel (Eds.), The question of R&D specialisation: Perspectives and policy implications (pp. 19-28). European Commission’s Joint Research Center-Institute for Prospective Technological Studies Scientific and Technological Reports. Retrieved from http://ftp.jrc.es/EURdoc/JRC51665.pdf
Freeman, C., & Soete, L. (2007). Developing science, technology and innovation indicators: What we can learn from the past. United Nations University Working Papers series #2007-001. Retrieved from http://www.merit.unu.edu/publications/wppdf/2007/wp2007-001.pdf
Gardiner, J.C., Luo Z., Roman L.A. (2009). Fixed effects, random effects and GEE: What are the differences? Statistics in Medicine, 28, 221–239.
Gault, F. (2011). Social impacts of the development of science, technology and innovation indicators. UNU-MERIT Working Papers 1871-9872. Retrieved from http://www.merit.unu.edu/publications/wppdf/2011/wp2011-008.pdf
Giannitsis, A. (2009). Towards an appropriate policy mix for specialisation. In D. Pontikakis, D. Kyriakou, & R. van Bavel (Eds.), The question of R&D specialisation: Perspectives and policy implications (pp. 63-70). European Commission’s Joint Research Center-Institute for Prospective Technological Studies Scientific and Technological Reports. Retrieved from http://ftp.jrc.es/EURdoc/JRC51665.pdf
Goschin, Z., Constantin, D. L., Roman, M., & Ileanu, B. (2009). Regional specialisation and geographic concentration of industries in Romania. South-Eastern Europe Journal of Economics, 1, 99-113. Retrieved from http://www.asecu.gr/Seeje/issue12/GOSCHIN.pdf
Griliches, Z. (1979). Issues in assessing the contribution of research and development to productivity growth. Bell Journal of Economics, 10, 92–116.
Grupp, H., Fornahl, D., Tran, C. A., Stohr, J., Schubert, T., et al. (2010). National specialisation and innovation performance: Final report. Paper produced for the Consortium Europe INNOVA Sectoral Innovation Watch. Retrieved from http://www.europe-innova.eu/c/document_library/get_file?folderId=386025&name=DLFE-11415.pdf
Hallet, M. (2000). Regional specialisation and concentration in the EU. Economic Papers series, DG-ECFIN, Nr. 141. Retrieved from http://ec.europa.eu/economy_finance/publications/publication_summary10532_en.htm
Ho, M. H. C. (2004). Differences between European regional innovation systems in terms of technological and economic characteristics. Paper of the Eindhoven Centre for Innovation Studies, the Netherlands. Retrieved from http://alexandria.tue.nl/repository/books/58725.pdf
Hung, W. C., Lee, L. C., & Tsai, M. H. (2009). An international comparison of relative contributions to academic productivity. Scientometrics, 81(3), 703-718.
Jacobs, J. (1969). The economy of cities. Random House, New York.
Jiménez-Sáez, F., Zabala, J. M., & Zofío, J. L. (2010). Who leads research productivity change? Guidelines for R&D policy-makers. Universidad Autónoma de Madrid Working Paper 7/2010. Retrieved from http://www.uam.es/departamentos/economicas/analecon/especifica/mimeo/wp20107.pdf
Jona-Lasinio, C., Iommi, M., & Manzocchi, S. (2011). Intangible capital and productivity growth in European Countries. INNODRIVE Working Paper No 10. Retrieved from

Analytical Report 2.3.2 Final Report
57
http://www.innodrive.org/attachments/File/workingpapers/Innodrive_WP_10_JonaIommiManzocchi2011.pdf
Katz, J. S. (2000). Scale independent indicators and research assessment. Science and Public Policy, 27: 23–36.
Klitkou, A., & Kaloudis, A. (2007). Scientific versus economic specialisation of business R&D: The case of Norway. Research Evaluation, 16(4), 283–298.
Kyriakou, D. (2009). Introduction. In D. Pontikakis, D. Kyriakou, & R. van Bavel (Eds.), The question of R&D specialisation: Perspectives and policy implications (pp. 11-18). European Commission’s Joint Research Center-Institute for Prospective Technological Studies Scientific and Technological Reports. Retrieved from http://ftp.jrc.es/EURdoc/JRC51665.pdf
Laurens, P. & Asikainen, A. L. (2010). STI specialization in small European countries. Poster presented at the STI Indicators Conference 2011, September 7, 2011, Rome. Retrieved from http://www.enid-europe.org/conference/poster%20pdf/Laurens_specialisation_abstract.pdf).
Laursen, K. & Salter, A. (2005). The fruits of intellectual production: Economic and scientific specialisation among OECD countries. Cambridge Journal of Economics, 29(2), 289-308.
Lepori, B., Barré, R., & Filliatreau, G. (2008). New perspectives and challenges for the design and production of S&T indicators. Research Evaluation, 17(1), 2–3.
Leydesdorff, L., & Wagner, C. (2009). Macro-level indicators of the relations between research funding and research output. Journal of Informetrics, 3(4), 353–362.
Lisé, C., Larivière, V., & Archambault, É. (2008).Conference Proceedings as a Source of Scientific Information: A Bibliometric Analysis. Journal of the American Society for Information Science and Technology, 59(11): 1776–1784.
Lugones, G., & Suarez, D. (2010). Science, technology and innovation indicators for policymaking in developing countries: An overview of experiences and lessons learned. Note prepared for the United Nations Conference on Trade and Development Secretariat. Presented at the Multi-year Expert Meeting on Enterprise Development Policies and Capacity-building in Science, Technology and Innovation (STI), Geneva, January 20–22, 2010. Retrieved from http://innovacion.ricyt.org/files/UNCTAD.pdf
Meng, W., Hu, Z., & Liu, W. (2006). Efficiency evaluation of basic research in China. Scientometrics, 69(1), 85–101.
Organisation for Economic Co-operation and Development (OECD). (2002A). OECD science, technology and industry outlook 2002. page 103.
Organisation for Economic Co-operation and Development (OECD). (2002B). Frascati Manual: Proposed Standard Practice for Surveys on Research and Experimental Development. Retrieved from http://www.oecdbookshop.org/oecd/get-it.asp?REF=9202081e.pdf&TYPE=browse.
Organisation for Economic Co-operation and Development (OECD). (2007A). Science, technology and innovation indicators in a changing world: Responding to policy needs. Retrieved from http://www.micit.go.cr/encuesta/docs/textos/ocde_indicadores_de_ciencia_tecnologia_e_innovacion_en_mundo_en_cambio.pdf
Organisation for Economic Co-operation and Development (OECD). (2007B). Working Party of National Experts on Science and Technology Indicators: Revised Field of Science and Technology

Analytical Report 2.3.2 Final Report
58
(FOS) Classification in the Frascati Manual. Retrieved from www.uis.unesco.org/ScienceTechnology/Documents/38235147.pdf
Organisation for Economic Co-operation and Development (OECD). (2008). Performance Budgeting: A Users’ Guide. Policy Brief Retrieved from www.oecd.org/dataoecd/53/27/37704120.pdf
Organisation for Economic Co-operation and Development (OECD). (2010). Main Science and Technology Indicators, Volume 2010/1. Retrieved from http://www.oecd.org/dataoecd/52/43/43143328.pdf
Pandit, S., Wasley, C. E., & Zach, T. (2009). The effect of research and development (R&D) inputs and outputs on the relation between the uncertainty of future operating performance and R&D expenditures.
Peter, V., & Bruno, N. (2010). International science & technology specialisation: Where does Europe stand? Paper prepared for the European Commission by the Technopolis Group. Retrieved from http://ec.europa.eu/research/era/docs/en/4th-regional-key-figure.pdf
Pontikakis, D., Chorafakis, G., & Kyriako, D. (2011).Reflections of a dodo: The choice between specialisation and shifting capacity. Presentation at the conference Regional Innovation and Growth: Theory, Empirics and Policy Analysis, March 31-April 1, 2011, Pecs, Hungary. Retrieved from http://www.krti.ktk.pte.hu/files/tiny_mce/File/Konferencia/2011/Pontikakis.pdf
Reid, A., Denekamp, E., & Galvao, P. (2008). Synergies between EU instruments supporting innovation. Report prepared for Pro INNO Europe. Retrieved from http://proinno.intrasoft.be/admin/uploaded_documents/Mini-study_5-final.pdf
Royal Society (2011). Knowledge, networks and nations: Global scientific collaboration in the 21st century. RS Policy document 03/11. Retrieved from http://royalsociety.org/uploadedFiles/Royal_Society_Content/Influencing_Policy/Reports/2011-03-28-Knowledge-networks-nations.pdf
Rousseuw, P. & Yohai, V. (1984). Robust regression by means of S-estimators. In Robust and nonlinear time series analysis, edited by J. Franke, W. Härdle, and D. Martin, Lecture Notes in Statistics No 26, New-York: Springer-Verlag, pp. 256-272.
Rousseau S., & Rousseau, R. (1997). Data envelopment analysis as a tool for constructing scientometrics indicators. Scientometrics, 40(1), 45–56.
Sartori, R., & Pacheco, R. C. S. (2007). Science, technology and innovation indicators: Human interaction in research groups. Paper presented at 19th International Conference on Production Research. Retrieved from http://www.icpr19.cl/mswl/Papers/160.pdf
Science-Metrix (authors’ list: Campbell, D., Picard-Aitken, M., Côté, G., Trépanier, M., Ventimiglia, A., and Archambault, E.) (2011). Analysis and Regular Update of Bibliometric Indicators: Country and Regional Scientific Production Profiles (Analytical Report 2.3.1). Prepared for European Commission, Directorate-General for Research, 99 pages.
Sharma, S., & Thomas, V. J. (2008). Inter-country R&D efficiency analysis: An application of data envelopment analysis. Scientometrics, 76(3), 483-501.
Smith, K. (2009). Specialisation and Europe’s R&D performance: A note. In D. Pontikakis, D. Kyriakou, & R. van Bavel (Eds.), The question of R&D specialisation: Perspectives and policy

Analytical Report 2.3.2 Final Report
59
implications (pp. 41-44). European Commission’s Joint Research Center-Institute for Prospective Technological Studies Scientific and Technological Reports. Retrieved from http://ftp.jrc.es/EURdoc/JRC51665.pdf
Smith R.J. (2009). Use and Misuse of the Reduced Major Axis for Line-Fitting. American Journal of Physical Anthropolgy, 140: 476–486.
Soete, L. (2006). A knowledge economy paradigm and its consequences. UNU-MERIT Working Paper No. 2006-001. Retrieved from http://www.merit.unu.edu/publications/wppdf/2006/wp2006-001.pdf
Stanton, J. & Mason, S. (2007). Regional industry specialisation versus regional industry diversification: What are the differences? Center for Enterprise Development and Research Occasional Paper No. 8, Southern Cross University, Coffs Harbour, NSW. Retrieved from http://epubs.scu.edu.au/cgi/viewcontent.cgi?article=1147&context=comm_pubs&sei-redir=1#search=%22industrial%20specialisation%22
Statistics Canada. (2006). Blue Sky II Forum. Innovation Analysis Bulletin, 8(3), 3-13. Retrieved from http://www.statcan.gc.ca/pub/88-003-x/88-003-x2006003-eng.pdf
Stirböck, C. (2002). Relative specialisation of EU Regions: An econometric analysis of Sectoral Gross Fixed Capital Formation. Centre for European Economic Research, Discussion Paper No. 02-36. Retrieved from http://econstor.eu/bitstream/10419/24771/1/dp0236.pdf
Tether, B. Hipp, C., & Miles, I. (1999). Standardisation and specialisation in services: Evidence from Germany. Centre for Research on Innovation and Competition, The University of Manchester, Discussion Paper No. 30. Retrieved from http://cosmic.rrz.uni-hamburg.de/webcat/hwwa/edok00/cric/DP30.pdf
Varga, A., Pontikakis, D., & Chorafakis, G. (2010). Agglomeration and interregional network effects on European R&D productivity. Working Paper 2010/3, Department of Economics, University of Pécs. Retrieved from http://www.krti.ktk.pte.hu/files/tiny_mce/File/MT/mt_2010_3.pdf
Wang, E. C., & Huang, W. (2007). Relative efficiency of R&D activities: A cross-country study accounting for environmental factors in the DEA approach. Research Policy, 36, 260–273.
Wong, P. K., & Singh, A. (2004). Technological specialization and convergence of small countries: the case of the late-industrializing Asian NIEs. NUS Entrepreneurship Centre Working Papers Reference No. WP2005-05. Retrieved from http://www.nus.edu.sg/nec/publications/papers/WP2005-05.pdf
Xia, Y., and Buccola, S.T. (2005) University Life Science Programs and Agricultural Biotechnology. American Journal of Agricultural Economics, 87, 229 – 243.
Zar, J.H. (1999). Biostatistical Analysis. Fourth Edition, Prentice Hall, New Jersey, p. 425.

European Commission
EUR 25968 - Cross-Cutting Analysis of Scientific Publications versus other Science, Technology and Innovation Indicators
Luxembourg: Publications Office of the European Union
2013 — I-II, i-vi, 58 pp — 21 x 29,7 cm
ISSN 1831-9424 ISBN 978-92-79-29836-3doi:10.2777/12700

How to obtain EU publications
Free publications:• one copy:
via EU Bookshop (http://bookshop.europa.eu);• more than one copy or posters/maps:
from the European Union’s representations (http://ec.europa.eu/represent_en.htm); from the delegations in non-EU countries (http://eeas.europa.eu/delegations/index_en.htm); by contacting the Europe Direct service (http://europa.eu/europedirect/index_en.htm) or calling 00 800 6 7 8 9 10 11 (freephone number from anywhere in the EU) (*). (*) The information given is free, as are most calls (though some operators, phone boxes or hotels may charge you).
Priced publications:• via EU Bookshop (http://bookshop.europa.eu).
Priced subscriptions:• via one of the sales agents of the Publications Office of the European Union
(http://publications.europa.eu/others/agents/index_en.htm).

Investigations of existing relationships between R&D inputs and outputs from an econometric perspective have increased in past decades in response to the challenges faced by governments. As they are operating on increasingly tight budgets, governments are looking to maximise returns on investments; furthermore, accountability for public spending has become a primary issue for residents who expect to get the most value for their tax dollars.
Most studies of economies and diseconomies of scale in scientific production have been performed with a view to providing evidence-based policy advice that will improve the allocation and management of resources in the research sector and, ultimately, enhance efficiency.
This study adds to the growing knowledge base on the factors driving scientific productivity (i.e., the efficiency with which research inputs are converted into research outputs) at the national and regional levels by reporting on the results of an analysis performed using the most comprehensive dataset on STI indicators that is currently available for European Research Area (ERA) countries and NUTS2 regions.
Diminishing returns were observed for R&D investment and expenditure indicators, whereas economies of scale were observed for human resource indicators. These results are discussed in light of their implications for research policy.
Studies and reports
KI-NA-25-968-EN
-N
doi:10.2777/12700