cross-cultural differences in figure–ground perception of
TRANSCRIPT

Full Terms & Conditions of access and use can be found athttp://www.tandfonline.com/action/journalInformation?journalCode=tcag20
Cartography and Geographic Information Science
ISSN: 1523-0406 (Print) 1545-0465 (Online) Journal homepage: http://www.tandfonline.com/loi/tcag20
Cross-cultural differences in figure–groundperception of cartographic stimuli
Zdeněk Stachoň, Čeněk Šašinka, Jiří Čeněk, Zbyněk Štěrba, StephanAngsuesser, Sara Irina Fabrikant, Radim Štampach & Kamil Morong
To cite this article: Zdeněk Stachoň, Čeněk Šašinka, Jiří Čeněk, Zbyněk Štěrba, StephanAngsuesser, Sara Irina Fabrikant, Radim Štampach & Kamil Morong (2018): Cross-culturaldifferences in figure–ground perception of cartographic stimuli, Cartography and GeographicInformation Science, DOI: 10.1080/15230406.2018.1470575
To link to this article: https://doi.org/10.1080/15230406.2018.1470575
Published online: 15 May 2018.
Submit your article to this journal
Article views: 54
View related articles
View Crossmark data

ARTICLE
Cross-cultural differences in figure–ground perception of cartographic stimuliZdeněk Stachoň a, Čeněk Šašinka b, Jiří Čeněk c, Zbyněk Štěrba a, Stephan Angsuesser d,Sara Irina Fabrikant e, Radim Štampach a and Kamil Morong b
aDepartment of Geography, Masaryk University, Brno, Czech Republic; bDepartment of Psychology, Masaryk University, Brno, CzechRepublic; cDepartment of Social Development, Mendel University in Brno, Brno, Czech Republic; dDepartment of Geographic InformationScience and Cartography, Wuhan University, Wuhan, China; eDepartment of Geography, University of Zurich, Switzerland
ABSTRACTThis article reports on an empirical study investigating cultural differences in the visuospatialperception and cognition of qualitative point symbols shown on reference maps. We developedtwo informationally equivalent symbol sets depicted on identical reference maps that wereshown to Czech and Chinese map readers. The symbols varied in visual contrast with respectto the base map. Our empirical results suggest the existence of cultural influences on mapreading, but not in the predicted direction based on the previous cross-cultural studies. Ourfindings stress the importance of considering the cultural background of map readers, especiallywhen designing reference maps aimed for global online use.
ARTICLE HISTORYReceived 3 November 2017Accepted 25 April 2018
KEYWORDSCultural differences; mapreading; visualization; visualperception; user testing
Introduction
Psychologists’ interest in the relationship between cultureand cognition dates back to the beginning of the twentiethcentury. Pioneering single-culture studies conducted byRivers (1905) inspired further research in the field. Earlyresearch focused mostly on the role of the environmentand past experience on perception. Segall (Segall, Dasen,Berry, & Poortinga, 1990) formulated hypotheses aboutthe relationship between the physical characteristics ofperception and the environment. Blakemore and Cooper(1970) demonstrated the influence of individual experi-ence on the development of perceptual abilities. Hudson(1960) and Deregowski (1972) conducted experimentalstudies on the interpretation of depth cues in Africancultures. Other experiments used visual illusions to explorecross-cultural differences in the perception of symmetry,spatial orientation, perceptual constancies, or object recog-nition (see Deregowski, 1980). The formulation of Gestaltprinciples of perceptual grouping and figure–ground orga-nization (Wagemans et al., 2012) inspired an entire line ofcross-cultural research based on the Navon hierarchicalstimuli method (Navon, 1977).
The focus of more recent studies enriched the investiga-tion of the role of experience and environmental factors inperception and cognition by the incorporation of socio-cultural, economic, and political factors (Berry, Poortinga,Breugelmans, Chasiotis, & Sam, 2012) into the model ofrelationships between culture and cognition. The theory of
holistic and analytic perception was formulated on thebasis of the earlier theories of cognitive styles that aredefined as relatively stable modes of informational proces-sing (Kozhevnikov, 2007; Tiedemann, 1989), primarily onWitkin’s theory of field dependence (Witkin &Goodenough, 1977). The research projects conductedwithin the boundaries of the theory were so far mainlyfocused on the comparison of two economically developedcultural regions: The West (USA, Western Europe) andEast Asia (China, Japan, South Korea).
The theory postulates that there are two distinctcognitive styles: holistic and analytic. Whereas the ana-lytic style is typical for Westerners, who rather attend tofocal (i.e. perceptually salient and semantically relevant)objects and their characteristics than to background orcontext information in a visual scene, the holistic style istypical for East Asians, who mostly attend to the rela-tionships between objects in a visual scene and tocontext information (Nisbett & Miyamoto, 2005).Different sociocultural factors can produce the develop-ment of distinct cognitive styles, such as the differencesin philosophical systems, the complexity of social rela-tions, self-construals, social practices, and child-rearingpractices (Nisbett & Masuda, 2003). The abovemen-tioned differences between the two distinguishedcognitive styles are further pronounced by the use ofdifferent writing systems, which require a different set ofskills to master (Huang & Hanley, 1995).
CONTACT Jiří Čeněk [email protected]
CARTOGRAPHY AND GEOGRAPHIC INFORMATION SCIENCE, 2018https://doi.org/10.1080/15230406.2018.1470575
© 2018 Cartography and Geographic Information Society

There are several methods commonly used to mea-sure holistic and analytic cognitive style and its mani-festations, which vary in their overall visual complexityfrom relatively simple tasks to more elaborate andcomplex tasks. The simplest of these methods is theFramed-line test (FLT; Kitayama, Duffy, Kawamura, &Larsen, 2003), currently considered the benchmark ofholistic and analytic cognitive style diagnostics. Thetest is designed as a succession of geometrical figuresthat are comprised of a square frame and a vertical line.First, a frame with the vertical line is presented to aparticipant. Subsequently, a second frame is showed tothe participants and the size of the second frame can beeither the same as the original, or it can be increased/decreased. Participants are supposed to outline a linethat is identical to the observed line in either theabsolute length (in the absolute task) or in the ratioto the size of the surrounding frame (in the relativetask). The difference in the length of the original anddrawn lines is measured. “The absolute task is facili-tated by the ability to decontextualize (i.e., analyticperception), whereas the relative task is facilitated bya contextualized mode of visual processing (i.e., holisticperception) (Kitayama & Cohen, 2010, p. 579).” TheWestern participants should perform better in theabsolute task, whereas most of the people from EastAsia should perform better in the relative task. Thesedifferences in the development of cultural strategies ofattention become apparent at 5–7 years of age (Duffy,Toriyama, Itakura, & Kitayama, 2009).
Other studies used relatively more complex visualstimuli in order to identify the differences in visualperception and cognition among cultures. Several stu-dies used change-blindness tasks for this purpose; insome cases, they were combined with priming manip-ulation. The studies compared members of variouscultural groups and subgroups, such as Americanand Japanese (Masuda & Nisbett, 2006; Miyamoto,Nisbett, & Masuda, 2006), American and East Asianexchange students (Masuda & Nisbett, 2006), orCaucasian, African, Asian, Latino, and MultiracialAmerican (Choi, Connor, Wason, & Kahan, 2015).The common feature of these studies is that theyused real-world scenes as stimuli, and that partici-pants were supposed to detect changes in objectsand in the context (background). In all of the above-mentioned research, participants with Western/Caucasian background had more difficulties (longerreaction times, lower success rates) with contextualinformation processing. Additionally, participants,who were primed with independence, which is con-sidered to be a self-construal and value system typical
for Westerners, showed patterns similar to those ofWestern participants (Choi et al., 2015).
Several other studies used complex visual stimuli inorder to determine the manifestations of cognitive styleacross cultures. Kuwabara and Smith (2012) used clut-tered cartoon scenes in a visual search task. Americanchildren showed more object-centered attention com-pared to their Japanese counterparts. Masuda andNisbett (2001) used both static and animated sceneswith animals in visual recognition tasks. In the firstphase, the respondents were viewing the scenes, whichcontained animals on various backgrounds. In the sec-ond phase, they were supposed to recognize the ani-mals presented in the first phase. The authorsmanipulated the background during the recognitionphase. The Americans showed a better performancecompared to the Japanese when recognizing animalson the background that differed from the originalbackground presented in the scene viewing phase,which suggests a better ability of Westerners to decon-textualize an object from its background.
Several eye-tracking studies support the existenceof cultural differences in visual cognition. Zhang andSeo (2015) created a set of stimuli containing fooditems representing focal objects. The food items wereplaced on backgrounds that differed in the level oftheir visual saliency. They administered the methodon a sample of Americans and Chinese, measuringfirst fixations on the food and overall food fixationtime. They found that Americans fixated on theobjects earlier and spent more time looking at thefood. With the rising level of background saliency,both groups looked at the food later and spent lesstime looking at it. Similar results were obtained byChua, Boland, and Nisbett (2005), who used picturesthat contained living and nonliving objects with rea-listic backgrounds. They found that Americanslooked at the objects sooner, had longer fixationson objects, and made fewer overall fixations.
As mentioned before, the elements of a visual scenecan be characterized by perceptual salience (bottom-upprocess) and semantic relevance (top-down process)(Spotorno & Faure, 2011), which both determine theprobability of a given object to be included in themental representation of the stimulus. The salience ofthe element is determined by low-level visual charac-teristics of the element such as size, color, texture,spatial position of the element, overall complexity ofthe scene (Ma, Xu, Wong, Jiang, & Hu, 2013), and therelationships among the objects and between the objectand the entire image (Spotorno & Faure, 2011). Thesemantic relevance is influenced, for example, by the
2 Z. STACHOŇ ET AL.

task goals and instructions, and it is controlled by atop-down cognitive processes. Furthermore, thesemantic relevance of the elements of a stimulusseems to be co-determined by cultural influences(Lee, Shin, Weldon, & Sohn, 2016). From this pointof view, the attention allocation strategies among cul-tures differ due to the differences in adaptive benefitsassociated with each strategy.
Cartographers by themselves or in cooperationwith psychologists began to systematically investigategroup differences in empirical map studies 60 yearsago (Montello, 2002). The general approach has chan-ged overtime, but most of the studies typically usegender, age, cognitive abilities, and the style or exper-tise of users as explanatory variables (e.g. Brodersen,Andersen, & Weber, 2002; Fabrikant, Rebich-Hespañha, Andrienko, Andrienko, & Montello, 2008;Li, Çöltekin, & Kraak, 2010; Ooms et al., 2015;Kubíček et al., 2017; others). Far less attention hasbeen brought to cultural differences in map percep-tion, map reading, or analysis, with some exceptions.For example, Chang and Antes (1987) focused ongender and cultural differences between college stu-dents from the United States and Taiwan, wheremales performed significantly better than females intopographic map reading and Taiwanese students per-formed better than those students from the UnitedStates. Stea, Blaut, and Stephens (1996) asserted thatmapping (as a way of communicating the nature oflarge environments) is a component of all contempor-ary cultures; thus, it constitutes cultural universality.Blades et al. (1998) focused on the cultural differencesin mapping abilities of young children from England,South Africa, Iran, Mexico, and the United States.They stressed the fact that mapping abilities are welldeveloped in all cultures, in the case of young chil-dren. Montello (1995) stressed the existence of cul-tural universals and differences in spatial cognition,but claims the importance of universality of cognitivestructures and processes and also claims that culturaldifferences are often exaggerated. Davies andPederson (2001) and Stachoň and Šašinka (2012)bring examples of differences in spatial processingand representation between people living in differentenvironments. From other fields connected to carto-graphy and geography, the work of Louis (2006)suggests that there are cultural differences in spatialplanning strategies that are not only based on indi-genous values of a landscape but also on differences inthe cartographic techniques employed to representindigenous spatial perceptions.
Contemporary critical cartography research incor-porates cultural diversity approaches in mapping
(e.g. Krygier & Wood, 2005) and turns our focus tothe study of the cross-cultural differences in thecognitive processing of maps. The mentioned exam-ples bring us to the different roles of spatial repre-sentations in the minds of people from variouscultures and also to the issue of whether or notthe cartographer should pay attention to the cross-cultural differences.
The aim of this article was to investigate the potentialdifferences in the cognitive processing of maps. Therationale of the research is based on the theory ofholistic and analytic cognitive style that provides a fra-mework for the comparison of perceptual and cognitiveprocesses across cultures. The abovementioned cross-cultural research in psychology inspired us to try tolook at a map as a complex visual stimulus composedof multiple elements with various levels of visual salienceand semantic relevance, and to explore possible culturaldifferences in the visual perception of maps. Figure 1describes the expected relationships among key vari-ables, and their operationalization. Nisbett and Masuda(2003) argue that specific sociocultural factors (e.g. indi-vidualism/collectivism, self-construal, language) influ-ence the development of holistic or analytic cognitivestyle. Cognitive style as a psychological construct(Rayner & Riding, 1997) and latent trait (Allen & Yen,2002) can be detected and measured with psychologicaltests (e.g. FLT) and manifests itself in daily life, e.g.during map work. Based on the theory, we expectedthat East Asians are generally more holistic and thiswould be manifested in the FLT by their ability to per-form relatively better in the relative task. At the sametime, users with holistic cognitive style would be rela-tively more effective in the exploration of map back-ground in comparison to analytics who primarily payattention to focal objects. We administered two perfor-mance methods to a sample of Czech and Chineseuniversity students in order to measure cognitive style(FLT) and its manifestations in map reading (visualsearch task).
Figure 1. Model of cultural influence on perception andcognition.
CARTOGRAPHY AND GEOGRAPHIC INFORMATION SCIENCE 3

Methods
The abovementioned interdisciplinary research in psy-chology, geography, and cartography suggests theexistence of cross-cultural differences in mental repre-sentation of space and its understanding. Inspired byprior cross-cultural perception research, we wanted toinvestigate whether there might be differences in map-reading behaviors between Europeans and Asians. Wethus included a version of the FLT to help explainpotential map-reading differences across studied ethnicgroups. Based on previous studies (e.g. Kitayama et al.,2003; Nisbett & Miyamoto, 2005), we hypothesized that:
(1) Both Europeans and Asians identify thematicfigural symbols overlaid on a reference mapmore rapidly than background segments of thisreference map.
(2) Europeans identify thematic figural symbolsmore rapidly than Asians, and Asians identifybackground segments of the map more rapidlythan Europeans.
(3) An increased figure/ground contrast increasessymbol localization speed for Europeans butnot for Asians.
(4) In FLT, Asians perform better in the relativetask and Europeans perform better in the abso-lute task.
Participants
We invited a total of 133 students from various under-graduate and postgraduate programs at MendelUniversity in Brno, Masaryk University in Brno, theUniversity of Economics in Prague, and from WuhanUniversity in China to participate in our study. Ofthose participants, 64 participants were Czech (age:Mean = 22.0, SD = 2.96), and 69 were Chinese (age:Mean = 21.0, SD = 2.19), and all had normal orcorrected-to-normal vision. We aimed for a balancedgender ratio in both ethnic groups (approx. 30% malesin the Czech and 38% in the Chinese sample). Studyparticipation was voluntary. Participants were invitedto orally give their informed consent for participationin the study prior to taking part in the experiment.
Procedure and materials
The test was run on 21.5″ monitors (at 1600 × 900 pixelresolution). The distance between the computer screenand participants’ eyes varied between 40 and 50 cm, andthe size of the displayed map stimuli was 770 × 695
pixels. The test procedure was kept constant across theCzech and Chinese versions of the experiment, as shownin Figure 2. Participants solved the identical experiment,but in their native language (i.e. in Czech or in StandardChinese). A maximum of five participants were tested inthe same session. At the beginning of the test session,participants were informed that the experiment wouldconsist of two test portions related to map reading andvisual perception. The entire experiment took about25 min on average.
The experiment was administered with the Hypothesissoftware, an online testing environment that runs in aweb browser and captures participant responses in adigital database. For more details about Hypothesis, seeŠašinka, Morong, and Stachoň (2017), Popelka, Stachoň,Šašinka, and Doležalová (2016), or Svatoňová and Kolejka(2017). Initially, participants were asked to complete themap portion of the experiment, and were randomlyassigned to either stimuli version A or B. Map trialswere randomized. Subsequently, all participants wereasked to complete absolute and relative tasks of FLT.
Map stimuli
We designed a factorial experiment with informationallyequivalent map stimuli to solve two typical map-readingtasks, including 1) localization of a given figural symbolin a reference map (21 trials), and 2) the localization of agiven geometric configuration (background segment)from the map (20 trials). Both types of tasks wereexplained at the beginning of the test.
We prepared two test versions (A and B) with anidentical background map showing a Greek city(including Greek map labels) that we selected fromthe OpenStreetMap database. We specifically choseGreek to avoid potential familiarity with a particularwriting system for the chosen Czech and Chinese par-ticipant groups.
Test versions only differed in the visual contrastof the figural symbols to the background map. Intest version B, figural symbols of different shapes
Figure 2. Schema of the testing procedure; both culturalgroups passed through both versions of the test (A and Bversion).
4 Z. STACHOŇ ET AL.

and colors also include identical black outlines, toincrease the visual saliency of the figural symbolsfrom the background map (see Figure 3). In thisversion, the symbols thus appear more uniform inshape and size.
Figural symbols in both map versions are distributedequally across the background map. As previouslymentioned, the background map is identical in bothversions of map stimuli. Test version and culture areindependent variables, whereas speed of localization ofthe figural symbols and the background map config-urations are dependent variables.
The respondents were instructed to locate and select(by mouse click) the given figural symbol (see Figures 4and 6) or given configuration (segment) selected fromthe background (see Figures 5 and 6). We measuredparticipants’ response time in milliseconds.
This was followed by an adaptation of the FLTwhich was identical for both groups (see further).
FLT stimuli
The second portion of the experiment consisted of amodified version of the original FLT proposed byKitayama et al. (2003). Our version is composed of atotal of 16 stimuli, 8 stimuli each for both the absoluteand relative tasks. The line-drawing practice task wasput at the beginning of the test, followed by instruc-tions for the absolute task. The absolute task precededthe relative task. Each stimulus started with a presenta-tion of a square or circle frame with a line extendeddownward from the center of the upper edge (originalstimulus; see left part of the Figure 7). The originalfigure was presented for 5 s. Immediately after theoriginal figure, a blind screen was presented for100 ms. After the blind screen, an empty frame witha dashed line was presented (test stimulus; central partof Figure 7).
A reference stimulus was shown first with either asquare or a circle of a standardized edge/diameterlength of 160 pixels. The geometric shape also con-tained a vertical line of a given length in the middleof the shape, as shown in Figure 8. The referencestimuli were all positioned in the center of an empty,white display. Participants were then shown a secondstimulus, again containing a square/circle, but of adifferent size than the reference stimulus. They werethen asked to draw a vertical line using the mouse,starting with a mouse click at the top edge of therectangle/circle and by dragging the mouse downward.A second mouse click ended the line drawing. For theabsolute task trials, participants were asked to draw aline of the same absolute length as presented in thepreceding reference stimulus in the empty rectangle/circle shown second. For the relative task trials, parti-cipants were instructed to draw a line of the samelength proportions in an empty rectangle/circle of adifferent size that corresponded to the same lengthproportion shown in the preceding reference stimulus(right part of Figure 7). Each task differed in the lengthof the given vertical line in the reference stimulus.Positions on the display and the sizes of the geometricshapes into which participants had to draw were ran-domized. We recorded the length of the drawn line (i.e.number of pixels) for each trial.
Results
Map-reading test
Below, we report on the quantitative results of themap-reading portion of the test. Of the 133 partici-pants, we removed 6 participants because they did not
Figure 3. Examples of three groups of objects used for A and Bversions of map stimuli.
Figure 4. Example of the test stimulus used in map-readingtest version A “Locate the symbol shown on the left.” ©OpenStreetMap Contributors.
CARTOGRAPHY AND GEOGRAPHIC INFORMATION SCIENCE 5
finish the entire portion of the experiment due totechnical problems with the Hypothesis application.This only happened with Chinese participants, becausethe required Internet connection at test locations inChina was generally unstable. As a result of data pre-processing, we retained response data for 64 Czech and63 Chinese participants.
Performances were assessed using two mixed,repeated measures ANOVAs, with the cultural back-ground as a between-subject factor, and the figure-back-ground search task as a within-subject factor. Because ofthe between-subject design of this portion of the
experiment, we performed the analysis separately forversions A and B of the map-reading test. The cross-cultural differences were primarily measured by therelative performance in both types of tests.Additionally, we used a 2 × 2 ANOVA to discoverpotential interactions between culture and the level ofvisual contrast (symbol versions A vs. B). In all cases, wereported on participants’ efficiency represented by theirresponse times (in seconds).
As expected, both Czech and Chinese participantswere faster in localizing figural symbols compared tothe localization of the background segments from themaps (see Figure 9). A repeated measures ANOVA ana-lysis of the map-reading test shows significant differencesbetween both groups regarding the figural symbols andbackground segment tasks (F(1, 67) = 224.63, p < .001,ωp
2 = .76 in case of version A and F(1,54) = 149.58,p < .001, ωp
2 = .73 in case of version B).Post hoc tests indicated that Czech respondents working
with version A (M = 3.11, SD = 1.81) were significantlyfaster when searching for figural symbols than Chineserespondents (M = 4.23, SD = 1.74), t(59.61) = −4.75,p < .001, d = .63. Also Czech respondents working withversion A (M = 6.59, SD = 5.2) were significantly fasterwhen searching for background segments than Chineserespondents (M = 9.91, SD = 4.98), t(70) = −4.79,p < .001, d = .65. There were no significant differences indetection speed between the Czechs (M = 3.86, SD = 1.65)and Chinese (M = 4.13, SD = 1.84) when having to identifyfigural symbols in version B, while Czech respondents were
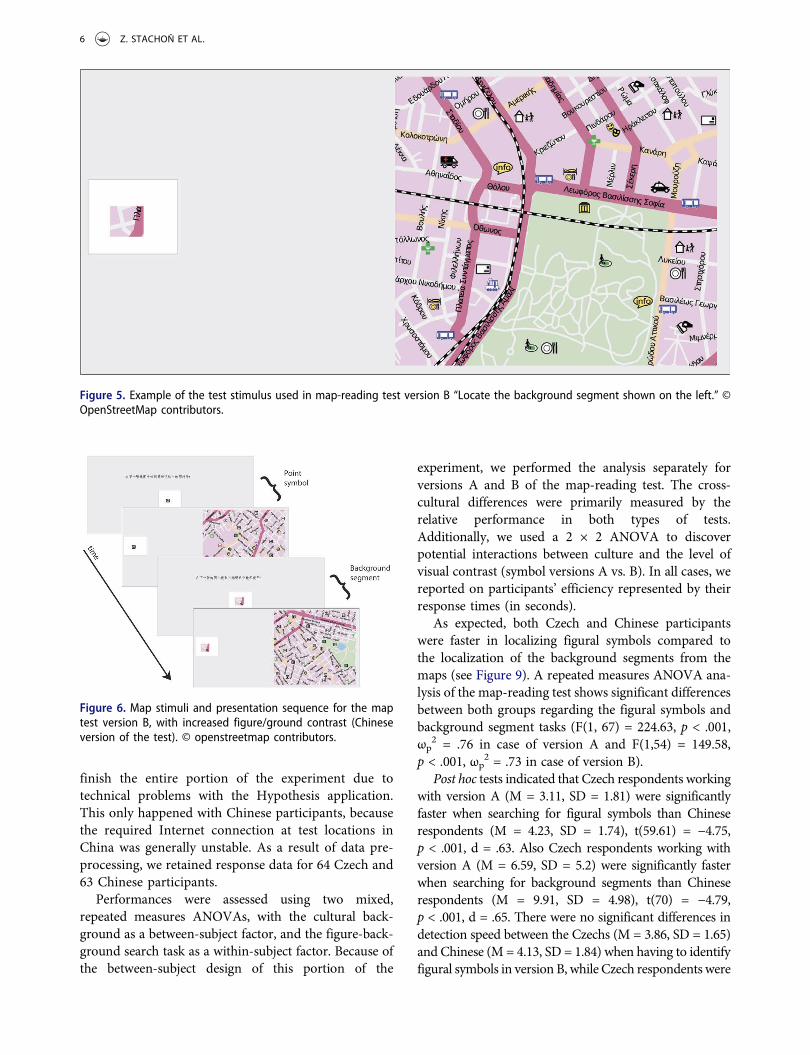
Figure 5. Example of the test stimulus used in map-reading test version B “Locate the background segment shown on the left.” ©OpenStreetMap contributors.
Figure 6. Map stimuli and presentation sequence for the maptest version B, with increased figure/ground contrast (Chineseversion of the test). © openstreetmap contributors.
6 Z. STACHOŇ ET AL.

significantly faster identifying background segments(M = 6.72, SD = 4.83) than the Chinese respondents(M = 9.56, SD = 5.38), t(41.37) = −3.88, p < .001, d = .56.
Figure 7. Principle of framed-line test.
Figure 8. Stimuli and presentation sequence of the framed-linetest.
Figure 9. Mean response times with standard deviations (s) forthe two cultural groups (Czechs and Chinese), two versions ofmap-reading test A and B and figural symbols (left) and back-ground segments search (right).
CARTOGRAPHY AND GEOGRAPHIC INFORMATION SCIENCE 7

To test for potential interaction effects across par-ticipants’ cultural backgrounds and the level of visualcontrast (symbol versions A vs. B), the means weresubmitted to a 2 ⨯ 2 ANOVA with two between-subject variables (culture of participant: Czech vs.Chinese; version of symbol: A vs. B). We found aninteraction effect between culture and version of fig-ural symbol set, F(1, 126) = 6.06, p < .05, ωp
2 = .04.Post hoc tests indicate that Czech participants performsignificantly faster in localization of the figure in ver-sion A (M = 3.11, SD = 1.81) compared to version B(M = 3.86, SD = 1.65), F(1, 63) = 1.66, p < .01, d = .43.There were no significant differences in the speed oflocalization of figures between either version of thefigural symbol sets in the case of the Chineserespondents.
Now we turn our attention to the results of the FLTto further investigate potential effects of cultural back-ground on holistic and analytic cognitive styledifferences.
FLT
We analyzed the length of the response lines drawn byparticipants in comparison to the correct line lengths.Prior work suggests overall high accuracy rates for theFLT (Kitayama et al., 2003). We counted all responsesthat diverted horizontally from the dashed line asincorrect responses. We counted the number of incor-rect responses of each participant and excluded parti-cipants with more than 20% of incorrect responses (i.e.3 of 16 responses), suggesting that these participantseither did not understand or did not follow the giventest instructions, or there were other reasons for higherror rates, unrelated to the actual tested concept. Wealso performed an outlier analysis (Hoaglin & Iglewitz,1987; Hoaglin, Iglewitz, & Tukey, 1986), as a furtheradjustment of Tukey’s (1977) outlier labeling method.The outlier analysis was conducted using the averageabsolute deviations of lines drawn by the participantsfrom the correct lengths of lines (same absolute lengthin the absolute task/same proportion to the frame inthe relative task). After these two data preprocessingprocedures, 10 respondents were eliminated fromfurther analysis and the overall response error ratedropped to approx. 4.5% on average.
This left us with response data from 106 respondents(i.e. 52 Czech and 54 Chinese) in total. We subjectedthese data to a mixed repeated measures ANOVA withone between-subjects factor (cultural background: Czechand Chinese), and one within-subjects factor (task: abso-lute vs. relative length judgements).
Figure 10 shows the response mean absolute linelength errors of the FLT. As predicted, we can imme-diately see differences in response accuracy across cul-tural background. Surprisingly, however, the pattern ofdifferences does not seem to be the same as prior worksuggested (Duffy et al., 2009; Kitayama et al., 2003). Inaforementioned studies, Asian participants performedconsistently and more accurately in judging the linelength in the relative task condition. Contrary to thesestudies and to our expectations, Asians in our studyjudged line lengths more accurately in the absolute taskcondition compared to the relative task condition.Czech participants show no clear advantage in theperformance, in either the absolute or the relativetask condition.
As predicted, the interaction between cultural back-ground of the participants and the perceptual linedrawing task is significant, F(1, 104) = 14.65, p < .0001,ωp
2 = 0,11. However, the effect size is small. Post hoctests reveal that Chinese participants are significantlymore accurate in judging absolute length than Czechparticipants (Chinese: M = 11.88, SD = 4.49; Czech:M = 15.46, SD = 6.71, t(88.61) = 3.21, p < .01, d = .63).Conversely, Czech participants seem to be more accuratein the relative task trials (Czech: M = 15.71, SD = 4.33;Chinese: M = 17.15, SD = 3.64). However, these differ-ences are not significant (t(104) = −1.86, p = .066).
Moreover, contrary to the results of previous research,the Chinese are also significantly (t(53) = – 7.90, p < .001,d = 1.29) more accurate with their absolute length task(M = 11.88, SD = 4.49) compared to their relative task(M = 17.15, SD = 3.64). Accuracy does not significantlydiffer (t(51) = – .22, p = .83) for the Czech participants,for any of their tasks (Absolute task: M = 15.46,SD = 6.71; Relative task: M = 15.71, SD = 4.33).
Figure 10. Mean error scores with standard deviations (in pix-els) in the absolute and relative task of framed-line test.
8 Z. STACHOŇ ET AL.

Discussion
The goal of this study was to investigate whether holisticand analytic perception described by Nisbett and Masuda(2003) or Kitayama andCohen (2010) would be relevant tothe context of map reading. We set out to reveal possiblecross-cultural differences in the map-reading processes ofCzech and Chinese map users, explained by a cognitivestyle assessment using the FLT. In the first part of thearticle, we introduced the relevant psychological researchon cross-cultural differences in visual perception and cog-nition. In the second part, we discussed the role of culturein the visual search of figural symbols and backgroundsegments of the map. In the third part, we discussed theresults of the FLT, and we related these to participants’performance in the map-reading portion of theexperiment.
First, we found that both Czech and Chinese parti-cipants are able to locate figural symbols faster in areference map, than geometric configurations (back-ground segments) on the same reference map.Overall, this is a gratifying result, meaning that thema-tically relevant information can be rendered as percep-tually salient (Fabrikant, Rebich-Hespañha, & Hegarty,2010; Garlandini & Fabrikant, 2009; Hegarty, Canham,& Fabrikant, 2010), and this information can bedetected rapidly across various cultural backgrounds.The results are also in consonance with the Gestaltprinciples of perceptual organization (for a compre-hensive review, see Wagemans et al., 2012).
As hypothesized, we were also able to detectcross-cultural differences in our map-reading study.Surprisingly, however, our findings are opposite towhat prior research outside of cartography had sug-gested. The theory of holistic and analytic perceptionproposed by Varnum, Grossman, Kitayama, and Nisbett(2010) claims that Western cultures perceive visuo-spa-tial information more analytically, and less holistically,than Eastern cultures. Hence, we would have predictedthat Czech participants would be able to locate figuralsymbols more rapidly than the Chinese, and thatChinese participants would be able to locate the back-ground segments relatively faster. Contrary to ourexpectations, Czechs are significantly faster comparedto Chinese participants in the localization of backgroundsegments, irrespective of figural symbol design.Furthermore, there are significant differences betweenthe groups in localization of the figural symbols inversion A of our map test. No significant differenceswere found between the groups in the speed of localiza-tion of the figural symbols in version B.
Perhaps, some of our contradictory results in themap-reading portion of the experiment can simply be
explained by the equally unexpected results we obtainedin the FLT. Our FLT results contradict the suggestedtheoretical model as well (Varnum et al., 2010). OurChinese participants defied our expectations and themodel predictions by being more accurate with theabsolute task compared to the Czechs. Conversely, theCzechs were more accurate in the relative task comparedto the Chinese. This in essence means that Czech parti-cipants show a more holistic cognitive style than ourChinese participants, whereas our tested Chinese parti-cipants display a more analytic cognitive style thanCzechs. Moreover, a more predictable pattern emergeswhen systematically comparing FLT and map-readingresults. Chinese participants, who show relatively stron-ger tendencies to analytical visual processing (higherprecision in absolute than in relative task in FLT), alsoshow relatively higher differences in the speed of figuralsymbols localization compared to the speed of back-ground segments’ localization and vice versa.
These surprising results could be explained in sev-eral ways. Changes of socio-cultural factors can influ-ence the formation of a cognitive style which, in turn,can result in the change of a cognitive style and itsmanifestations (Matsumoto, Kudoh, & Takeuchi,1996). Our Chinese participant sample (i.e. young uni-versity students) might already show recent culturalfactor changes in China. This might be facilitated byincreasing access to information disseminated throughthe various Western digital media channels (i.e. Web,social media, etc.), and increased exposure to hardware,software, learning materials, and digital methods pro-duced by Western tech companies, fostering particularcognitive styles.
Results of several priming studies show that a cog-nitive style is sensitive to priming manipulations (Ishii,2013; Nisbett & Miyamoto, 2005; Oyserman & Lee,2008). We aimed to eliminate possible priming effectsusing a tight control of the experimental conditions.More research with other control factors related to theparticipant sample, for example, different age andsocioeconomic groups of respondents or longitudinalstudies, is needed to systematically identify possibleshifts in cognitive style. Furthermore, the theory of“cognitive flexibility” (e.g. Shin & Kim, 2015; Yeatts &Strag, 2014) says that different people differ in theability to adaptively change their cognitive strategies.This concept stresses the flexibility and adjustability ofcognitive processes by human, and thus supports theassumption that changing sociocultural factors mayrelatively fast modified cognitive style of whole groups.
Perhaps, this result is due to the relatively low over-all diversity of tested participants. Irrespective ofnationality differences, all tested (Czech and Chinese)
CARTOGRAPHY AND GEOGRAPHIC INFORMATION SCIENCE 9

participants were in their twenties, living in large urbanareas, and studying at a university. We tried to usesamples as similar in the key background characteris-tics as possible in order to avoid sample bias, asdescribed by van de Vijver (van de Vijver &Poortinga, 2005). The field of study was one differencebetween samples that might have caused the observeddifferences between the groups. Czech participantswere students in various fields without a geographicbackground. Chinese participants, however, weremainly students with a background in GIS, and alsofrom related fields including Land ResourceManagement or Urban–Rural Planning. It could beexpected that the experience of Chinese students withGIS and maps should have resulted in a slightly super-ior performance in both cartographic tasks. However,the results did not reflect this tendency at all.
The secondary goal of our study was to identifywhich type of figural symbol set might lead to greaterefficiency in visual search tasks for participants withdifferent cultural background. Symbol sets weredesigned in order to specifically provide a perfor-mance advantage based on the preferred (holistic oranalytic) cognitive style. That is, figural symbol set Awas designed with relatively more variation in shapeand color across individual symbols, while figuralsymbol set B was designed as more uniform in shapeand color, using identical symbol outlines, and withgreater visual contrast to the reference map in thebackground. Consequently, figural symbol set B as awhole would more easily act as a (Gestalt) figure, andhypothetically provide a cognitive advantage forEuropean participants. Contrary to our expectations,Czech participants performed better with figural sym-bol set A. This might be explained by the relativelymore complex set of internal parts of chosen symbolsfor figural symbol set B. These are crucial for thedifferentiation between symbols (aside from theshape of the symbol outlines). Although the entirestructure of symbols in symbol set B is more distinc-tive from the background due to the added symboloutlines, and thus its apprehension should be easier(see Stachoň et al., 2013), difficulties with discrimin-ability slowed Czech participants down when workingwith figural symbol set B. Another explanation offersLloyd (1997) who found that targets with uniquefeatures pop out of the map and search efficiency isindependent of number of distractors. In a follow-upstudy, one could redesign symbol set B to be moredistinct from symbol set A by further abstracting theinterior shapes of the symbols. One could also furtherincrease figure–ground contrast with the backgroundby reducing the color range of symbol set B.
On the other hand, Chinese participants show rela-tively better results in the case of figural symbol set B,but the differences were not significant. Perhaps, thiscould be explained by the different writing systems ofEuropeans and Asians. Europeans use the Latin alpha-bet where a particular sign carries no meaning, eventhough shape differences can be detected. Chinesecharacters, in contrast, are logograms with mostlyvisually complex structure, where a single charactercan have various meanings. Therefore, Chinese parti-cipants are perhaps more familiar with studying visualdetails and parts of a particular figural symbol. Thiscould influence the detection speed in figural symbolset B, where the internal symbol structure is moresimilar to the structure of Chinese characters.
Conclusions and outlook
The aim of our study was to investigate whetherholistic and analytic cognitive styles would be rele-vant in the context of map reading, and whether mapusers of different cultural backgrounds (i.e.Westerners and Asians) might differ in their map-reading style. The results of our experiment offerstrong evidence that cultural background can indeedinfluence the map-reading style of map users, whichcan take shape in figure–ground searching efficiency.However, our findings are in contrast to what thetheory of holistic and analytic cognition (Nisbett &Masuda, 2003) would suggest, which describesWesterners as more analytical and East Asians asmore holistic. Furthermore, we discovered that thecartographic design of figural symbol sets influencesvisual search efficiency on reference maps, and thisagain could be mediated by the varying cultural back-ground of the map users. Our results show thatfigural symbols with relatively bigger variance inshape are significantly more suitable for the Czechparticipants compared to the relatively more uniformsymbols (symbols with outlines). Conversely, Chineseparticipants are relatively faster when performingvisual search tasks with more uniform figural sym-bols (i.e. having the same black outline).
Our results underline the importance of varying thecartographic design solutions for map readers withdifferent cultural background. Differences may appearnot only in the shape and color of figural symbols butalso in the size of the symbol, their anchor point, etc.
Future research should not only be extended geogra-phically (using respondents from other countries) butalso thematically, for example, by comparing respon-dents living in settlements of various densities andsizes (see Stachoň et al., 2013), respondents of various
10 Z. STACHOŇ ET AL.

socioeconomic status (see Grossmann & Varnum,2011), or respondents from different age groups (seeDuffy et al., 2009; Waxman et al., 2016).
Acknowledgments
The authors would like to thank the following collaborators:FEI Teng (technical coordinator, technical implementation,organization of students), WANG-ANGSUESSER Xu (transla-tions, test testing, test preparation & supervision), LU Yi (testtesting) HU Guang (technical implementation), ZHOU Ye(organization of students), LIU Chang, WANG Kun, YINGWeijun, ZHAN Wanxin (students who organized other stu-dents), and at the Laboratory Center (responsible for thecomputer lab): ZHAN Qinming (head), LÜ Xiuqin, LIUYongqiong.
Disclosure statement
No potential conflict of interest was reported by the authors.
Funding
This research has been supported by funding from MasarykUniversity under the grant No.MUNI/M/0846/2015,“Influence of cartographic visualization methods on the suc-cess of solving practical and educational spatial tasks.”
ORCID
Zdeněk Stachoň http://orcid.org/0000-0003-1807-1459Čeněk Šašinka http://orcid.org/0000-0001-6319-5317Jiří Čeněk http://orcid.org/0000-0002-2543-5532Zbyněk Štěrba http://orcid.org/0000-0003-1034-626XStephan Angsuesser http://orcid.org/0000-0002-8622-0121Sara Irina Fabrikant http://orcid.org/0000-0003-1263-8792Radim Štampach http://orcid.org/0000-0002-0480-8862Kamil Morong http://orcid.org/0000-0001-6481-815X
References
Allen, M. J., & Yen, W. M. (2002). Introduction to measure-ment theory. Long Grove, IL: Waveland Press.
Berry, J. W., Poortinga, Y. H., Breugelmans, S. M., Chasiotis,A., & Sam, D. L. (2012). Cross-cultural psychology:Research and applications. Cambridge: CambridgeUniversity Press.
Blades, M., Blaut, J. M., Darvizeh, Z., Eluguea, S., Sowden, S.,Soni, D., . . . Uttal, D. (1998). A cross-cultural study ofyoung children’s mapping abilities. Transactions of theInstitute of British Geographers, 23(2), 269–277.
Blakemore, C., & Cooper, G. F. (1970). Development of thebrain depends on the visual environment. Nature, 10(31),477–478.
Brodersen, L., Andersen, H. H. K., &Weber, S. (2002).Applyingeye-movement tracking for the study of map perception andmap design. Copenhagen: Kort & Martikelstyrelsen.
Chang, K.-T., & Antes, J. R. (1987). Sex and culturaldifferences in map reading. American Cartographer, 14(1), 29–42.
Choi, H., Connor, C. B., Wason, S. E., & Kahan, T. A.(2015). The effects of interdependent and independentpriming on Western participants’ ability to perceivechanges in visual scenes. Journal of Cross-CulturalPsychology, 47(1), 97–108.
Chua, H., Boland, J., & Nisbett, R. (2005). Cultural variationin eye movements during scene perception. Proceedings ofthe National Academy of Sciences of the United States ofAmerica, 102(35), 12629–12633.
Davies, C., & Pederson, E. (2001). Grid patterns and culturalexpectations in urban wayfinding. In D. R. Montello (Ed.),Lecture notes in computer science: Spatial information the-ory. COSIT (Vol. 2205). (pp. 400–414). Berlin: Springer.
Deregowski, J. B. (1972). Pictorial perception and culture.Scientific American, 227(5), 82–88.
Deregowski, J. B. (1980). Illusions, patterns and pictures: Across-cultural perspective. London: Academic Press.
Duffy, S., Toriyama, R., Itakura, S., & Kitayama, S. (2009).Development of cultural strategies of attention in NorthAmerican and Japanese children. Journal of ExperimentalChild Psychology, 102(3), 351–359.
Fabrikant, S. I., Rebich-Hespañha, S., Andrienko, N.,Andrienko, G., & Montello, D. R. (2008). Novel methodto measure inference affordance in static small multipledisplays representing dynamic processes. CartographicJournal, 45(3), 201–215.
Fabrikant, S. I., Rebich-Hespañha, S., & Hegarty, M.(2010). Cognitively inspired and perceptually salientgraphic displays for efficient spatial inference making.Annals of the Association of American Geographers, 100(1), 1–17.
Garlandini, S., & Fabrikant, S. I. (2009). Evaluating theeffectiveness and efficiency of visual variables for geo-graphic information visualization. In K. S. Hornsby, C.Claramunt, M. Denis, & G. Ligozat (eds), Spatial infor-mation theory. COSIT 2009. Lecture notes in computerscience (Vol. 5756). Berlin: Springer. doi:10.1007/978-3-642-03832-7_12
Grossmann, I., & Varnum, M. (2011). Social class, culture,and cognition. Social Psychological and PersonalityScience, 2, 1.
Hegarty, M., Canham, M., & Fabrikant, S. I. (2010). Thinkingabout the weather: How display salience and knowledgeaffect performance in a graphic inference task. Journal ofExperimental Psychology: Learning, Memory, andCognition, 36(1), 37–53.
Hoaglin, D. C., & Iglewitz, B. (1987). Fine-tuning someresistant rules of outlier labeling. Journal of the AmericanStatistical Association, 82(400), 1147–1149.
Hoaglin, D. C., Iglewitz, B., & Tukey, J. W. (1986).Performance of some resistant rules for outlier labeling.Journal of the American Statistical Association, 81(396),991–999.
Huang, H. S., & Hanley, J. R. (1995). Phonological awarenessand visual skills in learning to read Chinese and English.Cognition, 54(1), 73–98.
Hudson, W. (1960). Pictorial depth perception in sub-cul-tural groups in Africa. Journal of Social Psychology, 52(2),183–208.
CARTOGRAPHY AND GEOGRAPHIC INFORMATION SCIENCE 11

Ishii, K. (2013). Culture and the mode of thought: A review.Asian Journal of Social Psychology, 16(2), 123–132.
Kitayama, S., & Cohen, D. (2010). Handbook of culturalpsychology. New York: Guilford Press.
Kitayama, S., Duffy, S., Kawamura, T., & Larsen, J. (2003).Perceiving an object and its context in different cultures: Acultural look at new look. Psychological Science, 14(3),201–206.
Kozhevnikov, M. (2007). Cognitive styles in the contextof modern psychology: Toward an integrated frame-work of cognitive style. Psychological Bulletin, 133(3),464–481.
Krygier, J., & Wood, D. (2005). Making maps: A visual guideto map design for GIS. New York: Guilford Press.
Kubíček, P., Šašinka, Č., Stachoň, Z., Štěrba, Z., Apeltauer, J.,& Urbánek, T. (2017). Cartographic design and usabilityof visual variables for linear features. Cartographic Journal,54(1), 91–102.
Kuwabara, M., & Smith, L. (2012). Cross-cultural differences incognitive development: Attention to relations and objects.Journal of Experimental Child Psychology, 113(1), 20–35.
Lee, D., Shin, H. J., Weldon, R. B., & Sohn, M.-H. (2016).Cross-cultural differences in consistent mapping effects oftargets and distractors. Journal of Cross-CulturalPsychology, 47(4), 525–539.
Li, X., Çöltekin, A., & Kraak, M.-J. (2010). Visual explora-tion of eye movement data using the space-time-cube.In S. I. Fabrikant, T. Reichenbacher, M. van Kreveld, &C. Schlieder (Eds.), Lecture notes in computer science:Vol. 6292. GIScience 2010: Geographic informationscience (pp. 295–309). Berlin: Springer.
Lloyd, R. (1997). Visual search processes used in map reading.Cartographica: The International Journal for GeographicInformation and Geovisualization, 34(1), 11–32.
Louis, R. P. (2006, March). Difficulties of incorporating indi-genous spatial perceptions with western cartographic tradi-tions. Paper presented at the Association of AmericanGeographers Annual Conference, Chicago, USA.
Ma, L.-Q., Xu, K., Wong, -T.-T., Jiang, B.-Y., & Hu, S.-M.(2013). Change blindness images. IEEE Transactions onVisualization and Computer Graphics, 19(11), 1808–1819.
Masuda, T., & Nisbett, R. (2001). Attending holistically ver-sus analytically: Comparing the context sensitivity ofJapanese and Americans. Journal of Personality andSocial Psychology, 81(5), 922–934.
Masuda, T., & Nisbett, R. (2006). Culture and change blind-ness. Cognitive Science, 30(2), 381–399.
Matsumoto, D., Kudoh, T., & Takeuchi, S. (1996). Changingpatterns of individualism and collectivism in the UnitedStates and Japan. Culture & Psychology, 2(1), 77–107.
Miyamoto, Y., Nisbett, R., & Masuda, T. (2006). Culture andthe physical environment holistic versus analytic percep-tual affordances. Psychological Science, 17(2), 113–119.
Montello, D. (2002). Cognitive map-design research in thetwentieth century: Theoretical and empirical approaches.Cartography and Geographic Information Science, 29, 3.
Montello, D. R. (1995). How significant are cultural differ-ences in spatial cognition? In A. U. Frank & W. Kuhn(Eds.), Lectures notes in computer science: Spatial informa-tion theory; a theoretical basis for GIS. COSIT 1995(Vol. 988, pp. 485–500). Berlin: Springer.
Navon, D. (1977). Forest before trees: The precedence ofglobal features in visual perception. Cognitive Psychology,9(3), 353–383.
Nisbett, R., & Masuda, T. (2003). Culture and point of view.Proceedings of the National Academy of Sciences, 100(19),11163–11170.
Nisbett, R., & Miyamoto, Y. (2005). The influence of culture:Holistic versus analytic perception. Trends in CognitiveSciences, 9(10), 467–473.
Ooms, K., De Maeyer, P., Dupont, L., Van der Veken, N.,van de Weghe, N., & Verplaetse, S. (2015). Education incartography: What is the status of young people’s map-reading skills? Cartography and Geographic InformationScience, 43(2), 134–153.
Oyserman, D., & Lee, S. (2008). Does culture influence whatand how we think? Effects of priming individualism andcollectivism. Psychological Bulletin, 134(2), 311–342.
Popelka, S., Stachoň, Z., Šašinka, Č., & Doležalová, J. (2016).Eyetribe tracker data accuracy evaluation and its intercon-nection with hypothesis software for cartographic pur-poses. Computational Intelligence and Neuroscience, 2016.doi:10.1155/2016/9172506
Rayner, S. G., & Riding, R. J. (1997). Towards a categorisa-tion of cognitive styles and learning styles. EducationalPsychology, 17(1&2), 5–28.
Rivers, W. H. (1905). Observations of the senses of theTodas. British Journal of Psychology, 1(4), 321–396.
Šašinka, Č., Morong, K., & Stachoň, Z. (2017). The hypoth-esis platform: An online tool for experimental researchinto work with maps and behavior in electronic environ-ments. ISPRS International Journal of Geo-Information,407(6), 1–22.
Segall, M. H., Dasen, P. R., Berry, J. W., & Poortinga, Y. H.(1990). Human behavior in global perspective: An introduc-tion to cross-cultural psychology. Needham Heights, MA:Allyn and Bacon.
Shin, G., & Kim, C. (2015). Neural correlates of cognitive styleand flexible cognitive control. Neuroimage, 113, 78–85.
Spotorno, S., & Faure, S. (2011). Change detection in com-plex scenes: Hemispheric contribution and the role ofperceptual and semantic factors. Perception, 40(1), 5–22.
Stachoň, Z., Šašinka, Č., Štěrba, Z., Zbořil, J., Březinová, Š., &Švancara, J. (2013). Influence of graphic design of carto-graphic symbols on perception structure. KartographischeNachrichten, 4, 216–220.
Stachoň, Z., & Šašinka, Č. (2012). Human cognition: Peoplein the world and world in their minds. In T. Podobnikar &M. Čeh (Eds.), Universal ontology of geographic space:Semantic enrichment for spatial data. Ljubljana: IGIGlobal.
Stea, D., Blaut, J. M., & Stephens, J. (1996). Mapping as acultural universal. In J. Portugali (Ed.), The construction ofcognitive maps (pp. 345–360). Dordrecht, Netherlands:Springer.
Svatoňová, H., & Kolejka, J. (2017). Comparative research ofvisual interpretation of aerial images and topographicmaps for unskilled users: Searching for objects importantfor decision-making in crisis situations. ISPRSInternational Journal of Geo-Information, 6(8), 231.
Tiedemann, J. (1989). Measures of cognitive styles: A criticalreview. Educational Psychologist, 24(3), 261–275.
12 Z. STACHOŇ ET AL.

Tukey, J. W. (1977). Exploratory data analysis. Reading, MA:Adison-Wesley.
van de Vijver, F. J. R., & Poortinga, Y. H. (2005). Conceptualand methodological issues in adapting tests. In R. K.Hambleton, P. F. Merenda, & C. D. Spielberger (Eds.),Adapting educational and psychological tests for cross-cul-tural research (pp. 39–64). Mahwah, NJ: Lawrence Erlbaum.
Varnum, M. E. W., Grossman, I., Kitayama, S., & Nisbett, R.(2010). The origin of cultural differences in cognition:Evidence for the social orientation hypothesis. CurrentDirections in Psychological Science, 19(1), 9–13.
Wagemans, J., Elder, J. H., Kubovy, M., Palmer, S. E.,Peterson, M. A., Singh, M., & Von Der Heydt, R. (2012).A century of Gestalt psychology in visual perception:I. Perceptual grouping and figure-ground organization.Psychological Bulletin, 138(6), 1172–1217.
Waxman, S. R., Fu, X., Ferguson, B., Geraghty, K., Leddon,E., Liang, J., & Zhao, M.-F. (2016). How early is infants’attention to objects and actions shaped by culture? Newevidence from 24-month-olds raised in the US and China.Frontiers in Psychology, 7(97), 1–10.
Witkin, H. A., & Goodenough, D. R. (1977). Field depen-dence and interpersonal behavior. Psychological Bulletin,84(4), 661–689.
Yeatts, P. P., & Strag, G. A. (2014). Flexibility of cognitivestyle and its relationship to academic achievement infourth and sixth grades. The Journal of EducationalResearch, 64(8), 345–346.
Zhang, B., & Seo, H.-S. (2015). Visual attention toward food-item images can vary as a function of background saliencyand culture: An eye-tracking study. Food Quality andPreference, 51, 172–179.
CARTOGRAPHY AND GEOGRAPHIC INFORMATION SCIENCE 13