cross-border merchant research 2016 usa report - … · cross-border merchant research 2016 usa...
TRANSCRIPT

© 2016 PayPal Inc.
Cross-Border Merchant Research 2016 USA Report Ipsos MORI Contacts: Laura Acey & Peter Attwell PayPal Contact: Melissa O’Malley

© 2016 PayPal Inc.
Background & Objectives
PayPal commissioned Ipsos to conduct a six market survey with a total of 1,200 merchants to provide insights into CBT strategies.
In combination with previous consumer insights work, this research showcases gaps in merchant strategy vs. consumer demand for cross-border transactions
Advancement of technology is increasing commerce opportunities for online merchants, allowing them to sell across borders, anywhere, anytime.
This survey is designed to gain insight into 4 main areas: • How merchants are currently selling online (domestically and across borders) • Merchants’ cross-border markets, payment options, and pricing strategies • The drivers and barriers of cross-border transactions • Merchants’ usage / management of foreign currencies

© 2016 PayPal Inc.
Research Methodology This study was conducted across 6 markets and 1,214 ‘online merchants’ in total.
3
Screening & Classification
Online Sales and Payment Channels
Cross-Border Transactions
Foreign Exchange (FX) & Currency Management
Online survey
All fieldwork took place in Nov- Dec 2015
Questionnaire length of 15-20 minutes
Targeted mail-out to financial decision makers
Screened for: - Decision maker for payment systems - Currently offer customers an option
to pay online Respondents recruited from online panels
Fieldwork Sample
Questionnaire
This research was carried out to the international quality standard for market research, ISO 20252:2012
Businesses defined as follows: Small business = 0-50 employees Medium = 51-250 employees Large = 251 + employees
6 markets Target sample of 200 per market.
Drivers & Barriers to Cross-Border
Selling
The achieved sample sizes have been limited by the accessibility of key decision makers for participation in market research. This also means that no sample quotas were applied. Care should be taken in the interpretation of data based on sub-samples of the total survey sample as bases may be small.

© 2016 PayPal Inc.
Publication Note The following information should be included in any news releases or materials for publication by PayPal. Additional guidelines on news releases are in Appendix B. Please note: All PR releases/materials for publication should be sent to the Ipsos team for approval prior to publication
4
Example of technical note
On Behalf of PayPal, Ipsos interviewed a sample of 202 adults who are decision makers/influencers in implementing payment systems at the company they work for, and whose business offers customers the option to make purchases online. Interviews were conducted online between Nov – Dec 2015. No quotas were applied to the sample, and no weighting has been applied to the data.
Research was carried out on behalf of PayPal by Ipsos MORI
Audience surveyed: Key decision makers/influencers in implementing payment systems at the company they work for, and whose business offers customers the option to make purchases online either through their own website or a third party such as Amazon. Referenced throughout this report as ‘online merchants’
Sample size: 202.
Method of data collection: Online survey recruited from Business-to-Business (B2B) research panels
Sampling method: Targeted mail-out to financial decision makers.
No sample quotas were applied and data was analysed unweighted
NB: If results are being published, please include contact details of the PayPal team

© 2016 PayPal Inc.
USA FINDINGS
5

© 2016 PayPal Inc. A.
Over a third of US on-line merchants are selling across borders (36%) and the majority have a dedicated business website (69%).
Just over half of cross-border sellers (53%) and 40% of domestic-only sellers use online marketplaces – with eBay & Amazon being the most commonly used.
Over half of merchants’ websites have a mobile specific version (54%) and merchants are placing more importance on having solutions for smartphone than they are on tablet solutions.
1 in 3 merchants track which device shoppers are using, and from this it is clear that ‘traditional’ desktop/laptop purchases still have the largest share of sales, followed by smartphones
Key Conclusions:
Canada and the UK are US merchants’ strongest cross-border corridors, with Canada alone providing 41% of CBT revenue.
Europe is the most accessed region outside North America and represents 25% of CBT revenue
10 countries together provide 77% of the CBT revenue
1 in 3 merchants who currently only sell domestically intend to start selling cross-border in the next year

© 2016 PayPal Inc. A.
Merchants surveyed indicated that PayPal was a leading payments provider and is responsible for processing around 40% of revenue, for both domestic and cross-border transactions
A desire for business growth is the primary driver for selling in other countries
18% of merchants who currently sell cross-border expect to have a higher proportion of CBT sales in the next year, Canada and the UK being the markets expected to offer most growth in 2016
Key Conclusions: Continued
Social media & search engine optimisation are the most popular methods for driving cross-border traffic
For domestic-only sellers, the risk of fraud from foreign shoppers is the no.1 concern about CBT, and for all merchants the issue of shipping is a key concern
Cross-border sellers believe shipping costs are the no.1 reason for foreign shoppers to abandon a potential online purchase
The majority of cross-border sellers currently offer one price, in one currency for all markets (58%), but only 1 in 5 say this would be their preferred strategy (22%). The whole area of currency and exchange appears to be one that merchants find difficult

© 2016 PayPal Inc. 8
1. ONLINE PAYMENTS
2. CROSS-BORDER TRANSACTIONS
3. CROSS-BORDER DRIVERS AND BARRIERS
4. CURRENCY MANAGEMENT
5. APPENDICES

© 2016 PayPal Inc.
Domestic and Cross-Border Online Selling Almost two-thirds (63%) of online businesses sell to their domestic market only (i.e. sell only to customers in the USA)
9
63%
34%
2%
Domestic Only Sellers
Domestic vs. Cross-Border Merchants
Domestic and Cross-Border Sellers
Cross-Border Only Sellers
Incidence of cross-border selling by business model*:
B2B: 39% B2C: 39%
Q2. Which of the following countries or regions does your business currently accept online purchases from? Base: All online merchants (n=202)
*Base: Online merchants with a Business to Business (B2B) model (n=110) / Online merchants with a
Business to Consumer (B2C) model (n=155)

© 2016 PayPal Inc.
Merchants’ Online Shops Over two-thirds of online merchants in the USA have their own online shop (69%) After English, Spanish is the most commonly available language for these sites (15%)
10
Q1a. Through which of the following channels does your business accept online payments? Base: All online merchants (n=202) Q1c. How many full time employees does you business have primarily to run processes around your online shop? *Not showing ‘sole trader’ businesses Q2b. Which languages is your online shop available in? Base: Merchants who sell through a business website (n=140)
69% of merchants accept payments through a dedicated business website
Russian: 1%
French: 9%
English: 99%
Italian: 4%
Spanish: 15%
Polish: 1%
German: 4%
Languages merchants’ online shop is available in (%)
Average number of full time staff primarily employed to run processes around business’ website, by business size*:
3.3
10.8
28.1
Micro business (2-10 employees) n=33
Small business (11-50) n=28
Medium / large business (51+) n=52

© 2016 PayPal Inc.
Mobile Website Optimisation Over half of merchants’ websites have a mobile specific version (54%) and mobile-responsive solutions for smartphone are more common than for tablet. Larger businesses are more likely to have a specific mobile website, and to have implemented solutions for tablet
11
Q1b. Is your business website optimised for Internet browsers / apps on mobile devices? Base: Merchants who sell through a business website (n=140)
54
44
26
14
7
17
The business' website has a specific mobile version
Website design is mobile-responsive for smartphone
Website design is mobile-responsive for tablet
The business has a dedicated smartphone app
The business has a dedicated tablet app
None of the above
Business Websites’ Mobile Optimisation (%)
Significantly higher/lower scores: Smartphone vs. tablet @ 95% confidence
Small business: 43% (0-50 employees, n=88) Medium/Large business: 73% (51+ employees, n=52)
Small business: 19% Med/Large business: 38%
Significantly higher/lower scores: small vs. med/large business @ 95% confidence
Small business: 3% Med/Large business: 13%

© 2016 PayPal Inc.
Online Marketplaces
12
40% of merchants who only sell domestically use online marketplaces / third party sites
53% of merchants who sell cross-border use online marketplaces / third party sites
Just over half of USA merchants selling cross-border (53%) & 40% of domestic only sellers use online marketplaces, and eBay is the most commonly used among both groups
Domestic Only Sales Cross-Border Sales
Marketplaces Used (%)
Significantly higher scores: domestic vs. cross-border @ 95% confidence
Q1a. Through which of the following channels does your business accept online payments? Base: All online merchants (Domestic only sellers n=128 / Cross-Border sellers n=74) Q2c/Q2d. Which of the below [third party sites / online marketplaces] do you use [to accept online payments]? Base: Merchants who sell through online marketplaces (Domestic only sellers n=51/ Cross-border sellers n=39) Not showing ‘don’t know’
eBay
Amazon
Craigslist
Etsy
Bonanza
eBid
Ruby Lane
eCrater
11Main.com
Zibbet
Other
59 38
18 21
26 18
10 10 13 15 13 13
18
53 39
16 16 14 10
6 6 4 4 2 0
24

© 2016 PayPal Inc.
43
9
4
9
15
5
14
Online Sales: Domestic and Cross-Border
13
Q3a. What is the total value of your online sales in the last 12 months? Please indicate value for both domestic purchases (from within your own country) and purchases from other countries where applicable. Bases for Average L12M revenue call outs as follows: Domestic Sellers: Sole trader (n=55) ,Micro businesses (n=44), Small (n=37), Med/Large (n=61) *Cross Border Sellers: Sole trader (n=19) ,Micro businesses (n=16), Small (n=16), Med/Large (n=23)
Under $50,000
$50,000 - $249,999
$250,000 - $499,999
$500,000 - $999,999
$1 million - $1.999 million
$2 million - $4.999 million
$5 million or more
Last 12 months Online Revenue (%)
Domestic Online Sales Cross-Border Online Sales
38
17
3
7
13
7
17
Average L12M Online Revenue (total): $12.75 million $20.21 million
Base: Cross-Border Sellers (n=74) Base: Domestic Sellers (n=197)
Average L12M online domestic revenue by business
size: Sole trader: $0.27 million Micro (2-10): $3.62 million Small (11-50): $6.20 million Med/Large (51+): $34.55 million
Average L12M online cross-border revenue by business
size*: Sole trader: $6,900 Micro (2-10): $1.70 million Small (11-50): $7.33 million Med/Large (51+): $58.73 million

© 2016 PayPal Inc.
50
25
16
9
52
24
15
8
Desktop / laptop Smartphone Tablet Other
Online Sales: Device Share 2 in 3 merchants do not track which device shoppers are using, but among those who do, device share of domestic and cross-border sales is almost identical. Whilst half of sales come from the ‘traditional’ desktop / laptop, around a quarter are through smartphones
14
Q5c. Do you track what device shoppers are using when they purchase from your site? Base: All online merchants , excluding ‘don’t know’ (n=187) Q5d. What percentage of your domestic and foreign online sales comes from consumers using each of the following devices? Base: Online merchants who track shoppers’ devices, excluding ‘don’t know’
(n=53) (n=23*)
Device Share of Online Sales (%)
Domestic Sales
CBT Sales*
*CAUTION! Small base (n<30)
Track Online Shoppers’ Devices? (%)
34
66
Yes No

© 2016 PayPal Inc.
Online Sales: Payment Methods Offered Payment methods offered are similar for domestic & cross border shoppers, with PayPal no.1 in both categories. Other online wallets are more commonly provided for cross-border transactions and invoicing is more likely to be offered for domestic sales
15
Q4b. Please indicate which of the following online payment options your business offers to its shoppers, whether they are domestic or from a foreign country (thinking generally if you sell to multiple foreign markets) Base: All online merchants Domestic Sellers n=197 / Cross-Border Sellers n=74) Q4a. Do you offer different payment methods depending upon the market of your foreign online shoppers? Base: Online merchants who sell cross-border (n=74)
35% of merchants who sell cross-border offer shoppers different payment methods in different markets
PayPal
Credit cards
Debit cards
Direct bank transfers
Payment upon invoice
Other online wallet
Cash on delivery
Direct debit
Other mobile solution
Other solution(s)
Domestic Shoppers Cross-Border Shoppers 73
63 54
26 20 18 16 13
3 1
Payment Methods Offered (%)
69 61
50 31
7 27
8 18
1 4
Significantly higher scores: domestic vs. cross-border @ 95% confidence
© 2016 PayPal Inc. 16
1. ONLINE PAYMENTS
2. CROSS-BORDER TRANSACTIONS
3. CROSS-BORDER DRIVERS AND BARRIERS
4. CURRENCY MANAGEMENT
5. APPENDICES
© 2016 PayPal Inc.
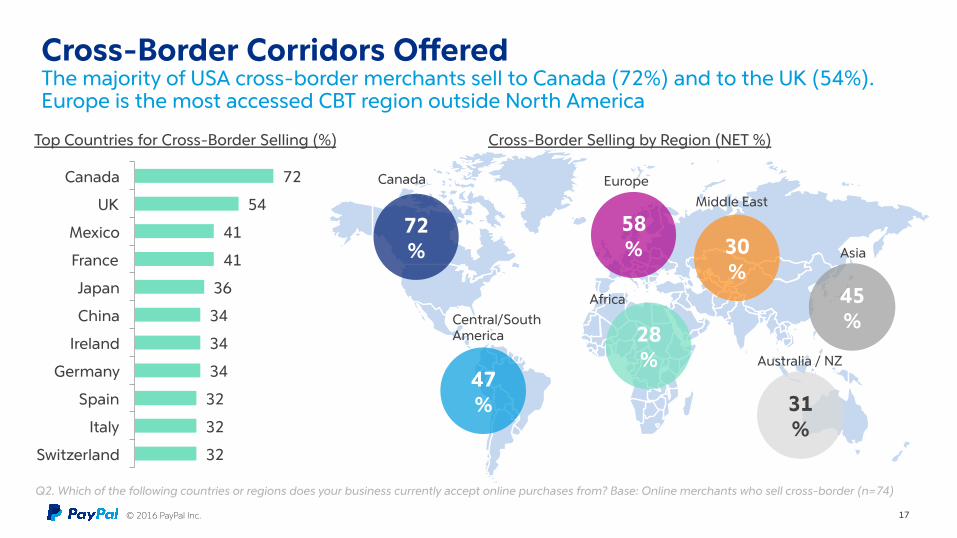
Cross-Border Corridors Offered The majority of USA cross-border merchants sell to Canada (72%) and to the UK (54%). Europe is the most accessed CBT region outside North America
17
28%
72%
47%
58% 30
%
Canada
Central/South America
Europe
Africa
Middle East
Cross-Border Selling by Region (NET %) Top Countries for Cross-Border Selling (%)
72
54
41
41
36
34
34
34
32
32
32
Canada
UK
Mexico
France
Japan
China
Ireland
Germany
Spain
Italy
Switzerland
Q2. Which of the following countries or regions does your business currently accept online purchases from? Base: Online merchants who sell cross-border (n=74)
45%
Asia
31%
Australia / NZ

© 2016 PayPal Inc.
Cross-Border Corridors: Revenue Share Canada provides by far the largest share of cross-border sales revenue (41%) to US merchants, and sales in Europe account for a quarter of CBT revenue.
18
Q3b. Thinking specifically about your online sales from foreign countries [ $ xxx thousand / million] what percentage of this comes from each of the following markets? Base: Online merchants who sell cross-border (n=74)
2%
41%
12%
25% 4%
Central/South America
Europe
Africa
Middle East
Share of CBT Sales by Region (NET %) Top Countries: Share of CBT Sales (%)
41
8
5
5
4
4
3
3
2
2
Canada
UK
Brazil
India
France
Mexico
Japan
China
Australia / NZ
Ireland
77%
Canada
13%
Asia
2%
Australia / NZ

© 2016 PayPal Inc.
CBT Expectations 1 in 3 domestic-only merchants say they will begin selling cross-border within 2016. Among current CBT merchants, the majority expect no change to their proportion of cross-border sales (77%), but almost 1 in 5 anticipate growth (18%)
19
Q6b. Do you intend to start accepting payments from cross-border shoppers within the next 12 months? Base: Online domestic-only sellers, excluding don’t know (n=110) Q6a. How do you think the proportion of online cross-border shoppers will change for your business in the next 12 months vs. the past 12 months? Base: Online merchants who sell cross-border, excluding ‘don’t know’ (n=60).
33% of merchants who currently only sell domestically intend to start selling cross-border in the next year
18% of current cross border sellers expect they will have a higher proportion of CBT sales in the next year
5% of current cross border sellers expect a lower proportion of CBT sales in the next year
77% of current cross border sellers expect there will be no change to their CBT sales in the next year

© 2016 PayPal Inc.
New, Growth, and Exit Markets Canada and the UK are the markets expected to offer most growth in 2016 – both in terms of new merchants entering the market & increased sales amongst those already present.
20
Q6c. In the next 12 months, do you plan to start selling in any new markets, expand your sales in any of your existing markets, or stop selling in any markets where you currently sell? Base: Online merchants who currently sell, cross-border or intend to in the next 12 month. N.B. Not showing domestic country (USA) in charts
START SELLING (%):
22 15
14 12 12
11 11 11 11 11
Canada UK
Italy Spain China
Austria France
Germany Poland Japan
GROW SALES (%):
27 22
14 12 12 12
11 11
9 9 9
Canada UK
France Italy
Spain Mexico
Germany China
Ireland Austria
Japan
STOP SELLING (%):
1
1
1
1
1
1
1
1
1
UK
France
Germany
Russia
Canada
Nigeria
India
Turkey
KSA
Base: Current / N12M CBT sellers (n=110) Base: Current CBT sellers (n=74) Base: Current CBT sellers (n=74)
N12M Top Cross Border Markets
85% say ‘None’ or ‘Don’t know’

© 2016 PayPal Inc. 21
1. ONLINE PAYMENTS
2. CROSS-BORDER TRANSACTIONS
3. CROSS-BORDER DRIVERS AND BARRIERS
4. CURRENCY MANAGEMENT
5. APPENDICES

© 2016 PayPal Inc.
Cross-Border Drivers A desire for business growth is the primary driver for selling in other countries among both current cross border sellers (54%) & merchants intending to sell cross-border in the next 12 months (44%)
22
Q8a. Why [do you choose to / are you now intending to] sell online to shoppers in other countries? Base: Online merchants who sell cross-border or intend to in the next 12 months
Why sell cross-border? (%)
To aid business growth
Demand from foreign customers
Increase margin by selling to other markets
Too much domestic competition
Don’t know
Current cross-border sellers (n=74)
54
51
36
14
9
44
33
39
14
14
N12M cross-border intenders (n=36)
Note: None of the differences between current cross-border sellers & N12M intenders are statistically significant

© 2016 PayPal Inc.
Driving Cross-Border Site Traffic Social media & search engine optimisation are the most popular methods for driving cross-border traffic to business websites, with over 1 in 3 cross-border sellers using these (38%)
23
Q8b. How do you drive traffic from foreign online shoppers to your website? Base: Online merchants who sell cross-border (n=74)
How merchants drive CBT traffic (%)
38
Social media
38
Search engine
optimisation (SEO)
31 Recommend
-ations 27
Unique, publically
known brand
23 Marketplace advertising
3
Other
20 Marketplace
listings
16
Affiliate marketing
14 Search engine
marketing (SEM)
14 Price /
product comparison
listings

© 2016 PayPal Inc.
Cross-Border Barriers For domestic-only sellers, the risk of fraud from foreign shoppers is the no.1 concern (ranked 5th for current CBT merchants), and for both groups shipping is a key concern
24
Q9. What are the main problems and barriers preventing you selling to foreign online shoppers, whether in general or in relation to specific markets?
23
22
19
19
18
16
16
15
15
14
14
Shipping costs
Shipping time
Market regulation compliance
Customs and duties
Fraud from foreign shoppers
Having to offer shipping
High translation cost/effort
Offering different currencies
Tracking shipments
Local/international tax compliance
Handling cross-border payments
Top Barriers to Cross-Border Selling (%)
21
20
18
15
15
14
14
14
14
13
12
12
Fraud from foreign shoppers
Shipping costs
Customs and duties
Tracking shipments
Shipping time
Handling cross-border payments
Having to offer shipping
Generating demand & traffic
High translation cost/effort
Local/international tax compliance
Handling cross-border returns
Market regulation compliance
Base: Online cross-border sellers (n=74) Base: Online domestic only sellers (n=128)

© 2016 PayPal Inc.
Cross-Border Purchase Abandonment Cross-border sellers believe shipping costs are the no.1 reason for foreign shoppers to abandon a potential online purchase. Just under a quarter (24%) also cite unclear prices (tax/duties) and delivery time (23%)
25
Q10. What do you think are the main reasons that online cross-border shoppers abandon merchants’ websites without completing a purchase? Base: Online merchants currently selling cross-border (n=74)
Top Perceived Reasons for CBT purchase abandonment (%)
26
24
23
19
18
18
15
12
12
Shipping costs
Tax / duty amount unclear
Delivery time
Paying in foreign currency
Poor currency conversion rate
Preferred payment unavailable
Returns too expensive
Foreign language checkout
Website security concerns
Significantly higher /lower scores @ 95% confidence

© 2016 PayPal Inc.
49
25
26
Yes
No - leave for consumers to handle
No - not a relevant issue for me
Cross-Border Taxes Just over half of merchants selling cross-border do not include taxes in their checkout price (51%), and of this group, over half have no intention to do so in the future (54%)
26
Q5e. For items that your business sells online to shoppers in foreign countries, do you include the import duties and taxes (customs collection costs) for your consumers? Base: Online merchants who sell cross-border, excluding ‘don’t know’ (n=72) Q5f. Do you intend to include import duties/taxes costs for your customers at checkout in the future?
Include CBT taxes in checkout price? (%) Intend to include in future? (%)
3
8
19
54
16
Yes
We want to implement this but don’t know how to do it
It will depend on our international expansion plans
No
Don’t know
Base: Online merchants don’t currently include tax at checkout (n=37)
% Yes by Business Size: Small business: 33% (0-50 employees, n=51) Med/Large business: 78% (51+ employees, n=23)

© 2016 PayPal Inc.
Cross-Border Information Sources Current cross-border sellers most commonly search online or discuss with peers to get information about selling to new international markets. Merchants intending to sell cross-border for the first time are most likely to refer to external consultants and partners
27
Q7. When thinking about international market(s) to sell to online in the future, which (if any) of the following sources of information do you use? Base: Online merchants who sell cross-border or intend to in the next 12 months
35 35
24 22 22 22 22
1
23 25
11
19
25 28 28
22
3
28
Online search engine
Discuss with colleagues /
peers
Online forums / publications /
blogs
Public e-commerce
studies
External export market
consultant
External bank partner
Shopping cart provider /
web developer
Other None / Don’t know
Sources of Information for international market selling (%) Current cross-border sellers (n=74) N12M cross-border intenders (n=36)
Significantly higher /lower scores: Current CBT sellers vs. N12M cross-border intenders @ 95% confidence

© 2016 PayPal Inc. 28
1. ONLINE PAYMENTS
2. CROSS-BORDER TRANSACTIONS
3. CROSS-BORDER DRIVERS AND BARRIERS
4. CURRENCY MANAGEMENT
5. APPENDICES

© 2016 PayPal Inc.
Shoppers’ Foreign Currency Options Only 4 in 10 cross-border sellers currently list in foreign currency (42%), with Euros being most widely offered. However, a quarter of CBT merchants (26%) aim to offer more choice in future
29
Q11a. In which currencies do you list your products/services online? / Q12b. Do you intend to offer more currency choices for online foreign shoppers in the future? Base: Online cross-border sellers (n=74) Q12c. Which currencies do you intend to offer in the future? Base: Online cross-border sellers who intend to offer more currency choices for shoppers (n=19*)
42% of cross border sellers list their products / services in a foreign currency
Shoppers’ available currencies (%)
96 30 22 15 8 8 3
26% of cross border sellers say they will offer more currency choices for online shoppers in the future
Currencies intending to offer* (%)
42 32
26 26 21 5
Pounds Sterling
Australian Dollars
Chinese Renminbi
Canadian Dollars
Euro Other

© 2016 PayPal Inc.
Reasons For Listing In Foreign Currency The majority of cross-border sellers who list in foreign currency do so because it is an automatic feature of their shopping cart (77%)
30
Q11b. Why do you choose to display your prices in foreign currencies? Base: Online cross border sellers who list their products/services in a foreign currency (n=31)
Reasons for listing in foreign currency (%)
77
48
23
3
6
It is the automatic setting of my shopping cart
To reassure foreign consumers & encourage them to purchase
To set different pricing for a specific market / currency
Other
Don’t know
© 2016 PayPal Inc.
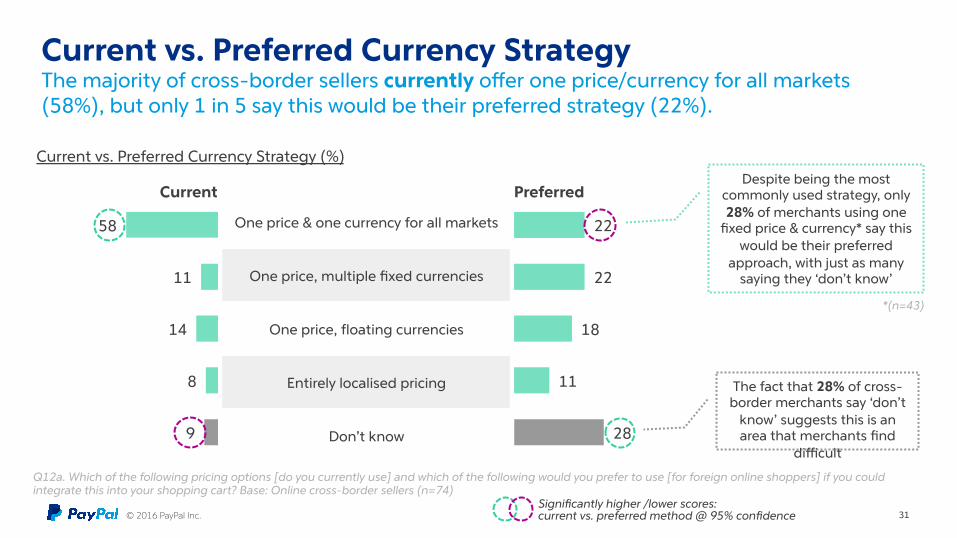
Current vs. Preferred Currency Strategy The majority of cross-border sellers currently offer one price/currency for all markets (58%), but only 1 in 5 say this would be their preferred strategy (22%).
31
Q12a. Which of the following pricing options [do you currently use] and which of the following would you prefer to use [for foreign online shoppers] if you could integrate this into your shopping cart? Base: Online cross-border sellers (n=74)
One price & one currency for all markets
One price, multiple fixed currencies
One price, floating currencies
Entirely localised pricing
Don’t know
58
11
14
8
9
Current vs. Preferred Currency Strategy (%)
Current Preferred
22
22
18
11
28
Significantly higher /lower scores: current vs. preferred method @ 95% confidence
The fact that 28% of cross-border merchants say ‘don’t
know’ suggests this is an area that merchants find
difficult
Despite being the most commonly used strategy, only 28% of merchants using one
fixed price & currency* say this would be their preferred
approach, with just as many saying they ‘don’t know’
*(n=43)
© 2016 PayPal Inc.
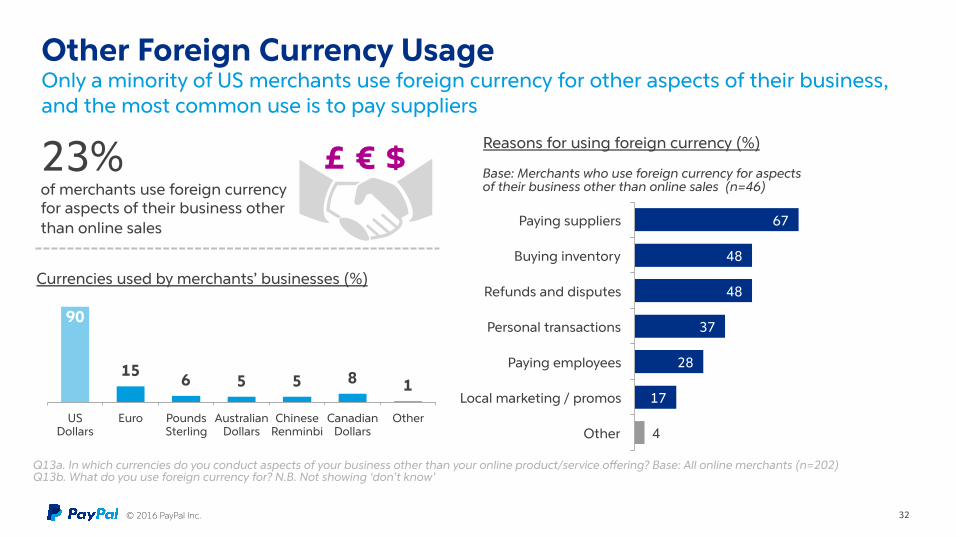
Other Foreign Currency Usage Only a minority of US merchants use foreign currency for other aspects of their business, and the most common use is to pay suppliers
32
Q13a. In which currencies do you conduct aspects of your business other than your online product/service offering? Base: All online merchants (n=202) Q13b. What do you use foreign currency for? N.B. Not showing ‘don’t know’
23% of merchants use foreign currency for aspects of their business other than online sales
Currencies used by merchants’ businesses (%)
90
15 6 5 5 8 1
US Dollars
Euro Pounds Sterling
Australian Dollars
Chinese Renminbi
Canadian Dollars
Other
Reasons for using foreign currency (%)
67
48
48
37
28
17
4
Paying suppliers
Buying inventory
Refunds and disputes
Personal transactions
Paying employees
Local marketing / promos
Other
Base: Merchants who use foreign currency for aspects of their business other than online sales (n=46)

© 2016 PayPal Inc.
Foreign Currency Accounts 50% of online merchants have a foreign currency bank account, and among this group ‘currency optimisation’ is the most common reason (34%).
33
Q14a. Please specify the number of bank accounts your business has in currencies other than your domestic currency, if any? Base: All online merchants (n=202) Q14b. What are the reasons for setting up those foreign currency bank accounts? Base: Online merchants who have at least 1 foreign currency bank account (n=100)
45
21
21
7
3
2
0
1
2-3
More than 3
Don’t know
Prefer not to answer
No. of foreign currency bank accounts (%)
50% of merchants have at least 1 foreign currency bank account
Reasons for foreign currency bank account(s) (%)
34
29
25
23
22
16
4
21
2
Currency optimisation
Trust from local consumers
Tax optimisation
Strategic positioning in market
Market legal restrictions
Warehouse/asset purchase
Other
Don’t know
Prefer not to say

© 2016 PayPal Inc.
FX Provider Usage PayPal is a popular provider for currency conversion, with just under half of online merchants using the service (45%) vs. under 1 in 3 for the banks (31%) and fewer than 1 in 10 merchants using any of the named competitors
34
Q15a. Which provider(s) does your business use for currency conversion? Base: All online merchants (n=202) N.B. Not showing ‘don’t know’
45
31
7 3 3 1
29
PayPal Bank Global Collect Transferwise Adyen Other Do not require currency
conversion
FX Provider Usage (%)
Small business: 44% (0-50 employees, n=139) Medium/Large business: 48% (51+ employees, n=63)
Small business: 22% Med/Large business: 51%
Small business: 2% Med/Large business: 17%
Small business: 37% Med/Large business: 10%
Significantly higher/lower scores: small vs. med/large business @ 95% confidence