crop protection programme managing rice pests … · crop protection programme managing rice pests...
TRANSCRIPT
CROP PROTECTION PROGRAMME
Managing rice pests in Bangladesh: improving Extension Service information management for policy and planning
R No 8447(ZA 0672)
FINAL TECHNICAL REPORT
1 April 2005 – 31 January 2006
Project Leader: Dr S T Murphy
CABI Bioscience (A Division of CAB INTERNATIONAL Date FTR completed January 2006
"This publication is an output from a research project funded by the United Kingdom Department for International Development for the benefit of developing countries. The views expressed are not necessarily those of DFID.”
Crop Protection Programme, RF8447
EXECUTIVE SUMMARY Insects, pathogens and weeds still represent a major constraint to rice crop production in Bangladesh. A major thrust has been the promotion and implementation of integrated pest management (IPM) techniques as national policy. In Bangladesh, the local offices of the Government Department of Agricultural Extension (DAE), Plant Protection Wing provides state support to IPM. DAE attempts to coordinate its central and local level activities through a nation-wide pest and disease surveillance, forecasting and early warning scheme. This scheme was developed in the late 1990s in response to perceived deficiencies in the original system but the scheme still falls short in many aspects. Critically, DAE only have a capacity to undertake pest surveillance and the whole operation is based on the hand processing of data that creates a range of problems. Lack of capacity and technology within the infrastructure is undermining the previous investment in IPM and is unintentionally promoting insecticide use by farmers. In this project activities were undertaken to build on the current pest surveillance operation by: clarifying its purposes and the information required, improving information management and the mechanisms for information flow within DAE and to farmers and NGOs. The major results are summarized below: • The purpose and demand for pest surveillance/forecasting scheme for rice crop
protection has been clarified with stakeholders. • The technical barriers to address in order to achieve the purpose have been
identified. • Recommendations have been agreed for efficient data management and also for
data products; specifically the development of electronic data sheets for processing data at the District and National levels. This will build on the current scheme.
• A review of sampling at the rice Block level showed that junior DAE officers follow DAE procedures in the current System Manual; thus sampling across rice Blocks is very uniform but the needs for new junior DAE officers to be trained in pest identification have been identified.
• Recommendations will be made at a BRRI/DAE workshop (in March 2006) to improve sampling protocols for some of the information required on the field form and for methods for data synthesis at the Upazilla and above levels.
• A report has been produced describing the information contained in the current pest surveillance and reporting forms, identifying potential ambiguity and subjectivity, ways in which the use of the forms can be standardized as possible and making the most of the information contained therein
• Automated spreadsheet versions of the forms at the District level and above have been developed. Accompanying the spreadsheets is a full written specification of the software. These forms will be validated at the workshop in March 2006. Recommendations will also be made for the way forward to implement the computerization of the data records (e.g., training of trainers) and to develop new data products of use for stakeholder decision-making (including NGOs).
i

The project will allow better targeting of resources through an improved understanding of the location and timing of pest attack. This, together with improved use of DAE resources, and more specific warnings issued to farmers will combine to make pest control more efficient and less environmentally damaging, so improving rice yields.
ii
CONTENTS
Page No. Executive Summary
i
Contents
iii
Acronyms
iv
Project Staff
v
Background
1
Project Purpose
4
Research Activities and Outputs Research Activities 1. National centralised rice pest information needs determined 2. Framework for national rice pest data collection and collation
improved 3. Centralised database framework established and functional for pest
surveillance Outputs 1. National centralised rice pest information needs determined 2 Framework for national rice pest data collection and collation
improved 3 Centralised database framework established and functional for pest
surveillance
55
5
6
88
15
17
Contribution of Outputs
26
References
28
Annexes Annex 1 Forms 1-4 from the DAE pest surveillance ‘System Manual’
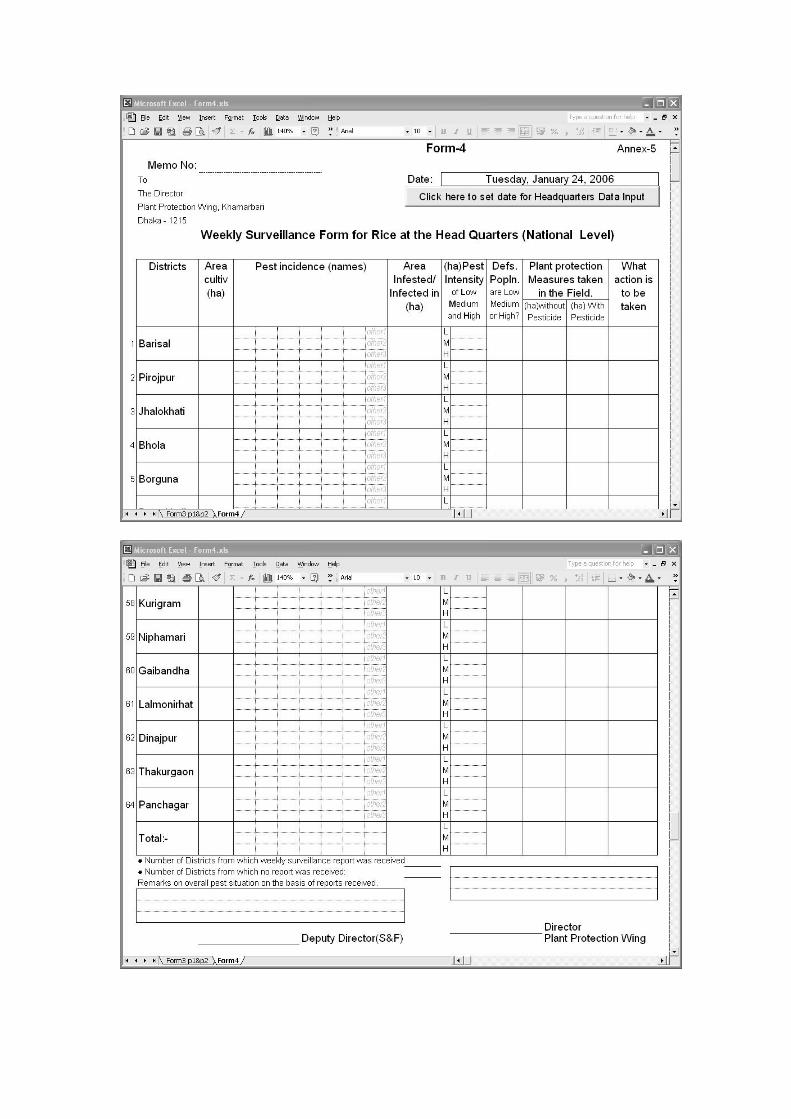
(2001) Annex 2 Copies of what appears on the computer screnn (‘screen dumps’) when viewing the electronic versions of Forms 3 and 4
Annex 3 The appearance of the printed versions of electonic Forms 3 and 4
29
iii
ACRONYMS AEO Agricultural Extension Officer BRRI - - Bangladesh Rice Research Institute CABI - CAB INTERNATIONAL CPP DFID Crop Protection Programme DAE - Department of Agricultural Extension (Bangladesh) DAE, SPPS Strengthening of Plant Protection Services (DAE project) DDAE Deputy Director Agricultural Extension IC - Imperial College, University of London, UK IPM Integrated Pest Management IRRI - International Rice Research Institute NGO Non-Governmental Organisation NRI - Natural Resources Institute, UK PPI Plant Protection Inspector PSF&EW Pest Surveillance, Forecasting and Early Warning RH Rice hispa (Dicladispa armigera) SAAO Sub-Assistant Agricultural Officer S&F Surveillance and Forecasting SP Sampling plot UAE Upazilla Agricultural Officer
iv
PROJECT STAFF AND ACKNOWLEDGEMENTS The project activities were undertaken by a coordinated team effort involving the following scientist and extension staff: CABI Dr. S.T. Murphy IC Dr. J.M. Stonehouse NRI Dr. J. Holt Dr. J. Venn BRRI Dr. N.Q. Kamal Mr. M.F. Rabbi Dr. D.A. Monsur Choudhury Dr Md. Abdur Razzaque Dr. D.N.R. Paul DAE Mr. Md Hasanul Haque Biometric advice was given by Dr. N.R. Paul, Head of BRRI Statistics Division, and by Drs. J. Holt, NRI, and S.T. Murphy, CABI, as these project staff have statistical training. The project staff would like to acknowledge inputs into the project from a wide range of people, in particular:
Many DAE extension staff working in the Districts of Bangladesh Technical staff of BRRI IRRI office, Bangladesh
v
BACKGROUND 1. Researchable Constraint Addressed Much effort has been made over the last few decades to improve insect, pathogen (here referred to as ‘pests’) and weed management within Bangladesh. One major thrust has been the promotion and implementation of IPM techniques to reduce the amount of chemicals that are used to control pests. IPM development and its delivery have received much external support from international assistance agencies such the UK’s Department for International Development (DFID) and DANIDA. This project stems from the CPP project ‘ Ecology and management of rice hispa (RH) in Bangladesh’ (Murphy, 2006). Some key outputs of the RH project are: • Overall, pests and weeds still cause considerable concern to rice farmers in all
areas. • Farmers have benefited from the extension of suppressive, non-pesticidal IPM
techniques (although these have not been as advanced for ‘outbreak’ pests such as RH).
• There is an expectation that the state should help farmers through information provision, e.g. the status of some pests (on a local basis), training in control techniques, and in some instances, the provision of materials (e.g. the loan of sweep nets). In some pest cases there is an expectation that the DAE should take direct action. All of these points are captured in the Government of Bangladesh policy on IPM.
The local offices of the Government Department of Agricultural Extension (DAE), Plant Protection Wing provides state support to IPM. DAE attempts to coordinate its central and local level activities through a nation-wide pest and disease surveillance, forecasting and early warning scheme (PSF&EW). This was developed in the late 1990s in response to perceived deficiencies in the original operation. It is described in English and Bangla in the manual ‘New Pest Surveillance, Forecasting and Early Warning System for Bangladesh’ by Ramaswamy, S, and Kazi Shafiq Uddin (DAE/DANIDA SPPS 49, April 2001, 58pp). This will be referred to as the ‘System Manual’. The RH project reviewed the scheme (given its importance to RH control) with BRRI and DAE and also used the records to investigate the historical correlation between RH outbreaks and climatic/environmental variables. Some very important broader points and issues about the scheme emerged which affect not just efforts against RH, but also efforts against all other major pests. These are as follows: • Although the general purposes of the national scheme has been written (in the
System Manual), not all aspects are operational. It is unclear what the current demand is for all aspects in the scheme.
• The ways in which the data can be used to improve policy decisions, planning and actions at national and local levels is not well understood.
• The records (on a block basis) cover many decades and cover all major rice insect pests and diseases. Much ancillary information has also been collected such as the areas of rice types planted and the areas treated with pesticides. But all of the
1
records at DAE HQ are in hard copy form and data collection and processing is still all by hand. The lack of an electronic system for processing and a centralised, database has greatly hindered the DAE use of current and older records.
• Some of the data collected at the rice block level is subjective and data collection methods need refinement to be useable in a centralised database.
In this project, we propose to improve the PSF&EW scheme as follows: clarifying its purpose and the demand, improving information management and the mechanisms for information flow within DAE and to farmers and NGOs. The lack of such a system and capability within the extension and research infrastructure is undermining the previous investment in IPM and is unintentionally promoting insecticide and other chemical use by farmers. Currently, BRRI underpins DAE extension work through its research activities. The proposed project also aims to build capacity within BRRI on PSF&EW such they will be able to support the future development of the scheme. All levels of staff will be consulted in the process as well as non-governmental organisations (NGO). 2. Demand Rice pests and weeds still cause substantial losses to crop production. For example, rice insects reduce yield production by 16% per year. The Government of Bangladesh has given high priority in pest management to reduce the yield gap and Integrated Pest Management (IPM) is one of the large programmes being implemented by the DAE. The specific demand and needs for the project were raised and discussed by national programme staff (BRRI, DAE) at a workshop on RH (‘Ecology and Management of Rice Hispa in Bangladesh) held at BRRI, Gazipur in April (24-25) 2004 (BRRI, 2005). The particular issues about pest surveillance in Bangladesh emerged during the course of the RH project – from some of the socioeconomic surveys with farmers and local DAE staff, and through discussions at DAE and BRRI head offices. 3. The current DAE pest surveillance operation and a brief on names of grades
of officers involved in the operation The DAE headquarters is in Dhaka where the management and coordination of the pest surveillance operation takes place. The Strengthening Plant Protection Service project (DAE, SPPS) is a project joint funded by DANIDA and the Government of Bangladesh. The project has been supporting the work of DAE’s Plant Protection Division in relation to various themes, including pest surveillance. The Director of SPPS is also based in DAE HQ. 3.1 The current operation The current operation is based on the System Manual and is briefly as follows. Rice pest information is gathered weekly on field sheets (referred to as ‘forms’), initially at Block (Form 1) level. Rice Blocks are very large (>20ha) and contain many small holder farms. Five Blocks are sampled in each Upazilla and then data (from the 5
2
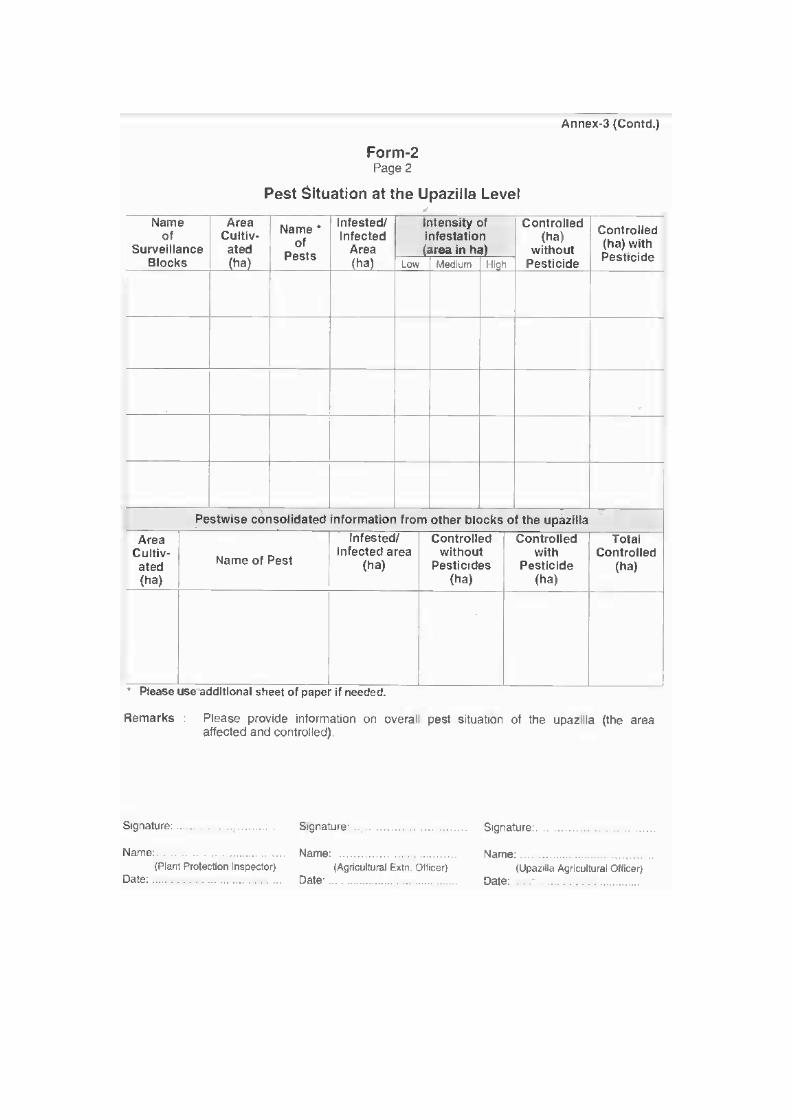
Form 1s) is consolidated at the Upazilla level (Form 2), and then so on at District (all Upazillas on a Form 3) and finally National Level (all Districts on a Form 4). See Annex 1 for copies of the current forms. Block, Upazilla and District forms follow a common format. Each form is in two parts (a ‘Page 1’ and ‘Page 2’) covering a range of information and requiring sampling to be done. On the Form 1,’Pages 1’are first a series of ‘Background boxes’ to allow a brief summary of the crop context (rice varieties, presence of irrigation and weeds, etc). Then there is a quantified count over 20 rice hills of pests in a single plot (0.2 ha – called a Surveillance Plot - SP) taken from the Block. Thus this is done five times in each Upazilla. The data is then synthesised by averages as the information on the five forms is consolidated at the Upazilla level. Data from the Upazillas are then likewise synthesised for each District. The method by which the SP and the rice hills are chosen in the SP are discussed and clarified in Activity/Output 2 later in the report. On the “Pages 2" are estimate of sum totals of areas of rice infested by different pest for the whole Block (used for the ‘Page 1’ sampling). Pest infestation is catagorised as follows: total, lightly infested, medium infested and heavily infested, according to thresholds set out in the System Manual - by pest species. Areas over which farmers have applied controls are also recorded. These are divided into pesticide and non - pesticide. The whole national operation is done by hand; the collection and the processing of the data. The final summary is made on the Form 4 at DAE HQ where decisions on alert/control actions (if any) are made. 3.2 Grades of DAE officers involved The names of the grades of important DAE officers in relation to the administrative units in Bangladesh are given below. Officers at each of these levels are responsible for the data collection or processing as outlined above. DAE HQ – Deputy Director of Agricultural Extension (Surveillance and Forecasting) (DDAE – S&F) – provides national awareness, coordination and actions. District - Deputy Director of Agricultural Extension (DDAE) – also responsible for awareness; e.g. to NGOs Upazilla – Agricultural Extension Officer (AEO) Plant Protection Inspector (PPI) Upazilla Agricultural Officer (UAO) Rice Block level – Sub-Assistant Agricultural Officer (SAAO). These officers are the ‘data collectors’ at the rice Block level and so are key in the whole operation. According to the System Manual they are asked to collaborate with five farmers to help assess the data for ‘Page 2’summaries of overall pest situation in the Block they
3
are using for surveillance. In Bangladesh, there are 64 Districts and 465 Upazillas (=Thanas). PROJECT PURPOSE The Crop Protection Programme output (= this project general purpose) is: integrated rice pest management strategy implemented in one floodplain area. The specific research purpose of the project is: ‘to improve Extension Service pest surveillance information management for policy, planning and actions’ The project purpose was addressed through three outputs: 1. National rice pest information needs for planning and policy determined. 2. Framework for national rice pest data collection and collation improved. 3. Centralised database framework established and functional for pest surveillance
data The research activities, methods and the project outputs are reported in the following sections. Although the project purpose focuses on surveillance, the wider questions of forecasting and early warning are also considered. Note: A workshop, planned to be held at the end of the project (January 2006) had to be postponed because of political problems in Bangladesh. This workshop is now planned for March 2006
4
RESEARCH ACTIVITIES AND OUTPUTS PROJECT RESEARCH ACTIVITIES 1. National rice pest information needs for planning and policy determined 1.1. Introduction and methods For this output a review was conducted of the purpose and demand for PSF& EW, the current pest surveillance operation, and the users of the scheme. A review was also conducted of the information generated and whether this is adequate in relation to perceived needs and of how stakeholders feel that improvements can be made. The review was undertaken by Dr John Stonehouse in collaboration with staff from the BRRI Adaptive Research Division. The review covered opinions of DAE staff at the Block, Upazilla, District and National levels; staff from two Districts were interviewed to cover the first three categories. Opinions were also sought from BRRI staff. All the interviews were informal in nature. The results and recommendations from the reviews were used to guide the activities under Output 3. 2. Framework for national rice pest data collection and collation improved 2.1 Introduction Following the review of the information needs (in 1 above), an assessment was made of: • Data collection methods at the rice block level and how these relate to methods in
the System Manual; and the variance between DAE data collectors • Data synthesis at higher levels (Upazilla, District etc.) • Training needs and support material at the DAE Sub-Assistant Agricultural
Officers (SAAO) level (i.e., those who collect the data on pests from the rice Blocks).
This work was undertaken by CABI and John Stonehouse in collaboration with BRRI and DAE. 2.2 Methods and materials For the data collection methods assessments at the rice Block level, all DAE Sub-Assistant Agricultural Officers (SAAO) were interviewed from four Upazillas representing three Districts (Table 1). Interviews were not formally structured as there was a need to fully understand and explore the level of knowledge about sampling and how this is applied. BRRI staff conducted the interviews and each SAAO was interviewed alone. The interviews were conducted in local language.
5
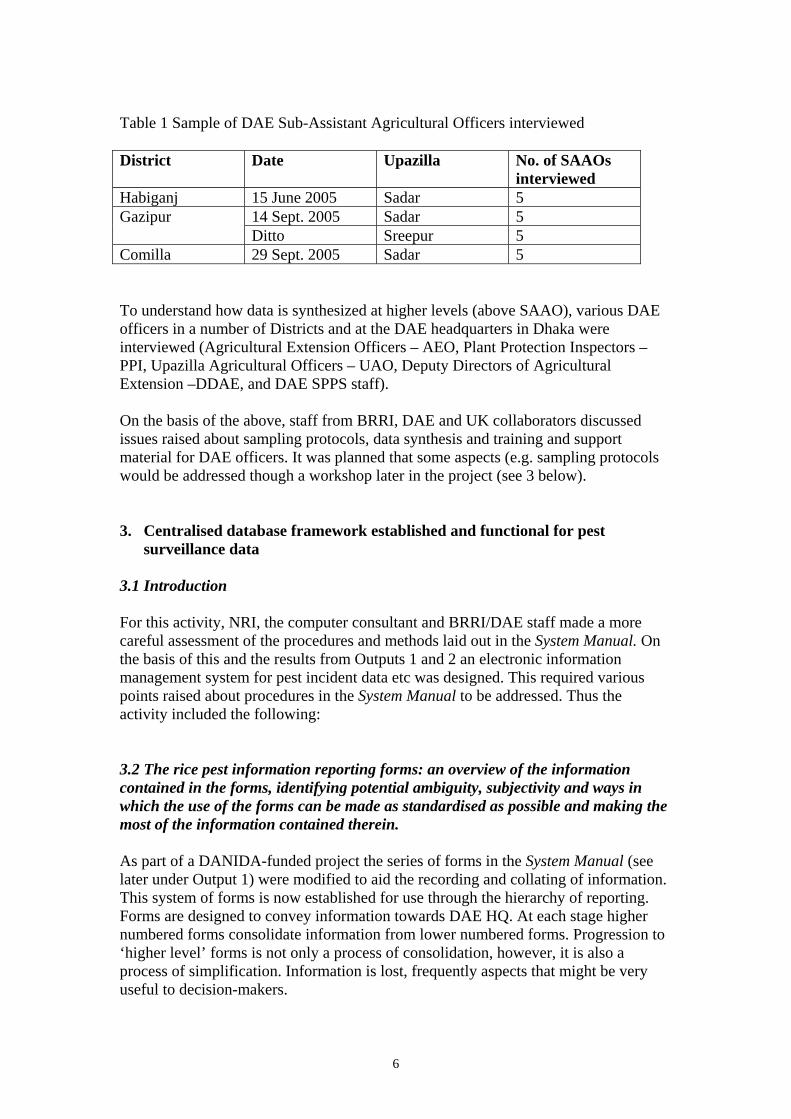
Table 1 Sample of DAE Sub-Assistant Agricultural Officers interviewed District Date Upazilla No. of SAAOs
interviewed Habiganj 15 June 2005 Sadar 5
14 Sept. 2005 Sadar 5 Gazipur Ditto Sreepur 5
Comilla 29 Sept. 2005 Sadar 5 To understand how data is synthesized at higher levels (above SAAO), various DAE officers in a number of Districts and at the DAE headquarters in Dhaka were interviewed (Agricultural Extension Officers – AEO, Plant Protection Inspectors – PPI, Upazilla Agricultural Officers – UAO, Deputy Directors of Agricultural Extension –DDAE, and DAE SPPS staff). On the basis of the above, staff from BRRI, DAE and UK collaborators discussed issues raised about sampling protocols, data synthesis and training and support material for DAE officers. It was planned that some aspects (e.g. sampling protocols would be addressed though a workshop later in the project (see 3 below). 3. Centralised database framework established and functional for pest
surveillance data 3.1 Introduction For this activity, NRI, the computer consultant and BRRI/DAE staff made a more careful assessment of the procedures and methods laid out in the System Manual. On the basis of this and the results from Outputs 1 and 2 an electronic information management system for pest incident data etc was designed. This required various points raised about procedures in the System Manual to be addressed. Thus the activity included the following: 3.2 The rice pest information reporting forms: an overview of the information contained in the forms, identifying potential ambiguity, subjectivity and ways in which the use of the forms can be made as standardised as possible and making the most of the information contained therein. As part of a DANIDA-funded project the series of forms in the System Manual (see later under Output 1) were modified to aid the recording and collating of information. This system of forms is now established for use through the hierarchy of reporting. Forms are designed to convey information towards DAE HQ. At each stage higher numbered forms consolidate information from lower numbered forms. Progression to ‘higher level’ forms is not only a process of consolidation, however, it is also a process of simplification. Information is lost, frequently aspects that might be very useful to decision-makers.
6
This section comprises a detailed appraisal of the forms and the information they contain – an essential precursor to their computerisation. Crucially, we consider how the information is summarised as it moves through the hierarchy; what information is lost and what is the meaning and value of the summarised data. This output identifies potential ambiguity and subjectivity and provides pointers to ways in which: the use of the forms can be made as standardised as possible and, the most can be made of the information contained therein. For the reasons discussed later, a decision was made during computerisation to work within the existing form structure but was felt essential to highlight current and potential problems inherent in these forms to provide a record to inform any future efforts to improve the data management structures. 3.3 Automated spreadsheet versions of Forms 3 and 4. These are designed to make data entry easy, reduce transcription errors and encourage standardisation of information. Accompanying the spreadsheets is a full written specification of the software Spreadsheet versions of the forms (3 and 4) were developed as a basis for moving the data management towards computerisation. This is not an entirely straight-forward task as assumptions had to be made at various points, particularly in the way information from lower levels is condensed and integrated. All such assumptions have been carefully documented. 3.4 Recommendations for the way forward to computerise the data records and to develop new data products An analysis was carried out of the options for the way forward in implementing the computerisation of the information system. Approaches to exploring uses for the newly accessible information to provide syntheses of the data that can be helpful at different levels within DAE. 3.5 Workshop at BRRI to implement an automated system for Forms 3 and 4 On the basis of the outcomes of Outputs 1, 2 and 3, a workshop was planned to finalise the design of the automated spreadsheets, discuss training needs and develop recommendations for the way forward to implement the computerization of data records. This workshop would include senior DAE officials who manage the pest surveillance scheme, senior SPPS personnel, BRRI statistics division and UK collaborators. The workshop was also planned to resolve issues identified under Outputs 1 and 2.
7
PROJECT OUTPUTS 1. National rice pest information needs for planning and policy determined 1.1 Purpose and demand for a PSF&EW scheme for rice pests As a matter of general principle, DAE and SPPS staff at all levels consider it their duty to “know the situation” and have a mandate to monitor and survey pest abundance. They consider this duty to include maintaining records of these over past time. They consider it important to be able to inform the public, politicians and media of the pest situation at any given moment, and to answer queries such as parliamentary questions. DAE and SPPS consider it part of their role to be able to maintain a historical record of pest incidence for research purposes such as the identification of trends. An explicit aim of the scheme is to be able to forecast the situation and provide early warning. All of these aims are outlined in the System Manual. 1.2 How information is currently used DAE personnel stated that the greatest use of the information as currently gathered is to allocate resources to priority areas - essentially mapping. Responses are stated to form a hierarchy or scale: a - At the lowest level of alert is the formation of local pest management squads. In theory these exist permanently in a standing state, but are activated and energised by pest outbreaks. The first action of squads is alerting farmers to dangers and disseminating training and information in pest management. b - At the intermediate level squads may distribute material resources in the form of sweep nets (e.g., for Rice Hispa outbreak situations) or, in some cases, the provision of bounty payments for pests collected. c - At the highest level is the provision of pesticides for use by the squads, and the provision of sprayers from stocks for use by squads and farmers. Aerial sprays are an extreme form of this development. Shortages of funds to maintain buffer stocks makes pesticide provision rare and expensive, and according to respondents it is unusual for an area to receive pesticides without the personal intervention of its Member of Parliament. These three levels of response intensity to some extent reflect the division of rice areas into light, medium and heavy pest infestation, with a response strength corresponding to each category. In this sense the categorisation, and its representation on maps, is a simple and clear decision tools for the allocation of actions to where they are needed. The association of three response levels with three intensity levels, however, is not formally specified.
8
The use of data sheets for decision-making in allocating resources is not solely at national level, but is also at District and Upazilla level, where officers said that the information is useful to them in allocating effort and resources. 1.3 Difficulties with the current system Overall, many DAE and BRRI staff are aware that the current operation falls very short of expectations (as outlined in 1.1). The major points that emerged were: a. Lack of forecasting and early warning capacity The current scheme does not allow DAE to develop a forecasting and early warning capacity. b. Use of the data on Form 1 At present, not all the data that is gathered actually play a role in the syntheses that are the final output. In particular, the final summary (Form 4), at National level, is almost entirely composed of information from the various “Pages 2" of the sequence of data sheets, on which crop areas are sorted into four categories of levels of infestation, rather than the “Pages 1" which contain detailed counts of pests.. c. Use of hard copies All data is collected on field sheets (Form 1) and then processed by hand onto other summary sheets (Forms 2 to 4). The whole process is slow and laborious and prevents a proper and rapid synthesis and analysis of the data from all the Districts. d. Slow and incomplete supply to upper levels Delivery of data to upper levels is particularly problematic. Many sheets at all levels (particularly at the topmost level at Dhaka) are simply missing data from many of their constituents. A problem is that at each level the person responsible must wait until all the component sheets are assembled before they can be consolidated and sent up - to be able to send up the data set as present when the deadline arrives, even if this is incomplete, and to send on later other components which turn up late, would be an advantage, as to have to make, say, four finished data columns wait for a fifth so long that in the end none are sent at all is “to make the best the enemy of the good” and no help to anyone. Thus in summary, the present operation only allows DAE to react to a current pest situation and even for this data flow is slow and frequently incomplete. The hand processing of data is a major constraint but another issue is the incomplete utilization of all the data collected from the rice Blocks 1.4 Development of an improved system: needs and advantages of computerization
9
DAE and BRRI officers were very clear on the needs for computerization of the current pest surveillance scheme. This would allow them to address the major technical bottlenecks identified and also allow them to broaden into forecasting and early warning. A summary of the main points raised and ideas tabled (with the UK collaborators) is given below. a. Improvements for real-time data use Most of the current use of pest surveillance information is for “real-time” decisions rather than forecasting or the analysis of historical information. Computerisation would provide many benefits Ease of synthesis at decision-making levels - An initial suggestion is that data may be presented on a map showing the 64 Districts of Bangladesh, with small icon-like histograms to express the situation so that the developments in the whole country may be “eyeballed”. While the use and presentation of these pictures may be refined and developed later on, an initial suggestion following discussion with SPPS is for three sorts of histogram summary: - Size of areas in the four categories of “None”, “Light”, “Medium” and “Heavy” infestation as currently used. - Relative incidence of different pests, to allow the scale of pests to be seen in comparison. - Time-series, as a plot of pest abundance over the previous five weeks, to allow an impression of where pest numbers are rising most quickly and threatening to approach seriously-damaging levels. To communicate information to the public and to fulfill the mandate to warn farmers and NGOs, it is proposed these summaries be posted on the DAE website and updated with fresh information as it arrives. It is hoped this may generate interest and pride among those whose job it is to log the data, and encourage record transmission. Speed - Computerisation should greatly increase speed. The transmission of information by e-mail offers obvious potential. Also data entry onto spreadsheets will allow doing away with the current instructions on data sheets to “continue onto additional sheets if needed” - a necessarily cumbersome and risky process. Accuracy - Computer data entry offers possible improvements in data quality control, via automated internal quality checks. Standardisation - This offers a great advantage in computerisation, in that entry operators may be given a limited and specific set of options, which will make data much more coherent and useful. Grouping into categories. - Often the number of options for the data entry operator - particularly in the “Background boxes” – lose sense when amalgamated. One approach may be for a programme to recognise answers as within sets, and group them into 3 or 4 categories. For example, the plethora of rice varieties may be individually recognised by the programme and assigned to broad categories such as
10
“Traditional”, “Bangladesh modern”, “International modern” so that they may be allocated to relative abundance by District. Flexibility of presentation - Computerisation will allow the summary of data, presented for decision-making, to be adjusted to show particular aspects, such as progress-over-time in one mode, and spread-of-damage-among-different pest-species in another. b. Development of forecasting and early-warning and uses of a historical database For future prediction and early-warning a coherent, comprehensive and accurate computerised database will be indispensable. In a process analogous to the previous RH project (Murphy, 2005) it may be possible to establish the determinants of pest abundance by comparing abundance with ecological and environmental parameters in a historical database. It may also be possible to relate pest abundance - both decreases and increases - to the controls used, particularly insecticides. In particular, some pests may rebound from pesticide applications, implying natural enemy destruction or similar. 1.5 The wider context of computerisation On the negative side, it is widely reported that DAE has a slightly computer-hostile culture, and that field workers in particular treat them with suspicion. Data entry is often given to junior people to do, and DAE has no Computer Centre or pool of expertise to which staff can turn. Computers in District offices are currently used in the main for word processing (“like a typewriter”). On the positive side, DAE is committed to computerisation in general and there is a widespread view it is needed and will happen. Pest survey computerisation may well serve as a pilot for the introduction of a computer culture throughout different aspects of the work of the DAE (most of whose personnel are not pest management specialists). In any launch of computerisation, emphasis may be placed on the other uses of the basic technology (spreadsheets for doing accounts and preparing invoices, e-mail for general correspondence). 1.6 Other considerations DAE is aware that the computerisation of data entry offers several obvious paths for subsequent expansion at a later date. Points raised were as below. a. Other SPPS data. The System Manual makes specific recommendations for the collection of light-trap data to calibrate and confirm field data. These may be integrated with field records, particularly if they provide earlier information.
11
The pest surveillance system does not itself record pest control actions taken by the DAE itself, such as the formation of squads and provision of training and supplies. These are recorded in a separate system of DAE activity records, and a clear advantage would be the integration of these so that actions may be matched to their thresholds used and consequences. b. Other DAE data DAE gathers a wide variety of local agricultural data, such as crops plantings, irrigation systems and pumps etc. It is intended to computerise these data collection systems also in the future, and so any design for pest information computerisation may usefully keep an eye on the needs of such systems and how helpful features may be built in. c. Expansion from District to Upazilla level It is intended to extend computerisation to Upazilla level. In the light of the large numbers of Upazillas, any system installed should not be dependent on Upazilla-level computerisation to function, though consideration may be made of how this extension may be carried out. d. Expansion to other crops One idea which generated interest is the possible extension of the surveillance system to crops other than rice, in particular, and initially, vegetables, and any system might profitably be designed with extensibility to a vegetable system in mind. It should be borne in mind, however, that the needs of a vegetable system may be very different. The rice pest system is to quantify damage by a very small guild of pests; a vegetable system would need to embrace a larger diversity of pests and place more emphasis on qualitative “presence/absence” records to allow the mapping of what pests are where thereby increasing importance for quarantine and marketing issues such as import and export. The rice pest guild is largely stable and established - Bangladesh currently has all the rice pests it is likely to have, and there are few if any rice pest quarantine risks. Vegetable pests on the other hand are constantly in flux, as different vegetables rice and fall in popularity, different pest species flux and wane, and several species pose quarantine risks. The greater “information density” of the vegetable pest guild may seriously increase fieldworker workloads, in both data collection and entry. The needs and practicalities of such a system would need consideration, and may differ from those of rice. 1.7 Future considerations - possibility of contraction Computerisation may also allow for the data-gathering process to be maintained as a “skeleton” of the few most important elements, should limitations of resources or unforeseen events require a reduction in effort. At the moment the provision of paper data sheets is adequate for the foreseeable future, but the situation could arise in which their supply is no longer assured. In such circumstances, the basic outline of data may be maintained by the collection and transmission of only a handful of numbers. This would also be able to be maintained in other situations (such as an
12

interruption of postal and e-mail communication, in which they may be transmitted by telephone - at least some Upazillas already make use of telephones to collect information from distant and isolated Blocks in situations of difficulty). A skeleton data set may consist of (at both Block-Upazilla and Upazilla-District levels), pest-by-pest: - Area cultivated - Area lightly infested - Area middlingly-infested - Area severely-infested - Area treated 1.9 Conclusions The purposes of the pest surveillance scheme are clear (as set out in the System Manual) and generally accepted as important by DAE and BRRI officers. However, to date, DAE only use the current year’s seasonal data on pest incidence to decide actions at the Block and Upazilla levels, i.e. DAE have not been able to complement this with forecasting models. Furthermore, only part of the data gathered from the rice Blocks is used at DAE HQ in the decision making process. Both sets of data collected on Form 1 would be useful for monitoring and forecasting but only if available in electronic form. This point is considered further under Output 3. The use of hard copies also hinders the synthesis and processing of data and the generation of summary information that would aid decision-making. 1.10 Recommendations a. Basic computerisation system outline - at District level The following was proposed and agreed by the stakeholders (DAE etc): • For the purposes of pest monitoring, summaries of the pest surveillance
information are entered into electronic datasheets at the District level and at DAE HQ (i.e. that the information on Forms 3 and 4 is put into electronic data sheets). Methods will be developed at the workshop to utilize both sets of data collected on Form 1.
• That the summaries contained in the electronic versions of Form 4 housed at DAE
HQ are used to build up a database of information about trends in pest incidence time wise. This database could then be used to explore trends in pest incidence with climate and other environmental factors that in itself would lead to simple models for pest forecasting.
For this project the focus was on the first of these objectives.
13
b. The operation An idea of how the system could operate is as follows. If data gathered from Upazilla levels to District levels may be entered into simple electronic spreadsheet templates (e.g. without macros) then it could be e-mailed to Dhaka via a Internet Café. Macro-less spreadsheet templates on 3.5" discs may be adequate at District level, allowing sophisticated data processing to take place in Dhaka. Programmes would be provided in say ‘Excel’ on floppy discs, along with a Manual for their use. The Manual would be explicitly designed as a companion volume to the System Manual, following the same format, and with the suggestion that the two be kept together. To be useful to those with no computer experience, this should include a brief introduction to computers themselves and the purpose and uses of spreadsheets and e-mail. The Manual and training would cover: - gathering data and ensuring it fits the system requirements - the use of the Programs and data entry protocols - worked examples showing bad as well as good practice - computer use - file management and good practice (e.g. keeping backups and records) - computer use - spreadsheets in general - computer use - e-mail in general Confusion will be reduced and data integration simplified if computerised data entry is by the selection of choices from drop-down menus, so that the data logger only has two tasks - selecting from menus and typing numbers. It may be considered whether all data may be entered as integers - removing the need for decimal points would remove potential misunderstandings. c. Recommendation for future activities in the current project It was proposed, following discussion with SPPS, DAE and BRRI, that a further mission by the UK staff takes place once the basic outline a computerisation system and accompanying instructions have been designed (see Output 3). The visit would include: • Initial discussions with main stakeholders about the design of the computerised
forms. • A two-day workshop (see Research Activity 3) to be held at BRRI with the main
protagonists, including SPPS and the entire personnel of the Surveillance Unit (four people) and entomologists, statisticians and computer scientists. Day 1 would include a discussion of proposals and data collection/synthesis issues. Day 2 would be to develop a training course for SPPS master trainers. An important aim of the workshop would be to familiarise stakeholders with plans and to allow experienced people to comment on the realism, practicality and usefulness of the proposals.
• Following the workshop, one (or two) days will be needed to revise and finalise
the proposed setup, including programmes, training procedures and a Manual (in Bangla).
14
It is further suggested that DAE would then follow this workshop with a two-day training course for SPPS master trainers. Provisionally this could be two from each of the nine main SPPS Regions (18 in all) plus some others, to include full training in data entry, along with examples, dummy data entry and test exercises, to allow the Master Trainers to spread the skills to all 64 Districts in Bangladesh. 2. Framework for national rice pest data collection and collation improved and
placed on a needs basis 2.1 Assessment of sampling methods used at the rice block level a. General comments on the filling in of Form 1 by SAAOs. The following points were made by at least two or more SAAOs interviewed: Pest identification – Most of the officers interviewed seemed to know rice pests and the symptoms of damage; the latter is particularly important in the case of rice pathogens. However, several new SAAOs had not received proper training in pest identification and this hindered their ability to undertake the field sampling. Sampling for data on Form 1, ‘page 1’ – All the SAAOs interviewed stated that they use a permanent sampling plot of 0.2 ha from which to collect the data. The 20 rice hills chosen equally spaced from a diagonal line across the plot. Some SAAOs stated that it would be useful if the System Manual included some examples of Form 1, ‘page 1’ data completed. Sampling for data on Form 1, part b – This was reported as a major problem. Time to cover the whole Block chosen for the surveillance on a weekly basis was a major limiting factor but compounded with this was a general lack of understanding of how to make an overall assessment of different pest situations in the Block. The System Manual does not really provide much guidance on this. Overall, SAAOs identified that much of the information reported on the Form 1, ‘Page 2’ is likely to be erroneous. Lack of calculators – Some operators complained about a shortage of calculators for computing averages. Other observations – There is some duplication of the information asked for Form 1. For example, on the ‘Page 1’ “stem borer moths” and the “Dead hearts /White Heads” which are the damage they cause, are recorded separately although basically representing the same phenomenon; computerisation may allow the use of numerical techniques to integrate the two.
15
b. Variance in data collection methods between DAE data collectors All the SAAOs interviewed follow the procedures laid out in the System Manual FOR Form 1, ‘Page 1’very accurately. As mentioned above, all ‘read’ the sampling procedure for the Form to mean the use of a permanent sampling plot. 2.2 Data synthesis at higher levels A number of problems were identified when the information from Form 1 (both Pages) is synthesised. These are as below. a. Loss of detailed information in the process of consolidation As data are amalgamated meaning is lost. For example, entering “Variety” from the Surveillance Block may be straightforward, but these must be consolidated at Upazilla level by the selection of the most common variety which then has to represent the entire Upazilla, and then consolidated again at the District. level, again as the most common variety, which then represents the entire District. b. Uncertainties over data entry Many operators at the Upazilla level are unsure of exactly what they should be entering. Data entry is often a rather unpopular job assigned to someone relatively junior. One data operator thought that, when synthesizing data from five Blocks, any entry was made at all for any individual pest only when that particular pest was reported as present in all five Blocks - if it was present only in the reports from one or four blocks, no entry was made at all. This may be assisted by more clear and unambiguous rules, and the provision of example data sheets filled in, which do not feature in the System Manual. 2.3 Training needs and support material at the SAAO level There is a clear need for the training of new SAAOs in pest identification and in pest damage symptoms. There is also a need to provide training in sampling protocols for the information required in Form 1, ‘Page 2’, but first a sampling protocol needs to be developed. 2.4. Conclusions From the interviews it is apparent that DAE SAAOs follow the sampling protocols and guidelines in the System Manual very closely. Consequently, there is uniformity within and between Upazillas in the way that the data on Form 1, ‘Page1’ is collected. Two issues need resolving: DAE SPPS need to ensure that all new SAAOs receive training in pest identification; DAE SPPS also need to clarify the sampling protocol for the information requested on Form 1, ‘Page 2’.
16
Some issues have also been identified in the process of the synthesis of the data collected on the Form 1s; these issues emerge when the data from the Blocks are first summarized at the Upazilla and then the District levels. 2.5 Recommendations The points identified above will be discussed and solutions agreed with senior DAE SPPS officers during the consultation/workshop visit planned under Activity 3. The System Manual can then be upgraded to include these points. The DAE SPPS will also need to provide training for SAAOs and DDAEs to cover these points. 3. Centralised database framework established and functional for pest
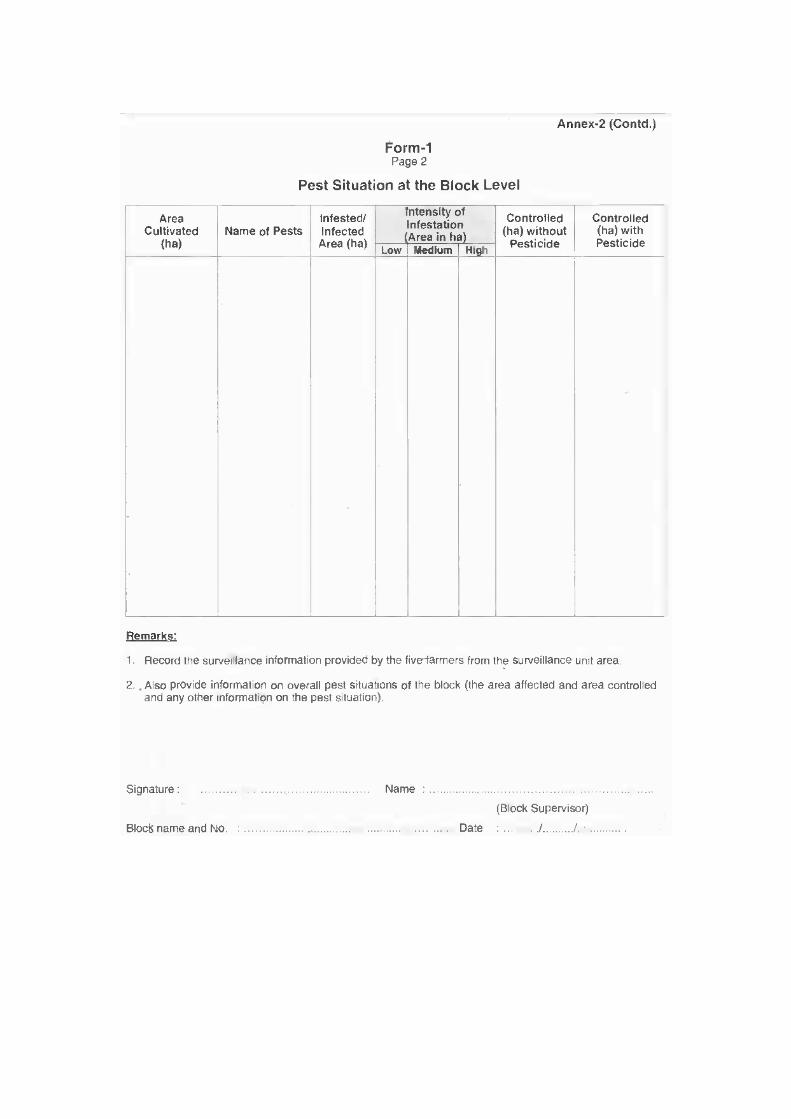
surveillance data 3.1 The rice pest information reporting forms: an overview of the information contained in the forms, identifying potential ambiguity, subjectivity and ways in which the use of the forms can be made as standardised as possible and making the most of the information contained therein. The following points arose from the analysis of the forms by NRI and the UK computer consultant. Form 1 As already described, Form 1, ‘Page 1’ is designed for use at the survey block, to be filled in by the block supervisor from information provided by sampling from the ‘Surveillance Unit area’. 20 rice hills are sampled and the numbers of a range of pests, diseases and defenders on each hill recorded. Three columns summarise counts from the individual hill data: Total, Average and Percent (Percentage is used to record for % damage due to white head, dead heart, leaf folder etc and % incidence of diseases). Some crop and management data are included for the block under the following headings: variety, growth stage, water management, weeds, weather and pesticide use. There is a need for agreed guidance on the specifics of what to record under these headings. The number of leaves and the number of tillers are also recorded on a sub-sample of 5 hills. In addition to the detailed sampling of 20 hills, there is a summary of the ‘pest situation at the block level’ – to be recorded on ‘Page 2’ of the form. As indentified under Output 2, clarification is needed on how this summary should be arrived at – presumably not by sampling but rather a general impression or ad hoc reports. This gives a list of pests and areas infected by each. The area infected is divided into high, medium and low categories according to ‘Intensity of infestation’ and it would be useful to establish a standard basis for this categorisation. Data sheets for each of five survey blocks are passed to the Upazilla level. Assuming the basic structure of the existing forms is retained during the process of computerisation, there are nevertheless a number of small modifications which could be made to increase the potential utility of the information. In the case of Form 1, it
17
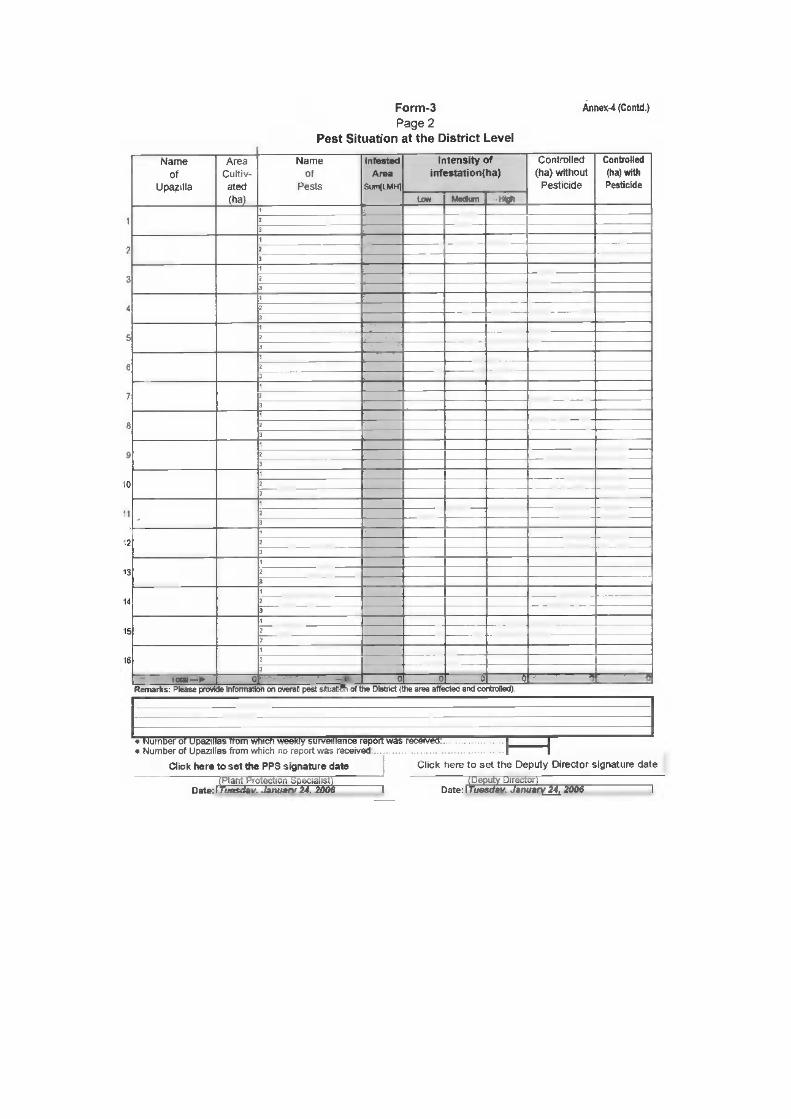
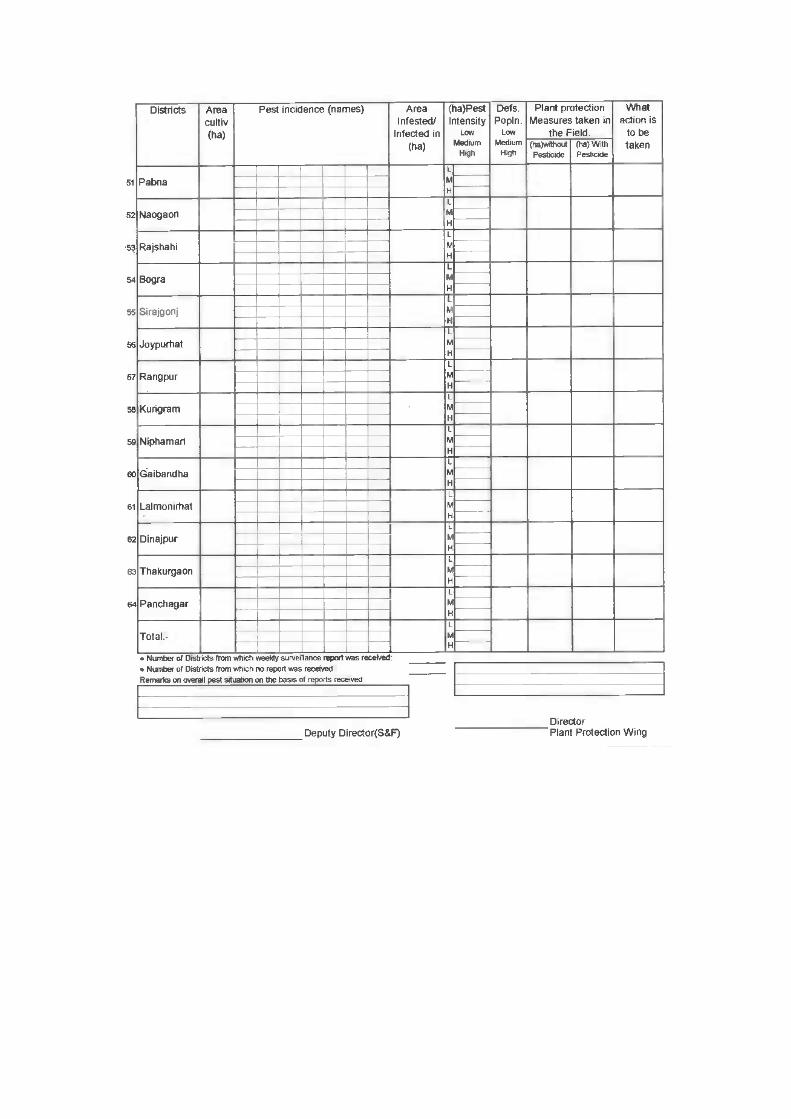
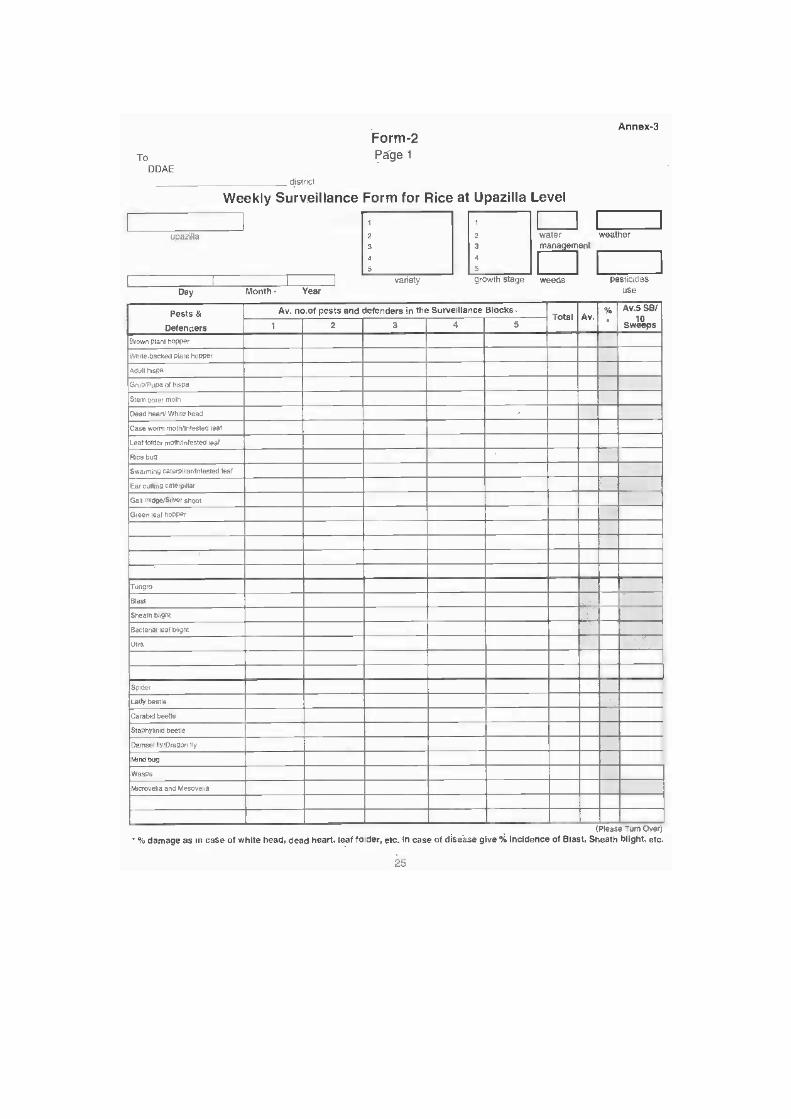
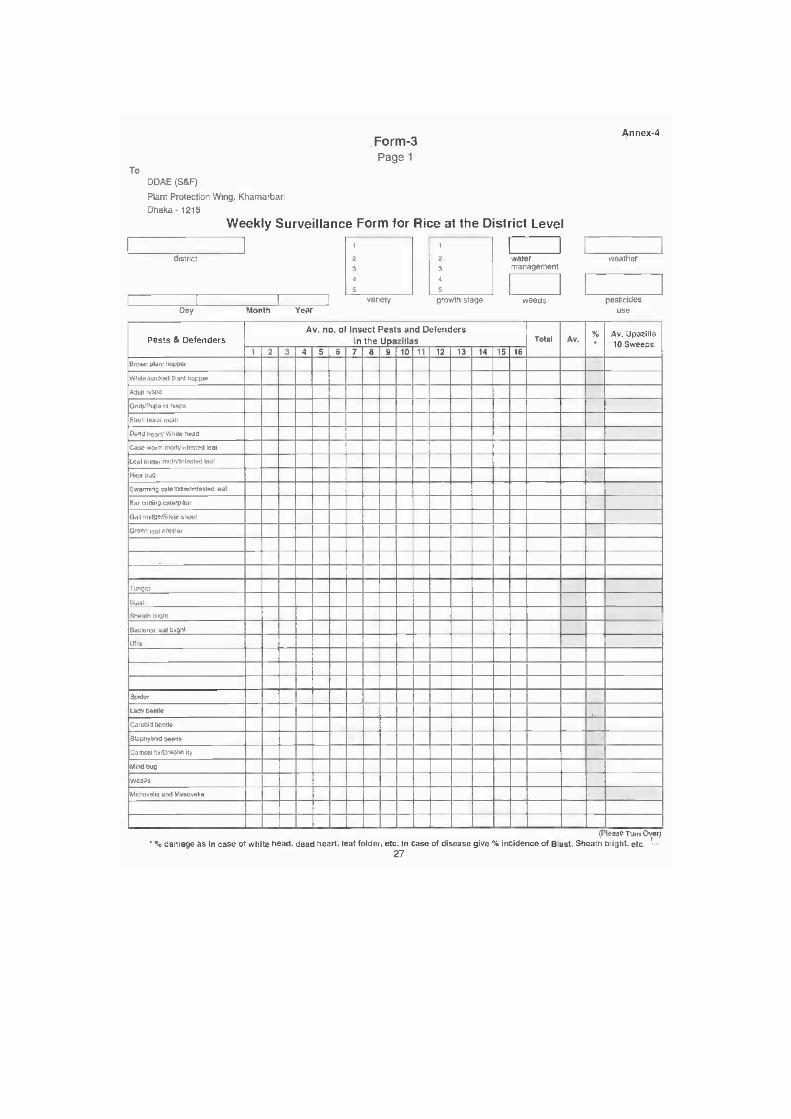
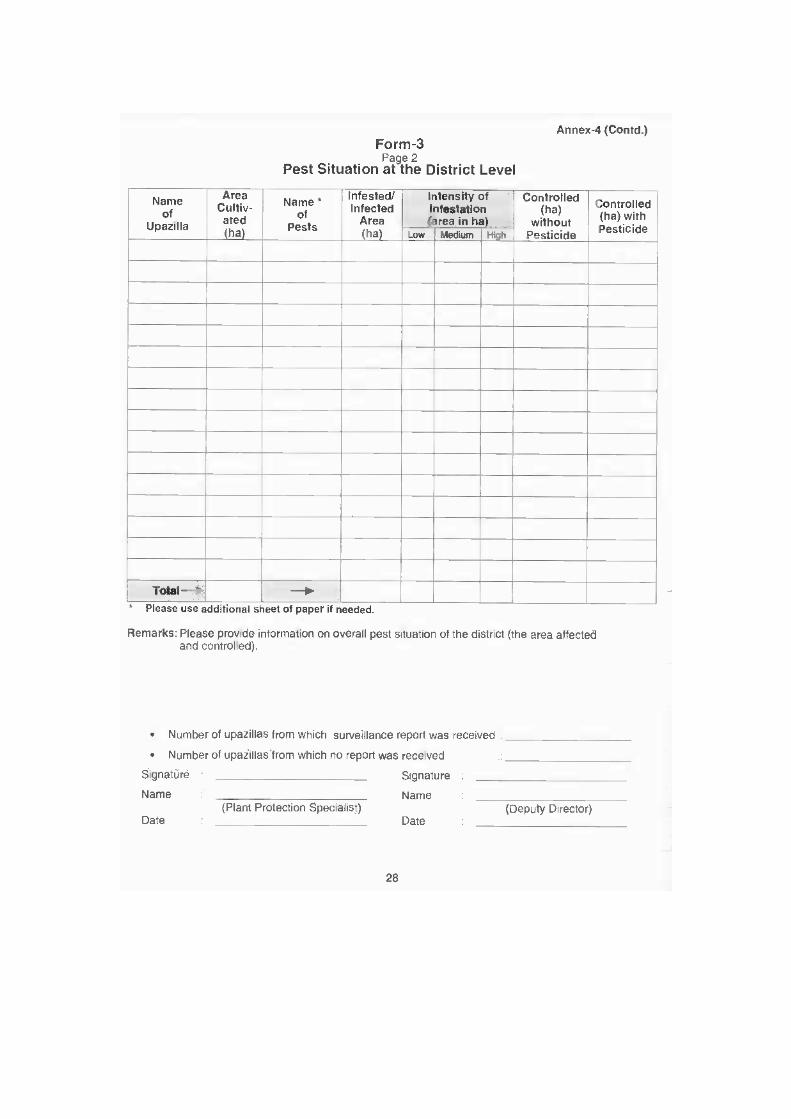
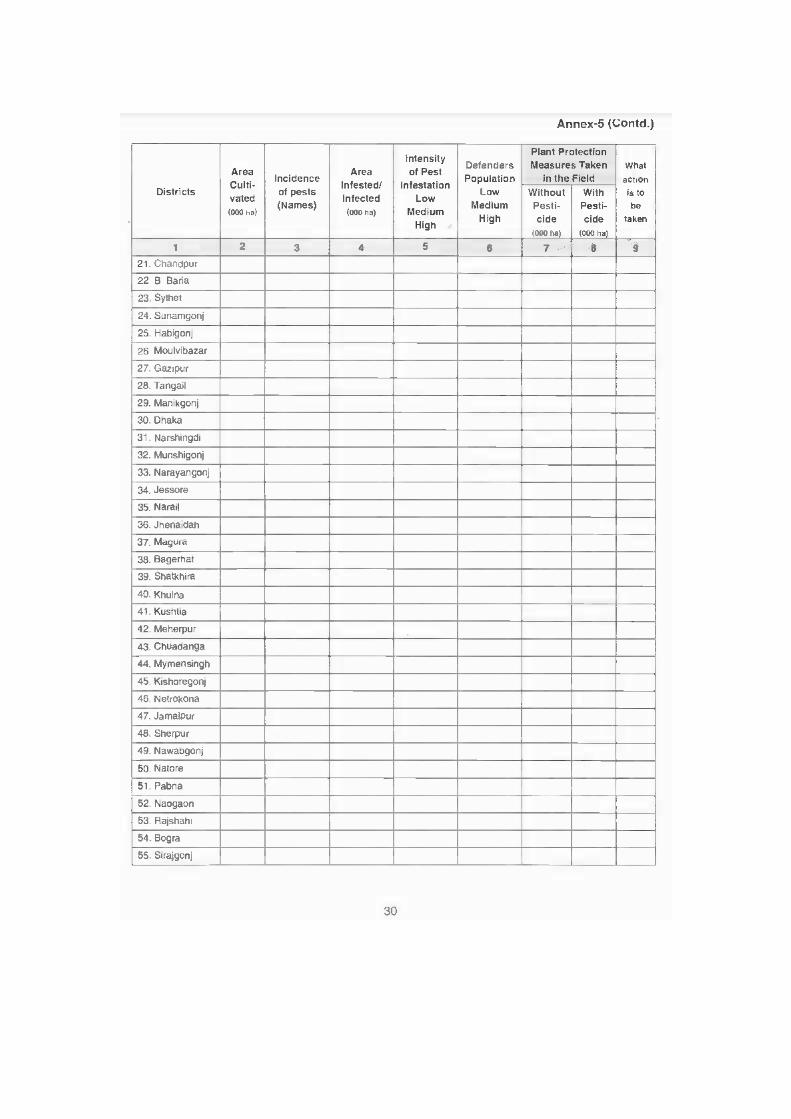
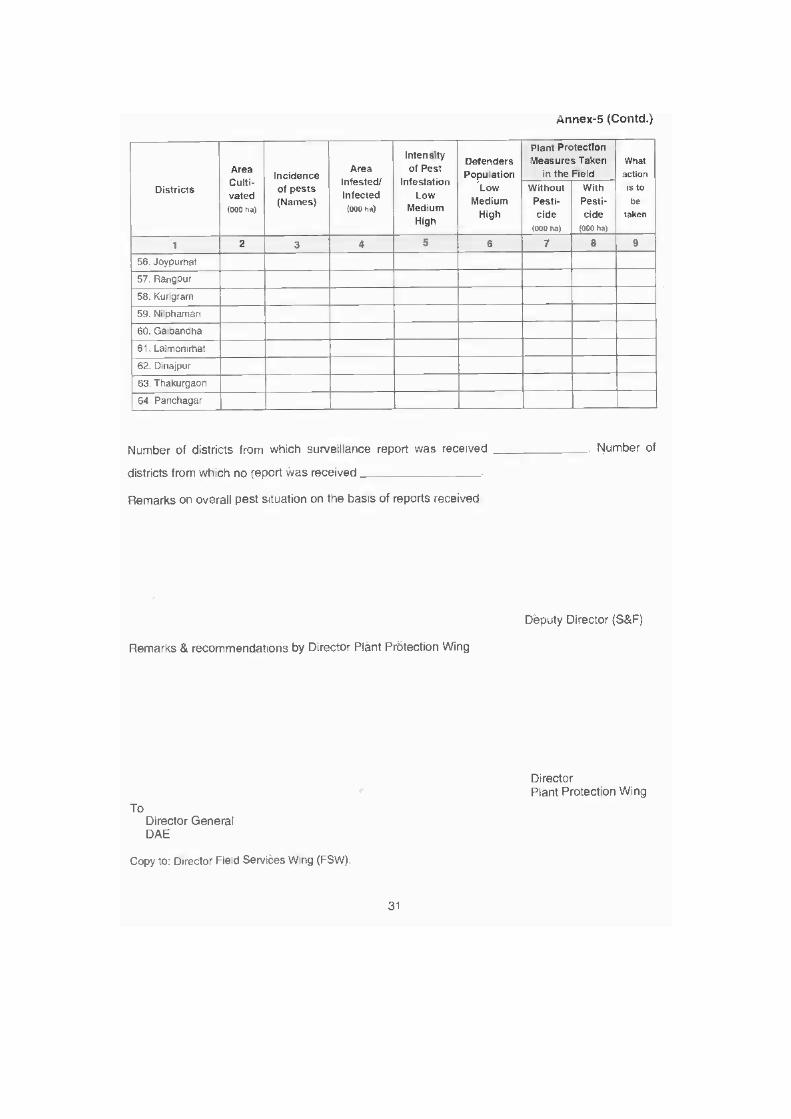
would be useful to include not just the averages for the pests but the number of hills (or the proportion of hills) affected because simple presence-absence data are often more reliable than counts – effectively, a value in the percentage column (% hills on which seen) for all pests, diseases and defenders. This can be easily calculated from the raw data as they are currently being collected. Form 2 Form 2 comprises a synthesis of information from 5 blocks and is filled in at the Upazilla level and then passed to the district level. Averages appear for each block separately. These averages are themselves totalled and averaged. There is also a percentage column that is presumably intended to be the average of the percentages from the five blocks. If this is so, this column is redundant as it should contain the same information as that containing the other averages. Variety and growth stage are entered again for each block. There is, however, only one box to enter water management, weather, weeds and pesticide use. This raises the question of what should be entered when any of these four variables differ between blocks. Again, specific guidance is required on filling in these sections of the form, otherwise lack of standardisation makes the information impossible to interpret. On some forms a modification has been introduced since inception in 2001 in which further averaging of the data take place. In addition to the averages from the ‘surveillance plots’, the section of the form headed ‘A. pest situation at the Upazilla level’ lists the ‘pest situation at the block level’ for each of the 5 surveillance blocks (the ‘Page 2’ data). Again there is a subdivision of the area infested into low, medium and high intensity. In addition, ‘B. pest-wise consolidated information from other blocks in the Upazilla’ gives infested areas by pest species, also subdivided into high, medium and low intensity. Again, it would be useful to consider how information about areas which, by definition, are not surveyed is obtained. Consideration needs to be given to the nature of this more subjective information and how it should be handled. This more subjective information does provide an indication of the ‘bigger picture’ and is certainly valuable. It is probably inappropriate though to treat what is essentially fuzzy data as if they were real numbers. These considerations not withstanding, space is provided on the modified forms to calculate a grand total (A + B). As discussed above, we might expect the accuracy of the information in A to be better than that in B. (A+B) is thus likely to be the sum of smaller more accurate but location-specific estimate dominated by a larger less accurate but more general estimate. Form 3 Form 3 comprises a synthesis of information from all Upazillas (up to 16) in the district and is filled in at the district level and then passed to national level. The Upazilla averages for each pest, disease & defender are carried forward from the set of (up to 16) Form 2’s, to Form 3. The values are totalled and averaged for the district. Each district, depending on the number of Upazillas reporting, has an average based on a different sample size and the accuracy of the estimate therefore differs between districts. Form 3 provides space for a list of up to 5 entries for both Variety and Growth stage with single boxes for water management, weeds, weather and pesticide use. At this stage there could be pest counts from as many as 16 x 5 = 80
18
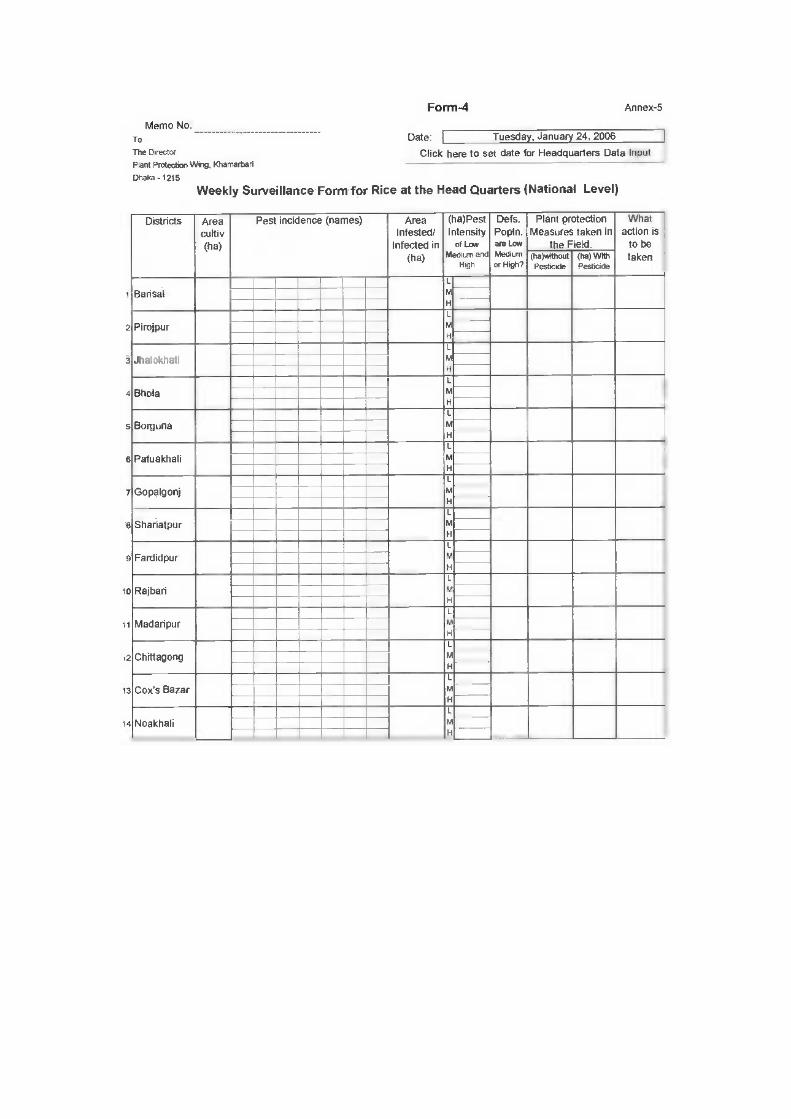
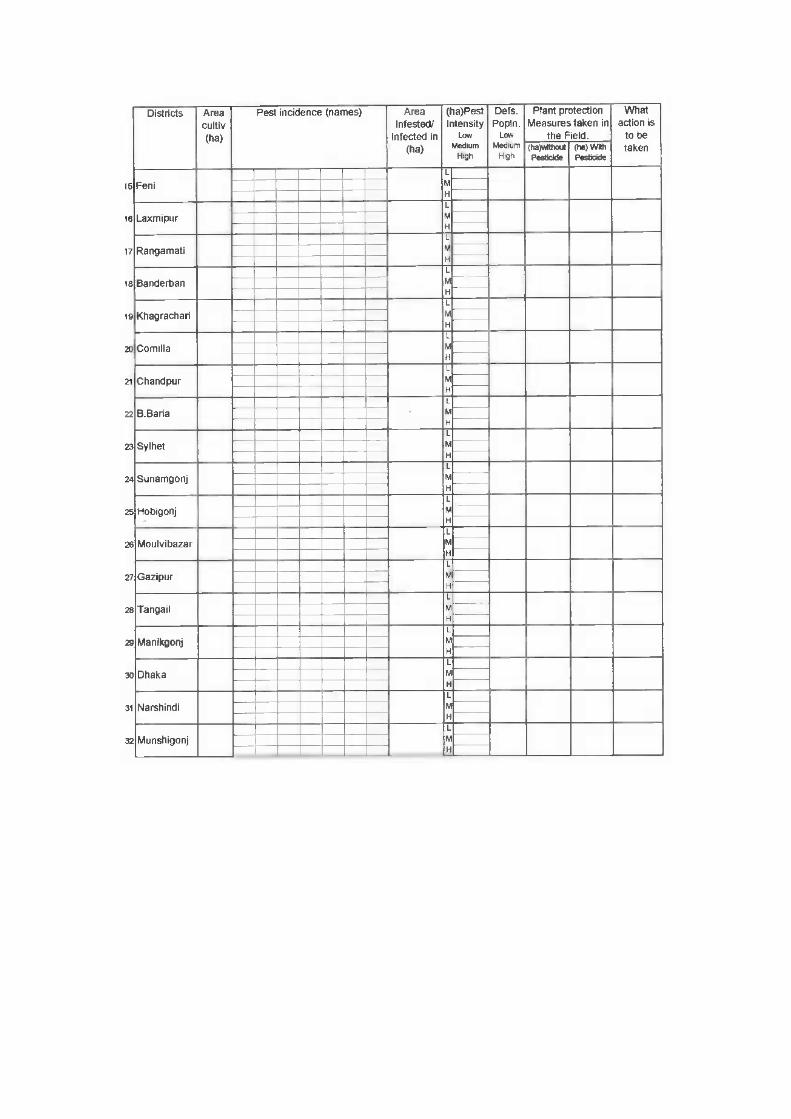
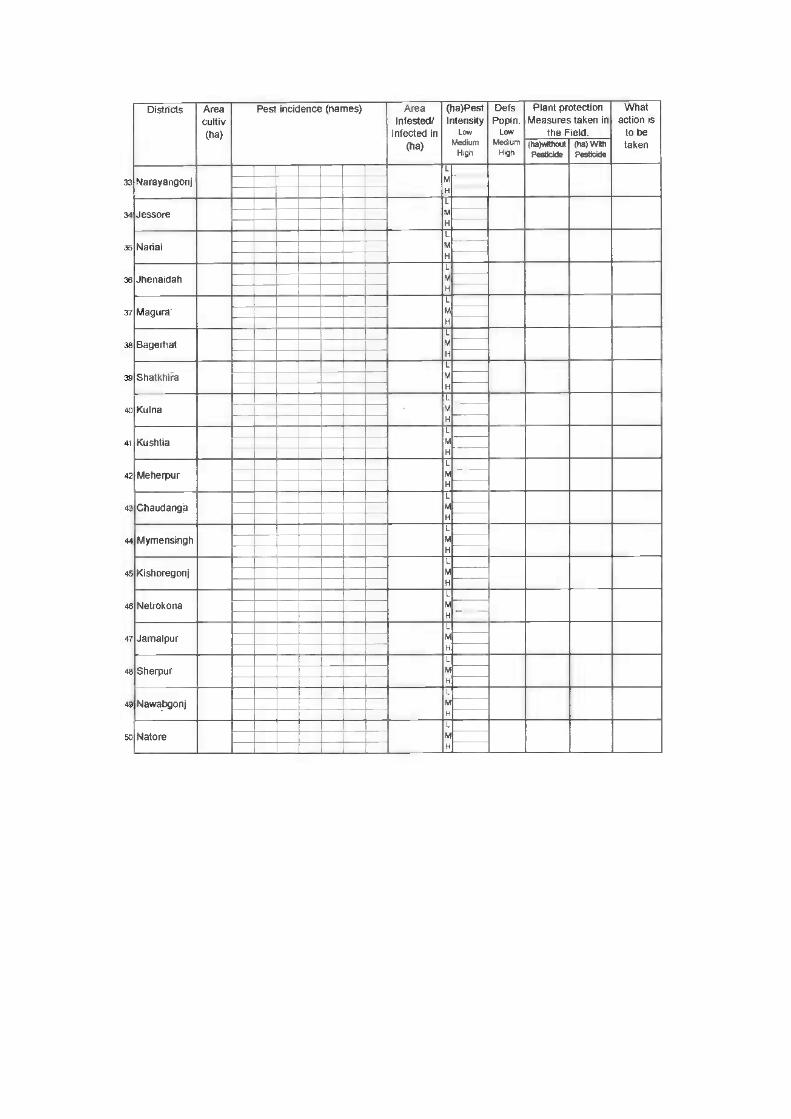
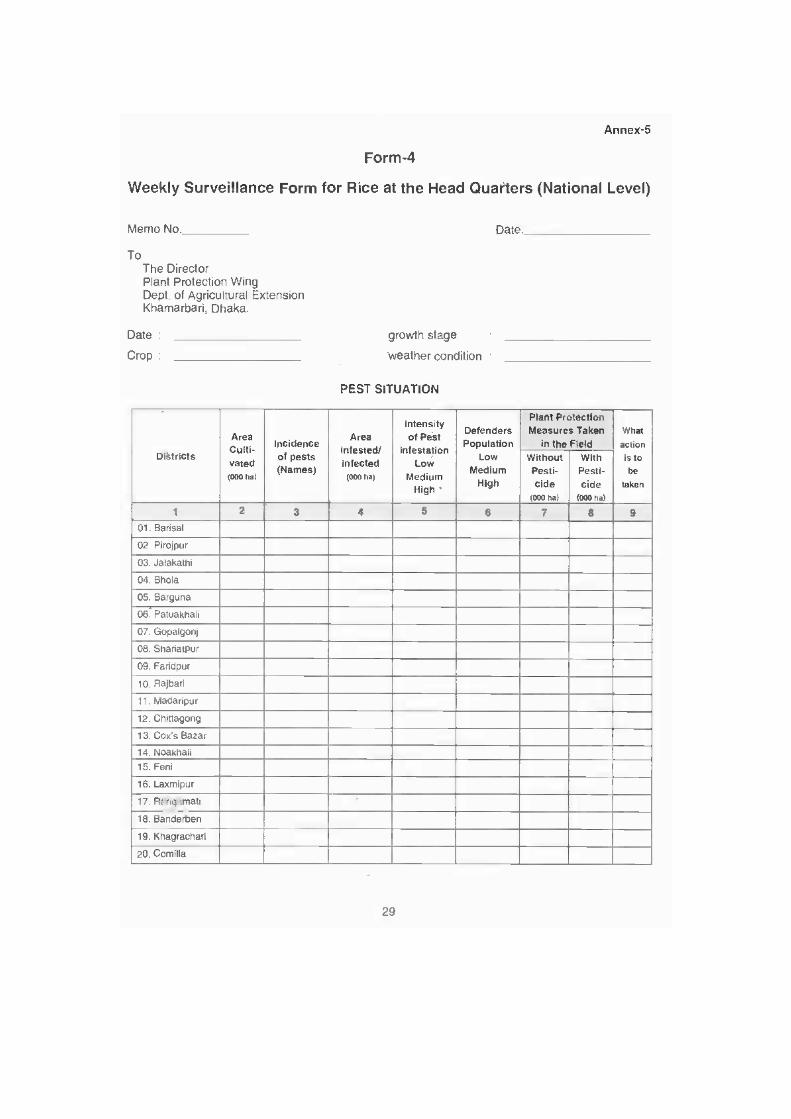
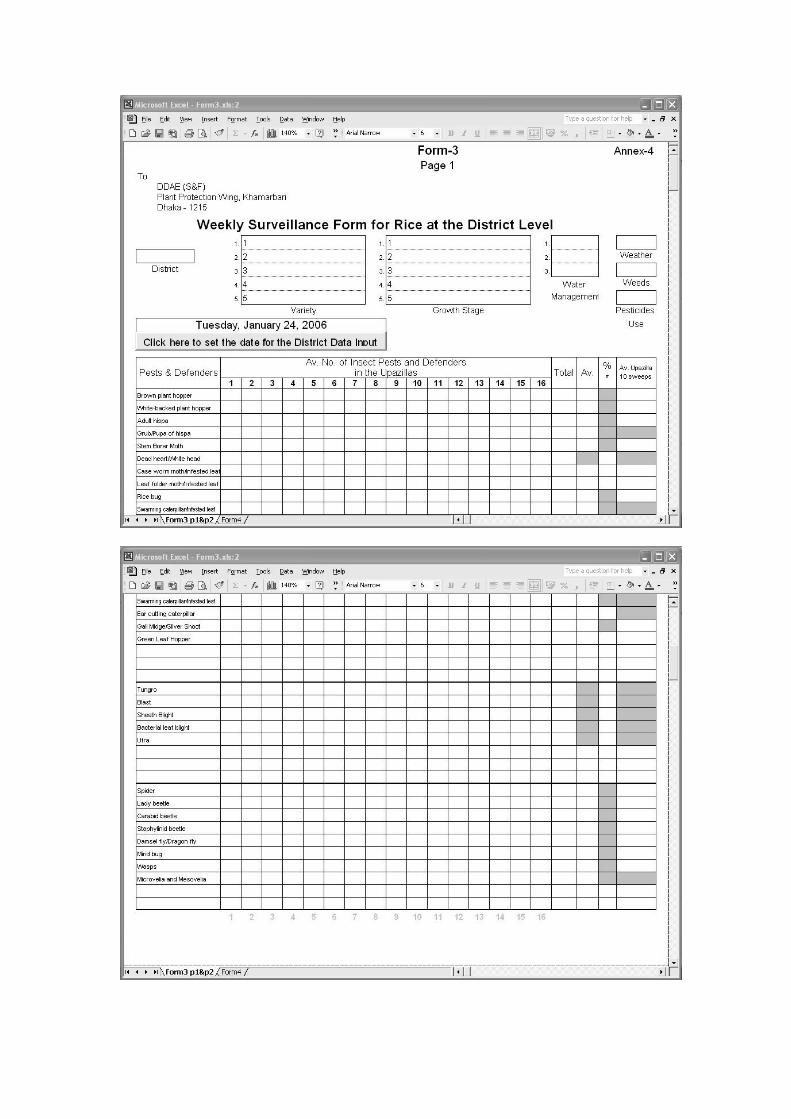
separate ‘surveillance units’. The link between pest counts and other variables is therefore largely lost by the time we reach Form 3. In other words it is impossible to associate pest abundance with management practices – one of ideas for the use of the database by DAE. It is clearly an important issue, that in summarising the data in this way, one of the most useful ways it could have been used is lost. If the current form structure is retained it is important to standardise the basis on which the management variables are completed from Form 2 upwards. It appears that some operators enter the most common situation which seems a reasonable response but this might not be general practice (see Section 2.2). It is the process of data consolidation where clear guidelines are most needed. Unless the meaning of the consolidated data are clarified and standardised, then little can be made of the relationship between the pest abundance and the management variables. The section of the form headed ‘Pest situation at the district level’ provides space to list names of pests and areas infested (sub-divided by high, medium and low intensity) for each Upazilla. These data clearly refer to the overall situation but there ambiguity was to whether it is A or B or (A+B) which should be brought forward from Form 2. Form 4 Form 4, completed centrally, summarises pest infestation information, district by district for 64 districts. There is some variation in the crop and management information recorded at the top of Form4 but no district-specific information about variety, growth stage, water management, weeds or pesticide use is retained. Instead, crop stage is sometimes recorded as Boro, Aus or T Aman. Similarly ‘weather condition’ has a single entry for the whole form. For the time being at least these entries have been omitted from the electronic version of Form4. Area infested by a pest is again subdivided as high, medium or low intensity. It appears that the information contained in Form 4 comes from the data for the overall situation rather than the surveillance unit counts, no summary of which seems to be taken forward (at least explicitly) from Form 3. Form 4 does however, have an entry headed ‘defenders population, low, medium or high’. As no such information is included in the ‘overall situation’ section of earlier forms, it suggests that some new interpretation of the Form 3 surveillance data is required. Again standard guidance is needed on process of data synthesis from Form 3 to Form 4. 3.2 Automated spreadsheet versions of Forms 3 and 4. These are designed to make data entry easy, reduce transcription errors and encourage standardisation of information. Accompanying the spreadsheets is a full written specification of the software Scanned copies of the original paper forms can be found in Annex 1. The first step, in the computerisation of the rice pest information system, was to duplicate Form3 and Form4, in Microsoft ‘Excel’, as ‘on-screen’ versions of the original paper forms. A screen-capture of the forms can be found in Annex 2 and a copy of the printout from the forms can be found in Annex 3.
19
Early versions of these forms were presented to DAE as training tools that might enable staff to experience and to criticise the method of electronic data capture of the rice crop and pest information at both District and Headquarters levels. Work has been done to further refine these electronic forms. Completed paper forms were analysed, the different methods of form completion evaluated and preferred methods chosen. Many of the forms were filled-in in ways that were constrained by the structure of the form. Modifications were undertaken, such as increasing the size of certain fields, which would facilitate form completion and accommodate the preferred methods of data entry. Most data entry choices were explicitly limited using the ‘Excel’ data validation rules and lists of acceptable field contents. The users may well dislike the restrictions and prefer the freedom of expression allowed with the old hard copy system. However, constraints are essential if any useful scientific analysis or management evaluation is to be achieved. Detail of field entries and their meanings is given elsewhere in the report. Electronic Form 3 data input. Much of the process of data input will be exactly the same as for the Form 3 paper version that staff are used to filling in. There are two ways that this software can be used. Method 1. - It can be used, at headquarters level, as a training aid, or as a substitute standard method for producing Form4, with the values being typed in from completed paper versions of Form3 for each district. Method 2. - It can be used, at District level, as a complete substitute for the paper version of Form3. The values should be typed in from the paper Form2 for each Upazilla and the datafile should then be forwarded to headquarters as an email attachment. The filename should include the District name and date information. Form 3-‘Page1’. The look and feel of the screen version and printout is very little different from the paper version, except that the water management field has been expanded to include three sub-fields. The first thing to note is that the date field is automatically set to the current day’s date and needs to be fixed to this date by clicking the button below the date field. Otherwise the field will always show the date that it is being viewed. If being used to process completed paper Form 3 forms then the date can be changed appropriately before clicking the button. The ‘District’, ‘Variety’, ‘Growth Stage’, ‘Water Management’, ‘Weather’, ‘Weeds’ and ‘Pesticides Use’ fields are all constrained to be chosen from a drop-down list by clicking on the field in question. The lists exist within the worksheet and can be modified by DAE or BRRI staff members that have the necessary computing expertise. The matrix of ‘Average number of Insect Pests and Defenders in the Upazilla’ should be filled in for each Upazilla for which there are data available. The ‘Total’ and ‘Average’ fields are computed by the spreadsheet and should not be filled in. It should
20
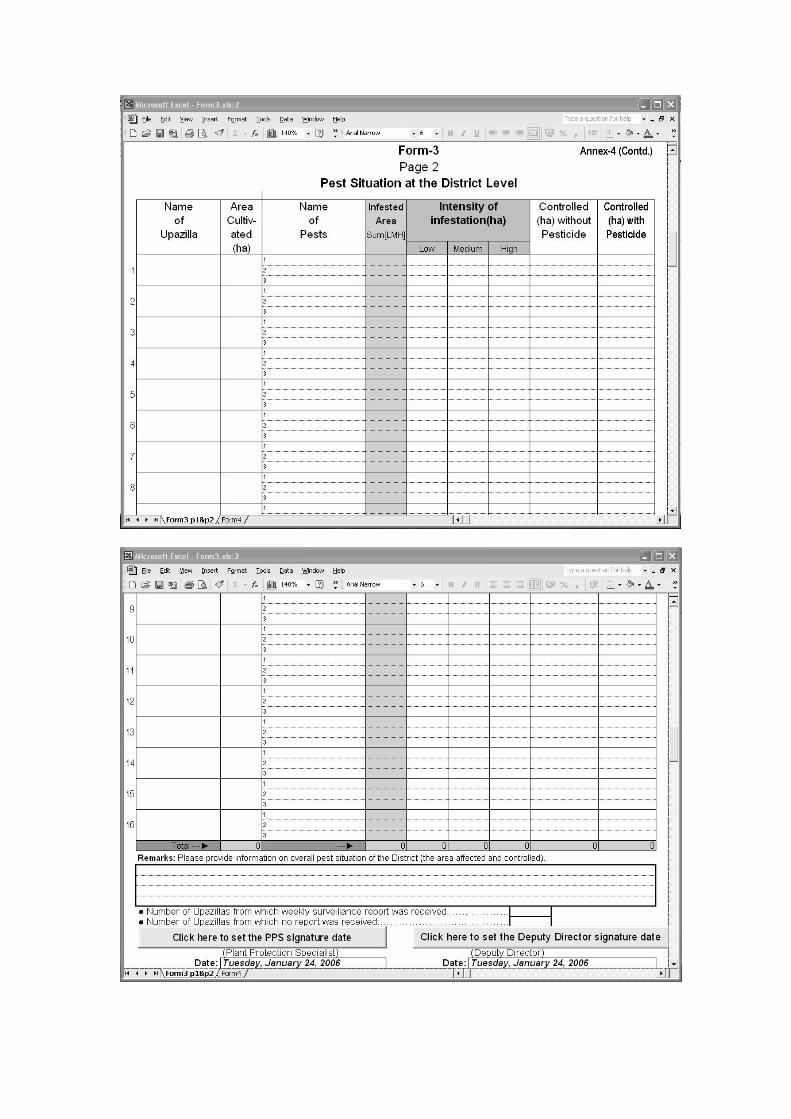
be noted that the ‘Average’ field will contain ‘###’ until the ‘Page2’ field containing the number of Upazilla reports, has been filled in. Form 3-‘Page2’. The column headings of the screen version, and printout, are the same as the paper version, but the rows have been explicitly labelled with the Upazilla numbers and each Upazilla has three rows, which will be used to input the data on the three most important pests. For this generic version of Form 3 the Upazilla name can be written in, or just inferred from the number. A series of district-specific versions are envisaged that would have the Upazilla names pre-written. For each of the Upazillas, the ‘Area Cultivated’ should be copied from the paper Form 2 as the total of all five surveillance blocks. Then, row number 1 should be used for the most important pest. The name is chosen from the drop-down list and the Intensity L, M, H and controlled areas are copied from the paper Form 2. The ‘Infested Area Sum’ should not be filled in because it is calculated from the other fields. A similar process is used for the second and third most important pests. The ‘Remarks’ box should then be filled in by typing an overall ‘District’ view of the data from all of the Upazillas and the number of reports, and number of lacking reports, should be typed in the boxes provided. The date fields for both the Plant Protection Specialist and Deputy Director are automatically set to the day’s date and need to be fixed to this date by clicking the button below the date field. Otherwise the field will always show the date that it is being viewed. If being used to process completed paper Form3 forms then the dates should be changed appropriately before clicking. Electronic Form 4 data input. There is none. The data input occurs at the Form 3 level and the Form4 fields are filled automatically by spreadsheet formulae linking their values to the appropriate fields in Form 3. Currently, the Form 3 data are linked only to the row of Form4 that corresponds to the district name used in Form3. Being a direct link between the forms, if the Form3 fields are altered this automatically overwrites the information in Form 4. Therefore each time the empty form is filled in it must be saved, using a filename that reflects the name of the District being processed. It may also be useful to include date information as a part of the name unless care is taken and data files are kept only within a specific directory for that date. The method to be used centrally to collate data from all districts is first to collect together all the files from the districts in a single computer folder or directory. This applies equally to files sent in from Districts and data from those Districts that have sent in paper data. An accumulating version of the software should be used which has no automatic link between Forms 3 and 4. The Form 3 is left untouched or, even better, removed. The Form4 spreadsheet protection has been removed from this special version of the software and there are no formula links in the Form4 fields.
21
This accumulating file is opened in ‘Excel’ and each of the Form 4s from each of the districts is opened in turn. The Form4 data from each district is then copied and pasted into the appropriate row of the data accumulation file until the data for all districts is assembled in the accumulating file. The accumulated Form 4 can then be printed out and posted, as normal, or it can be emailed in electronic form. As a future development, it is certainly possible that each of the District data files could be linked into an automatic version of the accumulating file. This would be a necessary part of a completely automated database system. However, at this early stage of the computerisation of the rice pest information system, we think that it is important that DAE staff do this accumulation themselves and understand and appreciate the fundamentals of any computer-based data handling system. Form 3 to Form 4 data transfer. The column headings of the screen version, and printout, are the same as the paper version, but the rows are subdivided to give space for the L, M and H values for Pest Intensity and individual positions for each of the named pest from Form 3. Only that row of Form 4 is filled in which correspond to the District concerned. This is done by checking that the district field of Form 3 has the same value as the district field of one of the rows of Form4, and placing the data in that row. Thus, the copy of Form4 at the district level contains only the information for that district. The accumulation of all the Form 4 data for all districts is done centrally. The ‘Area cultivated’, ‘Area Infested/Infected’ and ‘Plant Protection Measures’ fields are filled from the equivalent ’Total’ value, which is the sum of all Upazilla values, in Form 3. The individual L, M and H rows of the ‘Pest Intensity’ column are similarly filled by the sum of all Upazilla values. The ‘Pest Incidence’ column is subdivided to give space for the individual short form name for each pest. This name is only displayed if the long form of the pest name is displayed in at least one Upazilla in Form 3. The ‘Defs. Popln.’ Field will display an H if the sum of the ‘Average’ values of all defenders in Form 3 is greater than 1. If the ‘Average’ values sum to below 1 but above 0.5 an M is displayed and if below 0.5 an L is shown. The ‘What action to be taken’ field is new information generated at headquarters level which is specific to each District. 3.3 Recommendations for the way forward to computerise the data records and to develop new data products Two defining decisions were made for the computerisation process, largely for pragmatic reasons. Firstly to work within the basic information structures that currently exist, and secondly to focus initial computerisation at District level and above.
22
The present rice pest information system of data collection and integration through forms at different levels, is a large and integral part of DAE. Much past effort by DAE staff and development partners has been expended to develop and improve this system. Based on the original DAE system, a German-funded project collaborated to produce a set of reporting forms. This was further developed and refined during the DANIDA-DAE work. Given these earlier efforts and the consequent repeated changes through previous incarnations of the rice pest information system, it is important to be cautious about suggesting that it should be changed yet again. As we have discussed above, however, the form system has a number of flaws, some of which having serious implications for the value of the resulting data. Given that the form system is now well established and reasonably functional, to make fundamental changes would be a huge and disruptive endeavor. Instead we plan to support the existing structure and offer recommendations to reduce uncertainty and ambiguity and increase standardisation, so making the data more interpretable. However, the implementation of an electronic version of a system fundamentally changes what can be done with the information and it is recommended that some change to the system should be contemplated. For example, if spreadsheet coding takes places at the District level (Form 3), there need be none of the loss of information that currently takes place in the translation from Form 3 to Form 4. Electronic versions identical to the existing Form 4 could still be obtained if required and this is the approach that has been taken initially. The implementation of a computer system codifies the methods of data integration between each level and improved exploitation of information at the national Level (a modified Form 4) can be highlighted and discussed with DAE staff. Computerisation was targeted at the District level and above. This is a compromise between the value of the information and more practical issues of feasibility. To get the most out of the data, we should ideally build any database just using the set of Forms 1. All of what appears on Forms 2 to 4 is derived from Form 1 and even at the level of Form 2, any differences between blocks in some management practices has been lost, as have any secondary statistics (variance etc) at the block level. Thus, to retain the maximum value of the information collected, it is Form 1 which should be encoded in electronic form. A database of Form 1 information could summarised in whatever way desired to produce electronic equivalents of Forms 2 to 4 as well as a variety of other data summaries which are currently impossible to produce. Such an implementation of fundamental data recording in electronic form would necessarily require a high degree of computer literacy among junior Upazilla DAE staff plus of course, computer hardware in local DAE offices. The present requirement for computer literacy amongst such DAE staff is low, and training in computer literacy and provision of equipment might unbalance relationships within DAE. More feasibly we recommend that computer literacy within management staff of DAE should be addressed by implementing electronic versions at higher levels in the current rice pest information system. This 'top-down' approach will start the process of improving DAE computer literacy and should empower and enthuse management. When, eventually, an electronic method of low-level block data acquisition is implemented it is more likely to be welcomed and understood at all
23
management levels. At a practical level, such a scale up could use hand-held units in the field for lowest level of data entry. The current penetration of computer usage within DAE is not high. The rice pest information system computerisation would not be expected to precede that of payroll and general management information systems. It is recommended that computerisation of the rice pest information system should take account of any other computer systems being implemented within DAE. This will maximise the use of local expertise and better integrate the systems. The stated Government desire to bring computers to the district level will facilitate the process. This project has developed serviceable electronic versions of the basic forms. During the workshop (discussed in Section 1.7) these forms will be launched and training given in data entry etc. A trial database system will be prototyped in Microsoft Excel without prejudice to the eventual form of the system. It may be found the system can be better implemented in the Microsoft Access or other database software. It is recommended that problems with computer literacy will be addressed by not only allowing users to produce a print out from the new system that duplicates the present forms but also implementing the new system with the same 'look and feel' as the present system. Once a body of electronic data starts to accumulate, it will be possible to explore the development of new data products. The approach to developing new data products should be iterative. The potential users inevitably find it difficult to say what they want until they have some idea of what they can have. As a first step, a series of simple data products might be developed that the project team consider useful. These should take the form of time series on different scales (over previous weeks and over previous years) of pest infestation broken down by district and maps of averages (and secondary statistics such as measures of variability). Other examples are given in Section 1.7. Demonstrations of these would then form the basis for discussion with DAE/SPPS/BRRI staff and other stakeholders in order to modify the products and develop new ones. It is recommended that all levels of DAE staff should be polled to find their opinions on; whether the current system is 'fit for purpose', what improvements they can suggest and what problems they have with the current system. The process should involve a limited series of iterations to arrive at a specification that can be completed within the time frame of any future project. 3.4 Workshop The workshop (scheduled for January 2006) was postponed because of political problems in Bangladesh. It is now planned for March 2006. 3.5 Conclusions
• Software has been developed for testing and training at the forthcoming workshop. Future software development decisions rest largely on the feedback
24
to be obtained during the workshop but are very likely to involve some refinements to Forms 3 and 4.
• Implementation of Form 3 at district level is the first step in the software becoming operational. As electronic data start to accumulate it will be possible to begin to collate the information in the database. Trial data products can then be generated and used for a further cycle of consultation.
• The problems highlighted with the form system centre around ambiguities in the process of data consolidation. One role of the workshop will be to clarify the procedure where ambiguities exist and to write a supplement to the System Manual.
• Computerisation of the forms can be extended to Forms 1 and 2. Even though it is unlikely in general that computerisation could take place at this level, there may be a small number of blocks and Upazillas which could trial this.
• As is standard practice in the introduction of new software, the essential approach is to continue to run the old paper system along side the electronic system as it is introduced. Only when the problems are ironed out would a complete switch-over be recommended.
25
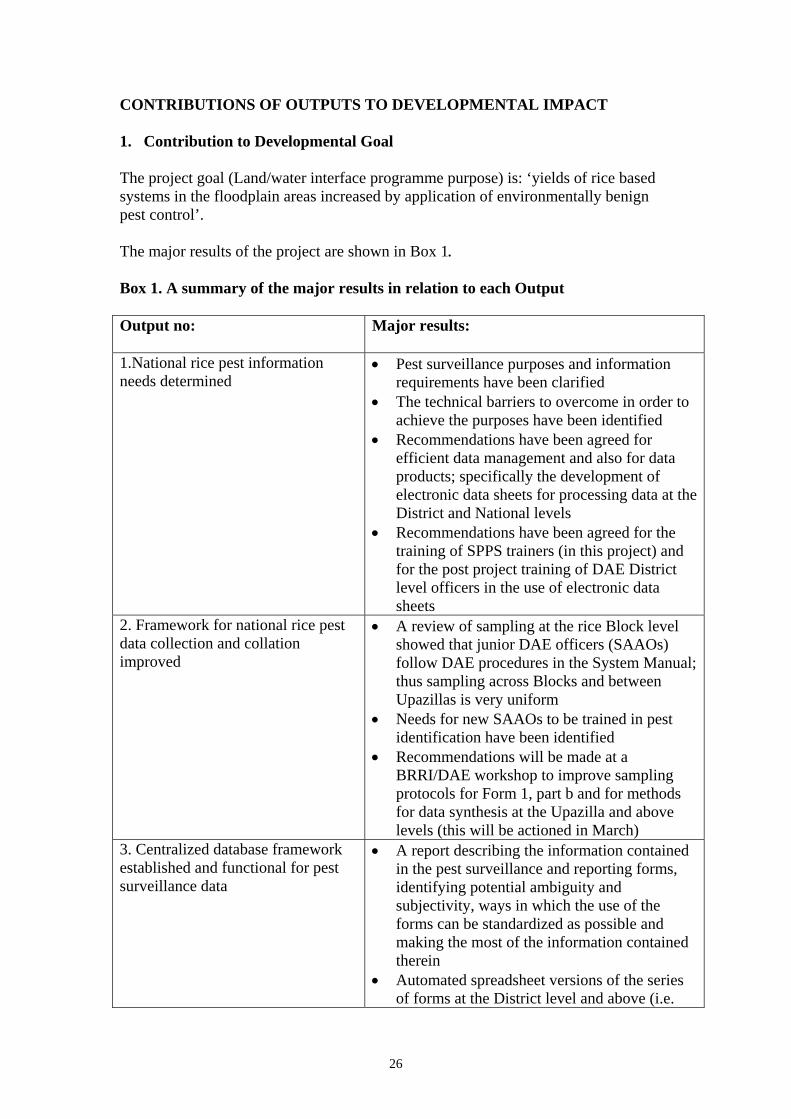
CONTRIBUTIONS OF OUTPUTS TO DEVELOPMENTAL IMPACT 1. Contribution to Developmental Goal The project goal (Land/water interface programme purpose) is: ‘yields of rice based systems in the floodplain areas increased by application of environmentally benign pest control’. The major results of the project are shown in Box 1. Box 1. A summary of the major results in relation to each Output Output no: Major results:
1.National rice pest information needs determined
• Pest surveillance purposes and information requirements have been clarified
• The technical barriers to overcome in order to achieve the purposes have been identified
• Recommendations have been agreed for efficient data management and also for data products; specifically the development of electronic data sheets for processing data at the District and National levels
• Recommendations have been agreed for the training of SPPS trainers (in this project) and for the post project training of DAE District level officers in the use of electronic data sheets
2. Framework for national rice pest data collection and collation improved
• A review of sampling at the rice Block level showed that junior DAE officers (SAAOs) follow DAE procedures in the System Manual; thus sampling across Blocks and between Upazillas is very uniform
• Needs for new SAAOs to be trained in pest identification have been identified
• Recommendations will be made at a BRRI/DAE workshop to improve sampling protocols for Form 1, part b and for methods for data synthesis at the Upazilla and above levels (this will be actioned in March)
3. Centralized database framework established and functional for pest surveillance data
• A report describing the information contained in the pest surveillance and reporting forms, identifying potential ambiguity and subjectivity, ways in which the use of the forms can be standardized as possible and making the most of the information contained therein
• Automated spreadsheet versions of the series of forms at the District level and above (i.e.
26
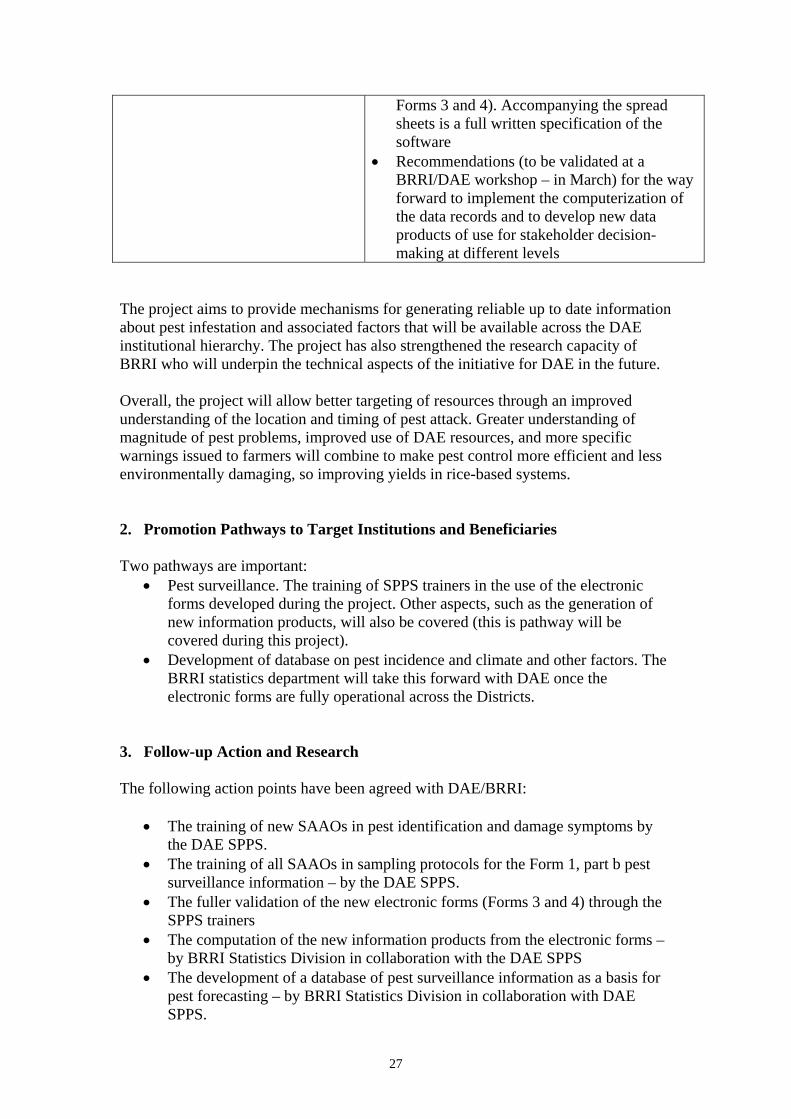
Forms 3 and 4). Accompanying the spread sheets is a full written specification of the software
• Recommendations (to be validated at a BRRI/DAE workshop – in March) for the way forward to implement the computerization of the data records and to develop new data products of use for stakeholder decision-making at different levels
The project aims to provide mechanisms for generating reliable up to date information about pest infestation and associated factors that will be available across the DAE institutional hierarchy. The project has also strengthened the research capacity of BRRI who will underpin the technical aspects of the initiative for DAE in the future. Overall, the project will allow better targeting of resources through an improved understanding of the location and timing of pest attack. Greater understanding of magnitude of pest problems, improved use of DAE resources, and more specific warnings issued to farmers will combine to make pest control more efficient and less environmentally damaging, so improving yields in rice-based systems. 2. Promotion Pathways to Target Institutions and Beneficiaries Two pathways are important:
• Pest surveillance. The training of SPPS trainers in the use of the electronic forms developed during the project. Other aspects, such as the generation of new information products, will also be covered (this is pathway will be covered during this project).
• Development of database on pest incidence and climate and other factors. The BRRI statistics department will take this forward with DAE once the electronic forms are fully operational across the Districts.
3. Follow-up Action and Research The following action points have been agreed with DAE/BRRI:
• The training of new SAAOs in pest identification and damage symptoms by the DAE SPPS.
• The training of all SAAOs in sampling protocols for the Form 1, part b pest surveillance information – by the DAE SPPS.
• The fuller validation of the new electronic forms (Forms 3 and 4) through the SPPS trainers
• The computation of the new information products from the electronic forms – by BRRI Statistics Division in collaboration with the DAE SPPS
• The development of a database of pest surveillance information as a basis for pest forecasting – by BRRI Statistics Division in collaboration with DAE SPPS.
27
REFERENCES Rabbi, M.F. (Ed.) (2005). Ecology and Management of Rice Hispa in Bangladesh Proceedings of a workshop held at the Bangladesh Rice Research Institute, Gazipur, April 2004. Murphy, S.T. (Ed.) (2005) Ecology and management of rice hispa (Dicladispa armigera) in Bangladesh. Final Technical Report (R7891). DFID Crop Protection Programme. 143 pp + Appendices. Ramaswamy, S; Kazi Shafiq Uddin (2001) New Pest Surveillance, Forecasting and Early Warning System for Bangladesh’. DAE/DANIDA - SPPS 49. 58pp.
28

ANNEXES
29
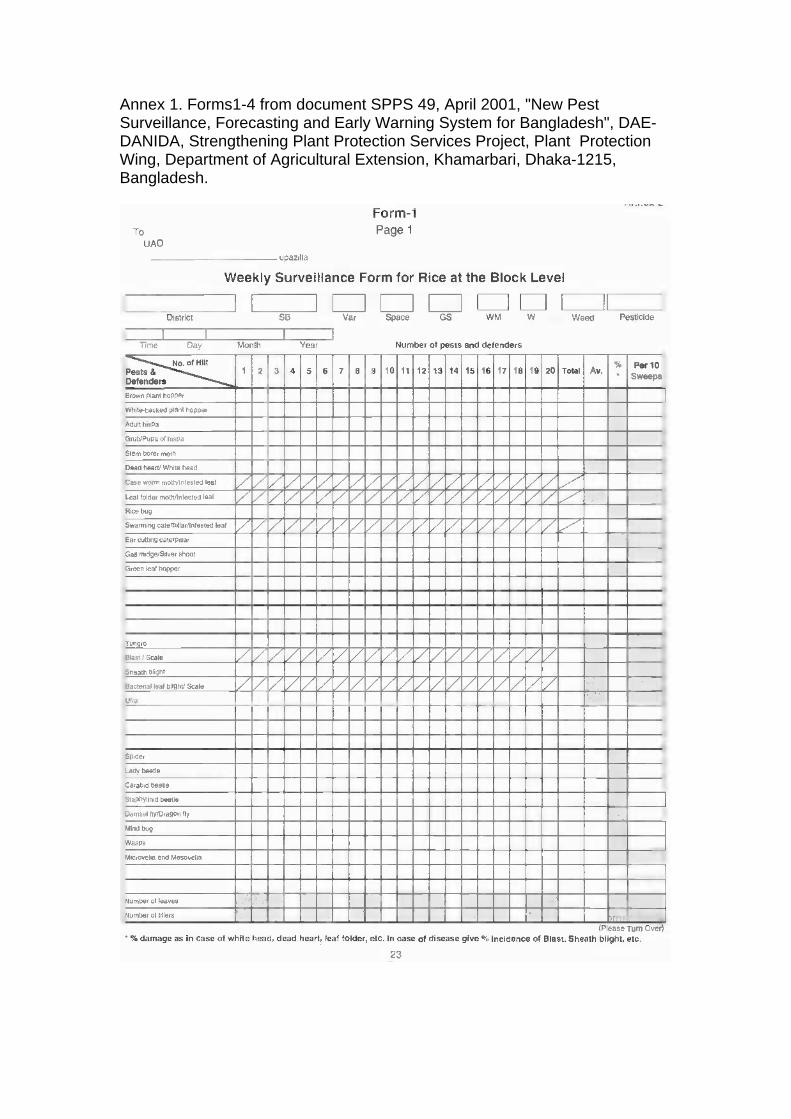
Annex 1. Forms1-4 from document SPPS 49, April 2001, "New Pest Surveillance, Forecasting and Early Warning System for Bangladesh", DAE-DANIDA, Strengthening Plant Protection Services Project, Plant Protection Wing, Department of Agricultural Extension, Khamarbari, Dhaka-1215, Bangladesh.

Annex 2. Copies of what appears on the computer screen (‘screen dumps’) when viewing the electronic versions of Forms 3 and 4.
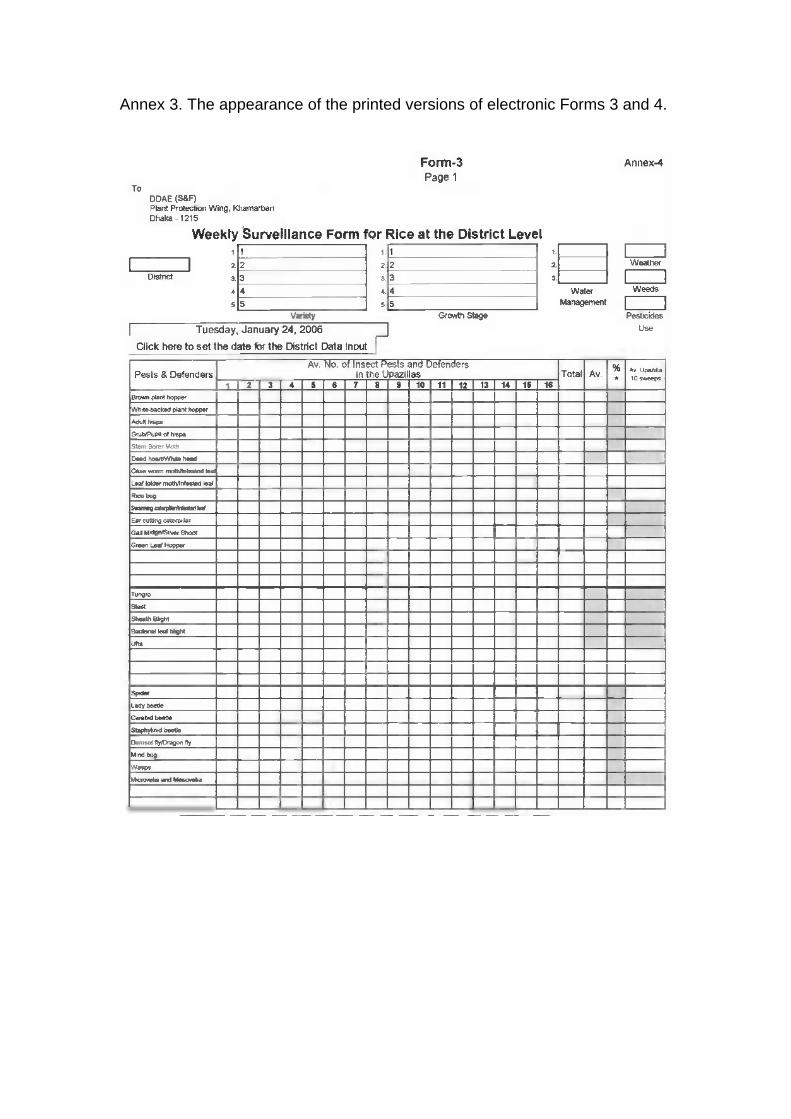
Annex 3. The appearance of the printed versions of electronic Forms 3 and 4.