crop prospects and food situation - reliefweb
TRANSCRIPT

Crop Prospects and Food Situation
No. 1 n March 2016
n FAO’s first forecast for global wheat production in 2016 points to a small decrease, with lower outputs expected in Europe and the United States of America.
n COUNTRIES IN NEED OF EXTERNAL ASSISTANCE: FAO estimates that, globally, 34 countries, including 27 in Africa, are in need of external assistance for food. Civil conflicts continued to severely affect the food security of a number of countries, while adverse weather, in some cases linked to El Niño, curbed production in others, constraining food access and pushing consumer prices up.
n AFRICA: Adverse weather reduced 2015 cereal output, resulting in a significant increase in the number of food insecure people in several countries, with conflicts further affecting food security and the agriculture sector in parts. Planting of the 2016 crops has begun in Central, East and West Africa, while in Southern Africa, with the harvest expected to commence from April, El Niño-associated drought conditions have significantly dampened production prospects, with severe negative implications for food security in the subregion. In North Africa, 2016 production prospects are mixed, with ongoing drought in Morocco and Algeria lowering production expectations.
n ASIA: The production outlook for the 2016 winter crops is generally favourable, with early forecasts indicating large wheat crops in most countries. In the Near East, however, persistent conflicts in Iraq, the Syrian Arab Republic and Yemen have continued to erode the capacity of the agriculture sector, affecting 2016 production prospects and further worsening the humanitarian crisis. The 2015 regional cereal output is estimated above the previous year’s level, mainly on account of increased harvests in China and Turkey that more than offset lower outputs in several countries of the Far East, in particular India.
n LATIN AMERICA AND THE CARIBBEAN: In Early 2016 cereal production prospects are mostly favourable, with harvests expected to remain at high levels, mainly as a result of large outputs anticipated in Mexico and South America. In Central America and the Caribbean, while Mexico is forecast to register an increase in production, elsewhere the continuation of El Niño-linked dry conditions may keep production depressed in 2016. In South America, cereal production in 2016 is forecast to decline slightly from the previous year’s record level, mostly reflecting a contraction in plantings, but is expected to remain well above average.
HIGHLIGHTS CONTENTSCountries requiring external assistance for food 2
Global production overview 6
LIFDC food situation overview 9
Regional reviews Africa 11 Asia 20 Latin America and the Caribbean 26 North America, Europe and Oceania 29
Statistical appendix 32
GIEWS global information and early warning system on food and agriculture
2000
2100
2200
2300
2400
2500
2600
201520132011200920072005
Million tonnes
World stocks remain at comfortablelevels, despite a small decreasein 2015 production
Production
Utilization
estimate
(-1.4%)
0
100
200
300
400
500
600
700
800
2016201520142013201220110
100
200
300
400
201620152014201320122011
Million tonnes
Early forecast for global 2016wheat production indicates a smalldecline from the record high of 2015
World (left scale) (-1.4%)
Europe (-0.9%)
f’cast
North America (-0.3%)
Asia (3.2%)
Million tonnes
Note: The regional aggregations refer only to the top fifteenproducing countries.Percentages refer to year-on-year changes.
100
200
300
400
500
FJDNOSAJJMAMF
20162015
Wheat (-18.6%)
Rice (-9.4%)
USD/tonne
Maize (-7.9%)
Note: Prices refer to monthly average. See Table 3 for details.Percentages refer to year-on-year changes.
International prices persist at levelsbelow the previous year

No. 1 n March 20162
Crop Prospects and Food Situation
ChadLarge caseload of refugees puts additional pressure on local food supplies• Over 370 000 refugees, 45 000 IDPs, as well as the
return of an estimated 100 000 Chadians, continue to add pressure on local food supplies, negatively affecting food security.
• Over 4 447 000 people are estimated to be in need of food assistance according to the last “Cadre Harmonisé” analysis.
DjiboutiInadequate pasture availability due to consecutive unfavourable rainy seasons• About 230 000 people are severely food insecure,
mainly in pastoral southeastern areas and in the Obock Region.
EritreaVulnerability to food insecurity due to El Niño-related drought and economic constraints
GuineaThe Ebola Virus Disease (EVD) epidemic is largely contained• Guinea was declared free of Ebola transmission in
December 2015 and all neighbouring countries have re-opened their borders with Guinea, which led to a significant increase in trade flows.
• About 40 500 people are estimated to be in need of food assistance according to the last “Cadre Harmonisé” analysis.
LiberiaThe EVD epidemic is largely contained• Liberia was declared free of the Ebola virus transmission
in the human population in September 2015 and food markets have recovered significantly.
AFRICA (27 countries)
EXCEPTIONAL SHORTFALL IN AGGREGATE FOOD PRODUCTION/SUPPLIES
Central African RepublicConflict, displacements and constraints in available supplies• The Internally Displaced Person (IDP) caseload increased
from 378 000 in late August to 452 000 in January 2016 due to the resurgence of inter-communal violence. According to the findings of the CFSAM, 67 percent of the surveyed groups have indicated that the food security situation has deteriorated compared to 2014.
• The significant tightening of food supplies has driven up prices.
ZimbabweDrought-affected 2016 production prospects and sharply reduced 2015 harvest • El Niño-associated drought conditions have severely
weakened 2016 production prospects and worsened livestock conditions.
• The expected reduced agricultural output comes on the back of a sharply lower 2015 harvest, 49 percent below the previous five-year average.
• Recently revised food insecure numbers indicate that 2.8 million people require assistance, up from an early estimate of 1.5 million.
WIDESPREAD LACK OF ACCESS
Burkina FasoIn spite of the generally favourable food supply situation, the country continues to host a large number of refugees from neighbouring Mali• Over 34 000 Malian refugees are estimated to be living
in the country.• About 126 000 people are estimated to be in need
of food assistance according to the last “Cadre Harmonisé” analysis.
Countries requiring external assistance for food1
country requiring external assistance for food
World: 34 countries

No. 1 n March 2016 3
Crop Prospects and Food Situation
• The country is hosting about 36 041 refugees as of end-December 2015, most of them from Côte d’Ivoire.
• About 17 000 people are estimated to be in need of food assistance according to the last “Cadre Harmonisé” analysis.
MalawiTight cereal supplies and poor cereal production prospects in 2016• Maize production in 2016 is expected to fall from
the below-average 2015 harvest due to unfavourable seasonal rains.
• The number of people requiring assistance in 2015/16 is estimated at 2.8 million, up from 1.3 million in 2014/15.
• Record maize prices are also constraining food access and further aggravating food security conditions.
MaliPopulation displacements and insecurity in northern areas• About 115 000 people, located mostly in Timbuktu,
Mopti and Sikasso regions, are estimated to be in Phase 3: “Crisis” and above according to the last “Cadre Harmonisé” analysis.
MauritaniaRefugee caseload continue to put additional pressure on local food supplies• More than 50 000 Malian refugees remain in
southeastern Mauritania. • Over 149 000 people are estimated to be in
Phase 3: “Crisis” and above according to the last “Cadre Harmonisé” analysis.
NigerRecurrent severe food crisis • About 657 000 people are estimated to be in
Phase 3: “Crisis” and above according to the last “Cadre Harmonisé” analysis.
• Over 59 000 Malian refugees are estimated to be living in the country.
• More than 100 000 people in the southeast Diffa Region have been displaced due to fear of attacks.
Sierra LeoneThe EVD has largely been controlled• Sierra Leone was declared free of the Ebola virus
transmission in the human population in November 2015 and trade flows of agricultural commodities to Guinea, Mali and Senegal have been recovering gradually.
• About 420 000 people are estimated to be in need of food assistance according to the last “Cadre Harmonisé” analysis.
SEVERE LOCALIZED FOOD INSECURITY
BurundiUnrest and civil insecurity • Disruption to markets, farming activities and
livelihoods, seriously affect food security conditions of households in Kirundo, Muyinga and Makamba provinces.
CameroonInflux of refugees exacerbating food insecurity of the host communities • The number of refugees from the Central African
Republic (CAR), which mainly entered East, Adamaoua and North regions, was estimated at 267 000 in January 2016. About 65 000 refugees from Nigeria mainly entered the Far North Region since May 2013.
• In February 2016, the number of food insecure people was estimated at 2.4 million, more than two times the level in June 2015. The most affected area is the Far North Region.
Displacement• Insecurity along the borders with Nigeria has led to the
internal displacement of 158 000 individuals.
CongoInflux of refugees straining the already limited resources of host communities • As of January 2016, about 27 000 refugees from the
CAR are sheltering in the country.
Democratic Republic of the CongoConflict and displacements in eastern provinces • As of December 2015, the total number of IDPs was
estimated at 1.5 million. • An estimated 4.5 million people are in need of urgent
humanitarian assistance in Eastern and Southern conflict-affected provinces (September 2015).
Influx of refugees straining on the already limited resources of host communities • As of late August, refugees from the CAR, mainly
hosted in the northern Equateur Province, were estimated at about 97 000.
Impact of floods• Torrential rains received in the last quarter of
2015 and in January 2016, linked to El Niño, have resulted in floods which affected about half a million people, caused the displacement of 50 000 individuals and damaged about 9 000 hectares of crop land.
• Destruction of food stocks has also been reported. The most affected areas are the province of Maniema in the east, the province of Mongala in the northwest, Orientale Province in the northeast and Katanga Province in the south.
EthiopiaImpact of severe drought on livestock and crop production • The estimated number of food insecure people
has sharply increased from 2.9 million in January 2015 to 10.2 million in December 2015, as severe rainfall deficits led to the rapid deterioration of food security conditions in several agro-pastoral and pastoral areas.
• Locally, thousands of livestock deaths are severely limiting the availability of nutritious livestock products and households’ incomes.
KenyaReduced second season crop production during the first quarter of 2015 and worsening pasture conditions • About 1.1 million people are severely food insecure,
mainly located in coastal and northeastern counties.
LesothoDrought conditions impacting 2016 production prospects and reduced 2015 harvest• Reflecting the current El Niño-associated drought
conditions that have sharply lowered production prospects and adversely impacted on livestock conditions, the number of people requiring assistance in 2015/16 was recently revised upwards from 463 936 to 534 502.
Madagascar Drought conditions in southern areas and tighter cereal supplies • Successive poor agricultural seasons in southern
areas have resulted in severe food security conditions in these areas, with 2016 production prospects similarly unfavourable.

No. 1 n March 20164
Crop Prospects and Food Situation
• Nationally, an estimated 1.89 million people are food insecure.
MozambiqueTighter cereal supplies and poor cereal production prospects in 2016• Maize production in 2016 is expected to fall
compared to the below-average 2015 harvest due to unfavourable seasonal rains.
• Currently, an estimated 176 139 people are food insecure.
SomaliaConflict, civil insecurity and reduced localized crop production
• About 1 million people are estimated to be in need of emergency assistance, mainly IDPs and drought-affected agro-pastoral communities in northern regions.
South SudanConflict, civil insecurity and severe economic downturn
• Over 2.8 million people, including 40 000 people in the Integrated Food Security Phase Classification (IPC) Household Phase 5: “Catastrophe”, are severely food insecure, mainly in the conflict-affected states of Jonglei, Unity and Upper Nile.
• New pockets of severe food insecurity are in Northern Bahr el Ghazal, Warrap and Eastern Equatoria states due to trade disruptions and high market prices.
SudanConflict and civil insecurity• An estimated 3.9 million people are in need of
humanitarian assistance, mainly IDPs in conflict affected areas and pastoral communities.
SwazilandPoor cereal production prospects in 2016• El Niño-associated drought conditions have sharply
lowered 2016 production prospects and adversely impacted livestock conditions.
• The current unfavourable production prospects come on the back of a poor agricultural season in 2015/16 and higher maize prices which are adversely impacting on food security conditions.
• Approximately 300 000 people are food insecure.
+
UgandaBelow-average crop production• About 320 000 people in Karamoja region are
estimated to be severely food insecure following consecutive unfavourable rainy seasons.
ASIA (7 countries)
EXCEPTIONAL SHORTFALL IN AGGREGATE FOOD PRODUCTION/SUPPLIES
IraqEscalation of the conflict and large internal displacement • Over 2 million people have been displaced since
January 2014.• Some 1.8 million beneficiaries (IDPs, non-displaced
food insecure in conflict areas and food insecure host families) are receiving food assistance.
• Internal trade restrictions and reduced access to stocks held in the areas under ISIL control.
Syrian Arab RepublicWorsening civil conflict• Agricultural production significantly affected by conflict. • About 13.5 million people are in need of humanitarian
assistance, with caseloads increasing.• Although some international food assistance is being
provided, Syrian refugees are also putting strain on other host communities in neighbouring countries.
• WFP plans to reach 2 million people with food assistance in neighbouring countries and 4.5 million within the country.
WIDESPREAD LACK OF ACCESS
Democratic People’s Republic of KoreaImpact of drought and floods in 2015• Poor rains between April and mid-July, coupled with
reduced supplies of irrigation water, sharply decreased the 2015 early and main season food crops production. Heavy rains from late July to early August 2015 reportedly caused some localized floods across North Hamgyong and Rason provinces, located in the northeastern part of the country, causing severe damage to housing and infrastructure (including schools, roads and bridges).
• With a reduced harvest in 2015, the food security situation is likely to deteriorate compared to the situation of previous years, when most households were already estimated to have borderline or poor food consumption rates.
YemenConflict, poverty, and high food and fuel prices• Around 21.2 million people, 82 percent of the
population, require some kind of humanitarian assistance to meet their basic needs or protect their fundamental rights.
• According to the IPC indicative analysis of June 2015, out of the 12.9 million food insecure people across the country, about 6.1 million were in Phase: 4 “Emergency”, while 6.8 million were in Phase: 3 “Crisis”.
• The level of food insecurity increased by 21 percent compared to the previous year.
SEVERE LOCALIZED FOOD INSECURITY
AfghanistanContinuing conflict and population displacement• Some 2.1 million people are classified as very severely
food insecure.• Over 700 000 people are internally displaced, mostly in
Helmand Province.• About 1.7 million people targeted with food assistance.
MyanmarImpact of floods in July-August 2015• Nearly 1.7 million people were displaced by heavy
rainfall and the passing of Cyclone Komen in July.• The floods caused severe damage to productive
assets and resulted in a reduction of the 2015 main season paddy production. In the states of Chin and Rakhine, paddy production is expected to fall by up to 16 percent, constraining food access and pushing up consumer prices. In these areas, there are pockets where people may face severe food shortages in the coming months and may require relief assistance.
NepalImpact of the earthquake in April 2015• The earthquake that struck in April 2015, mostly
impacting central and western parts, resulted in the loss of nearly 9 000 lives. In addition, the damage to the agricultural sector, coupled with poor rains during the cropping season, contributed to a reduction in 2015 cereal output, mainly for rice and maize crops.

No. 1 n March 2016 5
Crop Prospects and Food Situation
Key - Changes since last report (December 2015)No change Improving Deteriorating New Entry +
Terminology1 Countries requiring external assistance for food are expected to lack the resources to deal with reported critical problems of food insecurity. Food crises are nearly always due to a combination of factors but for the purpose of response planning, it is important to establish whether the nature of food crises is predominantly related to lack of food availability, limited access to food, or severe but localized problems. Accordingly, the list of countries requiring external assistance is organized into three broad, not mutually exclusive, categories:
•Countries facing an exceptional shortfall in aggregate food production/supplies as a result of crop failure, natural disasters, interruption of imports, disruption of distribution, excessive post-harvest losses, or other supply bottlenecks.
•Countrieswithwidespread lack of access, where a majority of the population is considered to be unable to procure food from local markets, due to very low incomes, exceptionally high food prices, or the inability to circulate within the country.
•Countrieswithsevere localized food insecurity due to the influx of refugees, a concentration of internally displaced persons, or areas with combinations of crop failure and deep poverty.
2 Countries facing unfavourable prospects for current crops are countries where prospects point to a shortfall in production of current crops as a result of a reduction of the area planted and/or yields due to adverse weather conditions, plant pests, diseases and other calamities.
Countries with unfavourable prospects for current crops2 (total: 14 countries)
AFRICA (14 countries)
AlgeriaDrought conditions have acutely weakened 2016 production prospects, particularly of winter cereals
+
Central African RepublicThe widespread conflict, which caused large-scale displacements, the loss and the depletion of the households’ productive assets and input shortages, is continuing to weigh down the early 2016 production outlook
MoroccoDrought conditions have acutely weakened 2016 production prospects, particularly of winter cereals
+
Southern Africa subregion (Angola, Botswana, Lesotho, Madagascar, Malawi, Mozambique, Namibia, South Africa, Swaziland, Zambia and Zimbabwe)Drought conditions, associated with the El Niño episode, have acutely weakened 2016 production prospects. Aggregate cereal production is expected to decline from last year’s already reduced and below-average level
No. 1 n March 20166
Crop Prospects and Food Situation
Global production overview (for FAO’s latest global Cereal Supply and Demand Brief visit the website here1)
winter plantings. In Asia, favourable
growing conditions are anticipated to
sustain near-record harvests in China and
Pakistan, while helping production to
recover in India.
COARSE GRAINS 2016The bulk of the 2016 global maize crop is
yet to be planted in Asia, Europe and North
America, while in the Southern Hemisphere
harvesting has already commenced, with
early indications pointing to reduced
outputs in South America and Southern
Africa. A contraction in 2016 plantings in
Brazil and Argentina, mostly reflecting
ample regional supplies and lower prices,
is largely behind the expected small decline
from last year’s record. In Southern Africa,
the El Niño episode sharply curbed seasonal
rains and 2016 production is expected to
decline steeply from the previous year’s
already weather-reduced level.
RICE 2016Although the 2016 season will not begin in
the Northern Hemisphere until May/June,
countries along or south of the equator are
already harvesting their 2016 main paddy
crops. Expectations for these crops have
been somewhat clouded by continued
erratic weather patterns, since cropping
activities in the Southern Hemisphere often
coincided with peak El Niño conditions. In
Asia, this has been primarily the case for
Indonesia, while in Southern Africa, severe
precipitation deficits have beset planting
operations in a number of Southern
African producers. In Australia, the output
could fall to a six-year low, as limited and
costly water supplies have significantly
constrained plantings. In South America,
prospects remain positive for Ecuador and
Peru, but less so in Bolivia and Guyana,
where poor expected margins may depress
cultivation. Excess precipitation and
reduced sunshine conditions instead mar
the outlook for Argentina, Uruguay
and particularly Brazil (the region’s largest
producer), where plantings were curbed by
high production costs and incessant rains,
with conditions further aggravated by
severe flooding problems in Rio Grande do
Sul state, Brazil’s main rice producing state.
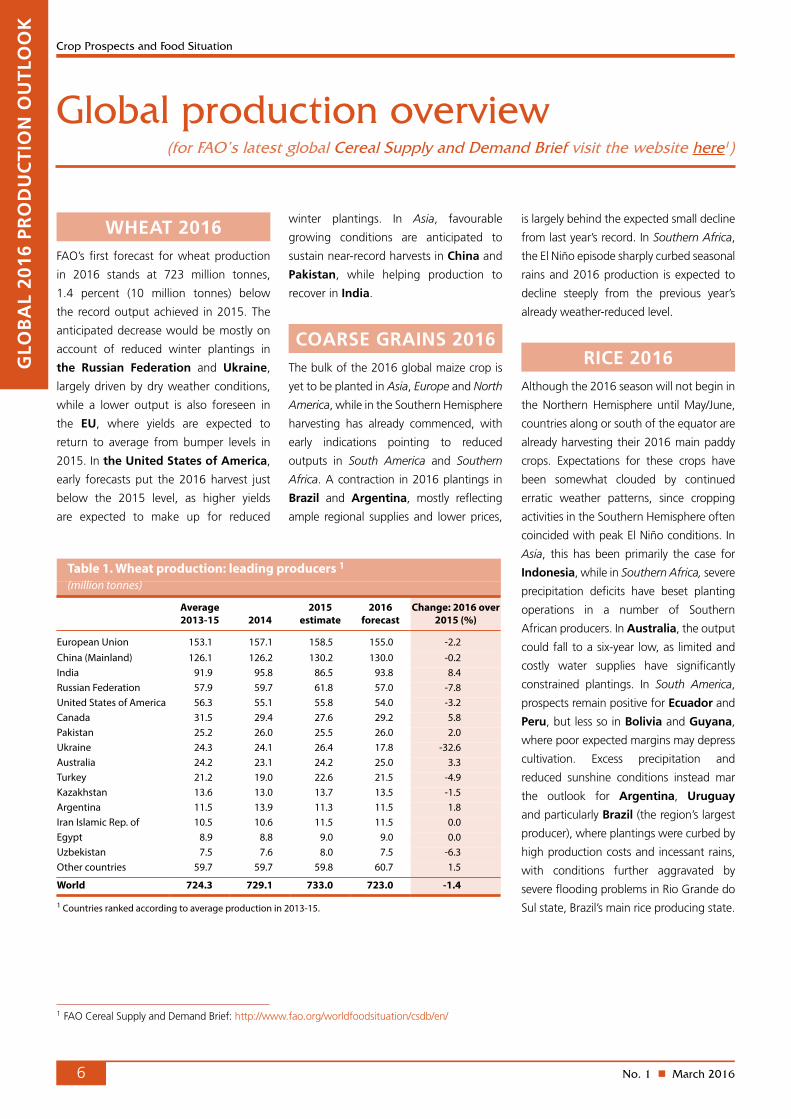
WHEAT 2016FAO’s first forecast for wheat production
in 2016 stands at 723 million tonnes,
1.4 percent (10 million tonnes) below
the record output achieved in 2015. The
anticipated decrease would be mostly on
account of reduced winter plantings in
the Russian Federation and Ukraine,
largely driven by dry weather conditions,
while a lower output is also foreseen in
the EU, where yields are expected to
return to average from bumper levels in
2015. In the United States of America,
early forecasts put the 2016 harvest just
below the 2015 level, as higher yields
are expected to make up for reduced
GLO
BA
L 20
16 P
RO
DU
CTI
ON
OU
TLO
OK
1 FAO Cereal Supply and Demand Brief: http://www.fao.org/worldfoodsituation/csdb/en/
Table 1. Wheat production: leading producers 1 (million tonnes)
Average 2013-15 2014
2015 estimate
2016 forecast
Change: 2016 over 2015 (%)
European Union 153.1 157.1 158.5 155.0 -2.2China (Mainland) 126.1 126.2 130.2 130.0 -0.2India 91.9 95.8 86.5 93.8 8.4Russian Federation 57.9 59.7 61.8 57.0 -7.8United States of America 56.3 55.1 55.8 54.0 -3.2Canada 31.5 29.4 27.6 29.2 5.8Pakistan 25.2 26.0 25.5 26.0 2.0Ukraine 24.3 24.1 26.4 17.8 -32.6Australia 24.2 23.1 24.2 25.0 3.3Turkey 21.2 19.0 22.6 21.5 -4.9Kazakhstan 13.6 13.0 13.7 13.5 -1.5Argentina 11.5 13.9 11.3 11.5 1.8Iran Islamic Rep. of 10.5 10.6 11.5 11.5 0.0Egypt 8.9 8.8 9.0 9.0 0.0Uzbekistan 7.5 7.6 8.0 7.5 -6.3Other countries 59.7 59.7 59.8 60.7 1.5
World 724.3 729.1 733.0 723.0 -1.4
1 Countries ranked according to average production in 2013-15.

No. 1 n March 2016 7
Crop Prospects and Food Situation
CEREALS 2015With the season coming to a close,
FAO estimates world cereal production
in 2015 at 2 525 million tonnes, about
1.4 percent (35.8 million tonnes)
below the record output of 2014. The
year-on-year decrease is mainly the result
of reduced maize and, to a lesser extent,
rice outputs.
WHEAT 2015Global production of wheat in 2015 is
estimated at 733 million tonnes, slightly
down from the earlier forecast but still
0.5 percent (3.9 million tonnes) up from
the previous year and a record high. The
bulk of the increase in 2015 is on account
of larger outputs in the European CIS
countries (the Russian Federation and
Ukraine) and North Africa.
COARSE GRAINS 2015Global coarse grains production in 2015
is estimated at 1 301 million tonnes,
marginally below earlier forecast, and
2.7 percent (36.5 million tonnes) down
from 2014. Most of the contraction
reflects lower maize outputs in the EU,
Ukraine and the United States of
America, which more than negated robust
gains in China and Brazil. World barley
production in 2015 increased by 3 percent
to 147.5 million tonnes, with most regions
registering larger harvests, except for
Europe, mainly due to lower outputs in the
Russian Federation and Ukraine. The
global sorghum output declined in 2015 to
644 million tonnes, 1 percent lower than
the previous year, mostly stemming from a
steep decline in Sudan’s production.
RICE 2015The 2015 season is drawing to a
close as off-season crops in Northern
Hemisphere countries have reached
the harvesting stage. FAO’s latest
forecast points to a global harvest of
491.4 million tonnes (milled basis)
in 2015. This level would represent
a 3.4 million-tonne contraction from
the already disappointing outturn of
2014, reflecting the negative impact of
adverse weather conditions associated
with the prevailing El Niño episode.
GLO
BA
L 2015 PRO
DU
CTIO
N SU
MM
AR
Y
Table 2. World cereal production1 (million tonnes)
20132014
estimate2015
forecastChange: 2015 over 2014 (%)
Asia 1 117.3 1 115.6 1 119.5 0.3Far East 1 014.3 1 019.3 1 014.5 -0.5Near East 69.5 64.3 70.6 9.9CIS in Asia 33.5 32.0 34.4 7.5
Africa 163.5 175.5 162.9 -7.1North Africa 36.0 32.7 37.1 13.5West Africa 49.9 52.5 53.5 1.9Central Africa 4.7 4.7 4.5 -4.2East Africa 44.0 51.0 41.3 -19.0Southern Africa 28.9 34.6 26.5 -23.3
Central America and Caribbean 41.3 42.0 43.2 2.8
South America 176.8 178.7 186.3 4.3
North America 498.0 491.3 482.5 -1.8
Europe 482.9 522.5 492.9 -5.7EU 306.0 330.8 309.6 -6.4CIS in Europe 162.9 177.6 170.2 -4.1
Oceania 40.3 35.8 38.2 6.5
World 2 520.1 2 561.4 2 525.5 -1.4Developing countries 1 441.6 1 453.5 1 456.1 0.2Developed countries 1 078.6 1 107.9 1 069.4 -3.5
- wheat 710.8 729.1 733.0 0.5- coarse grains 1 314.8 1 337.6 1 301.1 -2.7- rice (milled) 494.5 494.7 491.4 -0.7
Note: Totals and percentage change computed from unrounded data.1 Includes rice in milled terms.

No. 1 n March 20168
Crop Prospects and Food Situation
WHEATExport prices of wheat generally declined
in February, with the benchmark US wheat
(No.2 Hard Red Winter, fob) price averaging
USD 205 per tonne, 4 percent lower than in
January and almost 20 percent down from
its year-earlier value. Weaker export prices
reflected slow trade activity, while supplies
remain large and mostly favourable growing
conditions in the Northern Hemisphere
point to another good output in 2016.
INTE
RN
ATI
ON
AL
PRIC
E R
OU
ND
-UP
MAIZEThe benchmark US maize (No.2, Yellow,
fob) value averaged USD 160 per tonne
in February, virtually unchanged from
its level in January, though still about
8 percent lower than the corresponding
period last year. A rebound in import
demand and some concerns about
crop conditions in the Southern
Hemisphere provided support to maize
export quotations, although abundant
supplies and strong competition
between exporters limited the gains.
In Argentina, quotations increased
reflecting firm export demand and some
weather-related worries for the 2016
crop, about to be harvested. In the
Black Sea region, prices also moved up
as a result of export demand and recent
sales.
RICEThe FAO All Rice Price index (2002-04=100)
averaged 197 points in February 2016,
1 point more than in January, mainly as a
result of a 1.5 percent rise in the Japonica
price sub-index, lifted by a firming of
Egyptian quotations. In Thailand, export
quotations generally moved up, with
the benchmark Thai 100%B white rice
averaging USD 389 per tonne, almost
4 percent higher than in January, on a
stronger Baht and expectations of new
trade agreements. Prices also increased in
Pakistan, due to ongoing sales to Africa.
By contrast, they declined slightly in India
on subdued import demand, and in Viet
Nam. Low import demand put downward
pressure on prices in the Americas, with
export quotations decreasing in the United
States of America, but also in Argentina,
Uruguay and Brazil.
Table 3. Cereal export prices* (USD/tonne)
2015 2016 Feb. Sept. Oct. Nov. Dec Jan. Feb.
United States Wheat1 252 218 221 211 212 214 205Maize2 174 166 172 166 164 161 160Sorghum2 230 177 182 173 170 165 165
Argentina3 Wheat 241 223 223 210 193 194 194Maize 178 161 164 167 166 161 167
Thailand4 Rice, white5 430 367 376 379 373 375 389Rice, broken6 331 316 323 329 331 331 339
*Prices refer to the monthly average.1 No.2 Hard Red Winter (Ordinary Protein) f.o.b. Gulf.2 No.2 Yellow, Gulf.3 Up river, f.o.b.4 Indicative traded prices.5 100% second grade, f.o.b. Bangkok.6 A1 super, f.o.b. Bangkok.

No. 1 n March 2016 9
Crop Prospects and Food Situation
Low-Income Food-Deficit Countries food situation overview2
LOW
-INC
OM
E FOO
D-D
EFICIT C
OU
TRIES
Favourable production outlook for 2016 winter crops, but sharply lower 2016 output expected in Southern AfricaIn Low-Income Food-Deficit Countries
(LIFDCs), harvesting of the 2016 winter
crops will begin in April and the outlook
is generally positive. However, in Southern
Africa, production prospects for the main
2016 summer crops, to be harvested from
March/April, are extremely poor, reflecting
El Niño-associated drought conditions.
In Asia, 2016 production expectations
in the Far East subregion are generally
favourable. In India, the largest
producing LIFDC, preliminary forecasts
point to a recovery in wheat production
from the weather-reduced output in
2015, mainly resting on a return to
average yields. In Pakistan, the wheat
output is expected to remain close
to the record level in 2015. In the
Near East, despite relatively beneficial
weather conditions supporting 2016
crop development in most countries, the
ongoing conflict and lack of inputs in the
Syrian Arab Republic and Yemen has
continued to erode the capacity of the
agriculture sector, significantly weighing
down 2016 production prospects. In
sub-Saharan Africa, the production
outlook is acutely unfavourable in several
countries of Southern Africa, on account
of sharply-reduced seasonal rains and
higher-than-normal temperatures, linked
to the prevailing El Niño and 2016 cereal
production is anticipated to remain
below average and decline compared to
the already weather-depressed output
in 2015. In East and Central Africa,
planting of the main 2016 season crops
has started. Persistent insecurity in parts
of the region, notably in the Central
African Republic (CAR), continues to
affect the agriculture sector, adversely
impacting the cropping activities and
access to inputs.
Lower cereal output in 2015, due to weather-depressed harvests in India, East and Southern AfricaHarvesting of the 2015 cereal crops is
virtually complete and FAO’s latest LIFDC
production estimate for 2015 stands at
410 million tonnes, 1 percent (4 million
tonnes) lower than last reported in
December and 27.5 million tonnes below
the bumper level in 2014. The quarterly
revision mostly reflects a lowering of the
production estimate in Asia, while the
year-on-year decrease is principally on
account of reduced outputs in East and
Southern Africa, and India.
In Asia, the aggregate 2015 cereal
output is estimated at 300.1 million
tonnes, 5.1 percent down from
2014. The decrease mostly reflects
a 16-million tonne production fall in
India, due to persistent dry weather.
Elsewhere in the Far East subregion,
lower outputs were also estimated
in Nepal, the Democratic People’s
Republic of Korea and Mongolia. In
the Syrian Arab Republic, beneficial
weather resulted in a 35 percent cereal
production increase; however, larger
gains were severely limited by the impact
2 The Low-Income Food-Deficit Countries (LIFDCs) group includes net food deficit countries with annual per caput income below the level used by the World Bank to determine eligibility for IDA assistance (i.e. USD 1 945 in 2011). The new list of the LIFDCs stands at 54 countries, one less than in 2014 list but with some changes. These are: the Republic of the Congo, the Philippines and Sri Lanka, which all graduated out based on income criterion (for the Philippines in particular this is part due to the World Bank revision of income data). The 2015 list of LIFDCs now also includes South Sudan, for which data had previously been unavailable, and the Syrian Arab Republic, which had previously been taken off the list, but now fails to satisfy the three criteria for exclusion. For full details see: http://www.fao.org/countryprofiles/lifdc/en/
Table 4. Basic facts of the Low-Income Food-De�cit Countries (LIFDCs) cereal situation (million tonnes, rice in milled basis)
2013/142014/15 estimate
2015/16 forecast
Change: 2015/16 over 2014/15 (%)
Cereal production1 425.8 437.5 410.0 -6.3 excluding India 182.4 193.1 181.6 -6.0
Utilization 449.3 463.1 462.1 -0.2Food use 363.8 371.7 377.4 1.5 excluding India 174.5 179.2 182.9 2.1Per caput cereal food use (kg per year) 146.3 146.9 146.5 -0.3 excluding India 144.6 145.1 144.7 -0.3Feed 33.1 35.4 34.6 -2.3 excluding India 20.0 21.8 20.7 -5.0
End of season stocks2 90.7 94.8 79.7 -15.9 excluding India 36.9 40.1 35.0 -12.8
1 Data refer to calendar year of the �rst year shown.2 May not equal the di�erence between supply and utilization because of di�erences in individual country marketing years.
No. 1 n March 201610
Crop Prospects and Food Situation
of the conflict. By contract, a second
consecutive year-on-year production
decline in Yemen has resulted in a well
below-average output. In CIS in Asia, the
2015 aggregate cereal crop is estimated
at an above-average level.
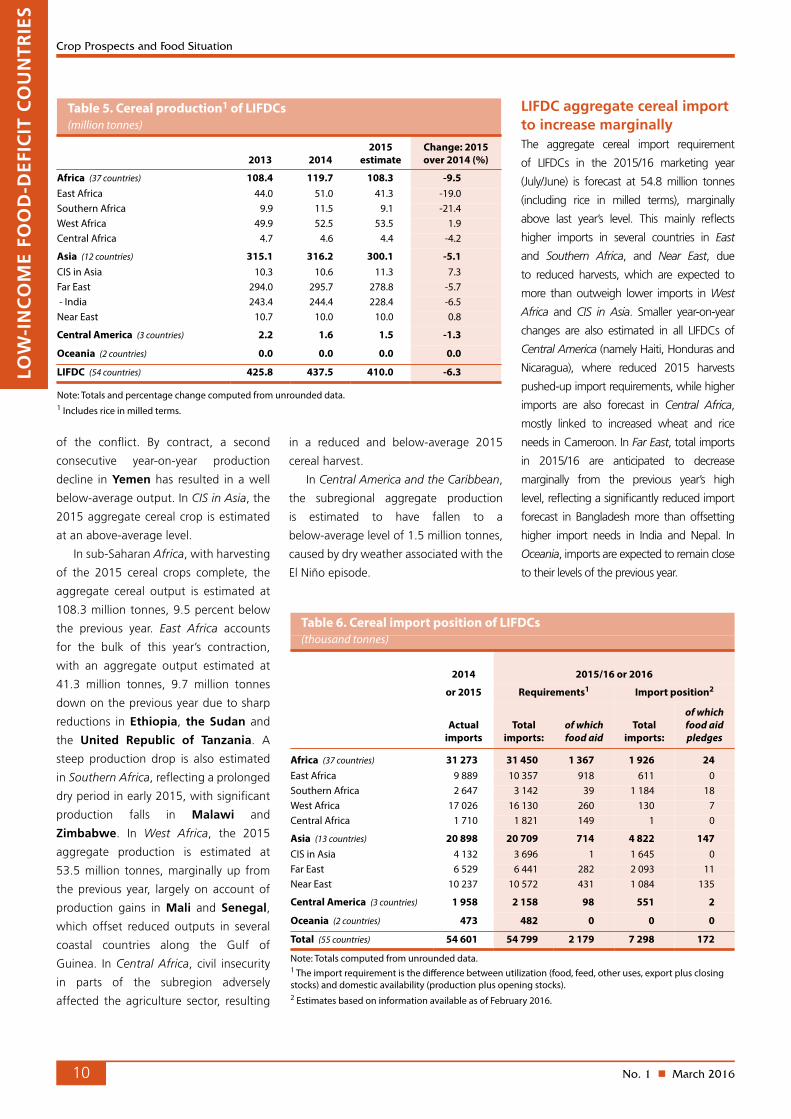
In sub-Saharan Africa, with harvesting
of the 2015 cereal crops complete, the
aggregate cereal output is estimated at
108.3 million tonnes, 9.5 percent below
the previous year. East Africa accounts
for the bulk of this year’s contraction,
with an aggregate output estimated at
41.3 million tonnes, 9.7 million tonnes
down on the previous year due to sharp
reductions in Ethiopia, the Sudan and
the United Republic of Tanzania. A
steep production drop is also estimated
in Southern Africa, reflecting a prolonged
dry period in early 2015, with significant
production falls in Malawi and
Zimbabwe. In West Africa, the 2015
aggregate production is estimated at
53.5 million tonnes, marginally up from
the previous year, largely on account of
production gains in Mali and Senegal,
which offset reduced outputs in several
coastal countries along the Gulf of
Guinea. In Central Africa, civil insecurity
in parts of the subregion adversely
affected the agriculture sector, resulting
in a reduced and below-average 2015
cereal harvest.
In Central America and the Caribbean,
the subregional aggregate production
is estimated to have fallen to a
below-average level of 1.5 million tonnes,
caused by dry weather associated with the
El Niño episode.
LIFDC aggregate cereal import to increase marginally The aggregate cereal import requirement
of LIFDCs in the 2015/16 marketing year
(July/June) is forecast at 54.8 million tonnes
(including rice in milled terms), marginally
above last year’s level. This mainly reflects
higher imports in several countries in East
and Southern Africa, and Near East, due
to reduced harvests, which are expected to
more than outweigh lower imports in West
Africa and CIS in Asia. Smaller year-on-year
changes are also estimated in all LIFDCs of
Central America (namely Haiti, Honduras and
Nicaragua), where reduced 2015 harvests
pushed-up import requirements, while higher
imports are also forecast in Central Africa,
mostly linked to increased wheat and rice
needs in Cameroon. In Far East, total imports
in 2015/16 are anticipated to decrease
marginally from the previous year’s high
level, reflecting a significantly reduced import
forecast in Bangladesh more than offsetting
higher import needs in India and Nepal. In
Oceania, imports are expected to remain close
to their levels of the previous year.
LOW
-IN
CO
ME
FOO
D-D
EFIC
IT C
OU
NTR
IES
Table 5. Cereal production1 of LIFDCs(million tonnes)
2013 20142015
estimateChange: 2015 over 2014 (%)
Africa (37 countries) 108.4 119.7 108.3 -9.5East Africa 44.0 51.0 41.3 -19.0Southern Africa 9.9 11.5 9.1 -21.4West Africa 49.9 52.5 53.5 1.9Central Africa 4.7 4.6 4.4 -4.2
Asia (12 countries) 315.1 316.2 300.1 -5.1CIS in Asia 10.3 10.6 11.3 7.3Far East 294.0 295.7 278.8 -5.7 - India 243.4 244.4 228.4 -6.5Near East 10.7 10.0 10.0 0.8
Central America (3 countries) 2.2 1.6 1.5 -1.3
Oceania (2 countries) 0.0 0.0 0.0 0.0
LIFDC (54 countries) 425.8 437.5 410.0 -6.3
Note: Totals and percentage change computed from unrounded data.1 Includes rice in milled terms.
Table 6. Cereal import position of LIFDCs(thousand tonnes)
2014 2015/16 or 2016
or 2015 Requirements1 Import position2
Actual
importsTotal
imports:of which food aid
Total imports:
of which food aid pledges
Africa (37 countries) 31 273 31 450 1 367 1 926 24East Africa 9 889 10 357 918 611 0Southern Africa 2 647 3 142 39 1 184 18West Africa 17 026 16 130 260 130 7Central Africa 1 710 1 821 149 1 0
Asia (13 countries) 20 898 20 709 714 4 822 147CIS in Asia 4 132 3 696 1 1 645 0Far East 6 529 6 441 282 2 093 11Near East 10 237 10 572 431 1 084 135
Central America (3 countries) 1 958 2 158 98 551 2
Oceania (2 countries) 473 482 0 0 0
Total (55 countries) 54 601 54 799 2 179 7 298 172
Note: Totals computed from unrounded data.1 The import requirement is the di�erence between utilization (food, feed, other uses, export plus closing stocks) and domestic availability (production plus opening stocks).2 Estimates based on information available as of February 2016.

No. 1 n March 2016 11
Crop Prospects and Food Situation
NORTH AFRICA
Mixed prospects for 2016 winter crops In North Africa, early prospects for the 2016 winter wheat
and coarse grains crops, to be harvested from May, are mixed.
While Egypt, western parts of Tunisia and eastern parts of
Algeria maintain favourable crop prospects owing to timely
and widespread precipitation, large swathes of land normally
planted to cereals in Morocco and western Algeria have
been adversely affected by drought conditions. Between
November 2015 and January 2016, precipitation deficits
reached 80 percent in some parts of Morocco. In addition,
above-average temperatures have exacerbated the impact
of rainfall deficits on crop development. Improved rainfall
during the remainder of the season would partly mitigate the
negative impact of early seasonal dryness but would not lead
to a full production recovery. In Egypt, reports indicate average
meteorological conditions, resulting in a preliminary wheat
production forecast of 9 million tonnes.
Above-average import requirement estimated for the 2015/16 marketing year despite an above-average 2015 cereal harvestThe aggregate 2015 subregional cereal production (including rice in
paddy terms) is estimated at 39 million tonnes, an increase of about
12.5 percent on the previous year’s output and 9 percent on the
five-year average. The coarse grains harvest is put at 12.5 million
tonnes, about 5 percent above the five-year average and about
15 percent higher than in 2014. Total wheat production, which
accounts for just over half of the aggregate cereal output, was
estimated at 20.5 million tonnes, 16 percent above 2014’s output.
Regional reviews
With a slightly above-average harvest estimated in 2015,
the subregion’s aggregate cereal import requirement for the
2015/16 marketing year (July/June) is estimated at approximately
44.5 million tonnes, slightly below the previous year’s level but
about 9 percent above the average of the previous five years.
Wheat accounts for almost 60 percent of the total cereal import
requirement. The above-average 2015 harvest in Morocco
lowered the forecasted cereal imports to 5.1 million tonnes
(20 percent below the 2014/15 volumes), while a reduced crop
increased the import requirement in Tunisia by 18 percent
compared to last year.
AFR
ICA
Note: Comments refer to situation as of March.
North Africa • winter grains: vegetative
Southern Africa • main season (summer cereals): harvesting
Kenya, Somalia • main season cereals: land preparation/ planting
Uganda• main season cereals: planting
Eritrea, Ethiopia• secondary season grains: land preparation/ planting
Tanzania, U.R.• main season cereals: plantings
Sudan• secondary season wheat: maturing
West Africa coastal countries • main season cereals: land preparation/ planting
Burundi, Rwanda• main season cereals: land preparation/ planting
Table 7. North Africa cereal production (million tonnes)
Wheat Coarse grains Rice (paddy) Total cereals
2013 20142015
estim. 2013 20142015
estim. 2013 20142015
estim. 2013 20142015
estim.Change:
2015/2014 (%)
North Africa 20.3 17.6 20.5 11.5 10.8 12.5 6.1 6.3 5.9 37.9 34.6 38.9 12.5Algeria 3.3 2.0 2.4 1.6 1.3 1.5 0.0 0.0 0.0 4.9 3.3 3.9 18.0Egypt 8.8 8.8 9.0 6.5 6.6 6.8 6.1 6.2 5.9 21.4 21.6 21.7 0.3Morocco 7.0 5.1 8.0 2.9 1.9 3.7 0.0 0.0 0.0 9.9 7.0 11.7 66.8Tunisia 1.0 1.5 0.9 0.3 0.8 0.4 0.0 0.0 0.0 1.3 2.3 1.3 -43.7
Note: Totals and percentage change computed from unrounded data.

No. 1 n March 201612
Crop Prospects and Food Situation
an above-average output was
estimated in Burkina Faso.
By contrast, in coastal
countries along the Gulf of
Guinea, maize yields were
adversely affected by irregular
rains in parts. Compared
to 2014, cereal outputs are
estimated to have declined
by over 13 percent in Ghana,
2 percent in Benin and
6 percent in Togo. In Nigeria,
cereal production is expected
to remain at the same level
as in 2014. In the countries affected by the Ebola Virus Disease
(EVD) outbreak, Guinea, Liberia and Sierra Leone, production
is estimated to have recovered from the previous year’s
Ebola-affected levels.
Coarse grain prices have fallen in most countries Reflecting ample supplies from last year’s above-average crop,
prices of coarse grains dropped considerably in recent months
in most countries. In the Sahel belt, prices of locally-produced
sorghum and millet continued to decline in January and were
overall significantly below their year-earlier levels, as markets
are generally well supplied. Coarse grain prices also continued
to decline in Burkina Faso, Mali and Niger. Similarly, in Chad,
coarse grain prices generally decreased in December, with a
Uneven developments in food inflationFood price inflation in January 2016 ranged from no inflation
in Morocco to over 13 percent in Egypt. Algeria reported a
food price inflation of 2 percent in January 2016 and Tunisia
1.4 percent. The reported variations are largely in response to
changes in prices of non-subsidized products, with bread prices
generally subsidized across the subregion. In Libya, where
the overall yearly inflation is estimated at over 14 percent,
the increases are driven by supply chain disruptions due to
infrastructure destruction offsetting the downward pressure from
high fuel and food subsidies.
WEST AFRICA
In West Africa, seasonal dry conditions prevail in the Sahel, while
in the coastal countries along the Gulf of Guinea land preparation
for the first maize crop is underway. Planting will begin with the
arrival of rains, usually from April.
Above-average harvest gathered in 2015The subregion’s aggregate cereal output in 2015 was provisionally
estimated at about 58.8 million tonnes, which is 2 percent above
the previous year’s crop and 7.45 percent above the five-year
average. Reduced harvests in several coastal countries were
more than offset by above-average crops in other parts of the
subregion, notably in the Sahel belt.
In the Sahel, cereal production recovered significantly in the
countries that were affected by irregular rains in 2014 and experienced
a steep drop in production. Compared to the previous year’s outputs,
2015 cereal production is estimated to have increased by 84 percent
in Senegal, 28 percent in Guinea-Bissau and 12 percent in Islamic
Republic of the Gambia. In Cabo Verde, production is estimated
to have recovered significantly from the drought-reduced harvest
of the previous year. A record crop was gathered in Mali, while
Table 8. West Africa cereal production (million tonnes)
Coarse grains Rice (paddy) Total cereals 1
2013 20142015
estim. 2013 20142015
estim. 2013 20142015
estim.Change:
2015/2014 (%)
West Africa 41.1 43.5 44.2 13.8 14.0 14.5 55.0 57.7 58.8 2.0Burkina Faso 4.6 4.1 4.2 0.3 0.3 0.3 4.9 4.5 4.5 1.3Chad 2.2 2.4 2.2 0.4 0.3 0.2 2.6 2.7 2.4 -11.7Ghana 2.2 2.2 1.9 0.6 0.6 0.6 2.7 2.8 2.4 -13.4Mali 3.5 4.8 5.6 2.2 2.2 2.5 5.7 7.0 8.0 15.3Niger 4.3 4.8 4.5 0.0 0.1 0.1 4.3 4.9 4.6 -5.1Nigeria 18.4 19.5 19.2 4.7 4.9 4.8 23.2 24.4 24.0 -1.6
Note: Totals and percentage change computed from unrounded data.1 Total cereals includes wheat, coarse grains and rice (paddy).
14000
16000
18000
20000
22000
24000
26000
FJDNOSAJJMAMFJDNOSAJJMAMF20152014 2016
Niger Niamey
Figure 1. Millet prices in selected West Africanmarkets
CFA Franc BCEAO (XOF)/100kg Burkina Faso Ouagadougou
Source: Afrique Verte.
Mali Bamako
AFR
ICA
No. 1 n March 2016 13
Crop Prospects and Food Situation
AFR
ICA
few exceptions due to insecurity affecting trade activities. In
the coastal countries along the Gulf of Guinea, prices of maize,
the most consumed cereal, decreased substantially in late 2015.
In Benin, maize prices declined by up to 21 percent between
October and December after the steep rise of the previous
months, while in Togo, maize prices dropped up to one-third
over the same period. In both countries, however, prices were
still well above their year-earlier levels as of December 2015.
In Nigeria, the largest producing country of the subregion,
despite some increases, prices in December were generally well
below their values of a year earlier, mainly reflecting adequate
supplies from the good 2015 cereal harvest.
Food security affected by civil insecurity and infectious disease outbreaksIn spite of the above-average 2015 cereal harvest, humanitarian
assistance is still needed in several parts, mostly due to the
continuing civil conflict in northern Nigeria and the CAR that
has resulted in large population displacement. Specifically, the
conflict in northern Nigeria has resulted in large-scale population
displacements internally and in the neighbouring countries
of Cameroon, Chad and Niger. Over 1.8 million people have
been displaced in northeast Nigeria. In addition, over 105 000
people are estimated to have left Nigeria for the Diffa Region of
Niger, while nearly 57 000 people have taken refuge in northern
Cameroon. Moreover, according to the Office of the United
Nations High Commissioner for Refugees (UNHCR), an additional
15 000 Nigerians fled to Chad, which has also seen increased
numbers of refugees and returnees due to civil conflict in the
Sudan, the CAR, Nigeria and Libya. Overall, over 460 000 refugees
are estimated to be currently living in Chad, while about 340 000
Chadians have returned to their country. The refugee crisis has
exacerbated an already fragile food security situation. Moreover,
the areas affected by irregular rains in 2015 are expected to
experience increased food insecurity and malnutrition in the
2015/16 marketing year.
In spite of the relatively low impact of EVD on 2014 agricultural
production at the national level, its impact on economic activities
and livelihoods severely
affected household food
security in Guinea, Liberia and
Sierra Leone. Similarly, since
December 2014, HPAI (avian
influenza) has been affecting
several poultry farms and
live bird markets in Nigeria,
Burkina Faso, Niger, Côte
d’Ivoire and Ghana, causing
major economic losses in the
poultry sector.
As a result of the shocks mentioned above, over 8 million
people are estimated to be in Phase 3: “Crisis” and above in West
Africa between October and December according to the latest
“Cadre Harmonisé” analysis. This number is forecast to rise to
over 10.7 million between June and August 2016. More than half
of the people in need of food assistance live in Nigeria.
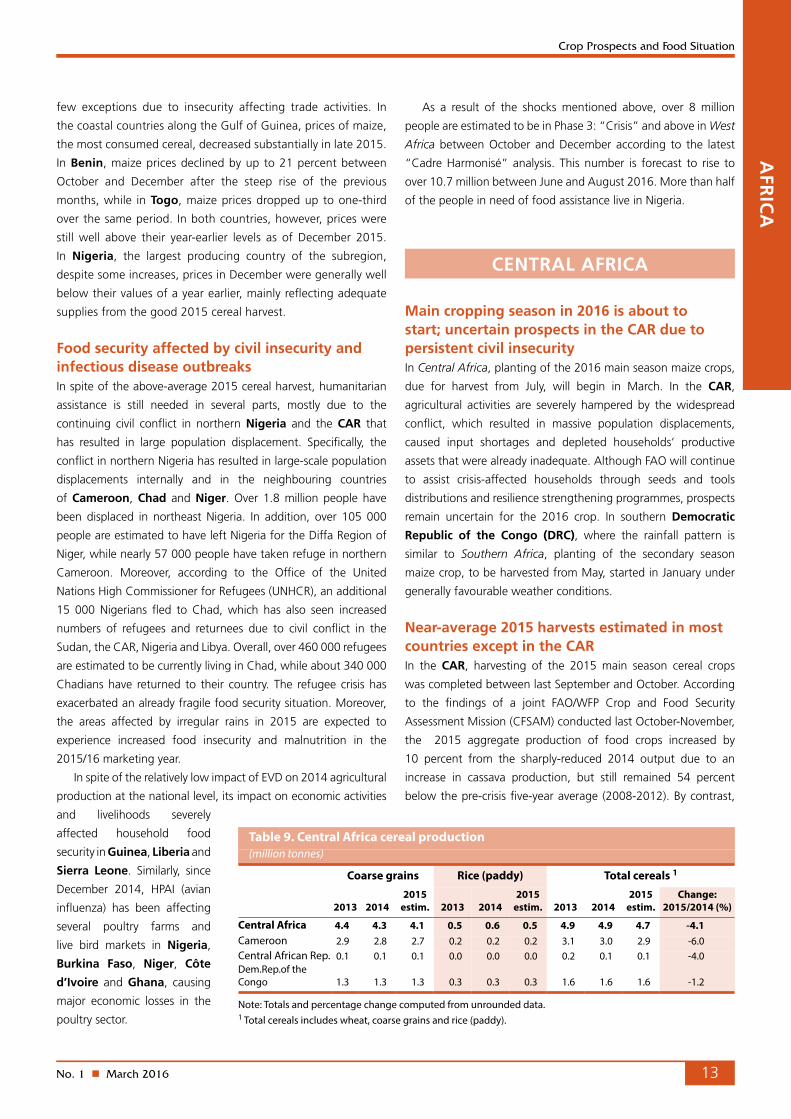
CENTRAL AFRICA
Main cropping season in 2016 is about to start; uncertain prospects in the CAR due to persistent civil insecurity In Central Africa, planting of the 2016 main season maize crops,
due for harvest from July, will begin in March. In the CAR,
agricultural activities are severely hampered by the widespread
conflict, which resulted in massive population displacements,
caused input shortages and depleted households’ productive
assets that were already inadequate. Although FAO will continue
to assist crisis-affected households through seeds and tools
distributions and resilience strengthening programmes, prospects
remain uncertain for the 2016 crop. In southern Democratic
Republic of the Congo (DRC), where the rainfall pattern is
similar to Southern Africa, planting of the secondary season
maize crop, to be harvested from May, started in January under
generally favourable weather conditions.
Near-average 2015 harvests estimated in most countries except in the CAR In the CAR, harvesting of the 2015 main season cereal crops
was completed between last September and October. According
to the findings of a joint FAO/WFP Crop and Food Security
Assessment Mission (CFSAM) conducted last October-November,
the 2015 aggregate production of food crops increased by
10 percent from the sharply-reduced 2014 output due to an
increase in cassava production, but still remained 54 percent
below the pre-crisis five-year average (2008-2012). By contrast,
14000
16000
18000
20000
22000
24000
26000
FJDNOSAJJMAMFJDNOSAJJMAMF20152014 2016
Niger Niamey
Figure 1. Millet prices in selected West Africanmarkets
CFA Franc BCEAO (XOF)/100kg Burkina Faso Ouagadougou
Source: Afrique Verte.
Mali Bamako
Table 9. Central Africa cereal production (million tonnes)
Coarse grains Rice (paddy) Total cereals 1
2013 20142015
estim. 2013 20142015
estim. 2013 20142015
estim.Change:
2015/2014 (%)
Central Africa 4.4 4.3 4.1 0.5 0.6 0.5 4.9 4.9 4.7 -4.1Cameroon 2.9 2.8 2.7 0.2 0.2 0.2 3.1 3.0 2.9 -6.0Central African Rep. 0.1 0.1 0.1 0.0 0.0 0.0 0.2 0.1 0.1 -4.0Dem.Rep.of the Congo 1.3 1.3 1.3 0.3 0.3 0.3 1.6 1.6 1.6 -1.2
Note: Totals and percentage change computed from unrounded data.1 Total cereals includes wheat, coarse grains and rice (paddy).

No. 1 n March 201614
Crop Prospects and Food Situation
cereal output, already reduced in the previous two seasons,
recorded a 4 percent decrease from 2014, and currently is
70 percent lower than the pre-crisis average. The ongoing
socio-political crisis and widespread insecurity severely disrupted
agricultural and marketing activities, and caused the depletion of
already inadequate households’ productive assets. FAO and NGO
partners helped to avert a major food crisis, by providing crop
production support to a total of 170 900 vulnerable households.
In Cameroon, with harvesting of the second season crops
completed in January in the Centre and South, total cereal
production for 2015 is estimated to have decreased to a
below-average level. This decline mainly reflects erratic rains that
adversely affected the 2015 main season’s crop, while in Far North
Region, civil insecurity severely disrupted agricultural activities and
caused a reduction in the planted area. According to an Emergency
Food Security Assessment (EFSA), conducted in June 2015,
60 percent of farmers in the region indicated major land access
constraints on account of civil insecurity. In the DRC, harvesting
of the 2015 main maize crops was completed in November in
the north, while in southern parts it has been recently concluded.
According to remote sensing analysis, average to above-average
rainfall was received in most cropping areas, reflecting generally
favourable vegetation conditions during the main cropping season
that began in June 2015 in northern provinces. However, torrential
rainfall received towards the end of the cropping season in late
2015 and early 2016, resulted in floods and localized crop losses.
In the Congo and Gabon, where the main season harvest
normally starts in December, crops benefited from the timely onset
of seasonal rains in October, except in some coastal areas where
early season dryness may have affected planting operations.
Earlier in the year, the secondary season maize crop, harvested
in June-July, benefited from adequate rainfall throughout the
growing period. However, in both countries, the bulk of the
national cereal requirement is met through imports. Overall, the
2015 cereal output for the subregion is forecast to fall by about
4 percent compared to the previous year.
Inflation rates forecast to increase in 2016 but still low in most countries except in the CAR In the CAR, the inflation rate, which surged to 12 percent in 2014
due to crisis-induced disruptions of economic activities, declined
to 5.7 percent in 2015 and is forecast to decrease further to
4.9 percent in 2016, which is still well above the convergence
rate of 3 percent set by the Communauté économique et
monétaire de l’Afrique centrale. In the DRC, rates of inflation
are forecast to slightly increase from a low level of 1 percent in
2015 to 1.6 percent in 2016, due to a relatively strong economic
growth and a loosening fiscal policy which is expected to boost
domestic demand. Similarly, in the Congo, inflation rates are
forecast to slightly increase from a low level of nearly 1 percent in
2015 to 1.7 percent in 2016, due to a rise in public sector wages.
In Gabon, rates of inflation, which declined from 4.5 percent
in 2014 to 0.6 percent in 2015, driven by lower oil prices and a
reduction in the Government’s spending, are forecast to increase
to 1.6 percent in 2016. In Cameroon, by contrast, the inflation
rate in 2016 is forecast to remain stable at around 2 percent.
Acute food insecurity situation in the CAR, the DRC and parts of Cameroon due to conflict Continued civil insecurity in the CAR and in eastern DRC has
resulted in massive population displacements and hindered
access to food for the affected population. As of January 2016,
about 465 000 refugees from the CAR have sought refuge in
neighbouring Cameroon (267 000), the DRC (108 000), Chad
(63 000) and the Republic of the Congo (27 000) straining the
already limited resources of the hosting communities. The IDP
caseload in the CAR declined in the first semester of 2015 following
a relative improvement of the security situation in some areas of
the country. About 369 000 individuals were internally displaced
as of June 2015, the lowest level since early 2014. However,
the IDP caseload increased again to 452 000 in January 2016
following the resurgence of inter-communal violence in the capital,
Bangui, and in other areas of the country. The recent violence has
worsened an already dire humanitarian situation, impeding the
ability of humanitarian agencies and aid partners to gain access
and assist the thousands of internally-displaced people. Reduced
food availability and access constraints have led to a deterioration
of the food security situation. According to the findings of the
CFSAM, 47 percent of the surveyed groups have indicated that
the food security situation has deteriorated compared to 2014,
and 20 percent has indicated that it has sharply deteriorated.
The Integrated Food Security Phase Classification (IPC)3 analysis,
currently underway, will provide an updated estimate of the
number of people affected by food insecurity.
Similarly, in the DRC, the escalation of the civil conflict since
2013, especially in the eastern provinces, severely damaged local
livelihood systems and caused massive population displacements.
As of December 2015, the IDP caseload was estimated at
1.5 million, with about 41 and 22 percent, respectively, of the
displaced population located in North Kivu and South Kivu.
Moreover, DRC hosts about 20 000 refugees from Burundi,
who fled their homes since mid-April 2015 following the
election-related conflict. Furthermore, the torrential rains
received in the last quarter of 2015 and in January 2016, linked
AFR
ICA
3 The Integrated Food Security Phase Classification (IPC) brings together a set of standardized tools that aims at providing a universal measure to classify the severity and magnitude of food insecurity. For further information please visit: http://www.ipcinfo.org/

No. 1 n March 2016 15
Crop Prospects and Food Situation
AFR
ICA
to the strong El Niño episode, have resulted in floods that
affected about half a million people, including the displacement
of 50 000 individuals and damaged about 9 000 hectares of crop
land. Destruction of food stocks has also been reported. The
most affected areas are Maniema Province in the East, Mongala
(district Equatéur Province) in the northwest, Orientale Province
in the northeast and Katanga Province in the south. According
to the latest available IPC analysis, that covers the period from
September 2015 to March 2016, the number of people in acute
food insecurity and livelihood crisis Phase 3: “Crisis” and Phase 4:
“Emergency” was estimated at about 4.5 million. The areas most
affected by food insecurity are the conflict-affected Maniema,
Katanga and North Kivu provinces, where 18, 16 and 13 percent,
respectively, of the total national food insecure population reside.
In Cameroon, as of early February 2016, the Far North
Region is hosting about 65 000 refugees fleeing civil unrest in
Nigeria, which has spread into the region and has also resulted
in the displacement of 158 000 Cameroonians. The number
of food insecure people was estimated in February 2016 at
2.4 million, more than two times the level of June 2015. The
area most affected by food insecurity is the Far North Region,
where according to an EFSA conducted in September last year,
35 percent of the population is food insecure.
EAST AFRICA
Favourable prospects for 2015 secondary season crop production in southern and coastal Kenya and southern/central SomaliaHarvesting of the 2015 secondary season crops is underway in
most southeastern areas of the subregion, except in Ethiopia
where planting of the “belg” season crops is about to start.
Secondary season cereal production is forecast at above-average
levels in Kenya and Somalia due to abundant precipitation
between October and December (“short-rains” season), largely
attributed to the strong El Niño
phenomenon. In general,
the anticipated floods linked
to El Niño have been less
severe and extended than
expected, having caused only
localized damages to crops and
infrastructure.
In most bi-modal rainfall areas
of Kenya, the “short-rains”
2015 cereal production is
estimated at well above-average
levels, with particularly good
prospects for crops in southeastern and coastal areas where the
ongoing harvest accounts for about 70 percent of the total annual
crop output. Here, despite some localized floods, rains have been
generally favourable, with above-average amounts and a timely
onset that induced farmers to significantly increase the area planted.
Similarly, in Somalia “deyr” cereal production is estimated at well
above-average levels in most southern and central areas following
abundant and well-distributed (October-December) rains. Pockets of
crops with lower yields are expected in parts of Lower Juba, Middle
Juba and Lower Shabelle regions, especially along the coast, that
received below-average rainfall amounts. In most riverine areas
of Middle Shabelle, Juba and Gedo regions, flooding has been
moderate, with only localized damage to standing crops; however,
the flood waters have limited planting opportunities for recession
cultivation of off-season crops, mainly sesame, maize and cowpeas, to
be harvested by March. Abundant “sapie” rains between November
2015 and January 2016 have benefitted root crops, particularly sweet
potato, to be harvested in March in Southern Nations Nationalities
and People Region (SNNPR) in southwestern Ethiopia. In bi-modal
rainfall areas of the United Republic of Tanzania, harvesting of
the “vuli” maize crop was recently completed and the output is
estimated at below-average levels mainly reflecting erratic rainfall
distribution.
The aggregate 2015 cereal output for the subregion is
estimated at about 42.4 million tonnes, almost 19 percent below
last year’s record harvest and 4 percent below the average of the
previous five years. The decline in production is mainly due to
the drought-reduced harvests in the Sudan and Ethiopia.
Land preparation for the 2016 main season cereal crops
has started in major growing areas of Central, Rift Valley and
Western provinces in Kenya (“long-rains” season), in south
and central Somalia (“gu” season), in bi-modal rainfall areas of
South Sudan and southern Uganda. In the United Republic
of Tanzania, planting of the 2016 main “msimu” crops has
been completed in southern and central uni-modal rainfall
areas in January and the green harvest is expected to start in
May, while planting of 2016 “masika” crops has just started
Table 10. East Africa cereal production (million tonnes)
Wheat Coarse grains Total cereals 1
2013 20142015
estim. 2013 20142015
estim. 2013 20142015
estim.Change:
2015/2014 (%)
East Africa 4.9 5.3 4.7 37.2 43.6 34.6 45.0 52.2 42.4 -18.7Ethiopia 4.0 4.2 3.6 18.5 19.2 16.6 22.6 23.6 20.3 -14.1Kenya 0.5 0.3 0.4 3.9 3.4 3.7 4.5 3.9 4.2 9.5Sudan 0.2 0.5 0.5 2.6 7.4 2.9 2.9 7.9 3.4 -56.3Tanzania U.R. 0.1 0.2 0.1 6.5 7.9 6.0 8.8 10.7 8.5 -20.7Uganda 0.0 0.0 0.0 3.3 3.3 3.2 3.5 3.6 3.4 -3.9
Note: Totals and percentage change computed from unrounded data.1 Total cereals includes wheat, coarse grains and rice (paddy).
No. 1 n March 201616
Crop Prospects and Food Situation
in northern bi-modal rainfall areas. First season crops have
already been harvested in Rwanda and Burundi, and average
to above-average harvests are estimated in both countries.
However, large displacement of farmers and lack of inputs have
significantly disrupted seasonal agricultural activities in Burundi’s
conflict-affected areas, adversely impacting on the planted area
and expected yields.
Late atypical abundant rains improved pasture conditions in parts of Kenya, South Sudan, Ethiopia and UgandaLargely affected by the El Niño phenomenon, the 2015 short
rainy season has been very long, with atypical abundant
rains in December 2015 and January 2016 which benefitted
pasture conditions in Rift Valley Province in Kenya (especially
in northwestern Turkana pastoralist areas), in southeastern
agro-pastoral areas of South Sudan, in eastern and southeastern
regions of Ethiopia and in central/northern Uganda (including
drought-affected Karamoja region). Here, trekking distances
have generally decreased, livestock body conditions range from
fair to good and milk production is generally increasing. Good
pasture conditions are also reported in agro-pastoral areas of
Hiraan, Bakool and Middle Shabelle regions in central Somalia.
Conversely, pasture conditions are well below average in parts
of Afar and northern Somali regions in Ethiopia, coastal
areas of Eritrea, Djibouti and northwestern Somalia (Awdal,
Woqooy Galbeed and Sanaag regions) and they are expected
to deteriorate further during the current dry season until the
onset of the next rainy season in March. In Ethiopia, feed
intervention and water rationing are ongoing in some areas
of Afar and northern Somali regions that have been severely
affected by drought in 2015.
Despite recent harvests, prices remained firm in drought-affected areas and reached record levels in South SudanIn contrast to historical trends, cereal prices remained firm in the
Sudan and Ethiopia due to drought-reduced harvests, while in
South Sudan they continued the increasing trend that started
since the beginning 2015 due to the general economic downturn
and the direct and indirect effects of conflict/insecurity. So far, the
impact of the 2015 reduced production on markets in Ethiopia
and the Sudan has been generally mitigated by large carryover
stocks from the bumper 2014 harvests, but significant price
increases are likely to occur in the coming months.
In South Sudan, despite the recent harvest, sorghum prices
in December/January were at record levels, three to five times
above their levels of the corresponding period of the previous
year. Market activities have slightly improved in recent months in
some conflict-affected areas of Greater Upper Nile Region, but
food supplies remain well below the pre-crisis levels and food
prices remain exceptionally high and volatile, largely influenced
by the distribution of food aid. In addition, the Central Bank’s
move from a fixed to a floating exchange rate regime, which
led to a devaluation of the local currency by about 84 percent,
exacerbated the rising price trends.
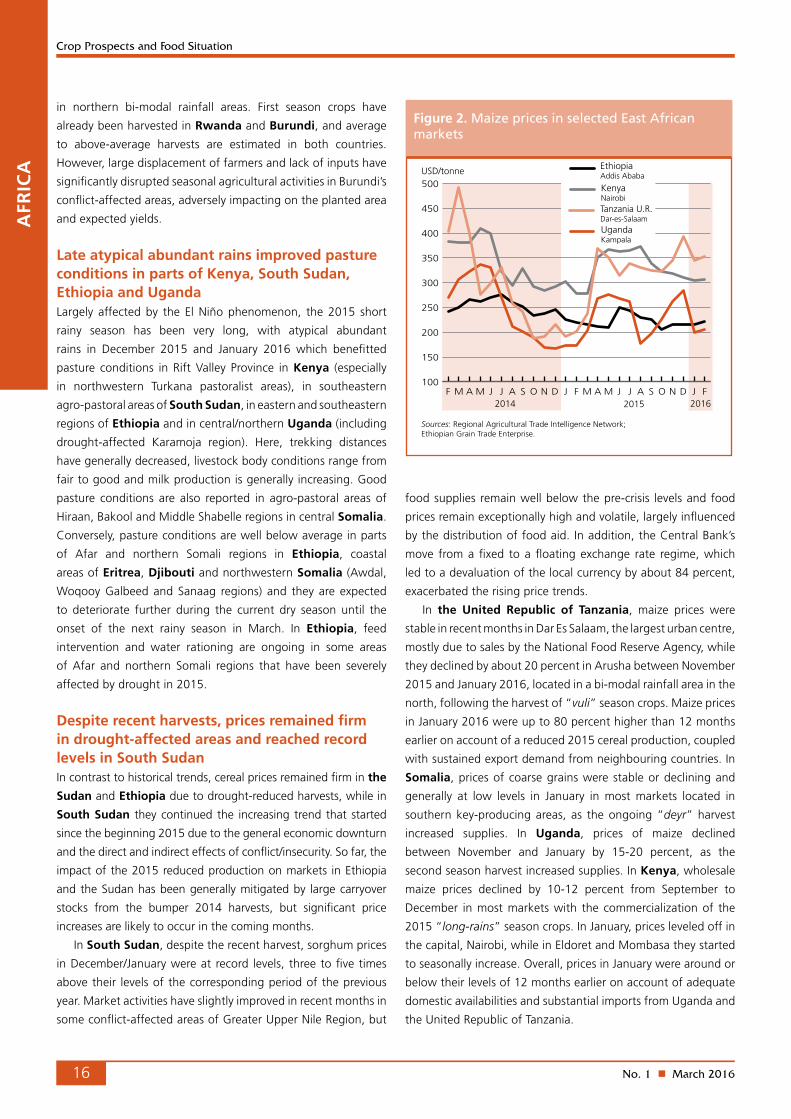
In the United Republic of Tanzania, maize prices were
stable in recent months in Dar Es Salaam, the largest urban centre,
mostly due to sales by the National Food Reserve Agency, while
they declined by about 20 percent in Arusha between November
2015 and January 2016, located in a bi-modal rainfall area in the
north, following the harvest of “vuli” season crops. Maize prices
in January 2016 were up to 80 percent higher than 12 months
earlier on account of a reduced 2015 cereal production, coupled
with sustained export demand from neighbouring countries. In
Somalia, prices of coarse grains were stable or declining and
generally at low levels in January in most markets located in
southern key-producing areas, as the ongoing “deyr” harvest
increased supplies. In Uganda, prices of maize declined
between November and January by 15-20 percent, as the
second season harvest increased supplies. In Kenya, wholesale
maize prices declined by 10-12 percent from September to
December in most markets with the commercialization of the
2015 “long-rains” season crops. In January, prices leveled off in
the capital, Nairobi, while in Eldoret and Mombasa they started
to seasonally increase. Overall, prices in January were around or
below their levels of 12 months earlier on account of adequate
domestic availabilities and substantial imports from Uganda and
the United Republic of Tanzania.
AFR
ICA
100
150
200
250
300
350
400
450
500
FJDNOSAJJMAMFJDNOSAJJMAMF20152014 2016
USD/tonne
Tanzania U.R. Dar-es-Salaam
Kenya Nairobi
Figure 2. Maize prices in selected East African markets
Uganda Kampala
Sources: Regional Agricultural Trade Intelligence Network;Ethiopian Grain Trade Enterprise.
Ethiopia Addis Ababa

No. 1 n March 2016 17
Crop Prospects and Food Situation
AFR
ICA
Significant humanitarian needs persist in areas affected by conflict and droughtDespite the ending of the lean season in most crop-producing
areas of the subregion with the bulk of the 2015 main or second
season crops available for consumption, severe food insecurity
conditions persist in areas affected by drought in Ethiopia as
well as by conflict and civil unrest in parts of South Sudan, the
Sudan, Somalia and Burundi.
Food security conditions have further deteriorated in
Ethiopia’s pastoral and agro-pastoral communities in southern
Afar, northern Somali, eastern Amhara and eastern Oromia
regions. In these areas, stocks from the 2015 drought-affected
“meher” crop production are already drawn down at household
level, pushing up market prices. Herds in several parts of Afar
and Somali regions have been decimated by pasture and
water scarcity in 2015 and livestock body conditions are very
poor with extremely low milk production. As the situation
is not expected to improve before April/May with the start
of the “diraac/sugum” rains, governmental agencies and
humanitarian partners are providing food assistance to affected
households as well as feed for livestock (hay/straw, molasses
and concentrates).
In South Sudan, according to latest IPC analysis, the current
number of severely food insecure people is estimated at about
2.8 million, about 400 000 people more than estimated in
December 2015 despite the availability of newly-harvested
crops. Although most food insecure people are still concentrated
in conflict-affected areas of the Greater Upper Nile Region,
food security conditions have also worsened in Northern Bahr
el Ghazal, Warrap and Eastern Equatoria states due to trade
disruptions and high market prices. Overall, food security
is expected to continue to worsen as a consequence of the
general economic downturn, reflecting households’ declining
purchasing power, as a result of limited income sources and
rising prices attributed to the sharp devaluation of the national
currency and high transport costs.
In Somalia, food insecurity conditions are particularly severe
among IDPs, but also in drought-affected northern agro pastoral
communities of Awdal, Woqooy Galbeed and Sanaag regions
on account of below-average 2015 “karan” harvests and a
depletion of stocks, two-three months earlier than usual. In
the Sudan, food insecurity remains of great concern among
IDPs in the conflict-affected states of Darfur, South Kordofan
and Blue Nile as well as in most pastoral areas where declining
terms of trade have limited access to food for most households.
In Burundi, food security conditions remained stressed in the
provinces most affected by the ongoing civil unrest, including
parts of Kirundo, Muyinga and Makamba as well as in farming
areas around the capital, Bujumbura, due to reduced exchanges
of agricultural products and lower demand for labour in urban
areas. As a consequence of the civil tension and violence, over
260 000 people have fled their homes, of which 90 percent have
travelled to neighbouring countries.
The estimated number of people in need of humanitarian
assistance in the subregion has increased by about 75 percent
during the last 12 months, from 11 million to 19.5 million,
including 10.2 million in Ethiopia, 3.9 million in the Sudan,
2.8 million in South Sudan, 1.1 million in Kenya, 953 000 in
Somalia, 320 000 in Uganda and 230 000 in Djibouti.
SOUTHERN AFRICA
Sharply reduced 2016 cereal production prospectsProduction prospects for the 2016 cereal crops are acutely
unfavourable, reflecting the El Niño-associated weather patterns
that curbed seasonal rains and caused hotter-than-normal
temperatures during the 2015/16 cropping season (generally
October/June). These poor conditions resulted in delayed and
reduced plantings, as well as retarded crop development and
Table 11. Southern Africa cereal production (million tonnes)
Wheat Coarse grains Rice (paddy) Total cereals
2013 20142015
estim. 2013 20142015
estim. 2013 20142015
estim. 2013 20142015
estim.Change:
2015/2014 (%)
Southern Africa 2.2 2.0 1.9 23.9 29.5 21.8 4.2 4.6 4.3 30.3 36.1 27.9 -22.6 - excl. South Africa 0.4 0.3 0.4 10.9 13.9 10.6 4.2 4.6 4.3 15.4 18.8 15.2 -18.9Madagascar 0.0 0.0 0.0 0.4 0.4 0.4 3.6 4.0 3.7 4.0 4.3 4.1 -6.2Malawi 0.0 0.0 0.0 3.8 4.1 2.9 0.1 0.1 0.1 3.9 4.2 3.0 -29.4Mozambique 0.0 0.0 0.0 1.8 2.2 2.0 0.3 0.4 0.4 2.2 2.6 2.4 -5.4South Africa 1.9 1.8 1.5 13.0 15.6 11.2 0.0 0.0 0.0 14.9 17.3 12.7 -26.7Zambia 0.3 0.2 0.3 2.6 3.4 2.7 0.0 0.0 0.0 2.9 3.7 3.1 -16.6Zimbabwe 0.0 0.0 0.0 1.0 1.7 0.8 0.0 0.0 0.0 1.0 1.8 0.9 -50.4
Note: Totals and percentage change computed from unrounded data.
No. 1 n March 201618
Crop Prospects and Food Situation
pasture re-growth. Although heavier rains in mid-January
2016 partly alleviated the seasonal dryness, crop conditions
still remained poor with most cropped areas exhibiting
below-normal vegetation conditions as of mid-February,
implying crop wilting and a high likelihood of diminished yields.
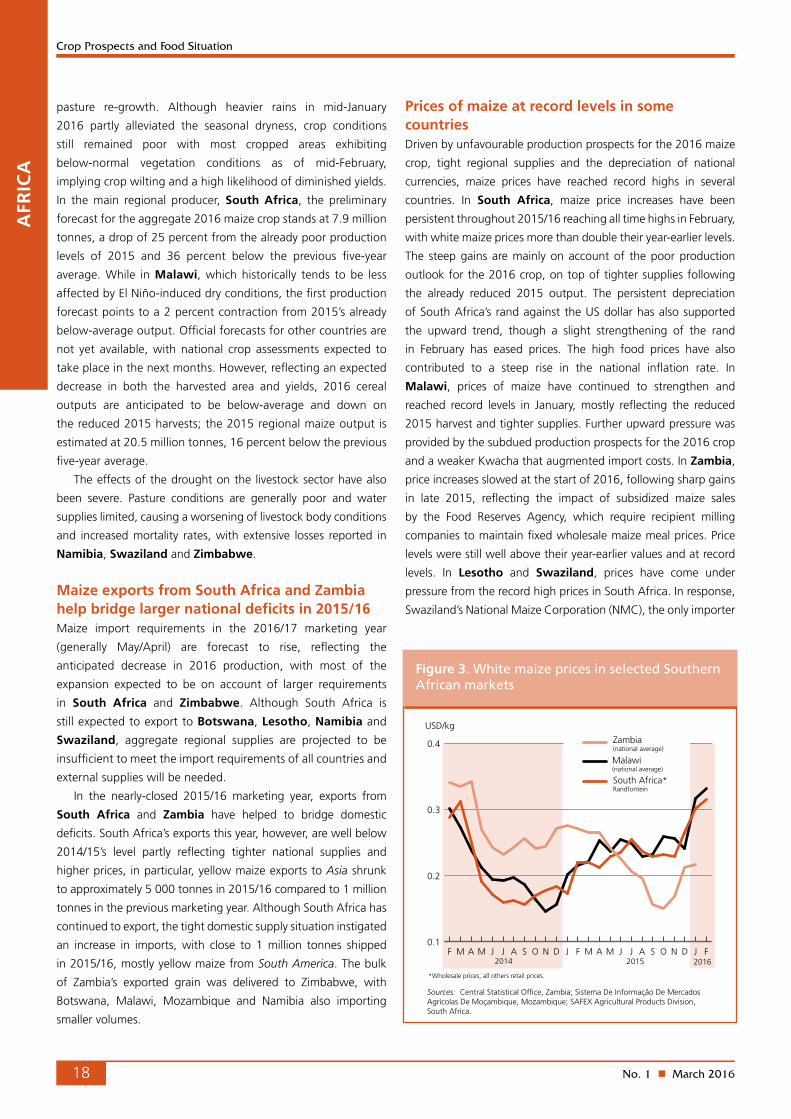
In the main regional producer, South Africa, the preliminary
forecast for the aggregate 2016 maize crop stands at 7.9 million
tonnes, a drop of 25 percent from the already poor production
levels of 2015 and 36 percent below the previous five-year
average. While in Malawi, which historically tends to be less
affected by El Niño-induced dry conditions, the first production
forecast points to a 2 percent contraction from 2015’s already
below-average output. Official forecasts for other countries are
not yet available, with national crop assessments expected to
take place in the next months. However, reflecting an expected
decrease in both the harvested area and yields, 2016 cereal
outputs are anticipated to be below-average and down on
the reduced 2015 harvests; the 2015 regional maize output is
estimated at 20.5 million tonnes, 16 percent below the previous
five-year average.
The effects of the drought on the livestock sector have also
been severe. Pasture conditions are generally poor and water
supplies limited, causing a worsening of livestock body conditions
and increased mortality rates, with extensive losses reported in
Namibia, Swaziland and Zimbabwe.
Maize exports from South Africa and Zambia help bridge larger national deficits in 2015/16Maize import requirements in the 2016/17 marketing year
(generally May/April) are forecast to rise, reflecting the
anticipated decrease in 2016 production, with most of the
expansion expected to be on account of larger requirements
in South Africa and Zimbabwe. Although South Africa is
still expected to export to Botswana, Lesotho, Namibia and
Swaziland, aggregate regional supplies are projected to be
insufficient to meet the import requirements of all countries and
external supplies will be needed.
In the nearly-closed 2015/16 marketing year, exports from
South Africa and Zambia have helped to bridge domestic
deficits. South Africa’s exports this year, however, are well below
2014/15’s level partly reflecting tighter national supplies and
higher prices, in particular, yellow maize exports to Asia shrunk
to approximately 5 000 tonnes in 2015/16 compared to 1 million
tonnes in the previous marketing year. Although South Africa has
continued to export, the tight domestic supply situation instigated
an increase in imports, with close to 1 million tonnes shipped
in 2015/16, mostly yellow maize from South America. The bulk
of Zambia’s exported grain was delivered to Zimbabwe, with
Botswana, Malawi, Mozambique and Namibia also importing
smaller volumes.
AFR
ICA
Prices of maize at record levels in some countriesDriven by unfavourable production prospects for the 2016 maize
crop, tight regional supplies and the depreciation of national
currencies, maize prices have reached record highs in several
countries. In South Africa, maize price increases have been
persistent throughout 2015/16 reaching all time highs in February,
with white maize prices more than double their year-earlier levels.
The steep gains are mainly on account of the poor production
outlook for the 2016 crop, on top of tighter supplies following
the already reduced 2015 output. The persistent depreciation
of South Africa’s rand against the US dollar has also supported
the upward trend, though a slight strengthening of the rand
in February has eased prices. The high food prices have also
contributed to a steep rise in the national inflation rate. In
Malawi, prices of maize have continued to strengthen and
reached record levels in January, mostly reflecting the reduced
2015 harvest and tighter supplies. Further upward pressure was
provided by the subdued production prospects for the 2016 crop
and a weaker Kwacha that augmented import costs. In Zambia,
price increases slowed at the start of 2016, following sharp gains
in late 2015, reflecting the impact of subsidized maize sales
by the Food Reserves Agency, which require recipient milling
companies to maintain fixed wholesale maize meal prices. Price
levels were still well above their year-earlier values and at record
levels. In Lesotho and Swaziland, prices have come under
pressure from the record high prices in South Africa. In response,
Swaziland’s National Maize Corporation (NMC), the only importer
0.1
0.2
0.3
0.4
FJDNOSAJJMAMFJDNOSAJJMAMF20152014 2016
Figure 3. White maize prices in selected Southern African markets
USD/kg
Malawi(national average)
Zambia (national average)
South Africa* Randfontein
Sources: Central Statistical Office, Zambia; Sistema De Informação De Mercados Agrícolas De Moçambique, Mozambique; SAFEX Agricultural Products Division, South Africa.
*Wholesale prices, all others retail prices.

No. 1 n March 2016 19
Crop Prospects and Food Situation
AFR
ICA
of white maize in the country, increased the local selling price of
maize grain by 66 percent in January. By contrast, maize prices
in Zimbabwe have been relatively stable and were at levels
below those of a year earlier as of December, partly reflecting the
strength of the US dollar, the country’s main currency that has put
downward pressure on food import costs.
Acute food security conditions projected in 2016/17 The El Niño-induced drought instigated Lesotho, Namibia,
Swaziland and Zimbabwe to declare national emergencies,
while five out of the nine provinces of South Africa have been
declared drought disaster areas. At the regional level, FAO
and WFP are supporting the Southern African Development
Community (SADC) to develop a coordinated response to
minimize the impact and strengthen the resilience of the affected
population.
Prior to the current crisis, an estimated 7.5 million people4
were categorized as food insecure in 2015/16, mainly reflecting
the drought-curbed production of 2015. However, as a result
of the rapid deterioration of food security conditions, several
countries updated their current food insecure numbers for
2015/16. Zimbabwe’s revised number stands at 2.8 million
(for the January-March 2016 period), up from a projected
figure of 1.5 million based on the 2015 assessment. Lesotho
has also raised the number of food insecure by 15 percent to
534 502 persons, valid until June 2016, while in Swaziland the
food insecure population is put at 300 000, up from an earlier
estimate of about 200 000.
These numbers are likely to increase significantly in 2016/17,
driven by the expected below-average 2016 harvests, poor
livestock conditions and high cereal prices. The situation is
further compounded by the likely deterioration in households’
agricultural productive capacity due to consecutive reduced
harvests, while the overall sluggish economic growth further
strains the situation. Detailed information on the number of
food insecure will be available following the completion of
the national Vulnerability Assessments Committee’s (VAC)
evaluations, expected to take place in April/May. It is critical that
support be provided for immediate food assistance and recovery
interventions that contribute to building the resilience of the
affected households.
4 This figure excludes numbers from South Africa, which are not directly comparable, and DRC, which is not grouped with Southern Africa in this publication (please see Central Africa).
0.1
0.2
0.3
0.4
FJDNOSAJJMAMFJDNOSAJJMAMF20152014 2016
Figure 3. White maize prices in selected Southern African markets
USD/kg
Malawi(national average)
Zambia (national average)
South Africa* Randfontein
Sources: Central Statistical Office, Zambia; Sistema De Informação De Mercados Agrícolas De Moçambique, Mozambique; SAFEX Agricultural Products Division, South Africa.
*Wholesale prices, all others retail prices.

No. 1 n March 201620
Crop Prospects and Food Situation
FAR EASTFavourable prospects for the 2016 wheat crop The susbregion’s 2016 winter wheat crop is
well advanced, with harvesting due to start
from April onwards. In India, the official
Second Advance Estimate puts the 2016
wheat production at 93.8 million tonnes,
8 percent above last year’s reduced level.
This forecast assumes yields return closer to
average after 2015’s low levels, offsetting a
4 percent reduction in plantings on account of
reduced water supplies, following a poor 2015
monsoon and below-average rains since the
start of the season in October. In China, given
that the planted area remained similar to the
2015 level and assuming favourable conditions
from March when most winter wheat will
break dormancy, the 2016 wheat production
is forecast by FAO to remain close to the 2015 record level. In
Pakistan, the 2016 wheat production is forecast at 26 million
tonnes, slightly above the bumper level of the previous year,
reflecting an anticipated increase in yields: crops have benefited
from ample irrigation supplies, generally good weather conditions
and increased application of fertilizer has also been reported.
Cereal production marginally down in 2015, largely reflecting reduced output in IndiaHarvesting of the 2015 main season paddy and coarse grains
was completed by December in most countries of the subregion,
while that of the 2015 secondary season is expected to start
in March-April. FAO’s latest forecast for the 2015 aggregate
cereal production has been lowered by 1.4 million tonnes since
December, to 1 238 million tonnes, down marginally from
the record in 2014. The decrease reflects reduced outputs in
several countries throughout the subregion, in particular India,
which endured a number of adverse climatic events during
the cropping season, that offset a significant increase in China
and some smaller production gains in several other countries.
Unseasonable dryness during the main season associated
with the El Niño weather anomaly resulted in reduced cereal
Note: Comments refer to situation as of March.
Southeastern Asia: • rice (second): growing/harvesting•maize:(second)growing
Near East:• winter grains: dormant to vegetative
China: • winter wheat: growing
South Asia:• wheat and coarse grains: vegetative to reproductive
India:• maize (Rabi): growing•wheat(Rabi):growing•barley(Rabi):growing•sorghum(Rabi):growing•rice(Rabi):growing
Asia (CIS):• winter grains: growing
ASI
A
Table 12. Far East cereal production (million tonnes)
Wheat Coarse grains Rice (paddy) Total cereals
2013 20142015
estim. 2013 20142015
estim. 2013 20142015
estim. 2013 20142015
estim.Change:
2015/2014 (%)
Far East 244.3 252.9 247.0 324.9 322.6 326.6 670.4 668.3 664.0 1 239.5 1 243.9 1 237.6 -0.5Bangladesh 1.3 1.3 1.4 2.6 2.6 2.6 51.2 51.8 52.3 55.0 55.7 56.3 1.0Cambodia 0.0 0.0 0.0 0.9 0.5 0.5 9.4 9.3 9.2 10.3 9.9 9.7 -1.7China 121.9 126.2 130.2 228.0 225.2 234.5 205.2 208.2 209.8 555.1 559.7 574.5 2.6India 93.5 95.9 86.5 43.2 43.1 38.3 160.0 158.2 155.4 296.7 297.1 280.2 -5.7Indonesia 0.0 0.0 0.0 18.5 19.0 19.6 71.3 70.8 73.0 89.8 89.9 92.6 3.0Japan 0.8 0.9 1.0 0.2 0.2 0.2 10.9 10.8 10.2 11.9 11.8 11.4 -3.6Korea Rep. of 0.0 0.0 0.0 0.2 0.2 0.2 5.6 5.6 5.8 5.8 5.9 6.0 1.9Myanmar 0.2 0.2 0.2 1.6 1.6 1.5 28.3 28.9 28.4 30.1 30.8 30.1 -2.2Nepal 1.9 2.0 1.9 2.6 2.6 2.5 5.0 4.8 4.3 9.6 9.4 8.7 -7.6Pakistan 24.2 26.0 25.5 5.6 5.2 5.2 10.2 10.5 9.9 40.0 41.7 40.6 -2.6Philippines 0.0 0.0 0.0 7.3 7.8 7.6 18.8 18.9 18.0 26.2 26.7 25.6 -4.1Thailand 0.0 0.0 0.0 5.0 4.9 4.8 36.8 33.2 29.3 41.8 38.1 34.1 -10.6Viet Nam 0.0 0.0 0.0 5.2 5.2 5.3 44.0 45.0 45.2 49.2 50.2 50.5 0.7
Note: Totals and percentage change computed from unrounded data.

No. 1 n March 2016 21
Crop Prospects and Food Situation
harvest in Cambodia, the Democratic
People’s Republic of Korea (DPRK),
Lao People’s Democratic Republic,
Mongolia, Nepal, the Philippines,
Timor-Leste and Thailand. By
contrast, 2015 cereal production
in China reached a record level of
574.5 million tonnes, up 14.8 million
tonnes from 2014’s level, driven by an
expansion in plantings, reflecting strong
Government production incentives and
record yields on account of beneficial
weather conditions. Favourable
weather conditions also boosted crops
in Bangladesh, Bhutan, Republic of
Korea, Malaysia and Sri Lanka.
The 2015 paddy production is estimated at 664 million
tonnes, slightly below last year’s reduced level. Smaller harvests
are estimated for several countries, but the largest reductions
concern India and Thailand, where rainfall deficits and low
water availabilities for irrigation reduced the 2015 main crop
and undermined prospects for ongoing 2015 offseason
harvests. Unseasonably dry conditions similarly impaired rice
production in the DPRK, Lao People’s Democratic Republic,
the Philippines and Nepal, whereas in Japan and Pakistan,
smaller crops are linked to reduced plantings in response to
large stocks and poor price prospects. According to the findings
of a joint FAO/WFP Crop and Food Security Assessment Mission
(CFSAM) conducted in Myanmar last November-December,
the aggregate 2015 rice production is forecast to decrease by
3 percent from the previous year’s output, following the floods
in July and August. Elsewhere in the subregion, favourable
weather boosted rice production, particularly in China, Viet
Nam, Bangladesh and Republic of Korea, and resulted in a
strong production recovery in Sri Lanka, following last year’s
reduced harvest.
The subregion’s 2015 aggregate maize production is
estimated at a record 297.3 million tonnes, 2 percent up from
the previous year’s high, mainly reflecting a larger output in
China, which more than offset a 3-million tonne reduction
in India.
With most official estimates now available, FAO has
revised down its estimate of the subregion’s 2015 wheat
production to 247 million tonnes. The latest revision mainly
takes account of the final official estimate released by India,
which indicates a larger reduction than what was anticipated
earlier. At 86.5 million tonnes, the output is 10 percent down
on the 2014 harvest, as a result of severe crop losses caused
by heavy rains, coupled with strong winds and localized hail
in March 2015.
Cereal trade in the 2015/16 marketing year to decline from previous year’s record Aggregate cereal imports in the 2015/16 marketing year are
forecast at 123.2 million tonnes, slightly below the 2014/15
record level but still well above the average of the past five
years. The small contraction this year mainly stems from reduced
demand for maize and sorghum from China, whose total cereal
imports are currently foreseen to fall by 6 percent to 29 million
tonnes compared with the exceptionally high level of the previous
year, mostly as a result of record 2015 harvests and large stocks.
Aggregate rice imports in the 2016 calendar year are forecast
at 15.2 million tonnes, 3 percent below the 2015 record level.
This decrease rests on anticipated lower imports by Bangladesh,
China and Sri Lanka, which are expected to more than offset
increased deliveries elsewhere, especially to Indonesia, Nepal
and the Philippines.
Aggregate cereal exports in 2015/16 are projected to
contract by 10 percent compared to the previous year’s record
level and reach 41.8 million tonnes. The bulk of the decrease
is expected from India, whose shipments (mostly wheat) would
be 24 percent lower than in 2014/15, as a result of the reduced
2015 production and rising domestic demand under the ongoing
National Food Security Act. Rice exports are forecast to increase
marginally compared with last year, reflecting larger deliveries
from Thailand, Pakistan and Viet Nam, which are expected to
more than compensate for lower exports from India, the world’s
leading rice exporter.
Domestic rice prices followed mixed trends, while those of wheat changed littleIn the exporting countries of the subregion, domestic prices
of rice, in local currency terms, followed mixed trends during
recent months. In Viet Nam, rice prices started to decline from
the beginning of 2016, reflecting limited export demand and
ASIA
Table 13. Far East cereal production and anticipated trade in 2015/16 1 (thousand tonnes)
Avg 5-yrs (2010/11 to
2014/15) 2014/15 2015/16
2015/16 over 2014/15
(%)
2015/16 over 5-yr avg
(%)
Cereals - Exports 43 521 46 361 41 838 -9.8 -3.9Cereals - Imports 101 377 125 007 123 210 -1.4 21.5Cereals - Production 981 365 1 019 333 1 014 478 -0.5 3.4
Rice-millled - Exports 33 533 37 212 37 616 1.1 12.2Rice-millled - Imports 13 007 15 686 15 212 -3.0 17.0Rice-millled - Production 436 546 443 793 440 906 -0.7 1.0
Wheat - Exports 5 365 5 036 2 785 -44.7 -48.1Wheat - Imports 37 288 40 071 40 890 2.0 9.7Wheat - Production 239 502 252 942 246 980 -2.4 3.1
1 Marketing year July/June for most countries. Rice trade �gures are for the second year shown.

No. 1 n March 201622
Crop Prospects and Food Situation
the release of stocks ahead of the 2016 main season (winter/
spring) harvest. In Thailand, a reduced 2015 main season
crop harvest, completed by December 2015, and prospects
of a smaller 2015 secondary crop underpinned prices with
tighter availabilities also supporting quotations in Myanmar.
In India, rice prices were stable despite reduced supplies from
the 2015 main season crop and large ongoing Government
procurement purchases. Amid ample domestic availabilities
from record 2015 harvests, domestic prices in Bangladesh and
Sri Lanka decreased in February 2016 and were well below
their year-earlier levels. As for wheat and wheat flour, prices
changed little in most countries of the subregion. They were
stable in India, owing to continued large sales of Government
supplies through the Open Market Sale Scheme (OMSS), and
in Pakistan, while they rose in China. In Bangladesh, wheat
flour prices have decreased since November pressured by ample
supplies of imported wheat and large Open Market Sales (OMS)
by the Government.
ASI
A
20152014
0.2
0.3
0.4
0.5
0.6
0.7
0.8
0.9
1.0
FJDNOSAJJMAMFJDNOSAJJMAMF2016
USD/kg
Figure 4. Rice retail prices in selected Far Eastcountries
Sri Lanka (white rice) Colombo
Sources: Department of Census and Statistics, Sri Lanka; Ministry of Consumer Affairs, India; Bureau of Agriculture Statistics, Philippines; Agroinfo, Viet Nam.
Philippines (RMR) national average
Viet Nam (wholesale, 25% broken milled) Dong Thap
India Delhi
20152014
0.2
0.3
0.4
0.5
0.6
0.7
0.8
FJDNOSAJJMAMFJDNOSAJJMAMF2016
USD/kg
Figure 5. Wheat and wheat flour retail prices in selected Far East countries
Sources: Pakistan Bureau of Statistics; Ministry of Consumer Affairs, India; Management Information System and Monitoring, Bangladesh; National Bureau of Statistics of China.
India (wheat)Mumbai
Pakistan (wheat)Lahore
BangladeshDhaka (w.flour)
China (wheat flour)Average of main 50 cities

No. 1 n March 2016 23
Crop Prospects and Food Situation
ASIA
NEAR EAST
Favourable outlook for 2016 winter crops in major producersWheat and barley crops, for harvest from June, remain in
their final stages of dormancy. After some heavy rainfall and
localized flooding that hampered planting operations, climatic
conditions across the subregion have been generally favourable,
although early-seasonal dryness occurred in some parts of the
Syrian Arab Republic. In the main producing countries of
the subregion, should normal weather conditions prevail for
the remainder of the season, preliminary forecasts of wheat
production in the Islamic Republic of Iran and Turkey are
estimated at above-average levels of 11.5 and 21.5 million
tonnes, respectively, despite localized pockets of dryness in
Turkey. As before, the ongoing conflict and lack of inputs are
continuously hampering agricultural activities in the Syrian
Arab Republic, Yemen and Iraq.
Above-average 2015 winter cereal crop harvested despite ongoing conflict in partsThe aggregate subregional 2015 cereal output (including rice
in paddy terms) is estimated at 72.3 million tonnes, an increase
of about 10 percent and 6 percent, respectively, on last year
and on the five-year average owing to timely and abundant
rains. In Turkey, the biggest subregional producer, official
estimates indicate an 18 percent increase in cereal production
in 2015 compared to the 2014 drought-affected crop, to
about 38.6 million tonnes, including 22.6 million tonnes of
wheat (19 percent increase on 2014) and 15 million tonnes
of coarse grains (16 percent improvement). In the Islamic
Republic of Iran, the 2015 harvest slightly exceeded those of
the previous year, while in Afghanistan limited snow cover
in northern and eastern parts of the country increased the
danger of freeze-kill and threatened irrigation water availability
causing production to decline by some 12.6 percent compared
to 2014. The continued conflict in the Syrian Arab Republic,
Iraq and Yemen resulted in significant damage to agricultural
machinery, irrigation systems and storage facilities together
with disruptions in electricity supplies and lack of inputs
(such as improved seeds, fertilizers and fuel) which, in turn,
seriously hampered agricultural production. The above-average
aggregate cereal production resulted in a lowering of the
forecasted cereal import requirement to about 60.4 million
tonnes, over 10 percent down on 2014 and 6 percent above
the five-year average.
Civil unrest affects food security of large numbers of people In the Syrian Arab Republic, approximately 13.5 million
people continue to be in need of urgent humanitarian
assistance within the country, including more than 6.5 million
people who are internally displaced. As of mid-February 2016,
over 4.7 million Syrian refugees were registered in the region
covering Egypt, Iraq, Jordan, Lebanon and Turkey. In addition,
a large share of the population lives abroad without seeking
refugee registration. In Yemen, around 21.2 million people,
82 percent of the population, require some kind of humanitarian
assistance to meet their basic needs or protect their fundamental
rights. An estimated 14.4 million are food insecure (including
7.6 million severely food insecure), 19.3 million lack adequate
access to clean water or sanitation and nearly 320 000 children
have severe acute malnutrition. With the rapid escalation of the
conflict and insecurity, the disruption of markets, employment
opportunities and rural livelihoods, the food security situation
continues to deteriorate significantly. Humanitarian assistance
has been seriously constrained by the lack of access and
shortages of fuel, as well as the challenging security situation.
In Iraq, as of December 2015, there were at least 4 million
people internally displaced, of whom nearly 2 million have been
displaced since January 2014.
20152014
0.2
0.3
0.4
0.5
0.6
0.7
0.8
FJDNOSAJJMAMFJDNOSAJJMAMF2016
USD/kg
Figure 5. Wheat and wheat flour retail prices in selected Far East countries
Sources: Pakistan Bureau of Statistics; Ministry of Consumer Affairs, India; Management Information System and Monitoring, Bangladesh; National Bureau of Statistics of China.
India (wheat)Mumbai
Pakistan (wheat)Lahore
BangladeshDhaka (w.flour)
China (wheat flour)Average of main 50 cities
Table 14. Near East cereal production (million tonnes)
Wheat Coarse grains Rice (paddy) Total cereals
2013 20142015
estim. 2013 20142015
estim. 2013 20142015
estim. 2013 20142015
estim.Change:
2015/2014 (%)
Near East 43.3 41.3 44.9 23.3 20.3 22.9 4.6 4.3 4.5 71.2 65.9 72.3 9.7Afghanistan 5.2 5.4 4.7 0.7 0.7 0.7 0.8 0.8 0.6 6.7 6.9 6.0 -12.6Iran (Islamic Rep. of ) 9.3 10.6 11.5 4.7 3.7 3.9 2.5 2.3 2.7 16.4 16.6 18.1 9.0Iraq 3.3 3.5 3.2 1.2 1.2 1.1 0.5 0.4 0.3 5.0 5.1 4.6 -10.1Syrian Arab Republic 2.4 1.9 2.4 1.1 0.8 1.1 0.0 0.0 0.0 3.5 2.6 3.6 35.5Turkey 22.1 19.0 22.6 14.5 12.9 15.1 0.9 0.8 0.9 37.5 32.8 38.6 17.8
Note: Totals and percentage change computed from unrounded data.
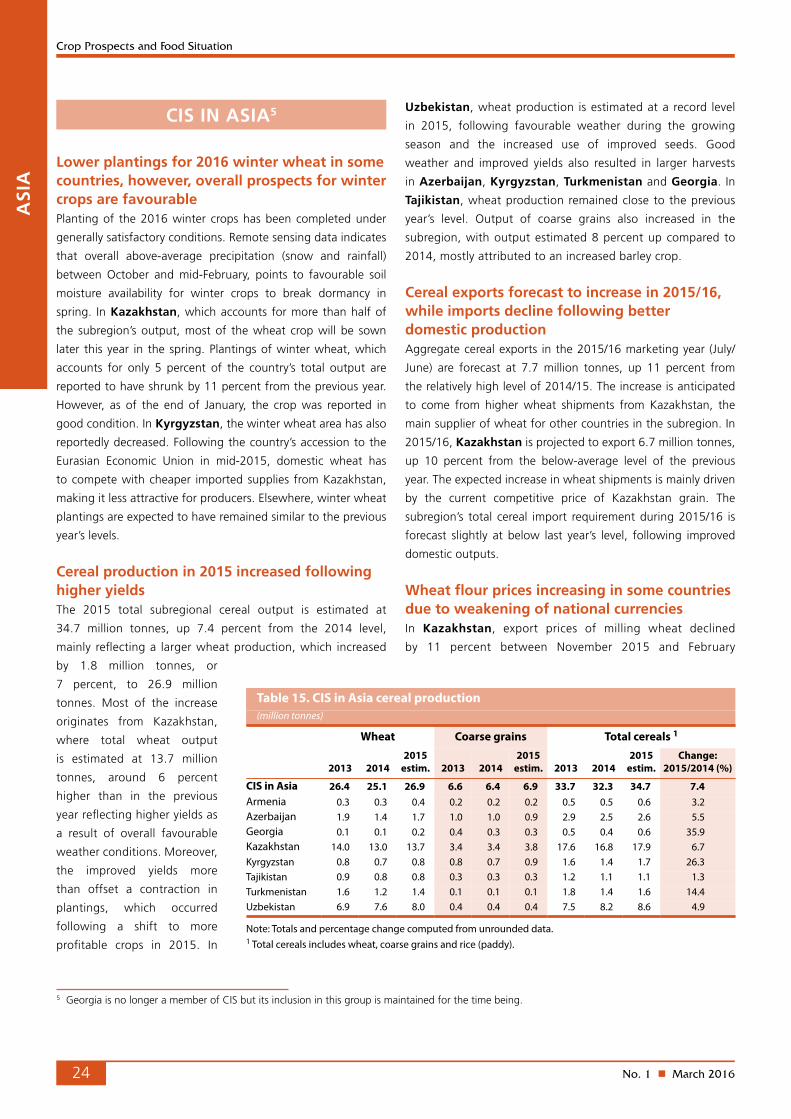
No. 1 n March 201624
Crop Prospects and Food Situation
CIS IN ASIA5
Lower plantings for 2016 winter wheat in some countries, however, overall prospects for winter crops are favourablePlanting of the 2016 winter crops has been completed under
generally satisfactory conditions. Remote sensing data indicates
that overall above-average precipitation (snow and rainfall)
between October and mid-February, points to favourable soil
moisture availability for winter crops to break dormancy in
spring. In Kazakhstan, which accounts for more than half of
the subregion’s output, most of the wheat crop will be sown
later this year in the spring. Plantings of winter wheat, which
accounts for only 5 percent of the country’s total output are
reported to have shrunk by 11 percent from the previous year.
However, as of the end of January, the crop was reported in
good condition. In Kyrgyzstan, the winter wheat area has also
reportedly decreased. Following the country’s accession to the
Eurasian Economic Union in mid-2015, domestic wheat has
to compete with cheaper imported supplies from Kazakhstan,
making it less attractive for producers. Elsewhere, winter wheat
plantings are expected to have remained similar to the previous
year’s levels.
Cereal production in 2015 increased following higher yieldsThe 2015 total subregional cereal output is estimated at
34.7 million tonnes, up 7.4 percent from the 2014 level,
mainly reflecting a larger wheat production, which increased
by 1.8 million tonnes, or
7 percent, to 26.9 million
tonnes. Most of the increase
originates from Kazakhstan,
where total wheat output
is estimated at 13.7 million
tonnes, around 6 percent
higher than in the previous
year reflecting higher yields as
a result of overall favourable
weather conditions. Moreover,
the improved yields more
than offset a contraction in
plantings, which occurred
following a shift to more
profitable crops in 2015. In
Uzbekistan, wheat production is estimated at a record level
in 2015, following favourable weather during the growing
season and the increased use of improved seeds. Good
weather and improved yields also resulted in larger harvests
in Azerbaijan, Kyrgyzstan, Turkmenistan and Georgia. In
Tajikistan, wheat production remained close to the previous
year’s level. Output of coarse grains also increased in the
subregion, with output estimated 8 percent up compared to
2014, mostly attributed to an increased barley crop.
Cereal exports forecast to increase in 2015/16, while imports decline following better domestic production Aggregate cereal exports in the 2015/16 marketing year (July/
June) are forecast at 7.7 million tonnes, up 11 percent from
the relatively high level of 2014/15. The increase is anticipated
to come from higher wheat shipments from Kazakhstan, the
main supplier of wheat for other countries in the subregion. In
2015/16, Kazakhstan is projected to export 6.7 million tonnes,
up 10 percent from the below-average level of the previous
year. The expected increase in wheat shipments is mainly driven
by the current competitive price of Kazakhstan grain. The
subregion’s total cereal import requirement during 2015/16 is
forecast slightly at below last year’s level, following improved
domestic outputs.
Wheat flour prices increasing in some countries due to weakening of national currenciesIn Kazakhstan, export prices of milling wheat declined
by 11 percent between November 2015 and February
ASI
A
5 Georgia is no longer a member of CIS but its inclusion in this group is maintained for the time being.
Table 15. CIS in Asia cereal production (million tonnes)
Wheat Coarse grains Total cereals 1
2013 20142015
estim. 2013 20142015
estim. 2013 20142015
estim.Change:
2015/2014 (%)
CIS in Asia 26.4 25.1 26.9 6.6 6.4 6.9 33.7 32.3 34.7 7.4Armenia 0.3 0.3 0.4 0.2 0.2 0.2 0.5 0.5 0.6 3.2Azerbaijan 1.9 1.4 1.7 1.0 1.0 0.9 2.9 2.5 2.6 5.5Georgia 0.1 0.1 0.2 0.4 0.3 0.3 0.5 0.4 0.6 35.9Kazakhstan 14.0 13.0 13.7 3.4 3.4 3.8 17.6 16.8 17.9 6.7Kyrgyzstan 0.8 0.7 0.8 0.8 0.7 0.9 1.6 1.4 1.7 26.3Tajikistan 0.9 0.8 0.8 0.3 0.3 0.3 1.2 1.1 1.1 1.3Turkmenistan 1.6 1.2 1.4 0.1 0.1 0.1 1.8 1.4 1.6 14.4Uzbekistan 6.9 7.6 8.0 0.4 0.4 0.4 7.5 8.2 8.6 4.9
Note: Totals and percentage change computed from unrounded data.1 Total cereals includes wheat, coarse grains and rice (paddy).

No. 1 n March 2016 25
Crop Prospects and Food Situation
ASIA
2016 following trends in the international market and the
continued depreciation of the national currency. Kazakhstan
switched to a free floating exchange rate in August 2015,
triggering a 23 percent slide in the tenge during the first
month of the new policy. As of February 2016, the export
price of wheat grain was almost 40 percent below its year-
earlier level, also reflecting a recent slowdown in export
demand from neighbouring countries. In importing countries
of the subregion, domestic prices increased in Tajikistan
over the past few months, due to the persistent sharp
depreciation of the Somoni, which lost around one-third of
its value against the US dollar in the past year, increasing
the cost of imported goods. Prices of wheat flour rose also
in Georgia on the back of currency weakness and increased
energy costs. In Armenia and Kyrgyzstan, prices of wheat
flour remained stable, however, they were generally below
their year-earlier levels, reflecting low prices in the regional
export market and adequate supplies from the 2015 good
wheat outputs.
0.4
0.5
0.6
0.7
0.8
0.9
1.0
1.1
FJDNOSAJJMAMFJDNOSAJJMAMF20162014 2015
USD/kg
Figure 6. Retail wheat flour prices in selected CIS in Asia countries
Sources: National Statistical Service of Republic of Armenia; National Statistical Committee of the Kyrgyz Republic; State Committee on Statistics, Republic of Tajikistan; State Statistical Committee of the Republic of Azerbaijan; National Statistics Office of Georgia.
Tajikistan (national average)
Kyrgyzstan (national average)Armenia (national average)
Azerbaijan (national average)
Georgia (national average)

No. 1 n March 201626
Crop Prospects and Food Situation
CENTRAL AMERICA AND THE CARIBBEAN
Increased sowings for 2016 main autumn-winter wheat cropThe early outlook for 2016 suggests that cereal production in
Mexico, the subregion’s major producer, will remain high. The
planted area for the autumn-winter maize crop, which accounts
for about 30 percent of the total annual output, is officially
estimated to have sharply risen by 18 percent compared to the
area for corresponding season last year. Wheat is only grown
in the autumn-winter season and planting has been concluded
for the crop that will be harvested from May. Early estimates
indicate a 3 percent increase in area compared to the previous
year. Early indications of producers’ intentions for the main
2016 spring-summer crop, planted later in the year, also point
to production remaining at a similarly high level compared to
the 2015 harvest.
Elsewhere in the subregion, planting of the 2016 main
“de primera” season will not begin until late April and will
conclude in late June. Rainfall levels are reported to have
remained mostly below average due to the impact of the ongoing
El Niño event, which is forecast to end in June. As a result, the
main “de primera” season plantings may be affected for the third
consecutive year.
Record 2015 cereal production in Mexico, while prolonged dry weather reduced outputs elsewhere in the subregionThe subregion’s aggregate cereal production in 2015 is estimated
to have reached an all-time high level of 44 million tonnes, largely
on the back of a record output in Mexico. The 2015 maize
LATI
N A
MER
ICA
AN
D T
HE
CA
RR
IBEA
N
production in Mexico is estimated at a high of 25 million tonnes,
about 4 percent up from the previous year’s level, while the wheat
output is put at 4.2 million tonnes, up from previous expectations
due to better-than-expected yields. However, by contrast,
elsewhere in the subregion, prolonged and severe dry weather
associated with El Niño negatively affected cereal production in
Mexico:• coarse grains (winter crop): planting•wheat(wintercrop):vegetative
Brazil:• maize (main, northeast): planting maize (main, centresouth): vegetative•paddy(north&northeast):plantingpaddy(centre&south):harvesting
Argentina:• coarse grains: vegetative •paddy:vegetative
Uruguay: • coarse grains: vegetative•paddy:vegetative
Note: Comments refer to situation as of March.
Table 16. Latin America and Caribbean cereal production (million tonnes)
Wheat Coarse grains Rice (paddy) Total cereals
2013 20142015
estim. 2013 20142015
estim. 2013 20142015
estim. 2013 20142015
estim.Change:
2015/2014 (%)
Central America & Caribbean 3.4 3.7 4.2 35.9 36.4 37.1 3.2 3.0 2.8 42.4 43.1 44.2 2.6El Salvador 0.0 0.0 0.0 1.0 1.0 0.8 0.0 0.0 0.0 1.1 1.0 0.8 -14.4Guatemala 0.0 0.0 0.0 1.8 1.8 1.7 0.0 0.0 0.0 1.8 1.9 1.8 -4.6Honduras 0.0 0.0 0.0 0.6 0.4 0.4 0.1 0.1 0.1 0.7 0.5 0.5 -8.3Mexico 3.4 3.7 4.2 30.7 31.8 32.8 0.2 0.3 0.2 34.3 35.8 37.3 4.3Nicaragua 0.0 0.0 0.0 0.6 0.4 0.5 0.5 0.5 0.5 1.2 0.9 0.9 2.7
South America 19.2 24.4 20.7 141.1 137.4 148.1 24.3 24.8 25.8 184.6 186.6 194.6 4.3Argentina 9.2 13.9 11.3 40.9 39.9 42.4 1.6 1.6 1.6 51.7 55.4 55.2 -0.3Brazil 5.7 6.3 5.4 83.5 82.9 88.6 11.8 12.1 12.4 101.1 101.3 106.4 5.1
Note: Totals and percentage change computed from unrounded data.

No. 1 n March 2016 27
Crop Prospects and Food Situation
2015, particularly in El Salvador, Guatemala, Haiti, Honduras
and Nicaragua. FAO estimates the aggregate 2015 cereal output
of the subregion, excluding Mexico, at 6.9 million tonnes, just
below the previous year’s already drought-reduced level.
White maize prices increased in most countries in recent monthsWhite maize prices increased significantly in most countries
between December and February. Despite adequate supplies from
the recently-completed 2015 secondary “de postrera” season
harvests, overall tight market availabilities following the sharply
drought-reduced main season “de primera” outputs, mainly instigated
the recent price gains. In Haiti, Honduras and Nicaragua, prices
increased sharply in the past three months and were at near-record
levels in Haiti. In Mexico, despite record production, the depreciation
of the local currency has put upward pressure on prices. By contrast,
in El Salvador, sustained imports from the United States of America,
Mexico and Guatemala, have kept prices relatively unchanged
although they remained well above their year-earlier levels.
SOUTH AMERICA
Cereal production in 2016 to remain high, despite anticipated lower maize outputEarly forecasts for the subregion’s 2016 cereal production
point to an output 3 percent below the previous year’s record
level, although still well above the previous five-year average.
The bulk of the decrease is expected in the maize outputs of
Argentina and Brazil, which together account for almost
90 percent of the subregion’s total maize production. In
Brazil, where harvesting of the 2016 first season maize
crop is currently ongoing, the output is officially forecast to
decline by some 3 percent to 28.6 million tonnes reflecting
lower plantings. Sowing of the second season crop is finalized
and the area planted is forecast marginally above last year’s
level. In Argentina, the area planted to maize is estimated
to be 2 percent lower than last year at 5.9 million hectares.
In Chile, the 2016 maize harvest has recently started and
production is officially forecast at about 1.3 million tonnes,
somewhat lower than the recent average, mainly due to
reduced plantings in response to lower prices. In Bolivia,
yellow maize production is expected to decline more than
what was earlier anticipated. The planted area for the
2016 maize crop, to be harvested from March, was down
by an estimated 27 percent, but drought conditions in late
December and January may result in an even larger reduction
of the final area for harvest, while also adversely impacting
yields.
Sowing of the 2016 wheat crop will not begin until April;
however, plantings are expected to increase in Brazil reflecting
high demand and in Argentina, the subregion’s main producer,
due to high export demand.
Cereal production reached record levels in 2015Cereal production in South America is estimated to have
reached a record high of 194.6 million tonnes in 2015,
mainly a result of increased maize production in Argentina
and Brazil, which together account for some 80 percent, on
average, of the subregional cereal output. Elsewhere, cereal
outputs remained high in Bolivia and Chile. In Paraguay and
Uruguay, wheat production in 2015 was lower than the highs
of previous years, driven primarily by reduced plantings due to
low prices.
Cereal prices, particularly for yellow maize, at high levels Wheat flour prices followed mixed trends in the past
three months. In Argentina and Brazil, prices increased
by 3.2 percent and 1.7 percent, respectively, and were
significantly above their year-earlier levels, mainly driven by a
strong depreciation of the local currencies. In Bolivia, prices
also increased in the previous three months, mainly reflecting
seasonal trends, but remained generally below their level at the
same time last year in most markets. In Chile and Peru, large
importers in the subregion, prices remained stable or declined
LATIN
AM
ERIC
A A
ND
THE C
AR
RIB
EAN
2015 2016
200
250
300
350
400
450
500
550
600
FJDNOSAJJMAMFJDNOSAJJMAMF2014
Nicaragua Managua (oriental)
Honduras Tegucigalpa
Guatemala Guatemala City
El Salvador San Salvador
USD/tonne
Figure 7. Wholesale white maize prices in selected countries in Central America
Sources: Secretaria de Agricultura y Ganaderia, Honduras; Ministerio de Agricultura, Ganadería y Alimentación, Guatemala; Ministerio agropecuario y forestal, Nicaragua, Dirección General de Economía Agropecuaria, El Salvador.
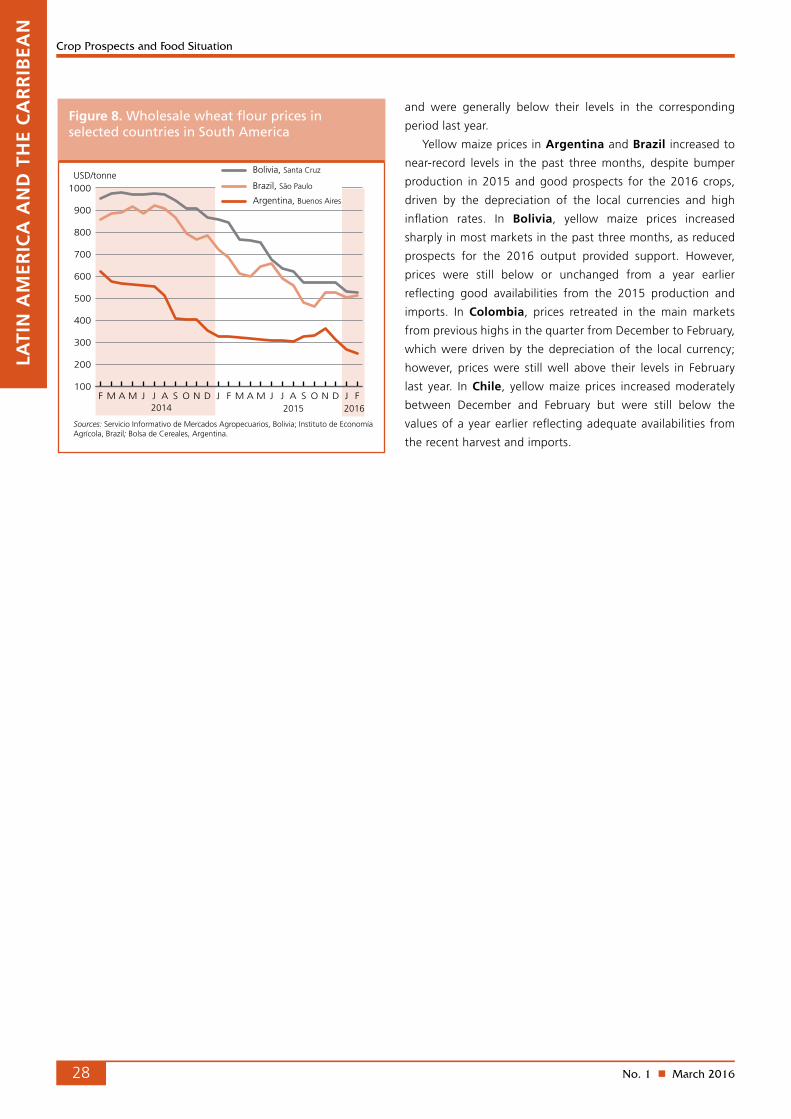
No. 1 n March 201628
Crop Prospects and Food Situation
and were generally below their levels in the corresponding
period last year.
Yellow maize prices in Argentina and Brazil increased to
near-record levels in the past three months, despite bumper
production in 2015 and good prospects for the 2016 crops,
driven by the depreciation of the local currencies and high
inflation rates. In Bolivia, yellow maize prices increased
sharply in most markets in the past three months, as reduced
prospects for the 2016 output provided support. However,
prices were still below or unchanged from a year earlier
reflecting good availabilities from the 2015 production and
imports. In Colombia, prices retreated in the main markets
from previous highs in the quarter from December to February,
which were driven by the depreciation of the local currency;
however, prices were still well above their levels in February
last year. In Chile, yellow maize prices increased moderately
between December and February but were still below the
values of a year earlier reflecting adequate availabilities from
the recent harvest and imports.
LATI
N A
MER
ICA
AN
D T
HE
CA
RR
IBEA
N
100
200
300
400
500
600
700
800
900
1000
FJDNOSAJJMAMFJDNOSAJJMAMF20162014 2015
USD/tonne
Figure 8. Wholesale wheat flour prices in selected countries in South America
Sources: Servicio Informativo de Mercados Agropecuarios, Bolivia; Instituto de Economía Agrícola, Brazil; Bolsa de Cereales, Argentina.
Brazil, São Paulo
Argentina, Buenos Aires
Bolivia, Santa Cruz
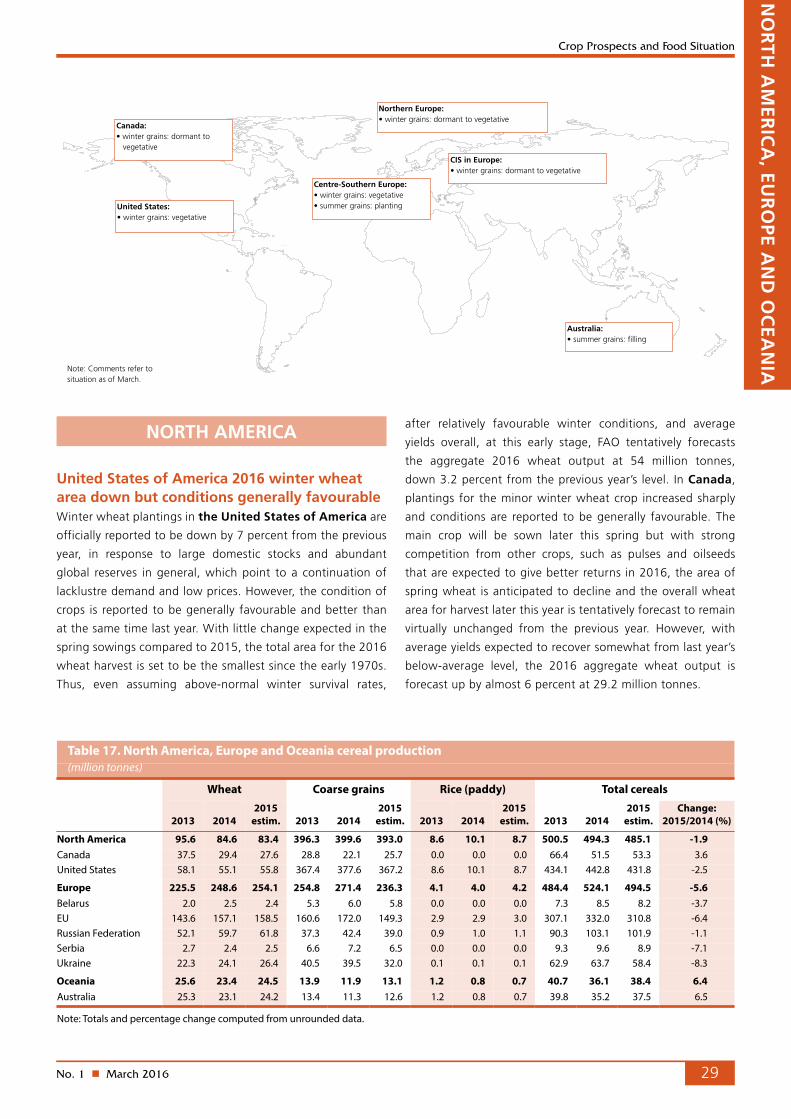
No. 1 n March 2016 29
Crop Prospects and Food Situation
NO
RTH
AM
ERIC
A, EU
RO
PE AN
D O
CEA
NIA
NORTH AMERICA
United States of America 2016 winter wheat area down but conditions generally favourableWinter wheat plantings in the United States of America are
officially reported to be down by 7 percent from the previous
year, in response to large domestic stocks and abundant
global reserves in general, which point to a continuation of
lacklustre demand and low prices. However, the condition of
crops is reported to be generally favourable and better than
at the same time last year. With little change expected in the
spring sowings compared to 2015, the total area for the 2016
wheat harvest is set to be the smallest since the early 1970s.
Thus, even assuming above-normal winter survival rates,
after relatively favourable winter conditions, and average
yields overall, at this early stage, FAO tentatively forecasts
the aggregate 2016 wheat output at 54 million tonnes,
down 3.2 percent from the previous year’s level. In Canada,
plantings for the minor winter wheat crop increased sharply
and conditions are reported to be generally favourable. The
main crop will be sown later this spring but with strong
competition from other crops, such as pulses and oilseeds
that are expected to give better returns in 2016, the area of
spring wheat is anticipated to decline and the overall wheat
area for harvest later this year is tentatively forecast to remain
virtually unchanged from the previous year. However, with
average yields expected to recover somewhat from last year’s
below-average level, the 2016 aggregate wheat output is
forecast up by almost 6 percent at 29.2 million tonnes.
Northern Europe:• winter grains: dormant to vegetative
Centre-Southern Europe:• winter grains: vegetative•summergrains:planting
CIS in Europe:• winter grains: dormant to vegetative
Note: Comments refer to situation as of March.
Canada:• winter grains: dormant to vegetative
United States:• winter grains: vegetative
Australia:• summer grains: filling
Table 17. North America, Europe and Oceania cereal production (million tonnes)
Wheat Coarse grains Rice (paddy) Total cereals
2013 20142015
estim. 2013 20142015
estim. 2013 20142015
estim. 2013 20142015
estim.Change:
2015/2014 (%)
North America 95.6 84.6 83.4 396.3 399.6 393.0 8.6 10.1 8.7 500.5 494.3 485.1 -1.9Canada 37.5 29.4 27.6 28.8 22.1 25.7 0.0 0.0 0.0 66.4 51.5 53.3 3.6United States 58.1 55.1 55.8 367.4 377.6 367.2 8.6 10.1 8.7 434.1 442.8 431.8 -2.5
Europe 225.5 248.6 254.1 254.8 271.4 236.3 4.1 4.0 4.2 484.4 524.1 494.5 -5.6Belarus 2.0 2.5 2.4 5.3 6.0 5.8 0.0 0.0 0.0 7.3 8.5 8.2 -3.7EU 143.6 157.1 158.5 160.6 172.0 149.3 2.9 2.9 3.0 307.1 332.0 310.8 -6.4Russian Federation 52.1 59.7 61.8 37.3 42.4 39.0 0.9 1.0 1.1 90.3 103.1 101.9 -1.1Serbia 2.7 2.4 2.5 6.6 7.2 6.5 0.0 0.0 0.0 9.3 9.6 8.9 -7.1Ukraine 22.3 24.1 26.4 40.5 39.5 32.0 0.1 0.1 0.1 62.9 63.7 58.4 -8.3
Oceania 25.6 23.4 24.5 13.9 11.9 13.1 1.2 0.8 0.7 40.7 36.1 38.4 6.4Australia 25.3 23.1 24.2 13.4 11.3 12.6 1.2 0.8 0.7 39.8 35.2 37.5 6.5
Note: Totals and percentage change computed from unrounded data.

No. 1 n March 201630
Crop Prospects and Food Situation
EUROPE
European UnionEuropean Union wheat area unchanged and growing conditions mostly favourable In the European Union (EU), where the bulk of the wheat is
sown in winter and already in the ground, latest indications
suggest that the overall wheat area for the 2016 harvest will
remain virtually unchanged from the previous year’s level. Crop
conditions throughout the region are reported to have been
generally favourable throughout the past few weeks, with
soil moisture reserves ample for spring growth as crops break
dormancy. At this early stage, assuming yields return to average
levels after last year’s highs, production is tentatively forecast to
decline by some 2 percent.
CIS in EuropeMixed prospects for 2016 winter cereal cropsProspects for the 2016 winter crops, which are mostly still dormant,
are mixed. In the Russian Federation, unfavourable dry weather
conditions during planting of the winter cereal crops last autumn
led to a reduction in the area sown and resulted in the irregular
emergence of some crops. However, precipitation in November
2015 somewhat improved moisture and crop conditions before
dormancy and good snowcover in most regions reduced the risk
of winterkill. The impact of the earlier dryness on crops will not be
determined until growth resumes in the spring. Considering the
current condition of the winter crop and assuming that the spring
plantings will likely increase to make up for some of the reduced
winter area, FAO preliminarily forecasts the Russian Federation’s
2016 aggregate wheat production at 57 million tonnes, down
5 million tonnes from the record level last year. Similarly, in
Ukraine, drought during the planting period led to a decline in
the winter wheat area and impaired the good establishment of
crops. With recent reports indicating that only about 66 percent
of the wheat crop is in good or satisfactory condition, it is unlikely
that last year’s bumper yields could be matched again this year.
At this early stage, FAO tentatively forecasts the 2016 wheat
production at 17.8 million tonnes, about 30 percent down from
the record-high level of 2015. In the Republic of Moldova,
where the area under winter wheat increased, the winter crop
is reported in good condition despite exceptionally cold weather.
In Belarus, the outlook for winter wheat is generally favourable.
Above-average cereal output in 2015 FAO’s latest estimate puts the subregion’s 2015 aggregate cereal
production at 170 million tonnes, 4 percent down from the
previous year’s high level, but still well above the recent average.
Lower maize and barley outputs more than offset an increase
NO
RTH
AM
ERIC
A,
EUR
OPE
AN
D O
CEA
NIA
in wheat production. The subregional wheat output, which
accounts for half of the total cereal production, is estimated
at a record level of 91 million tonnes. Most of the increase,
in absolute terms, is expected in Ukraine, where the wheat
output is estimated at an historically high level of 26.4 million
tonnes, up 2.3 million tonnes from 2014, following increased
plantings and above-average yields. Similarly, a larger area
planted and favourable weather conditions boosted wheat
production in the Russian Federation to a near-record level
of 61.8 million tonnes. By contrast, production of maize in the
subregion declined by 13 percent to 36.8 million tonnes, with
most of the decrease attributed to Ukraine following reduced
plantings and drought-affected yields. Similarly, the aggregate
barley production is estimated to have declined by 12 percent to
28 million tonnes, on the back of a lower harvest in the Russian
Federation (-2.9 million tonnes) and Ukraine (-0.8 million tonnes).
Cereal exports forecast to reach new record in 2015/16Despite a decrease in the 2015 production, aggregate cereal
exports in the 2015/16 marketing year (July/June) are forecast
to reach a new record level of 67 million tonnes, 2.5 percent
higher than in 2014/15. Supported by a depreciation of national
currencies, an increase in wheat exports more than offset reduced
maize and barley shipments. Higher wheat exports are expected
in Ukraine and the Russian Federation. The latter is expected
to become the biggest wheat exporter after the EU in 2015/16,
surpassing for the first time the United States of America. By
contrast, the subregional barley shipments are expected to drop
by 14 percent to 8.4 million tonnes, following a decrease after
exceptionally high levels of exports from the Russian Federation in
the previous year. A small decline is also estimated for subregional
maize exports, primarily because of a drop in exportable surpluses
in Ukraine following reduced production in 2015.
Domestic prices of wheat and wheat flour strengthened in some countries, while export prices declinedExport prices of milling wheat in the two main exporting countries
of the subregion, the Russian Federation and Ukraine, declined
over the past four months, largely as a result of a depreciation of
national currencies and generally following trends in the global
market. In Ukraine, domestic prices of wheat and wheat flour
remained relatively unchanged in January and February, after
increasing in previous months, due to limited trade activity. By
contrast, average prices of wheat grain in the Russian Federation
increased slightly, mainly following a further depreciation of the
local currency. Prices of wheat flour rose moderately also in the
export-oriented Southern region, pending the possible reduction
of export duties. However, ample domestic supplies prevented

No. 1 n March 2016 31
Crop Prospects and Food Situation
further increases and kept prices of wheat and wheat flour below
their year-earlier levels. In the Republic of Moldova, prices of
wheat and wheat flour generally moved up over the last months
due to tightening supplies after a drought-reduced output in
2015. In Belarus, the domestic price of wheat flour remained
stable over recent months.
OCEANIA
Australia harvests larger cereal crop in 2015 The latest official estimate of the recently-completed 2015 wheat
harvest in Australia stands at 24.2 million tonnes, 5 percent up
from the previous year’s crop. The bulk of the increase is attributed
to an increased area with plantings rising to a three-year high,
while yields were largely unchanged. Barley production also rose
in 2015 by 2 percent to about 8.2 million tonnes. Prospects for
the 2016 summer crop improved in late January and February,
with the arrival of widespread rains, after earlier dry conditions,
in the main producing areas. The overall area planted to sorghum
is estimated down by about 2 percent for the 2016 harvest due
to unfavourable planting conditions in parts of Queensland. The
2016 wheat crop will be planted from April to June. At this early
stage, the area planted is tentatively forecast to remain close to
the previous year’s level and, assuming about-average yields,
output is tentatively forecast at 25 million tonnes in 2016.
NO
RTH
AM
ERIC
A, EU
RO
PE AN
D O
CEA
NIA
0.3
0.4
0.5
0.6
0.7
0.8
0.9
FJDNOSAJJMAMFJDNOSAJJMAMF20162014 2015
USD/kg
Figure 9. Retail wheat flour prices in Belarus,Russian Federation and Republic of Moldova
Sources: National Statistical Committee of the Republic of Belarus; ACSA, Rep. of Moldova; Ministry of Agriculture of the Russian Federation.
Rep. of Moldova (Chisinau)
Russian Federation (national average)
Belarus (national average)

Crop Prospects and Food Situation
No. 1 n March 2016 32
Statistical appendix
Table A1. Global cereal supply and demand indicators ............................................................................................ .33
Table A2. World cereal stocks .................................................................................................................................. .34
Table A3. Selected international prices of wheat and coarse grains .......................................................................... .35
Table A4a. Cereal import requirements of Low-Income Food-Deficit Countries, 2015/16 or 2016 estimates ............... .36
Table A4b. Cereal import requirements of Low-Income Food-Deficit Countries, 2015/16 or 2016 estimates .............. .37
STA
TIST
ICA
L A
PPEN
DIX

No. 1 n March 2016 33
Crop Prospects and Food Situation
Table A1. Global cereal supply and demand indicators
Average 2008/09 - 2012/13 2011/12 2012/13 2013/14 2014/15 2015/16
1. Ratio of world stocks to utilization (%) Wheat 27.9 28.7 24.9 25.7 27.6 28.8Coarse grains 18.0 17.6 15.4 17.8 20.3 19.8Rice 30.3 30.9 33.3 34.8 34.7 32.9Total cereals 23.3 23.6 21.7 23.4 25.2 24.7
2. Ratio of major grain exporters' suppliesto normal market requirements (%) 119.7 118.7 108.1 121.6 122.7 121.3
3. Ratio of major exporters' stocks to their total disappearance (%) Wheat 19.0 18.2 14.1 14.1 16.6 18.3Coarse grains 12.7 11.1 8.4 10.4 12.5 12.1Rice 23.7 25.1 27.8 28.9 23.9 17.1Total cereals 18.5 18.1 16.8 17.8 17.7 15.9
Annual trendgrowth rate Change from previous year
2005-2014 2011 2012 2013 2014 2015
4. Changes in world cereal production (%) 2.5 4.2 -2.2 9.9 1.6 -1.4
5. Changes in cereal production in the LIFDCs (%) 3.7 2.0 3.8 1.3 2.7 -6.3
6. Changes in cereal production in the LIFDCsless India (%) 5.4 -3.5 5.6 1.1 5.8 -5.9
Average Change from previous year (%)
2009-2013 2012 2013 2014 2015 2016*
7. Selected cereal price indices: Wheat 184.3 -4.8 -4.9 -6.6 -20.5 -21.6Maize 227.6 2.2 -12.9 -25.8 -11.8 -8.4Rice 237.4 -4.6 0.8 0.8 -10.5 -11.3
Notes:
Utilization is de�ned as the sum of food use, feed and other uses.Cereals refer to wheat, coarse grains and rice; grains refer to wheat and coarse grains.
Major wheat exporters are Argentina, Australia, Canada, the EU, Kazakhstan, the Russian Federation, Ukraine and the United States of America; major coarse grain exporters are Argentina, Australia, Brazil, Canada, the EU, the Russian Federation, Ukraine and the United States of America; major rice exporters are India, Pakistan, Thailand, the United States of America and Viet Nam.
Normal market requirements for major grain exporters are de�ned as the average of domestic utilization plus exports in the three preceding seasons.Disappearance is de�ned as domestic utilization plus exports for any given season.
Price indices: The Wheat Price Index has been constructed based on the IGC Wheat Price Index, rebased to 2002-2004=100; for maize, the U.S. maize No.2 Yellow (delivered U.S. Gulf ports) with base 2002-2004=100; for rice, the FAO Rice Price Index, 2002-2004=100, is based on 16 rice export quotations.
*January-February average.
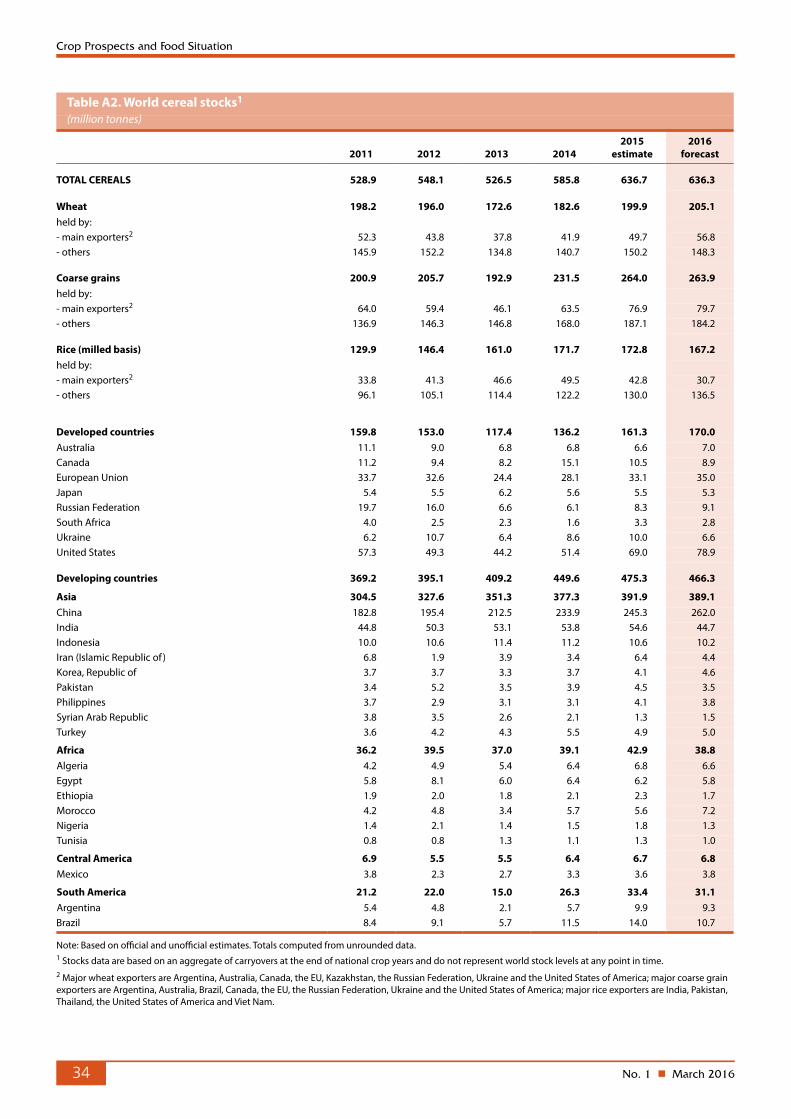
No. 1 n March 201634
Crop Prospects and Food Situation
Table A2. World cereal stocks1 (million tonnes)
2011 2012 2013 20142015
estimate2016
forecast
TOTAL CEREALS 528.9 548.1 526.5 585.8 636.7 636.3
Wheat 198.2 196.0 172.6 182.6 199.9 205.1held by: - main exporters2 52.3 43.8 37.8 41.9 49.7 56.8- others 145.9 152.2 134.8 140.7 150.2 148.3
Coarse grains 200.9 205.7 192.9 231.5 264.0 263.9held by: - main exporters2 64.0 59.4 46.1 63.5 76.9 79.7- others 136.9 146.3 146.8 168.0 187.1 184.2
Rice (milled basis) 129.9 146.4 161.0 171.7 172.8 167.2held by: - main exporters2 33.8 41.3 46.6 49.5 42.8 30.7- others 96.1 105.1 114.4 122.2 130.0 136.5
Developed countries 159.8 153.0 117.4 136.2 161.3 170.0Australia 11.1 9.0 6.8 6.8 6.6 7.0Canada 11.2 9.4 8.2 15.1 10.5 8.9European Union 33.7 32.6 24.4 28.1 33.1 35.0Japan 5.4 5.5 6.2 5.6 5.5 5.3Russian Federation 19.7 16.0 6.6 6.1 8.3 9.1South Africa 4.0 2.5 2.3 1.6 3.3 2.8Ukraine 6.2 10.7 6.4 8.6 10.0 6.6United States 57.3 49.3 44.2 51.4 69.0 78.9
Developing countries 369.2 395.1 409.2 449.6 475.3 466.3
Asia 304.5 327.6 351.3 377.3 391.9 389.1China 182.8 195.4 212.5 233.9 245.3 262.0India 44.8 50.3 53.1 53.8 54.6 44.7Indonesia 10.0 10.6 11.4 11.2 10.6 10.2Iran (Islamic Republic of ) 6.8 1.9 3.9 3.4 6.4 4.4Korea, Republic of 3.7 3.7 3.3 3.7 4.1 4.6Pakistan 3.4 5.2 3.5 3.9 4.5 3.5Philippines 3.7 2.9 3.1 3.1 4.1 3.8Syrian Arab Republic 3.8 3.5 2.6 2.1 1.3 1.5Turkey 3.6 4.2 4.3 5.5 4.9 5.0
Africa 36.2 39.5 37.0 39.1 42.9 38.8Algeria 4.2 4.9 5.4 6.4 6.8 6.6Egypt 5.8 8.1 6.0 6.4 6.2 5.8Ethiopia 1.9 2.0 1.8 2.1 2.3 1.7Morocco 4.2 4.8 3.4 5.7 5.6 7.2Nigeria 1.4 2.1 1.4 1.5 1.8 1.3Tunisia 0.8 0.8 1.3 1.1 1.3 1.0
Central America 6.9 5.5 5.5 6.4 6.7 6.8Mexico 3.8 2.3 2.7 3.3 3.6 3.8
South America 21.2 22.0 15.0 26.3 33.4 31.1Argentina 5.4 4.8 2.1 5.7 9.9 9.3Brazil 8.4 9.1 5.7 11.5 14.0 10.7
Note: Based on o�cial and uno�cial estimates. Totals computed from unrounded data.1 Stocks data are based on an aggregate of carryovers at the end of national crop years and do not represent world stock levels at any point in time.2 Major wheat exporters are Argentina, Australia, Canada, the EU, Kazakhstan, the Russian Federation, Ukraine and the United States of America; major coarse grain exporters are Argentina, Australia, Brazil, Canada, the EU, the Russian Federation, Ukraine and the United States of America; major rice exporters are India, Pakistan, Thailand, the United States of America and Viet Nam.
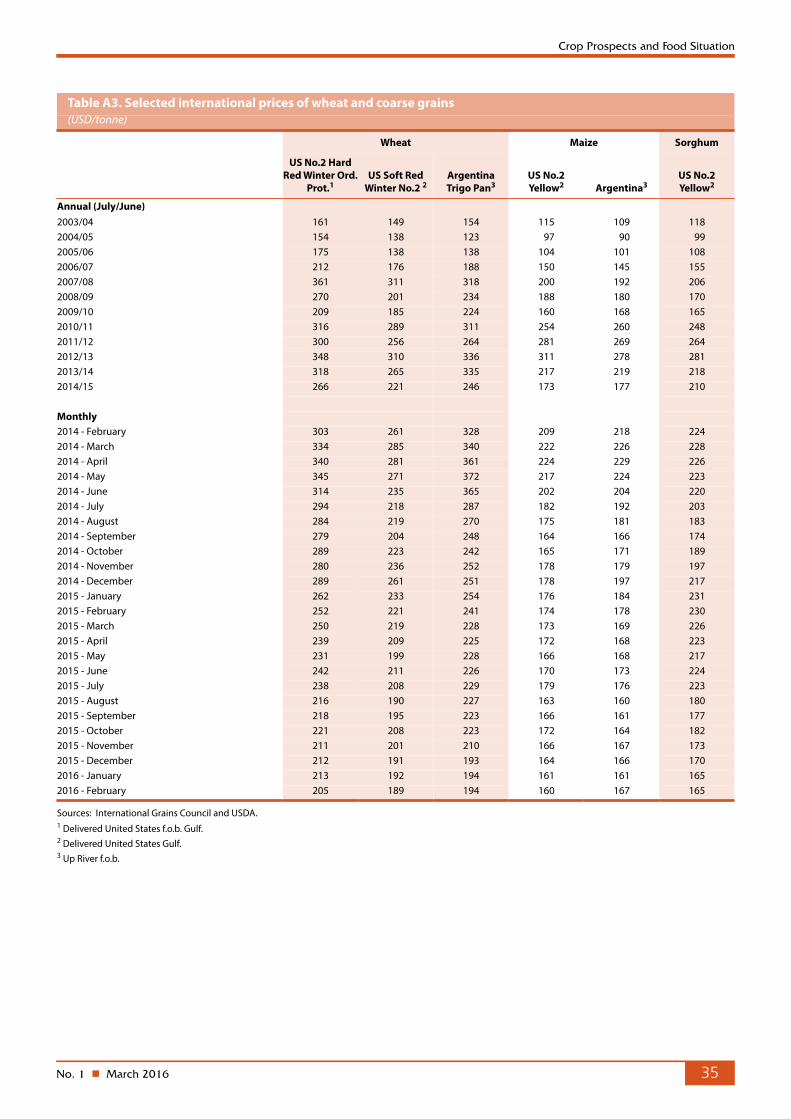
No. 1 n March 2016 35
Crop Prospects and Food Situation
Table A3. Selected international prices of wheat and coarse grains(USD/tonne)
Wheat Maize Sorghum
US No.2 Hard Red Winter Ord.
Prot.1 US Soft Red
Winter No.2 2 Argentina Trigo Pan3
US No.2 Yellow2 Argentina3
US No.2 Yellow2
Annual (July/June) 2003/04 161 149 154 115 109 1182004/05 154 138 123 97 90 992005/06 175 138 138 104 101 1082006/07 212 176 188 150 145 1552007/08 361 311 318 200 192 2062008/09 270 201 234 188 180 1702009/10 209 185 224 160 168 1652010/11 316 289 311 254 260 2482011/12 300 256 264 281 269 2642012/13 348 310 336 311 278 2812013/14 318 265 335 217 219 2182014/15 266 221 246 173 177 210
Monthly 2014 - February 303 261 328 209 218 2242014 - March 334 285 340 222 226 2282014 - April 340 281 361 224 229 2262014 - May 345 271 372 217 224 2232014 - June 314 235 365 202 204 2202014 - July 294 218 287 182 192 2032014 - August 284 219 270 175 181 1832014 - September 279 204 248 164 166 1742014 - October 289 223 242 165 171 1892014 - November 280 236 252 178 179 1972014 - December 289 261 251 178 197 2172015 - January 262 233 254 176 184 2312015 - February 252 221 241 174 178 2302015 - March 250 219 228 173 169 2262015 - April 239 209 225 172 168 2232015 - May 231 199 228 166 168 2172015 - June 242 211 226 170 173 2242015 - July 238 208 229 179 176 2232015 - August 216 190 227 163 160 1802015 - September 218 195 223 166 161 1772015 - October 221 208 223 172 164 1822015 - November 211 201 210 166 167 1732015 - December 212 191 193 164 166 1702016 - January 213 192 194 161 161 1652016 - February 205 189 194 160 167 165
Sources: International Grains Council and USDA.1 Delivered United States f.o.b. Gulf.2 Delivered United States Gulf.3 Up River f.o.b.

No. 1 n March 201636
Crop Prospects and Food Situation
Table A4a. Cereal import requirements of Low-Income Food-De�cit Countries1 , 2015/16 or 2016 estimates(thousand tonnes)
2014/15 or 2015 2015/16 or 2016
Actual imports Import position2
Marketing
yearCommercial purchases Food aid
Total commercial
and aid
Total import requirements (excl. re-exports)
Total commercial
and aidFood aid
deliveries3 Commercial purchases
AFRICA 30 278.0 994.7 31 272.7 31 449.6 1 925.5 24.2 1 901.3
East Africa 9 379.0 510.3 9 889.3 10 357.3 610.6 0.0 610.6 Burundi Jan/Dec 147.4 3.0 150.4 170.0 0.0 0.0 0.0 Comoros Jan/Dec 70.0 0.0 70.0 46.0 0.0 0.0 0.0 Djibouti Jan/Dec 202.0 3.5 205.5 146.0 0.0 0.0 0.0 Eritrea Jan/Dec 427.0 0.0 427.0 437.3 0.0 0.0 0.0 Ethiopia Jan/Dec 803.1 56.2 859.3 1 380.0 0.0 0.0 0.0 Kenya Oct/Sep 2 859.4 99.3 2 958.7 2 700.0 332.3 0.0 332.3 Rwanda Jan/Dec 116.2 2.6 118.8 120.0 0.0 0.0 0.0 Somalia Aug/Jul 570.0 58.0 628.0 600.0 0.6 0.0 0.6 South Sudan Nov/Oct n.a. n.a. 545.0 555.0 n.a. n.a. n.a. Sudan Nov/Oct 2 087.2 257.3 2 344.5 2 815.0 14.5 0.0 14.5 Tanzania U.R. Jun/May 1 161.7 9.6 1 171.3 865.0 263.2 0.0 263.2 Uganda Jan/Dec 390.0 20.8 410.8 523.0 0.0 0.0 0.0
Southern Africa 2 586.5 60.9 2 647.4 3 141.7 1 184.1 17.5 1 166.6 Lesotho Apr/Mar 216.0 7.6 223.6 232.0 53.6 0.0 53.6 Madagascar Apr/Mar 543.7 7.4 551.1 463.0 15.2 7.7 7.5 Malawi Apr/Mar 117.0 13.2 130.2 265.0 249.3 2.8 246.5 Mozambique Apr/Mar 1 216.0 25.0 1 241.0 1 190.0 388.3 1.3 387.0 Zimbabwe Apr/Mar 493.8 7.7 501.5 991.7 477.7 5.7 472.0
West Africa 16 751.6 274.2 17 025.8 16 130.1 129.9 6.7 123.2Coastal Countries 12 626.7 151.3 12 778.0 12 238.5 0.5 0.5 0.0 Benin Jan/Dec 381.0 6.0 387.0 387.0 0.0 0.0 0.0 Côte d'Ivoire Jan/Dec 1 817.0 3.5 1 820.5 1 770.5 0.0 0.0 0.0 Ghana Jan/Dec 937.2 7.8 945.0 985.0 0.5 0.5 0.0 Guinea Jan/Dec 640.5 21.5 662.0 612.5 0.0 0.0 0.0 Liberia Jan/Dec 355.0 77.0 432.0 432.0 0.0 0.0 0.0 Nigeria Jan/Dec 7 920.0 0.0 7 920.0 7 420.0 0.0 0.0 0.0 Sierra Leone Jan/Dec 351.0 35.0 386.0 366.0 0.0 0.0 0.0 Togo Jan/Dec 225.0 0.5 225.5 265.5 0.0 0.0 0.0Sahelian Countries 4 124.9 122.9 4 247.8 3 891.6 129.4 6.2 123.2 Burkina Faso Nov/Oct 479.0 6.0 485.0 515.0 11.0 0.0 11.0 Chad Nov/Oct 104.0 40.6 144.6 154.6 3.4 0.0 3.4 Gambia Nov/Oct 201.0 11.5 212.5 223.5 6.2 6.2 0.0 Guinea-Bissau Nov/Oct 88.0 6.3 94.3 104.3 0.0 0.0 0.0 Mali Nov/Oct 366.2 9.7 375.9 261.2 18.8 0.0 18.8 Mauritania Nov/Oct 514.5 10.0 524.5 469.0 50.2 0.0 50.2 Niger Nov/Oct 468.2 36.8 505.0 508.0 0.1 0.0 0.1 Senegal Nov/Oct 1 904.0 2.0 1 906.0 1 656.0 39.7 0.0 39.7
Central Africa 1 560.9 149.3 1 710.2 1 820.5 0.9 0.0 0.9 Cameroon Jan/Dec 825.0 2.0 827.0 937.0 0.0 0.0 0.0 Cent.Afr.Rep. Jan/Dec 52.0 23.0 75.0 75.0 0.9 0.0 0.9 Dem.Rep.of the Congo Jan/Dec 669.7 120.3 790.0 790.0 0.0 0.0 0.0 Sao Tome and Principe Jan/Dec 14.2 4.0 18.2 18.5 0.0 0.0 0.0
Source: FAO1 The Low-Income Food-De�cit Countries (LIFDCs) group includes net food de�cit countries with annual per caput income below the level used by the World Bank to determine eligibility for IDA assistance (i.e. USD 1 945 in 2011); for full details see http://www.fao.org/countrypro�les/lifdc2 Estimates based on information as February 2016.3 Refers to food aid deliveries to WFP country o�ces, bilateral transfers, and deliveries by other UN agencies and NGOs.
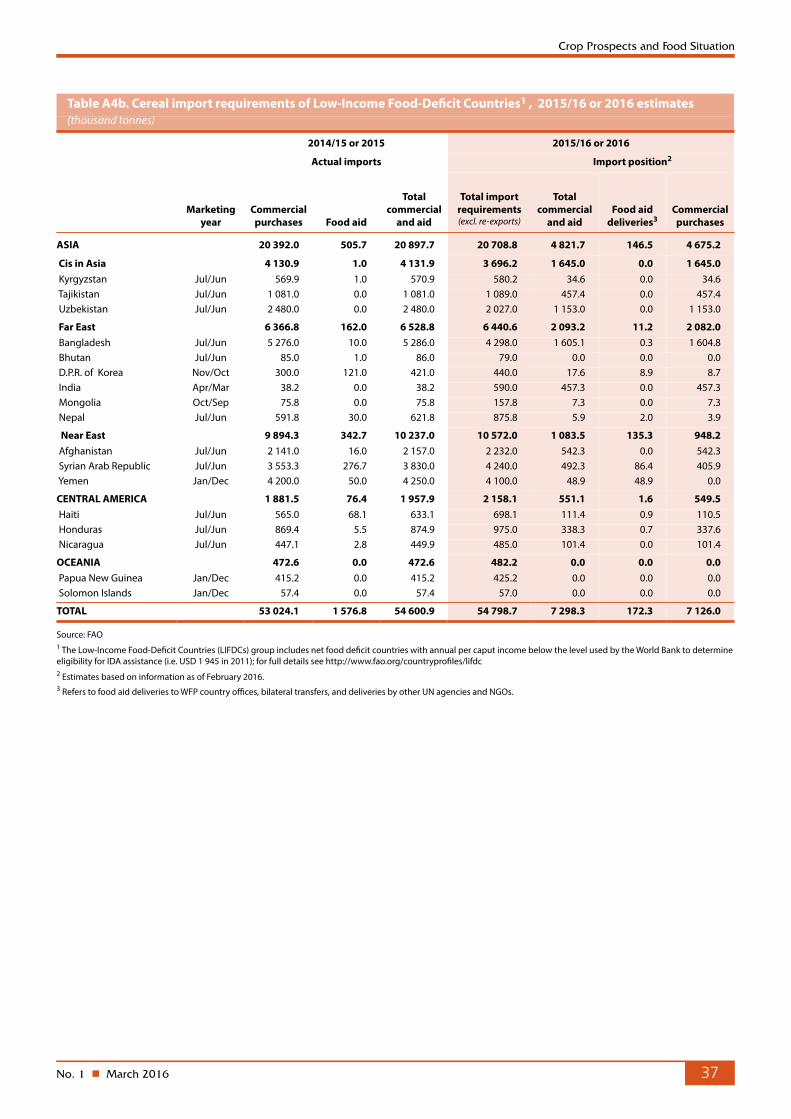
No. 1 n March 2016 37
Crop Prospects and Food Situation
Table A4b. Cereal import requirements of Low-Income Food-De�cit Countries1 , 2015/16 or 2016 estimates(thousand tonnes)
2014/15 or 2015 2015/16 or 2016
Actual imports Import position2
Marketing
yearCommercial purchases Food aid
Total commercial
and aid
Total import requirements (excl. re-exports)
Total commercial
and aidFood aid
deliveries3 Commercial purchases
ASIA 20 392.0 505.7 20 897.7 20 708.8 4 821.7 146.5 4 675.2
Cis in Asia 4 130.9 1.0 4 131.9 3 696.2 1 645.0 0.0 1 645.0 Kyrgyzstan Jul/Jun 569.9 1.0 570.9 580.2 34.6 0.0 34.6 Tajikistan Jul/Jun 1 081.0 0.0 1 081.0 1 089.0 457.4 0.0 457.4 Uzbekistan Jul/Jun 2 480.0 0.0 2 480.0 2 027.0 1 153.0 0.0 1 153.0
Far East 6 366.8 162.0 6 528.8 6 440.6 2 093.2 11.2 2 082.0 Bangladesh Jul/Jun 5 276.0 10.0 5 286.0 4 298.0 1 605.1 0.3 1 604.8 Bhutan Jul/Jun 85.0 1.0 86.0 79.0 0.0 0.0 0.0 D.P.R. of Korea Nov/Oct 300.0 121.0 421.0 440.0 17.6 8.9 8.7 India Apr/Mar 38.2 0.0 38.2 590.0 457.3 0.0 457.3 Mongolia Oct/Sep 75.8 0.0 75.8 157.8 7.3 0.0 7.3 Nepal Jul/Jun 591.8 30.0 621.8 875.8 5.9 2.0 3.9
Near East 9 894.3 342.7 10 237.0 10 572.0 1 083.5 135.3 948.2 Afghanistan Jul/Jun 2 141.0 16.0 2 157.0 2 232.0 542.3 0.0 542.3 Syrian Arab Republic Jul/Jun 3 553.3 276.7 3 830.0 4 240.0 492.3 86.4 405.9 Yemen Jan/Dec 4 200.0 50.0 4 250.0 4 100.0 48.9 48.9 0.0
CENTRAL AMERICA 1 881.5 76.4 1 957.9 2 158.1 551.1 1.6 549.5 Haiti Jul/Jun 565.0 68.1 633.1 698.1 111.4 0.9 110.5 Honduras Jul/Jun 869.4 5.5 874.9 975.0 338.3 0.7 337.6 Nicaragua Jul/Jun 447.1 2.8 449.9 485.0 101.4 0.0 101.4
OCEANIA 472.6 0.0 472.6 482.2 0.0 0.0 0.0 Papua New Guinea Jan/Dec 415.2 0.0 415.2 425.2 0.0 0.0 0.0 Solomon Islands Jan/Dec 57.4 0.0 57.4 57.0 0.0 0.0 0.0
TOTAL 53 024.1 1 576.8 54 600.9 54 798.7 7 298.3 172.3 7 126.0
Source: FAO1 The Low-Income Food-De�cit Countries (LIFDCs) group includes net food de�cit countries with annual per caput income below the level used by the World Bank to determine eligibility for IDA assistance (i.e. USD 1 945 in 2011); for full details see http://www.fao.org/countrypro�les/lifdc2 Estimates based on information as of February 2016.3 Refers to food aid deliveries to WFP country o�ces, bilateral transfers, and deliveries by other UN agencies and NGOs.

GIEWS continuously monitors crop prospects and food security situation at global, regional, national and sub-national
levels and warns of impending food difficulties and emergencies. Established in the wake of the world food crisis of the
early 1970’s, GIEWS maintains a unique database on all aspects of food supply and demand for every country of the
world. The System regularly provides policy makers and the international community with up-to-date information so that
timely interventions can be planned and suffering avoided.
The Global Information and Early Warning System on Food and AgricultureGIEWS
Disclaimer
The designations employed and the presentation of material in this information product do not imply the expression of any opinion whatsoever on the part of the Food and Agriculture Organization of the United Nations (FAO) concerning the legal or development status of any country, territory, city or area or of its authorities, or concerning the delimitation of its frontiers or boundaries. The mention of specific companies or products of manufacturers, whether or not these have been patented, does not imply that these have been endorsed or recommended by FAO in preference to others of a similar nature that are not mentioned.
The views expressed in this information product are those of the author(s) and do not necessarily reflect the views or policies of FAO.
© FAO, 2016
Crop Prospects and Food Situation is published by the Trade and Markets Division of FAO under the Global Information
and Early Warning System (GIEWS). It is published four times a year and focuses on developments affecting the food
situation of developing countries and the Low-Income Food-Deficit Countries (LIFDCs) in particular. The report provides
a review of the food situation by geographic region, a section dedicated to the LIFDCs and a list of countries requiring
external assistance for food. It also includes a global cereal supply and demand overview to complement the biannual
analysis in the Food Outlook publication. Crop Prospects and Food Situation is available in English, French and
Spanish in electronic format.
Crop Prospects and Food Situation and other GIEWS reports are available online at: http:/www.fao.org/giews/. In addition, GIEWS Special Reports and Special Alerts, when published, can be received by e-mail through automatic
mailing lists. Subscription information is available at: http:/www.fao.org/giews/english/listserv.htm.
This report is based on information available as of mid-February 2016.
Enquiries may be directed to: Global Information and Early Warning System on Food and Agriculture (GIEWS) Trade and Markets Division (EST) Food and Agriculture Organization of the United Nations (FAO) Viale delle Terme di Caracalla 00153 Rome - Italy Direct Facsimile: 0039-06-5705-4495 E-mail: [email protected]
I5455E/1/03.16