crop model i: overview and possible applications becky chaplin-kramer natcap olympics 4.23.2012
TRANSCRIPT

CROP MODEL I: Overview and possible applications
Becky Chaplin-Kramer NatCap Olympics
4.23.2012

InVEST Crop Model
Foley et al. 2011
• What are the trade-offs in clearing land for agriculture? • What is the value of ecosystem services to agriculture?

InVEST Crop “Model”
• Atypical ecosystem service – heavily managed– market already exists– decades of globally available data!
• Atypical approach (for InVEST)
Crop Yield
Intermediate Inputs
Crop Value
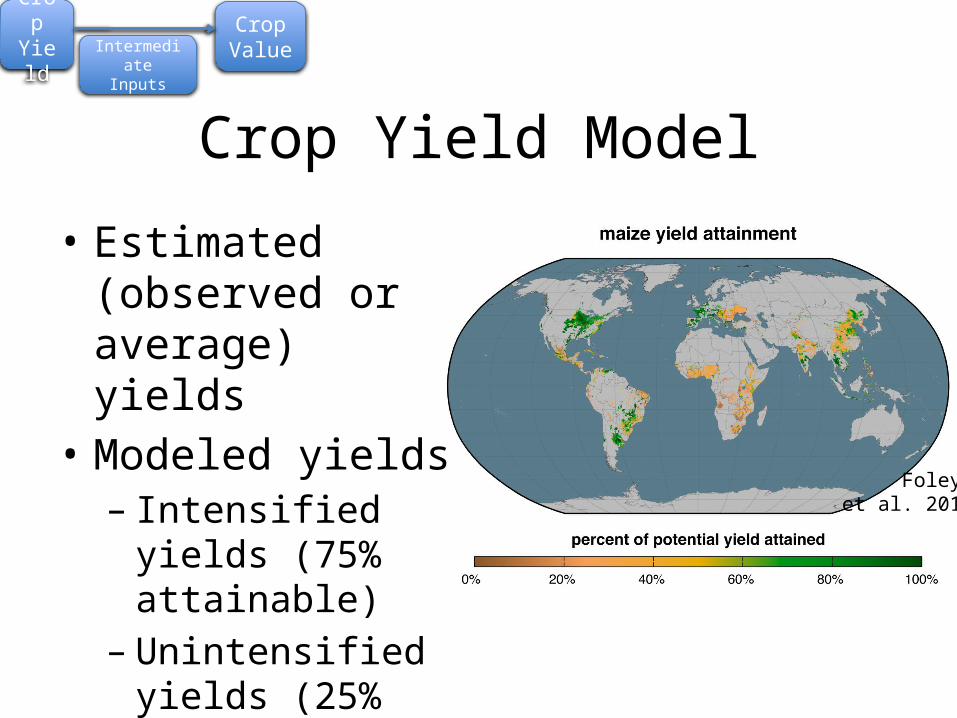
Crop Yield Model
• Estimated (observed or average) yields
• Modeled yields– Intensified yields
(75% attainable)– Unintensified yields
(25% attainable)
Foley et al. 2011
Crop Yield Intermediate
Inputs
Crop Value
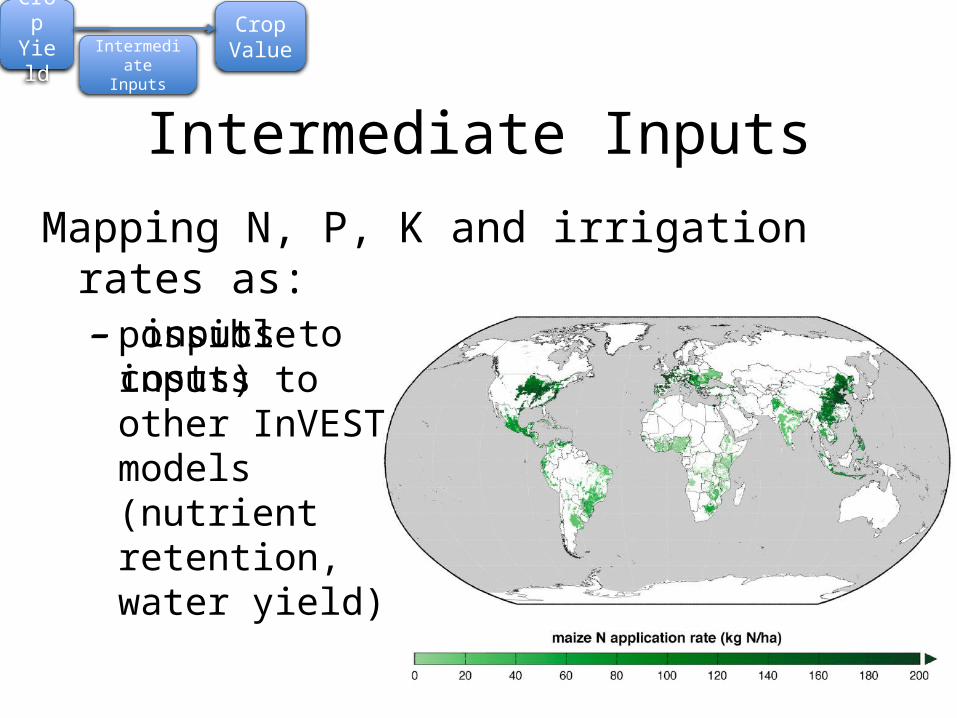
Intermediate InputsMapping N, P, K and irrigation rates as:– inputs to Crop Value model (input costs)– possible inputs to
other InVEST models (nutrient retention, water yield)
Crop Yield Intermediate
Inputs
Crop Value

Crop Value ModelReturns = Revenue – Costs– Revenue = Price x Yield* x Area– Costs:
Crop Yield Intermediate
Inputs
Crop Value

Crop Yield Model, in detail• Start with user-
generated crop map • Get estimated and modeled
(% attainable) yields
Forest
Grassland
Maize
Soy
SoyWheat
Maize
MaizeRiparian
• InVEST data includes: – observed yield maps for 175 crops– climate bin maps for 175 crops– income bin map (World Bank/OECD designation)– climate/income bin average yield table– attainable yield table (Foley et al. model)

Crop Yield Model:Mapping Estimated Yields
first try looking at observed yield maps
if no data, take average for that climate/income
bin HIyield MIyieldLIyield1 8.2 6.1 3.42 7.6 4.9 2.7…
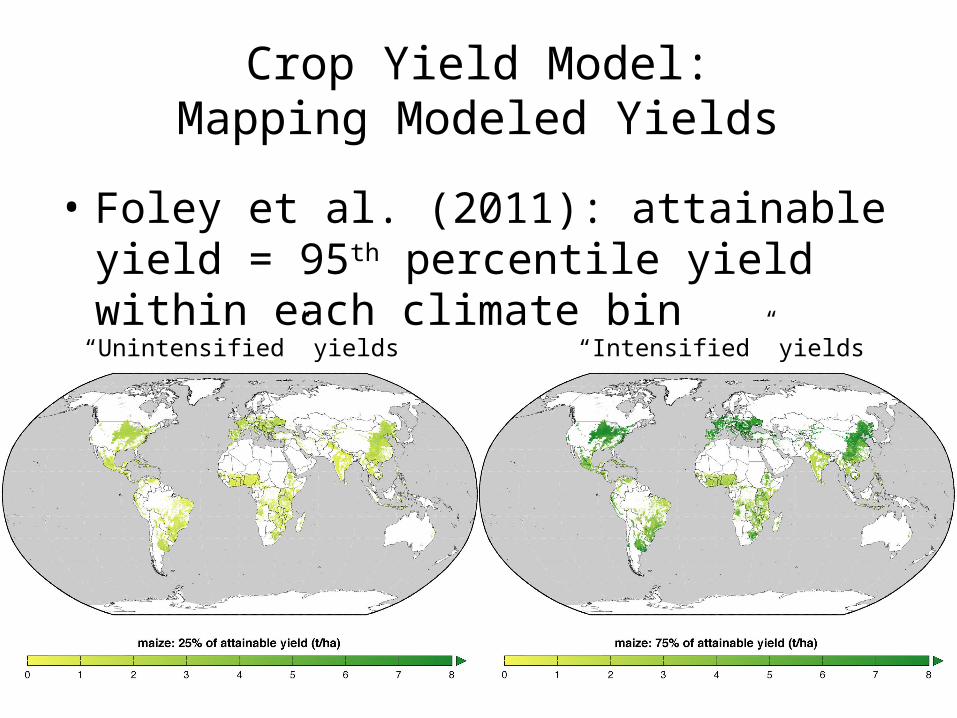
Crop Yield Model:Mapping Modeled Yields
• Foley et al. (2011): attainable yield = 95th percentile yield within each climate bin
“Unintensified” yields “Intensified” yields

Crop Yield ModelNext Steps: Downscaling
• Higher resolution climate data to assign bins on the fly, capture local climate heterogeneity
SSURGO
• Data validation project with local yield datasets, regress other parameters

Crop Model Applications: Unilever Contract
How will changes in corporate crop consumption affect land-use, ecosystem services?
Library of Congress
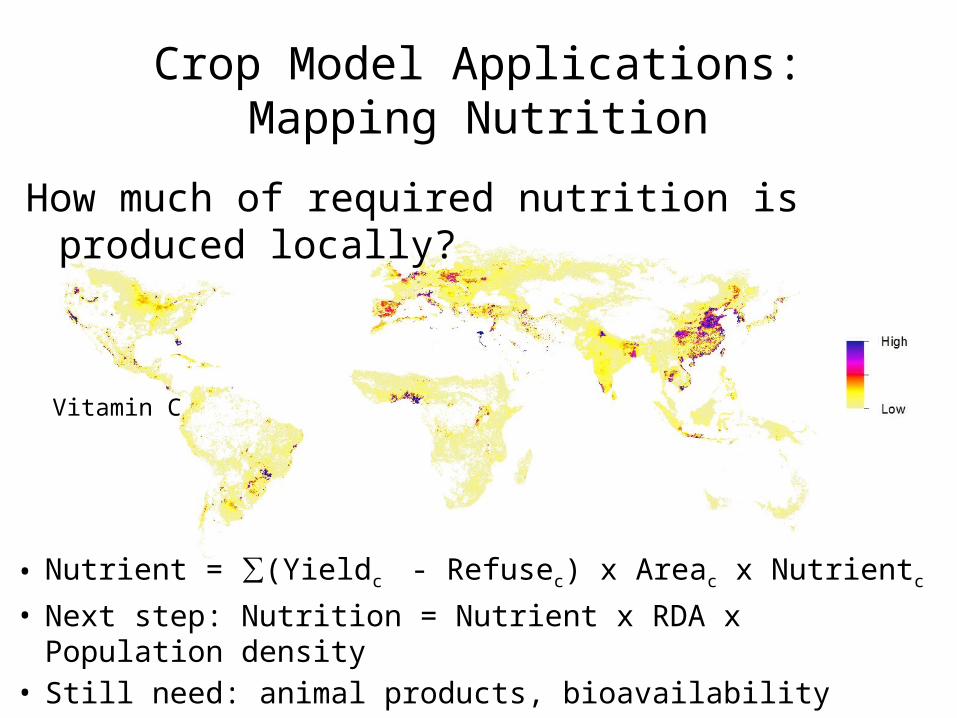
Crop Model Applications:Mapping Nutrition
• Nutrient = ∑(Yieldc - Refusec) x Areac x Nutrientc
• Next step: Nutrition = Nutrient x RDA x Population density• Still need: animal products, bioavailability
How much of required nutrition is produced locally?
Vitamin C

Which areas are most vulnerable, what aspects make them vulnerable, and how to address?
• Poverty, access to markets?• Climate change, variability?• Pollination dependence?• Closing yield gaps, crop-switching, diversification?
Crop Model Applications:Mapping Nutrition Vulnerability