croatia croatia’s eu convergence report: reaching and
TRANSCRIPT

Report No. 48879- HR
CROATIA
Croatia’s EU Convergence Report: Reaching and Sustaining Higher Rates of Economic Growth
(In two volumes) Vol. I: Overview June 2009
Europe and Central Asia Region
Document of the World Bank
Pub
lic D
iscl
osur
e A
utho
rized
Pub
lic D
iscl
osur
e A
utho
rized
Pub
lic D
iscl
osur
e A
utho
rized
Pub
lic D
iscl
osur
e A
utho
rized
Pub
lic D
iscl
osur
e A
utho
rized
Pub
lic D
iscl
osur
e A
utho
rized
Pub
lic D
iscl
osur
e A
utho
rized
Pub
lic D
iscl
osur
e A
utho
rized

CURRENCY AND EQUIVALENT UNITS Currency Unit=Croatian kuna
US$1 =HRK 5.6102 (As of April 30, 2009)
FISCAL YEAR
January 1 – December 31
WEIGHTS AND MEASURES Metric System
ACRONYMS AND ABBREVIATIONS
AAE Agency for Adult Education IEC International Electrotechnical Commission
ADR Alternative Dispute Resolution ILAC International Laboratory Accreditation Cooperation
AVET Agency for Vocational Education and Training
ILO International Labor Organization
CA Company Act IP Intellectual Property CARDS
Community Assistance for Reconstruction, Development and Stabilization
ISO International Organization for Standardization
CEE Central and Eastern Europe OECD Organization for Economic Cooperation and Development
CENLEC
European Committee for Electrotechnical Standardization
LLL Life Long Learning
CES MoSES Ministry of Science, Education and Sports CGPM General conference on Weights and
Measures MoELE Ministry of Economy, Labor &
Entrepreneurship FDI Foreign Direct Investment MS&T Mathematics, Science & Technology FE Fixed Effects NIS National Innovation System FINA Financial Agency PMR Product Market Regulation GDP Gross Domestic Product PPP Public Private Partnership GLS Generalized Least Square R&D Research and Development GNI Gross National Income RE Random Effects GER Gross Enrolment Ratio REER Real Effective Exchange Rates GPI Gender Parity Index SMA Security Market Act HANFA
Croatian Agency for Supervision of Financial Services
SME Small & Medium Enterprises
HP-Filter
Hodrick-Prescott Filter TFP TTO
Total Factor Productivity Technology Transfer Office
HZMO Croatian Pension Insurance Institute UMIC Upper Middle Income Countries HZZO Croatian Health Insurance Institute VAT Value Added Tax IAF International Accreditation Forum VC Venture Capital ICA Investment Climate Assessment VET Vocational Education & Training ICT Information & Communication
Technology WTO World Trade Organization
ICMS Integrated Case Management System ZSE Zagreb Stock Exchange
Vice President: Country Director:
Sector Director: Sector Manager:
Task Team Leaders:
Shigeo Katsu, ECAVP Orsalia Kalantzopoulos, ECCU5 Fernando Montes-Negret, ECSPF Lalit Raina, ECSPF Paulo Guillerme Correa, ECSPF Sanja Madzarevic-Sujster, ECSPE

ACKNOWLEDGEMENTS
This report is the product of a collaborative process involving the Croatian Ministry of Finance and the National Competitiveness Council. The team would like to thank Mr. Ante �igman (former State Secretary, Ministry of Finance), Mr. Zdravko Mari� (State Secretary, Ministry of Finance) and staff at the Ministry of Finance and other line ministries for their comments and support at various stages during the preparation of this report. Early findings of the background work were shared with government and non-government officials, including key donor community representatives, during three workshops organized in the February-June 2008 period. The team is grateful for all the comments received.
The World Bank team was led by Paulo Correa and Sanja-Madzarevic-Sujster. It comprised Allen Dennis, Chris Uregian, Doina Cebotari, Donato De Rosa, Gerald Ollivier, Jan Rutkowski, Jana Kunicova, Jean Louis Racine, Jorge Pena Izquierdo, Matija Laco, Naotaka Sawada, Nina Arnhold, Prathima Rodrigues and Smita Kuriakose. Background papers were prepared by Alvaro Escribano, Velimir Sonje, Ana-Maria Boromisa, Victor Gomes, Vedran Sosic, Sanja Crnkovic-Pozaic, Domagoj Racic, Arjan M. Lejour, Gerard Verweij and Bas ter Weel. Dubravka Jerman, Cristina Velazco-Weiss and Maureen Itepu provided editorial and administrative assistance. The report was undertaken under the guidance of Orsalia Kalantzopoulos, Country Director, Fernando Montes-Negret, Sector Director, and Lalit Raina, Sector Manager. Mark Dutz and Mark Thomas were the peer reviewers of the report. In addition, the team would like to thank Michael Edwards, Andras Horvai, Francisco Ferreira and Andrea Mervar for their comments, advice, and help throughout the course of this work. The responsibility for any data and/or opinion expressed in this paper remains exclusively that of the authors.
Table of Contents Executive Summary......................................................................................................................... 1 1. Introduction ................................................................................................................................. 8 2. The Macroeconomic Setting........................................................................................................ 9 3. Identifying Potential Sources of Growth ................................................................................... 11
A. Convergence and Growth in Croatia........................................................................ 11 B. Potential Sources of Growth..................................................................................... 15
4. Igniting Growth in Croatia: Whither Economic Policies?......................................................... 27 A. Raising Employment ............................................................................................. 27 B. Increasing Productivity ......................................................................................... 33 C. Fostering Technological Progress and Innovation................................................ 44
5. Whither Strategy? Tailoring the Lisbon Agenda ....................................................................... 49 References ..................................................................................................................................... 52 Summary Table – Croatia Growth Strategy: How to Reach and Sustain Higher Rates of Economic Growth ........................................................................................................................................... 53
Figures
Figure 1: External imbalance deepening, in % of GDP................................................................... 9 Figure 2: Credit Growth, 2001-2008 ............................................................................................. 10 Figure 3: Output Per Capita Relative to USA and EU, 1990-2007 ............................................... 11 Figure 4: Real GDP, population and per capita income in Croatia 1994-2007 (1994 prices) ....... 12 Figure 5: Growth Accounting for Croatia (1994-2010)................................................................. 13 Figure 6: Real and Potential Output (HP-Filter)............................................................................ 13 Figure 7: Croatia Median Age ....................................................................................................... 15 Figure 8: Technological Updating: Evidence from the 2007 Investment Climate Survey ............ 16 Figure 9 : Decomposition of Aggregate Productivity in Croatia (Mixed Olley and Pakes) .......... 17 Figure 10: Distribution of TFP in Croatia ..................................................................................... 18 Figure 11: Distributions of Plant Productivity............................................................................... 19 Figure 12: Croatia’s Real Openness (2005)................................................................................... 19 Figure 13 : Croatia Innovation Performance ................................................................................. 20 Figure 14: Estimating the impacts of TFP gains on growth using a dynamic general equilibrium approach......................................................................................................................................... 25 Figure 15 : Croatia Labor Market Mismatch --Shortage of workers with high and specialized skills and excess supply of workers with low and only general skills........................................... 29 Figure 16: Demean Mixed Olley and Pakes Decomposition in Croatia and comparator countries....................................................................................................................................................... 33 Figure 17: IC absolute weights on aggregate log-productivity by blocks of variables.................. 34 Figure 18: Investment Climate contributions on aggregate and average log-productivity............ 35 Figure 19: Product market regulation in Croatia (2008)................................................................ 37 Figure 20:Percentage of Foreign Owned firms Identifying a Problem as a “ Major” or “Very Severe” Obstacle for the Expansion of Business in Croatia .......................................................... 40 Figure 21: Share of Business Sector R&D in Total R&D Expenditure......................................... 44 Figure 22: Research and Development Indicators across Europe and Central Asia...................... 44 Figure 23: Tertiary graduates in science and technology per 1000 of population aged 20-29 years....................................................................................................................................................... 47

Tables
Table 1: Overall Effects of Five Lisbon Targets in Croatia and other European countries by 2025....................................................................................................................................................... 24 Table 2: Decomposition of Export Growth in Croatia: 1995 to 2004 (%) .................................... 39
Boxes
Box 1. Economic Convergence between Croatia and the EU: moving towards a higher long-run path ................................................................................................................................................ 14 Box 2: The Lisbon Agenda’s Framework: Employment and Competitiveness.............................. 21 Box 3: Growth and the Size of the Government............................................................................ 26 Box 4: Croatia’s Social Welfare System’s Impact on Labor Market Participation: An Illustration....................................................................................................................................................... 29 Box 5: European Examples of Good Practice in LLL: Finland and Ireland.................................. 32 Box 6: Diversifying away from Tourism: The Case of Logistics Service..................................... 43 Box 7: Can R&D Laboratories of former SOE’s survive the market test?.................................... 45 Box 8: Private R&D in SMEs........................................................................................................ 45

1
Croatia EU Convergence Report: Reaching and Sustaining Higher Rates of Economic Growth
Executive Summary 1. Croatia’s economic and social achievements over the last decade, when compared to
those of upper middle-income countries, look remarkable. High and sustained rates of economic growth, at a time when the size of population was in decline, resulted in consistent growth in per capita income over the 1994-2008 period. As a result, per capita income converged – and converged fast, partly as a result of the catch-up effect after the dramatic drop in the early 1990s – with levels in the richest economies. More broadly, Croatia substantially improved its macroeconomic framework; kept its social indicators among the highest in Eastern Europe; and is concluding its process of accession to the EU.
2. Croatia’s growth performance in recent years, as impressive as it is, should not be taken for granted. High rates of economic growth sustained for a long period of time are a rare event in the world economy: since 1950, only a handful of countries have succeeded in maintaining a 7-percent growth rate for 25 years or longer. In the case of Croatia, the most evident obstacle for the sustainability of the current growth path is the related large and growing external financial requirement. Current account deficits are a common circumstance of high-growing economies, but international experience shows that foreign savings are an imperfect substitute for domestic savings. In the short term, Croatia’s large current account deficit raises immediate concerns, in particular after the onset of the crisis in international financial markets.
3. Croatia’s growth performance also embeds a “hidden cost” in terms of forgone opportunities of higher living standards. Linear extrapolation of recent average growth rates indicates that Croatia’s per capita income in 50 years would correspond to 60 percent the U.S. level, an outcome reached by EU-27 countries in 2000. As an alternative path, Croatia could reach the same outcome in less than one-third the time by raising its annual growth rates by some 1-1.5 percentage points and sustaining such rates for a little more than a decade. The lower income levels if this change in path is not chosen would imply lower consumption rates, poorer job opportunities and worse prospects for poverty reduction, a burden not only for this but also -- perhaps more importantly – for future generations. Can Croatia alter course so as to reach higher levels of economic growth for a longer period? And if so, what could the government do to help make this happen?
4. Achieving and sustaining higher rates of economic growth in Croatia is possible. The ultimate condition, though, is the expansion of potential output (productive capacity). After an initial drop in the late 1990s, the difference between potential output and actual output narrowed systematically, and output growth rates have been close to or above the estimated growth in potential output since then. With investment ratios at high levels (and an apparently small elasticity of growth in response to increases in investment when compared to the fast-growing economies in the region), a strategy of expanding potential output that is based primarily on further capital accumulation does not seem to be realistic. Beyond this, Croatia’s demographic trends (an aging population, low birth rates, and imminent decreases in working age cohorts) will limit the contribution of labor to the expansion of economic output over the longer term.
5. In order to sustain and accelerate growth in the coming decades, Croatia needs to shift towards a more productivity-based and export-led growth pattern. Croatia needs to raise the productivity of both capital and labor, to deepen trade integration and to foster innovation.

2
This would ameliorate the country’s widening savings–investments gap, relax its external financial constraints and enable the country to benefit from world demand thereby improving long-term growth prospects. As wages in Croatia continue to rise during the convergence process, and as international competition in relatively labor intensive sectors becomes even stiffer than it is already, deeper trade integration will also require the country to develop further its comparative advantage in more skill-intensive and knowledge-intensive sectors.
6. This report discusses how Croatia could sustain and accelerate growth over the coming decades. Four economic policy strategies are discussed: (i) increasing the contribution of labor, by raising the rate of the population’s participation in the workforce and reducing unemployment; (ii) raising total factor productivity (efficiency); (iii) deepening trade integration; and (iv) fostering innovation. The four economic strategies engender different dividends in terms of economic growth. They also create different distributional impacts, and for this reason pose distinct challenges in terms of political economy. Policy measures required for the implementation of each of these strategies, and evidence concerning their expected impact on growth (and political economy implications) is summarized below. While the report discusses the pros and cons of the different policy strategies, identifying a politically feasible “policy bundle” that should be adopted in practice is ultimately a consensus-building exercise that goes beyond the scope of this report.
Increasing Employment: Labor Market Reforms and Education
7. The comparatively poor performance of the Croatian labor market to date shows that effective labor market reforms would likely have a positive impact on economic growth.Croatia’s employment rate (just 57.7 percent of the working age population in 2008) is lower than the average for the EU-27 countries. Croatia’s low labor participation rates and high unemployment are out of line with other transition economies of Central Europe. As a result, the contribution of labor to economic growth in recent years, although increasing somewhat over time, has been meager: less than one point out of the almost five percent growths in the 2002-2007 periods. If Croatia could raise employment rates closer to the EU’s Lisbon targets (including an overall employment rate of 70 percent), the country could increase its income level by an estimated 15.7 percent in 2025 (and 22.9 percent in 2040). This estimated boost in incomes corresponds to more than twice the expected effect for the average EU-27 country. What are the main obstacles to increasing the contribution of labor to economic growth in Croatia?
8. In order to increase the contribution of labor to economic growth, Croatia would need to raise labor participation and reduce unemployment. Recent reforms in the overall system of social security benefits in Croatia, including those related to demographic policy, are discouraging participation in the labor market, particularly female participation, and thus hindering economic growth. Raising labor participation requires, in turn, tackling disincentives for the supply of labor which are embedded in the current social protection system. Beyond this, in order to reduce unemployment, restrictions on the adjustment of firms’ labor force to the business cycle (firing conditions) need to be softened; the cost of labor needs to be better aligned to labor productivity, and the current skills mismatch must be addressed:
• Align the incentives for labor supply by: (i) reviewing the incentives for early retirement implicit in current legislation and developing incentives to bring older workers back to work; (ii) reassessing the effects of unlimited duration unemployment benefits for older workers; (iii) integrating the currently inactive younger population, like war veterans and a large share of social welfare beneficiaries, back to the labor market by assessing and

3
adjusting their benefits; (iv) adopting a more forward-looking migration policy; and (v) assessing the effectiveness of current demographic policies.
• Increase demand for labor by: (i) enhancing labor market flexibility (reducing firing costs, and allowing for more flexible work hours and social security rights); and (ii) containing artificial increases in labor costs (possibly by abolishing the provision on mandatory extensions of collective agreements to all employers in an industry, as well a through the management of the minimum wage);
• Reduce skill mismatches by enhancing the responsiveness of vocational education and training (VET) and the tertiary education system to labor market needs with the provision of (i) better labor market information on occupational trends; (ii) transparent information on employment status of graduates from VET and higher education programs; (iii) functional integration of Croatian universities; and (iv) more flexible adjustments of enrollment quotas in education and training programs.
• Enhance Croatia’s life-long learning (LLL) system by: (i) developing a LLL Strategy encompassing all forms of learning (vs. the current approach limited to adult education); (ii) increasing participation in adult education; (iii) involving employers (as well as students and graduates) in the governance of VET and HE institutions.1
9. The proposed strategy of increasing employment would probably generate the highest returns in terms of raising and sustaining economic growth of any of the policy areas discussed in this report. However, international experience suggests that labor reforms are also likely to be associated with the most complex political economy environment. It is also possible that increased labor participation may lead, according to the report’s estimate, to a decrease in real wages for at least some existing workers, which is likely to generate opposition. Compensation mechanisms are, in theory, a possible solution to political economy bottlenecks, but their design and implementation are subject to uncertainties and other institutional constraints that are reform specific and difficult to generalize. On the other hand, evidence shows broad support in Croatian society for reforms that improve the quality of education and hence the employability of workers.
Raising Productivity: “Creative Destruction” and the Investment Climate
10. In Croatia today, many low and average productivity firms coexist with a smaller group of highly productive plants. This provides an opportunity for raising aggregate productivity. Higher (total factor) productivity could be achieved by (a) bringing the average efficiency of less productive firms closer to the higher productivity ones by improving critical aspects of the investment climate; and/or by (b) the reallocation of resources now poorly used in inefficient firms towards more efficient firms, through an enhanced process of so-called “creative destruction” (faster firm entry and exit). This report estimates that if Croatia could achieve a total factor productivity growth rate of 2.4 percent per year until 2020, roughly a one percentage point increase from the recent rate, the country’s per capita income could be about 9 percent higher than it would have been otherwise. A 2.4-percent TFP growth rate, albeit ambitious, is similar to what was achieved by Ireland in the 1990s.
11. Policies to raise aggregate productivity in Croatia should address both (a) factors hindering market dynamism, and (b) investment climate factors reducing technical efficiency. Decomposition of aggregate productivity in Croatia shows that the contribution of
1 The results of these measures, however, will inevitably take some time to materialize. In such a context, the attraction of highly skilled migrants would be beneficial, especially in sectors in which such workers are in demand. Nevertheless, no overarching migration policy exists.

4
allocative efficiency (the relative share of the more productive firms in total output) to aggregate productivity in Croatia is inferior to that in other countries that have emerged from import substitution regimes (e.g. Brazil and India), suggesting that major gains are still to be obtained by improving allocative efficiency. In addition, though, the report identifies 15 out of more than 120 possible variables related to the Investment Climate in Croatia that are significantly affecting average firm productivity. These factors include: (i) the time required for a firm to obtain an import license; (ii) the skills of labor force; (iii) the extent to which workers in the production process are using computers, and (iv) web-use. Together, factors like these offer a set of priorities for policies aiming at improving the technical efficiency of Croatian enterprises. In that respect, the following economic policies are recommended:
• In order to strengthen the process of “creative destruction”, and foster enterprise restructuring and market dynamism, Croatia needs to (i) re-ignite the privatization process (and improve corporate governance in remaining state owned enterprises, reducing the level of interference in commercial decisions); (ii) reduce state-aids for declining sectors and streamline the bankruptcy process to improve exit conditions; (iii) improve product market regulation (with the full implementation of regulatory impact assessment requirements and elimination of unnecessary government-generated barriers to entry); (iv) liberalize entry into the service sector (particularly retail and infrastructure); and (v) complete market reforms in the agriculture sector.
• In order to improve the investment climate and foster average productivity gains, Croatia needs to (i) reduce the time required to obtain a license for international trade (especially imports); (ii) enable access to ICT capital by SMEs (possibly with special emphasis on lagging regions) and (iii) increase labor skills (in the short-term by a focus on improving VET and LLL, but also reviewing the obstacles for the provision of training by firms). Streamlining custom clearance is also needed. This is part of the broader EU accession program, and current policies could essentially be deepened. Croatia’s could use the OECD’s experience with policies to facilitate technology adoption (particularly ICT) by SMEs to further enable computer-use by the enterprise sector.
• Further analysis is required of the reasons why the provision of transportation services by the private sector appears (based on enterprise surveys) to be a significant constraint, apparently especially for enterprises with lower market shares and those focused in the domestic and local markets – thus forcing the relatively less efficient use of their “own transportation services”.
• Preliminary evidence on an apparent positive association between access to non-banking finance and total factor productivity at firm level suggests further examination of the role of non-banking financial institutions in the selection of best investment opportunities and thus in fostering growth in Croatia.
12. While major gains are to be obtained, strengthening the process of creative destruction inevitably creates winners and losers, with a risk for the political feasibility of reforms.Sector and regional differences may accentuate the risk of policy reversals, and thought will need to be given to appropriate mechanisms to deal with these risks. Beside standard compensatory mechanisms, one possibility may be to bundle those reforms with (i) those related to the improvement of the investment climate, further enabling the expansion of productive enterprises and thereby the demand for labor and (ii) LLL and VET policies to facilitate the employability of workers, as well as policies to facilitate job-matching.

5
Deepening Trade Integration: FDI and the Supply of Exportable goods
13. Experiences of growth acceleration suggest that a deepening of Croatia’s trade integration could be further explored as an additional source of faster growth and convergence. When measured in real (price-adjusted) terms, Croatia’s trade integration (the share of the value of total exports and imports in total GDP) is around 50 percent, much lower than the nominal value (roughly 100 percent) and than the level in Slovenia, Estonia or Hungary. Several studies (using so-called gravity models) confirm that the country is exporting below its estimated potential. Croatia’s export growth rate, while increasing significantly in recent years (to 17 percent on average in 2002-08), has been consistently below that of other CEE economies.
14. In order to deepen its trade integration, Croatia would need to expand the supply of exportable goods and attract more Foreign Direct Investment (FDI). Obstacles to higher exports are mainly of a microeconomic nature: incomplete corporate restructuring has limited productivity gains in traditional export sectors, as well as diversification towards new products and new markets. In particular, Croatia’s current degree of specialization in tourism exposes it to a highly volatile sector. In addition, econometric analysis indicates that various cross-cutting issues are affecting the propensity of local firms to export, including such factors as: firm productivity, days to clear customs to export, and the availability of a firm’s own transportation. The analysis also confirmed that foreign owned firms are more likely to export. Attracting export-oriented FDI may therefore be a feasible strategy for further diversification of the country’s exports. The suggested policy measures are as follows:
• In order to attract export-oriented FDI, the report concluded that Croatia should (i) facilitate access to land, (ii) address the problem of frequent electricity outages, (iii) improve trade regulations, and (iv) further streamline regulations affecting foreign investment. Surveyed firms also consider the inadequacy of the labor supply, tax rates and tax administration to be among the top 10 obstacles for the expansion of foreign-owned companies in Croatia. In this context, a broader effort to strengthen FDI promotion activities is recommended. The report also explored, as an example of a possible strategy to promote further diversification in the service sector, policy measures that would enable the development of a competitive local logistics industry.
• In order to develop the supply of exportable goods, Croatia needs to (i) improve trade-related services, (ii) raise standards of quality certification, and (iii) reduce logistics costs.An overall strategy to increase the level of information about foreign markets would be beneficial. Croatia’s Metrology, Standards, Testing and Quality (MSTQ) infrastructure needs to be more fully integrated to global norms. As Croatia has an extensive network of transport infrastructure, and public investments in roads have already risen significantly in recent years, the achievement of further efficiency gains in the transport sector is likely to require the continuation of railways restructuring and the mobilization of additional private financing in infrastructure projects.
15. Leveraging the benefits of the global economy is important, even though a possible decline in trade volumes in the context of the current global crisis may limit the benefits from such a strategy in the very near-term. Standard trade policies must be complemented by measures to foster enterprise restructuring and market dynamism, so that exporting firms are impelled to raise their productivity (i.e. shipbuilding), and new, more productive firms enabled to enter the market. Synergies between trade and innovation policies should also be explored, as innovation policies may help export diversification, further trade integration may

6
help technology absorption, and FDI promotion policies could also target R&D-intensive FDI.
Fostering Innovation: Knowledge Commercialization and Use
16. Croatia could further expand and sustain growth by transforming existing knowledge into productivity gains and innovation. The country has a long tradition of scientific activity, but knowledge commercialization is still in the early stages, as indicated for example by the fact that only 6 percent of Croatian firms applied for a patent in the 2005-07 period. Interestingly, this result contrasts with a fairly high level of technology adoption, as suggested by the large share of workers using computers in the production process in 2007 (44 percent, in comparison to 33 percent in China and 15 percent in India). In addition to the low level of patenting, total R&D expenditures are also relatively meager, at approximately 1.0 percent of GDP. This report estimates that, by judiciously increasing the R&D to GDP ratio to 3 percent (the target set by the EU’s Lisbon Agenda), Croatia could increase its income by around 6 percent in 2025 (and 8.2 percent by 2040).
17. In order to foster innovation and technological progress, Croatia’s innovation policy should encourage the commercialization of knowledge. Enabling the private sector to transform knowledge into productivity gains and innovation requires (i) focusing public support to R&D on mobilizing private R&D, (ii) further adjusting the incentive regime for research commercialization, with a view to reducing the current bias against applied research and development, and (iii) encouraging science-based start-ups. Of particular relevance is the supply of researchers and professionals with higher education, an area where the country seems to be lagging behind. At 5.6 percent, Croatia’s share of science and technology graduates in the population is lower than most countries in the region, including Bulgaria, and much lower than the EU average of 13 percent. The main recommendations of the report in the area of innovation policy are the following:
• Increase private R&D: (i) benchmark existing tax-incentives against those in leading innovative economies and assess their impact on the promotion of private R&D, (ii) assess to what extent public R&D activity (given the limited supply of human resources) may be “crowding-out” private R&D, and (iii) consider the option of attracting R&D-intensive FDI in consultation with the FDI promotion agency.
• Improve conditions for collaboration between university and industry by: (i) reviewing criteria for progress in the academic career, (ii) simplifying legal requirements for cooperation, (iii) reassessing the overall incentives embedded in the legal regime (using the Bayh-Dole framework as a reference), (iv) review the benefits provided by BICRO’s SPREAD program, and consider possibly adopting a matching-grant scheme, and (v) promote the development of technology/innovation “brokers” that would help the development of joint-projects to be supported by current programs.
• Enable the start-up of science based companies by: (i) supporting the development of technology transfer offices, (ii) reviewing the regulatory bottlenecks for the development of a venture capital industry in the country, (iii) encouraging market-oriented activities of public research institutes and technology parks, and (iv) promoting the restructuring of public R&D institutes by adopting a system of declining earmarked funding, and introducing researcher-level incentives for diversification of revenues.
• Improve the overall governance structure of Croatia’s National Innovation System (NIS) by establishing a strategy for gradual implementation of a monitoring and evaluation

7
system, consolidating and institutionalizing some of the programs (such as those for the support of the Diaspora), and clarifying the roles of BICRO and the Croatian Institute of Technology.
18. In seeking to foster innovation and technological progress in Croatia, two caveats should be kept in mind. First, because the main challenge is the commercialization of knowledge and not knowledge generation, standard S&T policy-measures should be complemented by selected investment climate reforms that encourage the private sector to demand knowledge (as for example, enterprise restructuring). Second, as innovation will be incremental in nature and not necessarily consist of radical breakthroughs, it would be advisable that S&T policies do not discriminate against, and if possible also support, the less-high technology sectors, including textile, footwear and agriculture, which also need to improve their technological level.
Whither Strategy? Tailoring the Lisbon Agenda
19. While the report does not recommend a comprehensive strategy or “policy-bundle” to be chosen, it does propose a framework for decision-making. Once the set of the “first-best” policies are mapped, policy-makers must identify what policies are politically feasible.Next, politically feasible strategies need to be checked for their consistency with the overall objective of raising and sustaining economic growth. Third, politically feasible and consistent reform-packages need to generate institutional requirements that are commensurate with the existing institutional endowments of Croatia.
• One critical factor is how to minimize the risk of reform reversals: policy-makers should take into account the appropriateness of the timing and sequencing of the reforms, as well as the credibility of the mechanisms adopted to implement them and to compensate the potential losers over time.
• When deciding which of the politically feasible measures are to be adopted, policy-makers need to take into account the several ways through which policies in one area complement or contradict objectives in other areas, generating different net impacts on declared goals.
• Reform implementation is an institution-intensive activity and strong institutions are a scarce resource in transition economies. Adopting strategies for which institutional requirements are not commensurate with existing institutional endowments would increase the likelihood of reform reversal.
20. Applying the described framework to the four strategies considered in this report seems to lead to a near-term focus on deepening trade integration and fostering innovation,while measures related to expanding labor participation and employment could be adopted more gradually with a long-term perspective. This tailored version of the Lisbon Agenda would be valid for a possible growth strategy based on tax-reduction (as discussed in more depth by the 2008 Public Finance Review). By strengthening Croatia’s international competitiveness, these measures would better position the country to fully benefit from EU Accession and to better manage the effects of the global financial crisis.
• In addition to the policy measures directly prescribed for deepening trade and fostering innovation, the following complementary policy initiatives would be required:

8
- Advancing enterprise restructuring (privatization) and increased market competition (improving product market regulation and de-regulation).
- Improving the supply of (selected) skills by possibly reviewing migration rules for labor market segments where the skills-gap is binding; adjusting the life long learning system to evolving market needs and to transferable skills, and encouraging labor training by firms.
• Political resistance to measures associated to the proposed strategy is likely to be comparatively low, with the exception of enterprise restructuring efforts. Compensatory policies for workers negatively affected by enterprise restructuring should be considered.
• Preliminary evidence on the positive association between access to non-banking finance and total factor productivity suggests further examination of the role of non-banking financial institutions in the selection of best investment opportunities and thus in fostering growth in Croatia.
1. Introduction 21. Croatia’s economic and social achievements over the last decade, when compared to those of other upper middle-income countries, look remarkable. The country managed to consolidate macroeconomic stability while maintaining social development indicators among the best in Eastern Europe. EU accession negotiations were further advanced and full membership is expected around 2011. High and sustained rates of economic growth (around 4.6 percent annually in real terms), over a period when the size of the population was declining, translated into consistent increases in per capita income throughout the 1994-08 period. As a result, Croatia’s per capita income converged -- and converged fast -- with levels in the richest economies. The country’s unemployment rate, normally among the highest in the region, also declined over the last few years.
22. The sustainability of Croatia’s recent growth performance should not, however, be taken for granted. High rates of economic growth sustained for a long period of time are a rare event in the world economy. In the case of Croatia, the most obvious obstacle to sustaining the current growth path is the economy’s large and growing reliance on external financial flows. While the current crisis in global financial markets will eventually be overcome, tightened international liquidity (and increased risk aversion on the part of investors) are likely to persist into the medium-term. More generally, international experience shows that foreign savings are an imperfect substitute for domestic savings.
23. If Croatia could improve on its recent growth performance relatively moderately, the country could within a few years benefit from substantially higher living standards.Linear extrapolation of recent average growth rates indicates that Croatia’s per capita income in 50 years would correspond to 60 percent of the U.S. level, an outcome reached by EU-27 countries in 2000. Alternatively, Croatia could reach the same outcome in less than one-third of the time if it could raise its growth rate by 1-1.5 percentage points and sustain such rates for a little more than a decade. Absent such an improvement, the lower income levels would imply lower consumption rates, fewer job opportunities and poorer conditions for poverty reduction. These, in turn, may raise regional inequalities and feed discontent among younger generations, threatening social cohesion.
24. Could Croatia reach and sustain higher levels of economic growth? And if so, how could the government help? Achieving and sustaining higher rates of economic growth in
9
Croatia is possible, but to do so (as recovery from earlier underutilization of productive capacity is completed) will require expanding the country’s productive capacity (or potential output) itself. Croatia needs to shift towards a growth pattern that is based more on increases in productivity. The country also needs to target a more export-led growth pattern that will help to alleviate its external financial constraints. In turn, as Croatian wages rise in future, and as international competition in labor intensive sectors becomes keener, the pursuit of deeper trade integration will also require developing the country’s comparative advantage in more knowledge-intensive sectors.
25. This report discusses how Croatia could sustain and accelerate growth in the coming decades. It is composed of two volumes. Volume I -- Overview Report summarizes and articulates the key findings of the report, while Volume II – Full report deepens the analysis of selected topics and presents them in self-contained chapters.
26. The remainder of this Overview Report is organized in four sections. The second section addresses the macroeconomic setting and the short-term challenges posed by the global financial crisis. Croatia’s growth pattern in the last decade is analyzed in the third section with the purpose of identifying potential sources of growth acceleration. Section four presents the economic policies that would be required to ignite those potential sources. Finally, section five explains that, while the report discusses the pros and cons of different policy strategies, identifying an overall “policy bundle” that should be adopted in practice is ultimately a consensus-building exercise that goes beyond the scope of the study.
2. The Macroeconomic Setting 27. The external economic environment for transition economies deteriorated markedly in 2008. The outlook for 2009 is exceptionally uncertain. In addition to slowing demand for exports, capital flows to transition and developing countries have fallen dramatically relative to the highs of 2007 (from US$928 billion to an estimated US$165 billion in 2009). The pricing of emerging market risk has altered correspondingly. The spread between the Emerging Markets Bond Index (EMBI+) and US Treasury bills had risen from 239 basis points at end-2007 to around 700 basis points at the beginning of 2009, to ease again from April. This increase in part reflects current financial volatility but may also reflect rising risk aversion towards emerging market assets.
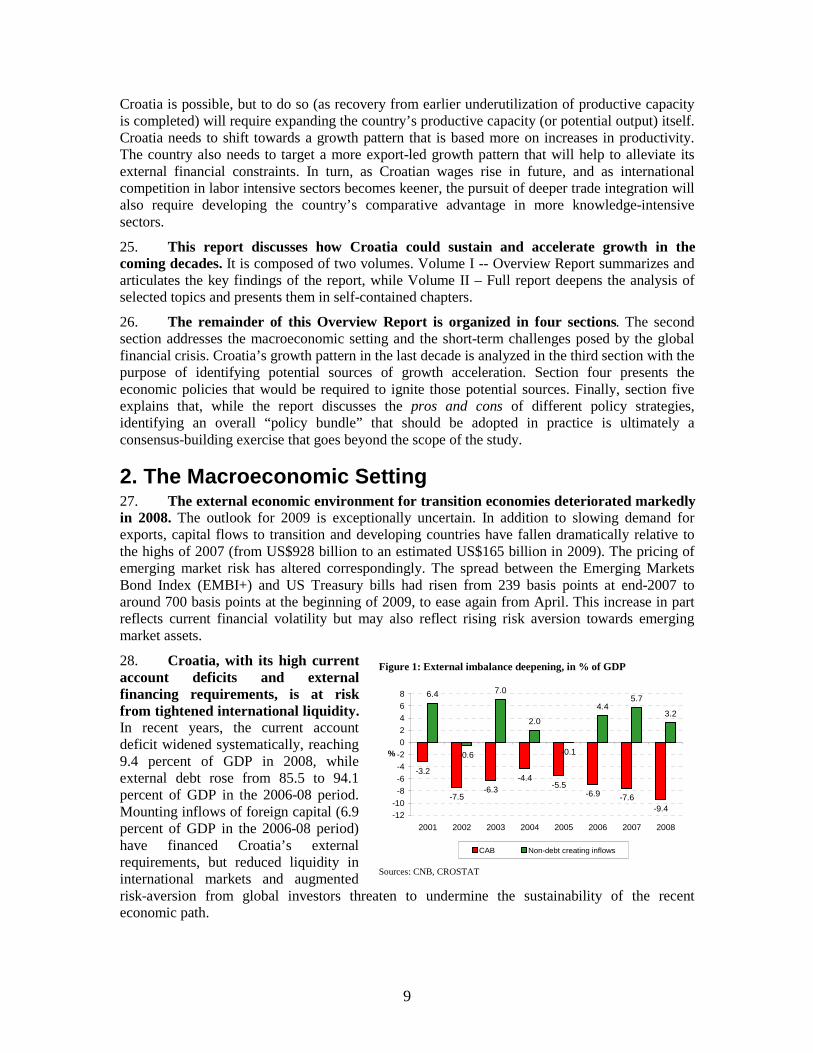
28. Croatia, with its high current account deficits and external financing requirements, is at risk from tightened international liquidity. In recent years, the current account deficit widened systematically, reaching 9.4 percent of GDP in 2008, while external debt rose from 85.5 to 94.1 percent of GDP in the 2006-08 period. Mounting inflows of foreign capital (6.9 percent of GDP in the 2006-08 period) have financed Croatia’s external requirements, but reduced liquidity in international markets and augmented risk-aversion from global investors threaten to undermine the sustainability of the recent economic path.
Figure 1: External imbalance deepening, in % of GDP
-3.2
-7.5-6.3
-4.4-5.5
-6.9 -7.6-9.4
6.4
-0.6
7.0
2.0
-0.1
4.45.7
3.2
-12-10
-8
-6
-4
-2
0
2
4
6
8
2001 2002 2003 2004 2005 2006 2007 2008
%
CAB Non-debt creating inflows
Sources: CNB, CROSTAT

10
29. Croatia’s high external financial requirements are caused by domestic as well as foreign factors. Croatia’s sizeable external imbalance has been caused to a large extent by the expansion of domestic demand, especially private consumption, fueled in turn by credit expansion. In this sense, Croatia’s current account deficit reflects a growing structural savings-investment gap. In recent years, lower export growth,
reflecting a slowdown in the EU economies, together with the higher costs of imports, caused by the increase in commodity prices, also contributed to increase in the trade deficit.
30. The central bank’s efforts to reduce the external vulnerability of the economy have achieved some results. A combination of monetary, administrative and prudential measures, aimed at reducing both macroeconomic and financial vulnerabilities, curbed credit expansion and reduced foreign borrowing. Recent data indicate that the growth in banks’ lending to the non-banking sector slowed down substantially. More specifically, lending denominated in (or indexed to) foreign currency declined from 71.7 percent of total loans in 2006 to 66.8 percent in February 2009 (although this trend may reverse later in 2009). At the same time, however, the corporate sector’s external indebtedness increased, partly because corporate clients increased borrowing directly from parent banks abroad to circumvent local restrictions. On another track, the authorities’ action to increase insurance coverage on bank deposits to EUR 56,000, combined with the establishment of the Stability Fund by non-bank financial institutions, have contributed to securing depositors’ trust and confidence.
31. Bank loans denominated in or indexed to foreign currency accounted for around 67 percent of all loans to households and enterprises at the beginning of 2009. At the same time, the share of bank deposits denominated in or indexed to foreign currency stood at around 63 percent (total open foreign currency positions of banks may not exceed 20 percent of banks’ regulatory capital according to CNB regulations). The banking system’s capital adequacy ratio corresponded to 14.2 percent of risk-weighted assets at end-2008, well above the 10 percent target. The loan-to-deposit ratio hovered around 100 percent. The share of non-performing loans in the total has been declining over recent years, remaining below 4 percent at end-2008. The profitability of the banking sector has remained relatively high, as indicated by a fairly stable return on average assets of 1.6 percent at the end-2008.
32. As has occurred in many countries in the region, inflation has been pushed up substantially by the rise in food and energy prices. Surging prices for food and imported energy, together with strong domestic demand, contributed to an increase in inflation in 2008. Inflation accelerated significantly in the second half of 2007 to 5.8 percent year-on-year in December 2007 and further to 8.4 percent in July 2008, after which it started easing. At the end of 2008, inflation stood at 2.9 percent year-on-year. Food prices increased by nearly 11 percent in the first half of 2008; almost double the overall rate of inflation. Moreover, hikes in administered utility prices, most of which are controlled by local governments, also added to higher inflation. In addition to prudential and credit control measures to reduce external vulnerability, the CNB
Figure 2: Credit Growth, 2001-2008
D M J S D M J S D M J S D M J S D M J S D M J S D M J S D
Introduction of "16% rule"
Introduction of MRR (24%)Increasing of MRR (to 30%, 40% and 55%)
Introduction of SRR (55%) Introduction of "12% rule"
Lowered reserve requirement to 14%
Abolished MRR
Source: CNB

11
relied on an exchange rate anchor to suppress emerging inflationary pressures. Indeed, inflation declined by the end of 2008, but then started to strengthen, as a result of increases of administrative prices, mainly prices of gas and health services. The CNB also reduced the volume of foreign exchange interventions in order to prevent creation of excessive liquidity; only two FX interventions were held in 2008. In addition the CNB reduced the volume of repo auctions and increased the interest rate at repo auctions.
33. The Croatian economy is coping with a highly volatile and declining regional economic environment. An appropriate monetary policy response, taken at a time of overheating across all Eastern Europe, coupled with a somewhat modest fiscal policy response, did not manage to reduce Croatia’s external vulnerabilities ahead of the outbreak of the global financial crisis. The outlook for 2009 growth is subject to high uncertainty, mostly on the downside, in view of the multiple channels through which the global crisis impacts the domestic economy, including external demand for Croatian goods and tourism services, and foreign capital inflow, including flows between the domestic commercial banks and their mother banks overseas. Domestic policies will be an important element in preventing stronger contraction. Rebounds of investment and consumption will be the key determinants of any recovery in Croatia.
34. While it may not be possible to keep fiscal policy cyclically neutral in the coming years, negative impacts on growth could be reduced by improving the quality of public expenditures. The 2008 Croatia Public Finance Review (PFR) report presented a series of measures that could be adopted to reduce public expenditures while maintaining or improving the impact of social policies and selected public investments. The present global context and Croatia’s growth ambitions make this agenda particularly important.
3. Identifying Potential Sources of Growth
A. Convergence and Growth in Croatia
35. The current financial crisis risks distorting discussion on potential growth and convergence. The authors are of the opinion that that the crisis is a temporary situation, and although it has an influence on the short-term prospects, it does not change the long-term convergence path. The calculations that follow were done with adjusted data that mimic the behavior of Croatian economy before the crisis.
36. Croatia’s per capita income has converged towards EU and US levels over the last 15 years. By 2008, Croatia’s per capita income (US$15,600) corresponded to around 1/3 the U.S. income level compared to 1/4 in 1992, a progress that is better than that of the average upper middle income country (UMIC) and similar to the average result of the EU27. The speed of convergence in the period (1.38 percent per year) is superior to the EU27 (0.34 percent),
Figure 3: Output Per Capita Relative to USA and EU, 1990-2007
20
25
30
35
40
45
50
19901991
19921993
1994
19951996
19971998
19992000
20012002
20032004
20052006
2007
GDP p. c . re lativ e to US
GD P p .c . re la tive to
%
Source: Staff Elaboration

12
an expected result given Croatia’s lower initial per capita income levels.2 This said, Croatia’s per capita income relative to the US in 2007 has yet to recover fully to its pre-transition level.
37. Per capita income growth in Croatia in recent years reflected a combination of economic and demographic factors. After a significant economic decline between 1990 and 1993, Croatia managed to sustain a steady rate of economic growth during the 1994-2008 period (4.3 percent in real terms on average).3
On the demographic side, Croatia, like the other Central and Eastern European countries, has been experiencing a declining population. The modest total decline in population of 1.2 percent between 1989 and 2007 reflected the combination of a steady decrease in birth-rates, a slightly rise in mortality, and net outward migration.4
38. A striking characteristic of Croatia’s growth pattern is the limited contribution of total factor productivity to growth. Standard growth accounting for the 1994-2007 period shows that total factor productivity provided the largest contribution to growth only during the 1994-2001 period, while growth was driven by capital accumulation in 2001-07 (interestingly, the contribution of labor to growth increased substantially between these two periods, probably reflecting the labor market reforms introduced in 2003).5 The limited contribution of TFP to growth in Croatia represents a sticking difference with most countries in Eastern Europe and the ECA region more generally, for which growth in the last two decades has been essentially driven by productivity gains resulting from the advancement of the structural reforms.
39. Given this growth pattern, are recent growth rates (and thus Croatia’s convergence path) sustainable? As Figure 6 indicates, Croatia’s economy seems to be reaching a level of full capacity utilization (based on available resources and efficiency levels). In such a context, sustaining growth rates ultimately requires expanding the economy’s potential output. If Croatia is to accelerate growth and thus convergence (e.g., in line with a target of adding 1-1.5 percentage points to the pre-crisis 4.3 percent growth rate),6 the country will need to (i) use more economic resources (capital, labor), (ii) use them more efficiently, and/or (iii) innovate.
2 When controlled for the initial income level and other country characteristics, Croatia’s convergence performance is still slightly above the average for a selected sample of comparable countries A significant number of countries with similar (e.g. Estonia, Lithuania) or higher (Ireland) initial per capita income achieved better results in the same period. (See Volume II of this report). 3 The exception is the 1998-99 period, when a large drop in output resulted from the combination of events that included a banking crisis and increased political instability, and 2008 with the beginning of the financial crisis. 4 The Homeland War (1991-1995), which increased the mortality rate, and the 1999-2000 recessions, which raised migration, accentuated this trend. 5 Indeed, employment increased approximately 8.2 percent between 2002 and 2006, compared to a drop of 15 percent in 1994-2001. 6 Simply extrapolation of the growth accounting exercise before 2009 shows a potential output growth rate of 4.9 percent per year, just about the recent rates. A second technique utilized in order to calculate Croatia’s potential output, the Hodrick- Prescott Filter, yields a similar result (with a growth estimate between 4.6 and 4.8 percent). See Volume II of this report.
Figure 4: Real GDP, population and per capita income in Croatia 1994-2007 (1994 prices)
4.2
4.3
4.4
4.5
4.6
4.7
0
5,000
10,000
15,000
20,000
25,000
30,000
35,000
40,000
45,000
50,000
1994
1995
1996
1997
1998
1999
2000
2001
2002
2003
2004
2005
2006
2007
GDP (EUR) per capita - left GDP (mil. EUR) - left
Population (mil.) - right
Source: CROSTAT

13
Figure 5: Growth Accounting for Croatia (1994-2010)
-1
0
1
2
3
4
5
6
1994-2001 2002-2006 2007-2010 (p)
Total factor productivity
Capital
Employment
Source: Staff Elaboration
Figure 6: Real and Potential Output (HP-Filter)
-1.0
1.0
3.0
5.0
7.0
9.0
19
95
19
96
19
97
19
98
19
99
20
00
20
01
20
02
20
03
20
04
20
05
20
06
20
07
20
08
20
09
20
10
real GDP
potential GDP
Note: By factoring in the recent declines in growth due to a global economic decline, potential output declines by one percentage point Source: Staff Elaboration
40. In order to speed up the convergence process, Croatia does not need to generate spectacular growth rates. Relatively small increases in growth rates sustained for a long period would suffice for this purpose, as illustrated by the case of Taiwan. Between 1985 and 2000, Taiwan’s average per capita income growth of 6.2 percent raised the country’s per capita income from one third to one half of the U.S. levels. Taiwan’s growth acceleration in the last fifteen years of the last century generated, therefore, a level of economic convergence that would take Croatia twenty additional years to achieve.7
41. Accelerating and sustaining growth, however, are not trivial tasks for policy-makers. One empirical review of episodes of sustained growth acceleration in the last fifty years found that such events were more frequent among lower-income countries, but argued that they were not necessarily preceded or accompanied by major changes in economic policies, institutional arrangements, political circumstances or external shocks. The implication of this study is that sustained episodes of growth accelerations seem to be highly unpredictable.8 In addition, on the theoretical side, the research on the determinants of economic growth is broadly inconclusive, with competing explanations leading to equally plausible alternative recommendations.9 As a result, the economic policies that should be prescribed are not immediately evident (see Box 1).
42. This report seeks to identify a limited number of economic strategies (policy goals and corresponding measures) that would be sufficient to raise and sustain economic growth rates in the country (hopefully for a sufficiently long period of time). In the remaining of this section, the report identifies the “potential sources” of economic growth and estimates the potential growth effects once these sources are ignited. Section 4 identifies the policy measures and reforms that would ignite such potential sources.
7 Apart from speeding up economic convergence, higher economic growth would further augment employment opportunities and -- as inactive individuals feature prominently among the poor in Croatia -- would contribute to further reduction in poverty rates. It would also raise job opportunities for the relatively large and impoverished rural population, addressing a challenging issue for Croatia and several neighboring countries. Higher economic growth would also help to finance the social security requirements of an aging population, an additional area of concern for all Eastern European countries. 8 See Haussman, R.; Pritchett, L. and Rodrik, D .: “Growth Accelerations”. Mimeo, 2005. 9 See Dixit, A. Evaluating Recipes for Development Success. The World Bank Research Observer, vol. 22 (Fall 2007).

14
Box 1. Economic Convergence between Croatia and the EU: moving towards a higher long-run path
Evolution of GDP per capita with respect to the Euro Area
0
20
40
60
80
100
1990 1995 2000 2005 2010 2015 2020 2025 2030
Euro area GDP per capita level
Current rate of convergence
Rate of convergence
after the shock
Structural shock
%
Source: WDI, World Bank 2008 Illustration of economic acceleration
-5
-3
-1
1
3
5
7
9
1990 1995 2000 2005 2010 2015 2020 2025
Structural shock
Steady state
Structural shock
Current long-run path of
Convergence to 0% grow th steady
state
%
Current rate of grow th
Source: WDI, World Bank 2008 Economic acceleration and production possibilities frontier
Source: Staff Elaboration
K
K1
K2
K3
K4
K5
K6
K7
K8
K9
K10
L1 L2 L3 L4 L5 L6 L7 L8 L9 L10
K
L
Productively innef icient
points
The production psossibilities frontier (PPF) maps the maximum output that can be produced w ith the available resources
Productively ef icient points
Continious shifts of the PPF are
required in order to sustain
economic grow th
Source: WDI, World Bank 2008
The long-run path of economic growth in Croatia is a central point in the economic agenda of politicians and policy makers. In spite of the sustained long-run path of economic growth observed during recent years,there still exists concern about whether the current growth path is enough for Croatia to achieve convergence with respect to the EU in a reasonable period of time.
The exponential characteristic of long-run economic convergence can exacerbate differences in living standards across countries. For instance, with a continuation of recentrates of growth (within the range 4%-5%),Croatia would double its GDP, reaching the level of the Euro Area, within 28 years. However, if Croatia were able to attainrates of growth similar of those of the Asian Tigers, say 8%, itwould converge to the level of the Euro Area in only 10 years. The first chart at the right illustrates this contrast.
The starting point for moving to a new steady stategrowth path is a positive structural change (shock) that would ignite Croatia’s “growth reserves”. Such a change could be triggered by good economic policies, and/or improvements in the terms of trade among other events. One challenge in identifying such “good” economic policies, however, is that the economic literature is often not conclusive in terms of the possible prescriptions. Indeed, the main conclusion of a recent review of 80 episodes of rapid and sustained economic growth in the last half century is that growth accelerations are very hard to predict (See Haussman, Pritchett and Rodrik, 2005).
In the absence of new sources of dynamism, the existence of diminishing returns causes attrition in growth, leading in the long-run to a steady-state with average rates of growth equal to zero. This is illustrated in the second chart at the right. One way to break out of such a steady-state would be by continuous economic accelerations or structural shocks shifting the economy’s production possibilities frontier towards the right, e.g. the adoption of new technologies that improve marginal productivity, and/or generate a process of “creative destruction” in the Schumpeterian sense. Another way would be by directly increasing TFP via improvements in the business environment that enable a more efficient use of economic resources.
Sustaining economic growth in this context implies continuous shifts of the production possibilities frontier (PPF) towards the right. This is illustrated by the third chart to the right. Once Croatia is producing efficiently on the frontier, the adoption of new innovations, improvements in the terms of trade or productivity enhancements that displace the PPF represent the only ways to sustain growth.

15
B. Potential Sources of Growth
43. While current demographic trends impose clear limits to the expansion of output in Croatia, the comparatively low employment rate points to the existence of untapped labor reserves. The size of Croatia’s population is stagnant and is expected to decline in the near future (a total decline of 6.1 percent is projected over the 2005-2025 period, and a decline of 19 percent by 2050).10. As in other countries in the region, birth rates are low and the population is aging. Extrapolation of current trends indicates that the median age is set to increase from 40.6 years in 2005 to 45.4 in 2025 and to 48.7 in 2050 (Figure 7). As a result, the share of school- and working-age cohorts in the population is declining. While this is bad news for Croatia’s future labor force as a percentage of the total population, it is important to note that Croatia’s employment rate (only 57.7 percent of the working-age population in 2008) is one of the lowest among the EU-27 countries. This low employment level reflects a combination of high unemployment (around 9 percent) and low participation rates (66.3 percent). These rates are out of line with those in comparable economies, and suggest that there is significant scope to increase the workforce as a share of the working-age population.
44. Investment levels in Croatia are already high when compared to economies with similar levels of development. Investment ratios increased for more than 10 years, averaging 26 percent of GDP in 2003-08, which is high by the standards of Upper Middle Income economies, and indeed higher than some fast-growing economies in the region (as for instance Latvia). A striking puzzle is that the impact of Croatia’s relatively high levels of gross fixed capital formation (GFCF) on growth has been comparatively limited.11 Why is this? One possible line of explanation looks at the composition of investment in Croatia, and points to the fact that investment in machinery and equipment corresponded on average to only 38 percent of total investment. This observation might explain the modest impact of investment on growth, to the extent that it provides evidence of limited technological upgrading (as older vintages of capital tend to be less productive) or of lower levels of embodied-technology content (as less knowledge-intensive equipment is less productive).12 Yet, firm-level evidence for the non-agricultural sector (Figure 8) shows that Croatia compares favorably with its international peers on a series of proxies for technological upgrading. We therefore conclude tentatively that the limited acquisition of machinery and equipment may more likely reflect low investment in machinery and equipment in Croatia’s still-sizeable agriculture sector.13
10 UN World Population Prospects: the 2006 Revision Population Database 11 The estimated elasticity of growth to GFCF in Croatia is roughly 2/3 lower than the value for Latvia between 1995 and 2005. The difference is quantitatively significant: Croatia would have achieved an average growth rate 1.4 points higher (6.3% instead of 4.9%) if the value of its elasticity was the same as that for Latvia. 12 Different types of equipment constitute widely varying fractions of the overall capital stock across countries. The standard deviations of investment shares are always large relative to the cross-country means. Furthermore, this enormous heterogeneity is systematically related to per capita income, as the correlations with income of the various investment shares are large in absolute values (see Caselli (2004)). 13 The predominant role played by small family-owned farms and a fragmented structure in land ownership are not conducive to investment in machinery and equipment. Given the relatively large share of the Croatian workforce still employed by the agricultural
Figure 7: Croatia Median Age
Source: UN World Population Prospects: the 2006 Revision Population Database

16
Figure 8: Technological Updating: Evidence from the 2007 Investment Climate Survey
0.0
10.0
20.0
30.0
40.0
50.0
Braz
il200
3
Bul
garia
2005
Cze
ch20
05
Hun
gary
2005
Pola
nd20
05
Rom
ania
2005
Rus
sia2
005
Slov
akia
2005
Sou
thK
orea
2005
Tur
key2
005
Ukr
aine
2005
Vie
tnam
2005
Cro
atia
2005
Cro
atia
2007
CEE
Average Share of Imported Inputs
% Worker Use Computer, Country Comparison
17.0
17.5
21.0
22.6
24.4
30.3
33.3
44.3
0.0 70.0
India2002
Brazil2003
Cambodia2003
SouthAfrica2003
Serbia2003
Montenegro2003
China2003
Croatia 2007
Technology Licensing Country Comparison
4.8
7.6
11.0
11.6
12.4
13.7
15.7
44.0
0 100
Turkey2005
Slovenia2005
Estonia2005
Ireland2005
SouthKorea2005
Bulgaria2005
Romania2005
Croatia2007
Web Use with Clients & SuppliersCountry Comparison
50.7
55.0
63.0
65.2
84.8
88.8
95.0
0 100
Bulgaria2005
Croatia2007
Romania2005
Turkey2005
Ireland2005
Slovenia2005
Estonia2005
Note: Share of firms that reported having introduced a new technology; licensed a new technology; or that use email with clients and suppliers and/or use the web for interacting with clients and suppliers.
Source: World Bank Enterprise Survey Database and 2007 Croatia Investment Climate Survey.
45. Decomposition of aggregate productivity trends shows the low contribution of improvements in allocative efficiency to growth in aggregate productivity, indicating one major untapped source of growth in Croatia.14 What this means is that more productive firms do not account for a relatively larger share of output in Croatia, as would normally be expected in a well-functioning market economy. International comparison indicates that the contribution of allocative efficiency is much lower in Croatia than in a number of other countries, as for instance India and Brazil, where an import substitution regime had created a significantly protected economy by the 1980’s (and hence the potential for economic reforms to raise productivity via contraction or elimination of inefficient firms and expansion of efficient producers). This observation of the low contribution of allocative efficiency is a uniform result that applies regardless of variations in the size and age of firm, region, and industry. This said, the machinery
sector (roughly 14 percent), the low stock of capital in agriculture represents a serious limitation to capital deepening and labor productivity increases. 14 Based on Olley and Pakes decomposition.

17
and equipment industry, medium-sized enterprises, and the Istra region present the lowest contributions of allocative improvements within their respective categories. Another striking result is that the allocation of resources is better in those regions and sectors where the average technical efficiency is lower, and vice versa. As a consequence, the effect of the allocation mechanism in aggregate productivity tends to zero as the average technical efficiency increases.
Figure 9 : Decomposition of Aggregate Productivity in Croatia (Mixed Olley and Pakes)
The productivity used in all graphs is the restricted Solow residual (see appendix on econometric methods) Source: Staff calculations with ICS data
By region
15.1
25.3
5.5
15.6
22.3
19.0
24.8
11.6
0
5
10
15
20
25
30
Indonesia Philippines Sout Africa Chile Brazil Mexico India Croatia
Sh
are
of
allo
cati
veef
fici
cny
on
agg
reg
ate
log
-p
rod
uct
ivit
y
%
2.18
1.94
2.152.07
2.01
2.14 2.11
1.95
1.731.79
1.962.04
1.86 1.87
0.21
0.37
0.11
-0.03
0.28 0.240.23
-0.5
0.0
0.5
1.0
1.5
2.0
2.5
Zagreb andsurroundings
Northern Croatia Slavonia Lika I Banovina Istra I HrvatskoPrimorje
Dalmacija Total
log
(P)
Aggregate log-productivity Average log-productivity Allocative efficiency
By size and age
2.1
2.0
2.1
1.9
2.1
1.9 1.91.8
1.91.9
0.2
0.1
0.3
-0.1
0.3
-0.5
0.0
0.5
1.0
1.5
2.0
2.5
Small (<25 employees) Medium (>=25 & <100employees)
Large (>=100employees)
Young (< 5 years) Old (>=5 years)
Aggregate log-productivity Average log-productivity Allocative efficiency
Lo
g(P
)
Size Age
By industry
International comparison: share of allocative efficiency in aggregate log-productivity
2.11 2.132.07
2.192.11
1.82 1.851.92
1.86 1.87
0.28
0.14
0.34
0.240.28
0.0
0.5
1.0
1.5
2.0
2.5
Food Textiles and apparels Machinery &equipment/metal products
Other manufacturing Total
log
(P)
Aggregate log-productivity Average log-productivity Allocative efficiency

18
46. Empirical evidence suggests that the low contribution of allocative efficiency to aggregate productivity in Croatia is caused by the fact that higher productivity firms do not necessarily command a higher share of total output. In theory, the result that the effect of the allocation mechanism in aggregate productivity tends to zero as the average technical efficiency increases could be the consequence of two alternative causes: i) all firms show similar levels of technical efficiency and/or market shares, or ii) there are high productivity differences but the output is imperfectly allocated
according to the level of efficiency of the firms. In the case of Croatia, evidence points to the second explanation – the inadequacy of resource allocation. The first hypothesis (homogeneity of enterprise productivity) would be difficult to sustain in a world where large TFP differences are frequently observed even in narrowly defined industries (and where
there is ample evidence of market distortions preventing resources to be adequately allocated).15 Note, too, that in those sectors and regions where the average technical efficiency is higher—e.g. machinery and equipment, Lika i Banovina or Istra— the allocation effect is even worse (as the distribution curves for TFP among different firms shown in Figure 10 indicate, the averages of the productivity distribution in the case of the machinery and equipment sector, Lika i Banovina or Istria are all larger than for the case of the whole sample and there is a marked dispersion of productivities in all the cases, especially in Istria and in the machinery and equipment sector).16 Analysis specifically of young firms finds that the paradoxical effect of the allocation of resources is even more marked among them than in the other samples. Although young firms are slightly more efficient than older firms on average, the negative allocative efficiency term for young firms reflects the point that resources are inadequately allocated among them—less productive young firms are using more resources than more productive young firms, suggesting clear inefficiencies in the process of entry and exit, as production concentrates in the less efficient young firms.
47. The corollary of the previous analysis is clear: the creative destruction mechanism which lies at the core of the normal process of productivity growth is as yet weak-to-non-existent in Croatia. When considering productivity in different economies, the efficiency of the average establishment (technical efficiency) matters, but the ability of markets to allocate resources to more efficient establishments (also known as Schumpeterian competition) magnifies the impact of these average gains in aggregate productivity. The productivity distributions shown in Figure 11 indicate that there is great heterogeneity in productivity across plants. The productivity distribution is asymmetric and less spread when compared with a standard normal
15See Baily, Hulten and Campbell, 1992; Restuccia and Rogerson, 2007 and Hsieh and Klenow, 2007. 16 Note that the analysis presented in Figures 10 and 11 makes use of Kernel Density Estimation, which is a non-parametric way of estimating the probability density function of a random variable. That is, given some data about a sample of a population, Kernel density estimation makes it possible to extrapolate the data to the entire population.
Figure 10: Distribution of TFP in Croatia
Note: Epachenikov weighted kernel of restricted Solow residual in logs. Source: Staff calculations with ICS data

19
distribution. However, more important is the fact that the productivity distribution in Croatia is ‘bi-modal’. Most of the firms are concentrated in the section of the distribution corresponding to low and average values of productivity—those labeled regions A and B. There is another (smaller) density peak in region C, representing high productivity firms. The remaining density is in regions D and E, comprising a low share of very highly productive plants. Summing up, in Croatia many low and average productivity firms coexist with a smaller group of high productivity plants. This suggest that major potential may exist for raising aggregate productivity by i) bringing the technical efficiency of less productive firms closer to those in regions C, D and E; and ii) reallocating resources across plants. Figure 11, Panel B illustrates how these two processes could impact the productivity distribution.
Figure 11: Distributions of Plant Productivity
48. Most indicators show Croatia at lower levels of trade integration than comparable countries once country characteristics are taken into consideration. When measured in real terms, Croatia’s trade integration is around 50 percent, half the value observed in nominal terms and below comparable countries such as Slovenia, Estonia and Hungary. Croatia’s export growth rate, while it has been increasing significantly in recent years (to 17.4% on average in 2002-08) has been consistently below those of other CEE economies (Figure 12). Several studies using gravity models confirm that the country is exporting below its estimated
Figure 12: Croatia’s Real Openness (2005)
Greece
Slovenia
Sweden
India
Bulgaria
Croatia
Denmark
EstoniaGermany
Hungary
ItalyLatviaLithuania
Romania Russia
Slovakia
TurkeyPortugal
SpainUK
EU27
Brazil
China
0
110
3000 8000 13000 18000 23000 28000 33000GDP per capita (ppp constant)
Trade (Exports+Imports)(% GDP constant int’l $ ppp)
Source: World Development Indicators
Region AProductivity under
the average
Region BProd. over
the average
Region CLow density
of high productive
plants
Region DScarce density
of very high productivity
plants
Region EVery low
density of highly productive
plants
Notes: Epachenikov weighted Kernel. The productivity measure used is the restricted Solow residual in logs. Source: Staff calculations with Croatia ICS data.
Panel A: Estimate of log-productivity density
(I): Hypothetical change in the productivity distribution after a symmetric increase in the productivity of all firms. (II): Hypothetical change in the productivity distribution if low productivity firms exit the market. Source: Staff calculations with Croatia ICS data.
Note: In Panel B, Scenario (I) represents a hypothetical increase of the technical efficiency of all firms;the direct consequence of such an increase is an almost symmetric displacement of productivity density towards the right. In scenario (II), theless productive businesses from regions A and B exit the market, leaving only those fromregions C, D and E: consequently, the productivity distribution moves towards the right to a greater extent than in scenario (I), since now the lower level of productivity in the population is that of firms of region C. While the increment of aggregate productivity in scenario (I) comes virtually only from the increment of the average log-productivity, scenario (II) improves aggregate log-productivity alsothrough a better reallocation of resources. With the inefficient plants of region A and B leaving the market,the remaining establishments are assumed to gain market share. Resources released by the inefficient firms that exited can now beused by more efficient plants, which translates into welfare gains for the economy as a whole. Source: Staff Elaboration.
Panel B: Hypothetical changes in the productivity distribution

20
potential. This matters, because integration in the global economy has been one of the major ingredients of the successful growth stories of the last 50 years.17 Additional trade integration would enable Croatia to benefit from a world demand and significantly contribute to raise aggregate productivity and living standards.18
49. Croatia performs relatively better in terms of attracting FDI, but there is still room for further expansion. Croatia’s FDI inflows have increased remarkably in recent years, but per capita FDI stock levels (US$ 6,657) are still below those for countries in the region, suggesting some potential for further expansion of FDI in Croatia, particularly in the manufacturing industries. Given that FDI in Croatia has so far been mainly directed to the service sector (notably banking), further diversification to attract more FDI to the manufacturing sector could be expected to bring positive growth effects. By enhancing the quality and quantity of capital, greenfield FDI could contribute to reducing the savings-investment gap and help raise growth prospects.
50. Despite apparently quite high rates of technology adoption at firm level, Croatia’s innovation capacity is relatively low when compared to similar countries. The 2007 EU’s Innovation Scoreboard, for example, shows that Croatia’s overall innovation status lags behind the EU average and has been falling further behind over the past five years19. Croatia’s 2007 Summary Innovation Index (SII) is 0.23 (out of 1), one of the lowest in the sample, higher only than those for Romania (0.19), Latvia (0.18) and Turkey (0.08). Croatia is grouped among the catching up countries that have scores significantly below the EU average. With the exception of Croatia, all other countries in this group have seen their scores increase towards the EU average over time (Figure 13).
51. Firm-level evidence suggested a more nuanced picture, with Croatian firms close to or ahead of firms in peer countries in terms of their self-reported innovation. Sixty-eight percent of Croatian manufacturing firms reported that they had introduced new or significantly improved products in the past three years, according to the World Bank 2007 Investment Climate Survey (ICS). This is significantly higher than the next most innovative country according to this metric (Ireland, where 50 percent of the firms are innovating). The same survey, however, shows that only 6 percent of the Croatian enterprises surveyed had applied for a patent in the last three
17 One of the regularities found in the study of 80 recent episodes of sustained growth accelerations is the existence of an open trade regime (see Hausmann, Pritchett and Rodrik (2005)) 18 Controlling for reverse causality and omitted variable problems, another recent work estimates the impact of real openness to aggregate productivity to be 1.23 on average. See Alcala, F. and Ciccone, A. 2004. “Trade and Productivity”. The Quartely Review of Economics, vol. 119 (2).19 The EIS comprises a set of diverse country measures (25 for the 2007 scorecard) considered relevant to innovation. The measures cover both “input” and “output” aspects, including education, R&D spending, sales of new products, patents issued, etc. Details are available from the website of PRO INNO Europe.
Figure 13 : Croatia Innovation Performance
Source: European Innovation Scoreboard 2007.

21
years (7 percent of the firms in the manufacturing sector and 4 percent in the services sector).20 Croatian firms are engaged in innovations that are new to the firm but probably not new to the market, and in most cases not sufficiently novel to warrant IPR protection.
52. In summary, we have identified four main potential sources of growth in Croatia: (a) increasing labor participation; (b) raising productivity (particularly allocative efficiency); (c) deepening trade integration; and (d) unleashing Croatia’s innovative potential. In broader terms, these strategies mirror the framework established by the Lisbon Agenda, the strategy envisaged by the EU in 2000 to make Europe the “most dynamic economy in the world” (see Box 2).
53. In the next section we will present estimates of the impacts of reaching selected Lisbon Agenda targets on Croatia’s per capita income. In addition, we will present the results of a simulation of the growth pattern in Croatia under a higher productivity growth pattern (the Ireland scenario).
20 Further, exporting firms applied for a larger number of patents, with 17 percent of exporting firms having applied for a patent in the last three years as opposed to one percent of the non-exporting firms.
Box 2: The Lisbon Agenda’s Framework: Employment and Competitiveness
In 2000, the Lisbon European Council placed employment and competitiveness at the center of the EU’s agenda by setting the goal of making Europe the most dynamic economy in the world (the Lisbon Agenda). The underlying diagnosis was that the low pace of economic growth and job creation in Europe, compared to the US, was caused by slower productivity growth, due in part to comparatively lower rates of technological progress and innovation. According to this diagnosis, Europe had benefited less than the US from the ICT revolution and had invested much less in R&D and innovation. In 2005, this overall approach was confirmed by the launching of the “Strategy for Growth and Jobs,” also known as the updated Lisbon Agenda. This contains over one hundred policy, regulatory and financing recommendations, as well as voluntary quantitative reform targets, among which:
• the conclusion of the internal market for services (with application of the “country of origin” principle – which states that services across borders are to be governed by the laws of the country from which the service is provided) to advance the free flow of services among countries and reduce barriers;
• the reduction of administrative burdens; • improving human capital, which calls for attaining the following targets by 2010: an average rate of no more than 10 percent
early school leavers; 85 percent of the 22 year olds to have completed at least upper secondary education; the percentage of low-achieving 15 year olds in literacy to have decreased by at least 20 percent relative to 2000; the average level of participation in lifelong learning to be at least 12.5 percent of the adult working age population (25-64 age group); and the total number of graduates in mathematics, science and technology (MS&T) to increase by at least 15 percent, while gender imbalances decrease;
• a three percent share in GDP for R&D-expenditures; and • a 70 percent employment rate relative to the population of working age.
The importance attached to raising EU competitiveness and the salience of EU-wide measures for achieving this goal is shown by the very large financial endowments appropriated for EU-wide competitiveness and innovation-related programs. The EU Financial Framework for 2007-2013 set the level of appropriations for the EU-wide competitiveness and cohesion agenda at approximately � 350 billion. This includes: (i) the 7th Research Framework Program (� 54.6 billion), which seeks to refocus research conducted in the EU toward areas more relevant to the needs of European industry, and promote the free movement of researchers and growth of R&D-driven regional clusters; (ii) the Life Long-Learning Program (� 6.9 billion), an over-arching structure that is built on four pillars or sub-programs that award grants and subsidies to projects that enhance the trans-national mobility of individuals, promote bilateral and multilateral partnerships, and improve quality in education and training systems through multilateral projects encouraging innovation; and (iii) the Competitiveness Framework or CIP (� 3.6 billion over the period 2007-2013), that brings together the former specific Community programs in the fields of entrepreneurship, SMEs, industrial competitiveness, innovation, information and communication technology (ICT), environmental technologies and energy efficiency. Source: Staff Elaboration

22
C. Estimating the Gains from the Lisbon Agenda
54. The economic impacts of achieving selected targets of the Lisbon Agenda were estimated using WorldScan, a general equilibrium model of the world economy.21 The model was used to simulate the effects on income, consumption, exports and real wages of reaching five selected Lisbon targets by 2015. The impacts were evaluated for years 2025 and 2040 relative to a baseline scenario. One important feature of this model is that estimations take into account the different (and sometimes contradictory) feedback effects of different domestic economic policies (for instance the impact of higher employment and higher human capital on wages), as well as international feedbacks (such as effects of international R&D on the local economy). The main findings for each of the five Lisbon targets are the following (see Table 1):
• Internal market for services: The completion of the EU’s internal market for services is estimated to raise Croatian exports 4.3 percent above their level in the baseline scenario in 2025 (and 4.7 percent above the baseline in 2040). Internal market completion would raise Croatia’s GDP 0.8 percent above the baseline in 2025, and 1.6 percent above the baseline in 2040.
• Reduction of administrative burden: A 25 percent reduction in the administrative burden in all EU countries is estimated to increase GDP by 2.4 percent in Croatia by 2025. This effect remains the same in 2040.
• Increasing human capital: Increasing the level of human capital in Croatia could have a long-run benefit but short-run costs of investment. In 2025, the model projects that Croatian GDP would be 0.3 percent higher and that in 2040 it would be up by 2.0 percent.
• Increasing R&D: Increasing Croatia’s annual R&D expenditures from 1.0 percent of GDP to 3.0 percent could potentially have a strong effect on income. In 2025, the model suggests that Croatian GDP could be 6.0 percent higher than in the base case, and in 2040 8.2 percent higher than the base.
• Increasing employment: The effects on GDP of increasing the employment level in Croatia to 65.5 percent are the largest found in the study. GDP is estimated be 17.7 higher than in the base case by 2025, and 22.9 percent higher in 2040.22
The cumulative impact of the above five effects on Croatia GDP, estimated at 26.7 percent in 2025, is large by any standard. By comparison, the GDP in the EU-27 countries could increase by 13.3 percent in 2025 if all five goals are met. Poland and Romania could reach similar overall results to those for Croatia, while the effect on the Czech Republic would be more modest. As Table 1 below shows, the strongest impact on GDP levels, both in Croatia and in the EU-27 as a whole, derive from reaching the employment goal (column (1)) and the R&D target (column (5)). The GDP effect of reaching the R&D target occurs, in turn, through higher labor productivity, due to a larger stock of R&D capital and domestic and spill-over effects. The human capital target, the effects of opening up the services market and the reduction in administrative barriers contribute significantly less to the GDP increase. The benefits of meeting the human
21 Lejour, A.M. et al (2008): “The Economic Effects of the Lisbon Agenda Targets: The case of Croatia”. Background Paper for this Report. 22 Note, however, that one reason for this large effect is that it relates to the gross benefits of increasing employment, without netting out any associated costs, which are very hard to model.

23
capital targets for Croatia are modest because the main impact comes from reaching the lifelong learning goals and not so much from the other human capital enhancement measures, since the Croatian labor force is already relatively well-educated.
55. The model suggests that Croatian exports could rise by 36.8 percent above the base case in 2025 if the five Lisbon Agenda targets are met, illustrating Croatia’s untapped trade potential. Indeed, comparison of the estimated trade effects and the income effects suggests that the total export effects are potentially larger than the GDP effects. Because the effects of R&D on GDP depend significantly on Croatia’s trade integration (via the spill-over effect from R&D performed by third countries), this result could be further improved by policies that foster the country’s deeper integration into the global economy. About one third of the rise in exports results from the R&D component, an outcome much higher than those for other new member countries, and a result which reflects Croatia’s R&D gap.23 Reaching the employment targets would also increase exports (by 14 percent), but would contribute less than R&D to raising the exports specifically of high-tech manufacturing (11.2 percent as compared to an effect of 62 percent from the R&D target); the exports of the different manufacturing sectors respond more or less equally to an increase in the employment rate, as distinct from the larger effect of meeting the R&D goals on exports from the high-tech sector.
56. The effects on consumption per capita would be smaller than those on GDP.Assuming the five goals are met, aggregate consumption per capita in Croatia is estimated to increase 21.7 percent above the base case by 2025. The lower impact on consumption compared to GDP is caused by negative terms-of-trade effects for most of the Lisbon policies, in particular for the R&D targets. The productivity increases induced by higher R&D expenditures exert a downward pressure on producer prices. Thus, export prices decrease while import prices do not change substantially, in particular for the imports from outside the EU. For Croatia and the other countries, the increase in employment contributes more to consumption growth than the increase in R&D spending. The variation in consumption effects over countries and policies is similar to the GDP effects.
57. Real wages in Croatia would also grow, though more modestly than GDP, by 2025. Real wages in Croatia are estimated to be 3.6 percent higher than under the baseline scenario. This increase is comparable to that for the EU-27 but low when compared to the Czech Republic and Romania. The increase in real wages follows from higher productivity, largely induced by higher R&D expenditures. The policies for improving human capital, the trade-effects of opening up the services markets and the reduction in administrative burdens would contribute moderately to increasing real wages. Overall, the positive effects of these four policies are partially offset by the reduction in real wages induced by the increase in the employment rate. The increase in the employment rate is projected to have a negative effect on real wages, because marginal productivity declines as the employment target is reached by employing relatively less skilled (typically unskilled) workers.
58. Overall, these results seem to confirm that the Lisbon Agenda policies, particularly the employment and R&D targets, represent a major element for accelerating and sustaining growth in Croatia. Naturally, the scale of the specific estimated impacts reflects in part the magnitude of the existing gap between Croatia’s indicators and the respective Lisbon Agenda targets. Policies to reach these targets will entail costs, which may lead to less funding for the provision of other important public goods, an effect that would need to be taken into account. Beyond this, it seems very unlikely that countries that are lagging far behind the Lisbon goals will catch-up on these policies sufficiently to reach the targets by 2015.Yet, if large benefits indeed
23 More broadly, the increase in total exports in Croatia is only lower than the result for Finland.

24
emerge on the horizon, pursuing these policies beyond 2015 may nevertheless be an appealing proposition.
Table 1: Overall Effects of Five Lisbon Targets in Croatia and other European countries by 2025
Employment Human
capital
Services Administrative
burden
R&D Total
(1) (2) (3) (4) (5) (6)
GDP
Croatia 15.7 0.3 0.8 2.4 5.8 26.7
Poland 15.6 0.4 0.4 2.0 5.4 25.2
Czech Republic 5.5 0.1 1.5 1.7 4.9 14.3
Romania 11.0 0.7 0.3 1.7 11.7 27.2
EU-27 6.3 0.4 0.1 1.5 4.5 13.3
Consumption volume
Croatia 14.0 0.3 1.2 2.2 2.8 21.6
Poland 13.8 0.3 0.6 1.8 3.2 20.6
Czech Republic 4.8 0.1 1.6 1.5 3.0 11.5
Romania 9.6 0.6 0.5 1.5 7.7 21.2
EU-27 5.6 0.4 0.5 1.3 2.2 10.4
Export volume
Croatia 14.0 0.3 4.4 2.2 12.2 36.8
Poland 16.6 0.5 3.3 2.1 8.2 33.7
Czech Republic 6.8 0.2 4.9 1.8 6.7 21.9
Romania 9.5 0.5 2.1 1.5 13.6 29.6
EU-27 6.3 0.4 2.8 1.4 7.1 19.3
Real wages
Croatia -4.6 0.3 1.0 2.2 4.8 3.6
Poland -5.8 0.3 0.6 1.8 5.5 2.0
Czech Republic -2.0 0.1 1.4 1.5 4.8 5.9
Romania -7.7 0.6 0.4 1.5 14.6 8.4
EU-27 -3.4 0.4 0.6 1.4 5.7 4.6 Note: The numbers in columns (2)-(5) are relative changes from the policy simulations in the previous column in the year 2025. In column (1) and (6) the numbers are relative changes from the baseline.
Source: Lejour, A.M. et al (2008): The Economic Effects of the Lisbon Agenda Targets: The case of Croatia, Background paper for this report.
59. The importance of increasing total factor productivity for accelerating and sustaining economic growth in Croatia should not be underestimated. In order to illustrate this point, the report uses a basic dynamic general equilibrium model to simulate different balanced growth paths in Croatia under three different assumptions about TFP growth. The first scenario (the base-case) is the simple extrapolation of the current balanced growth path. The second scenario (an arbitrary reduction of 10 percent in the TFP growth rate) intends to capture the permanent effect on aggregate TFP of misallocation of resources. The third scenario uses the recent growth rate of TFP in Ireland (2.4 percent on average) as a benchmark of the potential impact of microeconomic reforms and market-friendly institutions. 24
60. Economic policies that induce faster productivity growth could reduce the income gap between Croatia and the U.S by almost 20 percent by 2020. Figure 14 shows the results (in terms of relative income to the US). In the “base-case” scenario, Croatia’s income would correspond to 40.2 percent of the US by 2020; in the case of a negative shock (second scenario) it would reach 39.4 percent; while in the case of “positive policies” with an impact comparable to that seen in Ireland, Croatia’s income is projected to be 47.6 percent of US income. The
24 See Gomes (2008) .

25
difference between the third and first scenarios may be interpreted as an illustration of the “economic convergence gains” from economic policies that induce TFP gains in Croatia. The challenge, thus, is to identify the economic polices that could unlash the sources of productivity growth in Croatia.
61. While the size of the government has not been analyzed by this report, it is important to stress that a broader consideration of growth strategies in Croatia should take into account the gains that lower taxation levels (implying also reductions in government spending) could bring for long-term growth (Box 3 presents a simulation of the potential gains from lower tax rates).
62. The different sections of Chapter 4 analyze which economic policies could contribute to igniting the potential sources of economic growth in Croatia identified in this section, namely: (i) increasing the contribution of labor (raising employment); (ii) increasing (total factor) productivity; (iii) deepening trade integration; and (iv) fostering technological progress and innovation. Finally, a summary of the report’s key recommendations is presented in Chapter 5.
Figure 14: Estimating the impacts of TFP gains on growth using a dynamic general equilibrium approach
28
32
36
40
44
48
2004 2005 2006 2007 2008 2009 2010 2011 2012 2013 2014 2015 2016 2017 2018 2019 2020
Years
Rel
ativ
eIn
com
eto
US
A(%
)
high growth TFP scenario
Croatia’ current TFP path
Croatia’ 10% ofcurrent TFP
Background paper for this Report Source: Gomes.V (2008) Economic Growth and Predictions for Croatia: A General Equilibrium Analysis.

26
Box 3: Growth and the Size of the Government Choosing between Present and Future Generations (the intergenerational trade-off)
Figure 1: Taxation matters in Croatia -- a dynamic general equilibrium approach
Detrended real GDP per working age person in Croatia
85
90
95
100
105
110
115
120
125
1995 1997 1999 2001 2003 2005 2007 2009
1990
=100
data
tax model
base model
Figure 2: Estimated Marginal Tax Rates 1997 -2007
0.00
0.05
0.10
0.15
0.20
0.25
0.30
0.35
0.40
0.45
0.50
1997 1998 1999 2000 2001 2002 2003 2004 2005 2006 2007Years
Tax
Rat
e
consumption tax
labor tax
capital tax
Figure 3: Simulating the Effects of Tax Reduction –a dynamic general equilibrium approach
28.00
32.00
36.00
40.00
44.00
48.00
52.00
2007 2008 2009 2010 2011 2012 2013 2014 2015 2016 2017 2018 2019 2020
Years
Rela
tive
Inco
me
toU
SA
(%)
high growth TFP scenario
Croatia’ current TFP path
Croatia’ current path - 2% tax reduction
high growth TFP scenario - 2% tax reduction
Figure 1 shows that a dynamic general equilibrium model offers a better fit to Croatia’s recent growth trajectory once taxation is taken into account than without allowing for tax effects. This result is consistent with research on the business cycle in the United States (McGrattan, 1994). The representative agent's total income tax rate is defined as the ratio of individual income tax revenue to pre-tax household income (i.e. the sum of wages and salaries, property and entrepreneurial income, and the operating surplus of private unincorporated enterprises). Figure 2 shows our estimates for marginal tax rates in Croatia during 1997-2007. We then assume reductions in consumption tax and labor tax, by 2 percent per year each year until 2020. This corresponds to a cumulative reduction of the labor tax from 35.4 percent in 2007 to 27.2 percent in 2020, and a reduction of consumption tax from 32.7 percent to 27.2 percent in 2020. This reduction in tax is estimated to produces a gain of output per head of working age population in 2020 of 9.8 percent in the base case, and almost 10 percent in the high growth rate scenario in which the Lisbon targets are met.
Figure 3 shows the impact of the assumed tax reductions on Croatia’s growth trajectory. What does it take to generate this effect? Reducing taxation levels in Croatia ultimately requires consistent reductions in public expenditures. Croatia’s overall tax burden -- at around 35 percent of GDP -- is some three percentage points higher than the EU-10 average. However, public debt sustainability suggests that reduction of taxes requires that, in tandem, appropriate expenditure reduction and restructuring measures are taken. Avenues for spending restructuring are presented across seven sectors in the recently published in the 2008 Croatia Public Finance Review. The Review shows, in particular, the impact of social transfers, particularly pensions, in total expenditures. With an aging population, the share of elderly receiving pension benefits already exceeds the percentage of working-age population. Pension benefits are a challenge throughout the ECA region, but the situation in Croatia is particularly exacerbated by a relatively higher dependency rate, generous benefits, and lower employment levels. The Review also discusses different alternatives to tackle the issue, including gradually raising the retirement age for women to 65. As politically complex as social security reforms may be, the current situation reflects an implicit choice in favor of the living standards of current generations to the detriment of the living standards of future ones.
Source: Staff Elaboration based on Gomes, V. (2008): Economic Growth and Predictions for Croatia: A General Equilibrium Analysis (a background Paper for this Report), and World Bank (2008): Croatia Public Finance Review.

27
4. Igniting Growth in Croatia: Whither Economic Policies?
A. Raising Employment
63. Labor market participation rates for prime age men in Croatia are unusually low. A low retirement age and very limited penalties for early retirement discourage the participation of workers in the labor market. Disincentives related to the War Veteran benefits also contribute to this result. In terms of foregone growth opportunities, this phenomenon may be particularly costly: beneficiaries of such types of programs are most likely to be primary earners in the most productive age group. By contrast to the retirement pension and War Veteran benefits, the system of unemployment benefit does not seem to have a substantial effect on effective labor supply. The low benefit replacement rate (25 percent) and the limited benefit duration imply that labor supply disincentives created by the unemployment benefit system are limited. Moreover, less than ¼ of the unemployed actually receive unemployment benefits. The system may well encourage people to work in the informal sector and simultaneously claim unemployment benefit, but it probably creates relatively little in the way of incentives for total labor force withdrawal (see Box 4).
64. The pension system encourages early labor force withdrawal for a variety of reasons. First, a policy of early retirement was deliberately pursued in the 1990s to ease labor market tensions associated with the transition. Second, Croatia has had a low official retirement age - 60 years for men and 55 for women until 2008 (from 2008 the retirement age has been 65 years for men and 60 for women). Third, the system exhibits a low pension accrual factor, which implies that deferred retirement is not sufficiently rewarded and early retirement is not much penalized.25 In addition, the minimum pension regulations significantly reduce incentives to work longer, especially for low-wage workers. Fourth, there are high income replacement rates for certain specific categories of workers, including police and army personnel, and war veterans. Finally, lax rules governing the award of disability pensions seem to have made this part of the system prone to abuse.26 Summing up, the design of the pension system is an important factor behind the low labor force participation of older workers of working age.
65. Another factor affecting unemployment rates is the relatively high cost of labor.This report finds that real wages and productivity together explain almost half the variation in labor demand within the manufacturing sector27. Wages relative to labor productivity are high by regional standards (Slovenian wages, for instance, are nearly 30 percent higher than those in Croatia, but Slovenian labor productivity is 45 percent above Croatian levels, making Slovenian workers more competitive). Labor taxes are not especially high by regional standards and cannot account for the high labor costs in Croatia compared with its regional competitors.28 The explanation for the misalignment between wages and productivity levels may possibly be the emergence of an “insider dominated” wage-setting process. In such a process, public sector
25 Until 2008 persons who retired before reaching the official age received a pension that was 24 percent lower than those who waited to the official age. Since 2008 the difference was reduced to a mere 9 percent, making early retirement even less costly. 26 A detailed description of the social protection system in Croatia and the analysis of its labor market effects is contained in Crnkovi�-Pozai� (2008). 27 Escribano et al. (2008) “Croatia Investment Climate Assessment”,. Background Paper prepared for this report. 28 The tax wedge -- the difference between total labor cost to the employer and the net take-home pay of the employee, expressed as a percentage of the total labor cost – is close to 40 percent in Croatia, lower than in Hungary (45.8%), the Slovak Republic (42.0%) or Slovenia (42.6%): all countries where the unit labor cost is lower than in Croatia. So, apparently unit labor cost in Croatia is high for reasons other than labor taxation.

28
wages determine reservation wages that diffuse to the rest of the economy through the negotiations of unions, whose bargaining power is strengthened by strict employment protection.
66. The scope for reduction of the tax wedge is limited. Although labor taxes are not high by the standards of other European economies, they are high by global standards given Croatia’s income level. This is because, by global standards, labor taxes are generally high in all of the EU10 new member countries (and higher than in other countries at comparable income levels). For example, compared to Croatia’s estimated tax wedge of about 40 percent of total labor cost, the tax wedge accounts for only 17 percent in S. Korea and only 24 percent in Ireland, a country with a much higher income level. High labor taxes in transition economies of Central Europe, including Croatia, are largely due to the design of their public pension systems, specifically to the high coverage and relatively high benefit replacement rates. In contrast, in countries with low payroll taxes, public pensions systems are less generous, either in terms of coverage (Korea), or in terms of benefit replacement rates (Ireland). Thus, there are limits to Croatia’s ability to reduce payroll taxes while maintaining the pension system as presently designed.
67. Another factor hindering employment is the restrictive labor market regulations, despite the improvements achieved by the 2003 reform. A revised Labor Code was adopted in 2003, relaxing some of the constraints imposed by the previous Code. However, evidence shows that firing redundant workers still involves high procedural and monetary costs. Firing costs are not only higher than in countries with well-performing labor markets, such as Denmark or Ireland, but also higher than in Croatia’s regional competitors, such as Bulgaria, Hungary, Serbia or Slovakia. Hiring costs are also high. Croatia also scores poorly on other dimensions of labor market flexibility. For illustration, the difficulty of hiring index is higher in Croatia than in all EU10 countries except Romania and Slovenia, and is also substantially higher than in well-performing EU15 economies, such as Denmark, Ireland, and the UK.
68. Skills mismatches, as indicated by the abnormally high share of long-term unemployment, are a third cause of high unemployment rates. There is a deficit of workers with tertiary and secondary technical education, and at the same time a surplus of workers with less than secondary (including vocational) and general secondary education. In term of occupations, there is a strong demand for professionals, technicians, and skilled workers (in services and in industry); at the same time that there is an excess supply of clerks, salespersons and workers in elementary occupations (see Figure 15).
69. Croatia’s skills-gap is related to the following factors: (i) limitations in the educational attainment of its labor force, (ii) deficiencies in the provision of vocational education and training (VET), including an inadequate match between the courses offered and the needs of the labor market, (iii) little participation in life long learning, and (iv) rigidities of tertiary education in adapting to the needs of the economy. School life expectancy (the number of years of education that a representative child can expect to receive), at 13.5 years in 2006,29 compares unfavorably with the EU-27 average (15.6 years) and other international peers (e.g. 16.7 years in Slovenia). The share of skilled permanent workers in Croatia, while similar to the level in Ireland (66 percent), is below Estonia (77 percent) and Romania (83 percent).30
29 EDSTAT 30 2008 Croatia ICS and World Bank Enterprise Database.

29
Box 4: Croatia’s Social Welfare System’s Impact on Labor Market Participation: An Illustration
Croatia’s welfare system discourages participation in the labor market at the lower-end of the earnings scale. Most benefits are contingent on the beneficiary being in a status of unemployment. Additionally, the system’s loose administration renders it open to abuse, as many different benefits can be combined, thus increasing the individual’s or family’s reservation wage. For instance, a family of 5, with both parents possessing low qualifications, is better off living on welfare (with the parents registered as unemployed) than engaging in the formal economy. With the father reaping unemployment benefits of HK 1,200 per month, and the unemployed mother receiving social welfare of HK 400 per month, plus child benefits in the amount of HK 274 per child and HK 1,663 for the third child (and assuming that both parents earn from HK 1,000 to HK 1,420 tax free from engaging in the informal economy), the family would be better off staying out of the formal sector. Their total income amounts to HK 6,506, which is more than the actual net wage of those with a primary school education working in the formal economy. If one were to look into the benefits offered to veterans, a similar conclusion could be reached. In sum, the current legislative framework creates a culture of dependency on benefits, especially at the lower end of the earnings spectrum.
Source: Based on Crnkovi�-Pozai�, S. (2008). “Effects of Legislation, Policy and Institutions on Labor Force Participation.” Background Paper for this Report.
70. The mismatch between labor supply and demand is partially caused by an equivalent imbalance in the provision of VET. Vocational schools usually provide training on the basis of their own availability of teachers, courses and facilities, and only to a limited extent according to students’ choices (and thus market needs). Appropriate information on the demand for training and skills has been lacking, while funding is approached in a rather traditional way, with the private sector playing only a minor role. The completion of VET education at higher levels can translate into a wage premium in Croatia as in some other countries, but the impacts of the current VET on the actual employability of trainees have yet to be established.
71. Lifelong learning has mostly been tackled through adult education policies, a view that underestimates the importance of learning-to-learn in early years and throughout all education levels. The focus of policy has been mostly on a social-inclusion approach, together with some emphasis on the retraining of unemployed workers (through active labor market policy measures). The upgrading of the competencies of those already employed, however, has largely been left to employers and employees. Yet, in 2008, only 28 percent of Croatian firms provided formal training for their permanent workers (as compared to 33 percent in Romania and 65 percent in Estonia). Limited provision of training by private firms adds to the limited skill levels and the supply-demand mismatch, limiting the contribution of human capital to economic growth in Croatia.
Figure 15 : Croatia Labor Market Mismatch --Shortage of workers with high and specialized skills and excess supply of workers with low and only
general skills.
Labor Shortage and Surplus by Education2007
Elementary
Basic vocational training
Secondary technical
Secondary general
Tertiary
-30
-20
-10
0
10
20
30
40
50
60
70
�
shortage
surplus
Note: The index of (relative) skill shortage is defined as (vi/ai – 1)*100, where vi is the share of job vacancies in the skill category i in the total number of vacancies, and ai is the share of job seekers in the skill category i in the total number of job seekers.
Source: Labor Force in the Republic of Croatia, Second Quarter of 2007, Croatian Bureau of Statistics; Monthly Statistics Bulletin 12, XX/2007, Croatian Employment Service; Bank staff calculations.

30
72. Information on the connection between tertiary education and the labor market is scarce. However, according to MoSES (2007a), the rigidity of the tertiary education system and its limited ability to adapt to the needs of the economy has been subject to much criticism. The needs of the labour market are still not systematically assessed, while the setting of enrolment quotas in tertiary education largely reflects the effects of inertia. This said, the most recent growth in the number of students has occurred on the basis of quasi-market principles31, whereby publicly-financed programs have maintained a status quo or slightly declined, while the increased interest in higher education has been reflected in increased enrolments of fee-paying students as well as part-time students.
73. The ongoing adjustments to the Europe-wide Bologna Process for higher education32 need to be matched by a thorough modernization of study programs, and supported by adequate resource allocations – in terms of facilities, lecturers, and additional funds for specific projects. The inertia that still prevails in much of the tertiary education sector needs to be challenged by transparent evaluation and quality assurance systems. Evaluations of study programs would benefit from targeting a true reform of curricula in contrast to mere re-labeling. Particular attention should be paid to the employability of recipients of Bachelor’s degrees. In this field, a public debate and awareness campaign, with strong involvement of labor market representatives, are of paramount importance in order to take advantage of the potential of the Bachelor’s degree to meet the demands of the labor market.
74. Functional integration of Croatian universities is a critical condition for long term reform. The current institutional arrangements (under which each individual faculty maintains its own autonomy in decision-making) preclude the implementation of a consistent university strategy, as well as hindering interaction between the university (as a whole) and its economic and social environment. This is particularly important for the definition of coherent enrollment policies which reflect the needs of the labor market, as well as for career advisory services, entrepreneurship centers and other mechanisms that can facilitate the successful entry of university graduates into employment (including self-employment). Better integration of universities would also have beneficial effects on innovation and knowledge transfer activities.
75. Furthermore, career advisory services that would help facilitate the entry of university graduates into the labor market are almost non-existent. Such centers should serve as an interface between students/graduates and the regional labor market, providing information and guidance and assisting in the development of skills necessary for successful participation in the labor market. However, given the lack of functional integration of Croatian universities (despite some recent initiatives), such centers have not yet been made operational. Complementary functions to career advisory centers could be provided by entrepreneurship centers, which would provide students with entrepreneurial knowledge, skills and competences, as well as some enterprise incubation facilities. Some functions of such centers are provided by some university departments (e.g. Faculty of Electrical Engineering and Computing in Zagreb), but entrepreneurship centers have not been put on the policy agenda yet. While entrepreneurship centers could play a particularly useful role in the near-term future, over the medium term it should be a goal to mainstream innovative thinking and skills for entrepreneurship into higher education studies.
31 Babi�, Matkovi� and Šoši� (2006), “Structural Changes in Tertiary Education and Impacts on the Labour Market”, Croatian Economic Survey 2006 and Background Paper for this Report. 32 The Bologna process, launched in 1999, is an initiative designed to promote greater consistency and comparability of standards in the tertiary education sector across different European countries.

31
76. Summing up, the following measures, among others, could be considered in order to raise labor participation and thus help Croatia to achieve and sustain higher rates of economic growth33:
• Align the incentives for labor supply by: (i) reviewing the incentives for early retirement implicit in current legislation and seeking to provide older people with better incentives to return to work; (ii) reassessing the effects of unlimited duration unemployment benefits for older workers; (iii) integrating currently inactive members of the younger population, like war veterans and a large share of social welfare beneficiaries, back to the labor market by assessing and adjusting their benefits; (iv) adopting a more forward-looking migration policy, including allowing for selective immigration of workers whose skills are in short supply; and (v) assessing the effectiveness of current demographic policies.
• Increase demand for labor by: (i) enhancing labor market flexibility (reducing firing costs, and allowing for more flexible work hours and social security rights); and (ii) containing artificial increases in labor costs (possibly by abolishing the provision on mandatory extensions of collective agreements to all employers in an industry, as well as through the operations of the minimum wage);
• Reduce skill mismatches through enhancing the responsiveness of VET and the tertiary education system to labor market needs, including through the provision of (i) better labor market information on occupational trends; (ii) transparent information on employment status of graduates from VET and higher education programs; (iii) functional integration of Croatian universities; and (iv) flexible adjustment of enrollment quotas for courses.
• Enhance Croatia’s Life-Long Learning (LLL) system by: (i) developing a LLL Strategy encompassing all forms of learning (and not limited to adult education); (ii) increasing participation in adult education; (iii) involving employers (as well as students and graduates) in the governance of VET and HE institutions.34 A brief illustration of successful LLL models elsewhere in Europe is presented in Box 5.
77. A strategy of increasing the employment rate probably offers the highest potential returns in terms of raising and sustaining economic growth. However, international experience shows that labor reforms are often also the most politically controversial category of reform. Increased labor participation may lead, according to the report’s estimate, to a decrease in average real wages, which could itself generate opposition. Yet, as international experience illustrates, combining flexibility in hiring and firing (flexibility for employers) with relatively high benefits for the unemployed worker (income security for the employees) – the so called flexicurity model first implemented by Denmark in the 1990s -- is a promising route to be explored.
33 A more detailed discussion of these recommendations is provided in the Full Report. 34 The results of these measures, however, will inevitably take some time to materialize. In such a context, the attraction of highly skilled migrants would be beneficial, especially in sectors in which such workers are in demand. Nevertheless, no overarching migration policy exists.

32
Box 5: European Examples of Good Practice in LLL: Finland and Ireland Finland and Ireland provide two examples of countries that have embedded lifelong learning principles in a variety of education policies. In Finland, annually 23.1 percent of the working age population participates in lifelong learning measures, which also extend to retirees. In the state budget about 13 percent of the Ministry of Education’s expenses go to adult education, though the majority of training is financed by employers (Tahvainen, 2006). In Ireland, the participation rate in LLC is somewhat lower (7.5 percent) and the policy focus is predominantly directed at labor market outcomes (cf. EIS, 2008). Review of recent Slovenian experience with regard to adult education might also be beneficial. Key lessons from the Finish and Irish experience are the following: First, access to lifelong learning and competence acquisition should be simple, cost-effective and adapted to individual needs. That is particularly important in the case of people with insufficient or outdated education and training, or those who need to update their vocational qualifications. Finland (MoE-FIN, 1999; Tahvainen, 2006) lowered the threshold for adult education and training by means of individual study programs of reasonable length built on prior learning and experience. Persons already active in working life are given opportunities to study towards competence-based qualifications that have achieved recognition by the labor market. A system has been developed of competence-based qualifications that are independent of the way in which the relevant knowledge and skills have been acquired. The opportunity to build education and training on prior learning has shortened study times in adult education in Finland by more than one third. Information, individual guidance, personal study plans, study guidance and mature students’ financial aid have all been developed to encourage adults to apply for education and training and to complete their studies. Study times are kept at a reasonable level to prevent the length of study from becoming an obstacle. Furthermore, unemployment benefits are tied to training. Second, courses and qualifications are organized in a flexible and modular way, which brings them closer to the needs of individual learners. Adults are given opportunities to study for vocational qualifications or specialist qualifications, or parts thereof, and for other studies which improve their employability and their capacity for further learning. Particular attention is given to those who dropped out of school earlier, including those who discontinued their tertiary education, who are given opportunities to continue their studies. Experience indicates that the modular design needs to be supplemented with flexible hours and forms of delivery, as well as by efforts to ensure the equity of access for different groups of students. Open and distance learning can, for example, ameliorate some of the geographical and time barriers faced by many potential learners. A variety of supporting institutions has also been developed. The system of public libraries in both Ireland and Finland, for example, has provided valuable support to learners. In the Irish case, the libraries have been supporting adult learners through the bridging of information gaps, supporting distance learning, enhancing literacy and ICT skills, providing information resources, materials and study spaces, as well as by developing linkages with business, education and training sectors and the community in general (TF-IRL, 2002). Third, a variety of governance and financing mechanisms is used to facilitate access to lifelong learning and to design learning programs in accordance with the needs of employers and employees. In one model, for example, training is tailored essentially to the needs of the specific employer. This model is used in cases where a firm is recruiting a new labor force, but also for development of personnel vocational skills, restructuring or liquidation of a business, as well as in cases when individual employability needs to be improved. This training is planned, implemented, purchased and financed together by the employer and the Labor Administration (Tahvainen, 2006). The Labor Administration usually finances no more than 50 percent of the purchasing costs of the training, which is implemented by authorized education institutions. As another model, the use of study vouchers has been piloted as a useful mechanism for training which is not initiated and financed by the employer. The use of such instruments is also considered for university-level continuing education. In Ireland, the pilot Training Networks Program has made a strong contribution to in-company training. 456 courses (most of them new or significantly upgraded) were delivered to over 2,300 companies and 12,800 participants. The program has had a particularly significant impact in encouraging SMEs to invest in training: 73 percent of the participating companies had less than 50 employees and 38 percent of companies had less than 10 employees (TF-IRL, 2002). Fourth, in Finland lifelong learning is used not only in relation to labor market needs, but also to enhance civic activity, community education, social dialogue and basic information society skills. Educational services will be increasingly targeted at the retired population in accordance with the principle of lifelong learning. Despite the high effectiveness of lifelong learning in Finland, it has also been observed that those who are already better educated are most likely to participate in further education. Consequently, the most difficult challenge is how to reach the poorly educated and those at the biggest risk of unemployment and social exclusion and how to including them in lifelong learning. In Ireland, particular attention is now given to ‘non-traditional learners,’ including the poorly educated, older, unemployed or economically inactive citizens, as well as those working in small companies and belonging to lower-skill occupational groups. Source: Background report, Staff Elaboration

33
B. Increasing Productivity
78. The share of aggregate productivity that is influenced by the investment climate is large in Croatia. The share of total productivity influenced by the investment climate, also known as demean log-productivity35 is comparable to that in countries like Mexico and South Africa. As compared with other countries, though, Croatia’s investment climate influences aggregate log-productivity mainly through average log-productivity (comparable to the technical efficiency concept discussed earlier in the report), with an almost negligible effect on the allocative efficiency across firms. Out of the total effect of the investment climate on aggregate productivity, some 87 percent could be attributed to average log-productivity and only the remaining 13 percent to the allocation effect. This indicates that that there is no significant difference in the impact of investment climate factors according to firms’ market-share.
35 Demean log-productivity is defined as the share of productivity explained or influenced by the investment climate (measured in logarithmic terms).
Figure 16: Demean Mixed Olley and Pakes Decomposition in Croatia and comparator countries
-0.65
-0.53
-0.41
0.35
0.49
0.64
0.80
1.03
1.55
-0.67
-0.53
-0.45
0.08
0.50
0.61
0.73
0.53
1.52
0.00
0.03
0.27
-0.01
0.03
0.07
0.50
0.02
0.01
-1.0
-0.5
0.0
0.5
1.0
1.5
2.0
Philippines Turkey Indonesia India Croatia Mexico South Africa Brazil Chile
Dem
ean
[log
(P)]
Aggregate log-productivity Average log-productivity Allocative Efficiency
The productivity measure used is the demean restricted Solow residual in logs. Source: Staff calculations with Croatia ICS data.
Source: Staff Elaboration

34
79. Empirical evidence suggests that red-tape, skills and technology are the groups of investment climate variables which have the largest impact (positive or negative) on aggregate productivity. Jointly, these two groups contribute to explaining almost 50 percent of the total effect. Infrastructure variables contribute to an additional 17 percent and finance and corporate governance factors to another 10 percent (Figure 17). Within the main two groups identified above, several more detailed issues -- “days to obtain import license”; “the share of skilled-workers” and the “share of workers with computers” -- are the most relevant factors. The contribution of infrastructure is spread among five different factors (“availability of web-page”; “availability of own transportation”; “losses to shipment in domestic market”; “days waiting for a phone connection” and “losses due to power outages”). In the case of finance and corporate governance, the main effects come from “new investment financed by non-bank financial institutions”; “new investment from equity” and “external audit” variables.
80. Important nuances were also identified in terms of the channels through which individual investment climate variables affect aggregate productivity. The contribution of the “days waiting to obtain an import license” to the average is -32.7 percent, while the contribution to the allocative efficiency is -3.2 percent, indicating that the negative effect on productivity is slightly biased towards low market share firms. The contribution of the “share of skilled workers” to average log-productivity is 24.8 percent, with the negative effect on the allocative efficiency (-0.8 percent) subtracted from the effect on the average, indicating that the positive effect of the skilled workers is shared by all the firms in the sample. The contribution of the variable “workforce with computer” also occurs mainly through the average effect (15.9 percent out of 17.3 of its total contribution). The allocative effect, however, is more important for the variable “dummy for external audit”: having the annual statements reviewed by an external auditor is positively associated with aggregate log-productivity (13.5 percent) but the largest contribution coming from the allocation effect (6.6 percent). That is, as the positive effect of the external audit is mostly concentrated in firms with large share of sales, the overall effect on aggregate log-productivity is considerably amplified (Figure 18).
81. Policies to raise aggregate productivity in Croatia should address both those investment climate factors that reduce technical efficiency and – more importantly in terms of potential impact – those that inhibit market dynamism. By focusing on the investment climate factors with the largest impact on technical efficiency, policy-making could potentially contribute to raising aggregate productivity in Croatia. The results obtained by this report confirm the existence of large productivity gains to be obtained by improving the use of resources in the typical firm, and thus the possibility of raising aggregate productivity without necessarily altering the distribution of total output in favor of more efficient firms (the process of enterprise catch-up to the industry’s “best-practice”). Yet, by simultaneously enabling forces of market dynamism to increase the share of more efficient firms in total output (allocative efficiency), policy-makers could further augment the magnitude of the impact of such measures. In this sense, increasing aggregate productivity in Croatia requires addressing the factors that are hampering market dynamism -- the process of “creative destruction” -- in the country.
Figure 17: IC absolute weights on aggregate log-productivity by blocks of variables
Fin an ce an d c o r p o r ate
g o ve r n an ce , 10%
Qu alit y, in n o vat io n and labo r
s k ills , 20%
Oth e r c on t r o l
v ar iab le s , 25%
Re d tap e , co r r u p t io n an d cr im e ,
28%
In fr as t r u ctur e , 17%
Source: Escribano et al (2008)

35
Figure 18: Investment Climate contributions on aggregate and average log-productivity
-0.3
6.6
-2.6
17.2
-7.7
1.2
-32.
7
5.6
4.4
13.5
24.8
17.3
43.7
8.9
-1.2
7.4
-2.9
16.1
-5.2
1.5
-29.
5
7.7
4.5 6.
9
25.6
15.9
36.9
6.6
0.9
-0.7
0.3 1.1
-2.5 -0
.3
-3.2 -2.1
-0.1
6.6
-0.8
1.4
6.7
2.3
-40
-30
-20
-10
0
10
20
30
40
50
1.1 1.2 1.3 1.4 1.5 2.1 2.2 3.1 3.2 3.3 4.1 4.2 5.1 5.2
Aggregate log-productivity
Average log-productivity
Allocative efficiency
4 Quality, innovation and labor skills4.1 Percentage of skilled workers4.2 Percentage of workforce with computer
5 Other control variables5.1 Age of the firm5.2 Share of exports
2 Economic governance2.1 Security cost2.2 Days waiting for an import license
3 Finance and corporate governance3.1 New investments financed from non-banks financial institutions3.2 New investments financed from equity3.3 Dummy for external audit
LEGEND1 Infrastructures1.1 Losses due to power outages1.2 Dummy for own transport1.3 Shipment losses in domestic market1.4 Dummy for web page1.5 Days waiting for a telephone connection. Interaction wth firms that apply for a phone connection
Infrastructures Red tape, corruption and crime
Finance and corporate governance Quality, innovation and labor skills
Other control variables%
Note: Contributions net of any other factor other than IC variables. The contributions to aggregate log-productivity add up to 100. The productivity measure used is the restricted Solow residual (see the appendix on econometric methods for more details). Source: Escribano et al (2008)
82. Another factor constraining aggregate productivity in Croatia is the persistently large share of employment in agriculture. In 2006, the agricultural sector employed over 14 percent of the country’s workforce, corresponding to more than four times the EU-15 average. Yet Croatia’s agricultural production is less efficient than in EU-15 countries: for instance, the value added per agricultural worker in Croatia in 2005 corresponded to only about half the EU -15’s level. Most farmers are engaged in subsistence agriculture on small size properties with little investment in machinery and equipment. Additionally, a large portion of the agricultural land is still under state control and remains more-or-less unutilized. In other to increase aggregate productivity, Croatia will need to enable more agriculture workers to move to higher productivity activities and/or raise productivity within the agriculture sector, which in turn implies completing the market reforms in the agricultural sector (facilitating development of land rental markets and possibly allowing the consolidation of land ownership).
Enhancing Market Dynamism
83. Evidence points to restricted market dynamism in Croatia’s enterprise sector: the process of “creative destruction” has been anemic by standards of comparable countries. The rate of firm turnover (the number of new firm entries plus exits from the market, expressed as a proportion of the total number of firms), increased from 3 to 6 percent during the 2000-07 period, which is much lower than turnover in comparable countries, such as Romania (an increase from 5 to 30 percent); or Slovenia (a decline from 25 to 13 percent). Gross job flows indicate that the expansion in employment in Croatia over the last decade resulted essentially from a slower rate of job destruction, with only a small contribution from job creation, (an opposite result to the

36
1990s’ outcome). Job creation has been driven essentially by de novo firms – newly-established private firms -- with only a negligible contribution from privatized enterprises. Rather than a source of dynamism, corporate restructuring in Croatia seems to have been a major drag on productivity gains.
84. The study finds that the underlying cause of the inadequate gains from improved resource allocation in Croatia is a still pervasive economy-wide system of product market regulation. This report shows Croatia as the 6th most restrictive economy among a selection of thirty countries in terms of conditions for product market competition (and more restrictive than would be predicted by its level of development). Partly as a consequence of the adoption of norms from the EU’s acquis communautaire, Croatia performs relatively well in administrative regulations, including those related to company start-up (Figure 19). Other legal requirements to enter a market, however, such as licenses and permits, and lenient antitrust exemptions, are out of line with market entry conditions in OECD economies. Another major misalignment is the size of Croatia’s public enterprise sector, far larger than is found in its peer countries. Furthermore, government involvement in the commercial operation of those enterprises also appears highly intrusive in comparative terms, further distorting competition in several key industries. Finally, generous state-aids and a bankruptcy process that, despite its alignment with the EU, is lengthier and costlier than elsewhere in Europe in practice constitute important barriers to the exit of inefficient firms from markets, and thus additional obstacles to market forces in Croatia.36
85. Regulation of non-manufacturing sectors, including retailing and infrastructure, also has important knock-on effects for Croatia’s growth prospects. Non-manufacturing sectors represent around two thirds of economic activity in Croatia. This implies that final and intermediate consumers of non-manufacturing products across the economy have to bear the costs of the inefficiency that anti-competitive regulations help to shield in these sectors. Elsewhere, service sectors have proven to be key contributors to productivity gains in the OECD economies over recent decades. Yet, those are industries where import competition is less likely and market structure tends to be highly concentrated. In this context, appropriate regulation may induce competition and entry, but inappropriate regulation may further restrain it. Using the OECD’s methodology to benchmark Croatia’s regulation in non-manufacturing sectors, this report concluded that regulation in energy, transportation and telecommunications is more restrictive to competition in Croatia than in the EU countries, even though compliance with the provisions of the acquis communautaire has led to convergence in regulatory frameworks, particularly in electricity and telecommunications. A command and control approach to regulation in the service sector, as opposed to an incentive-based approach, is a further area of remaining misalignment with the average OECD economy.
36 See the Full Report for further details on product market regulation in Croatia.

37
Figure 19: Product market regulation in Croatia (2008)
0
1
2
3
4
United Ki
ngdo
mAu
stra
lia
United St
ates
New
Zea
land
Can
ada
Icelan
dDen
mar
k
Slov
ak R
epub
licIre
land
Luxe
mbo
urg
Swed
enJa
pan
Finlan
d
Nethe
rland
s
Rom
ania 200
6Ger
man
y
Alba
nia 20
07Au
stria
Belgium
Norway
Portu
gal
Spain
Korea
Switz
erland
Bulgar
ia 200
6Fr
ance
Cze
ch. R
ep.
Italy
Gre
ece
Croatia 200
7Hun
gary
Mex
icoTu
rkey
Poland
Ukraine
200
7
Product market regulation
90% confidence interval (2003) 2003 PMR Indicator
Relatively Restrictive
Relatively Liberal
Source: Staff Elaboration
Areas for Raising Average Productivity
86. Border Processing. Benefiting from the EU Accession agenda, border processing has improved markedly over the past eight years. Nonetheless, Croatia remains far from best-practice in this area. For example, a breakdown of the costs and time it takes to export or import a dry –cargo, 20-foot, full container load from or to Croatia, shows that entrepreneurs engaged in international trade in 2007 were required to spend 8-9 days and USD 500 on preparing the necessary documents for export or import (in a stark contrast to the 2 days and USD 65 incurred by traders operating in Denmark). Although the number of documents decreased from 9 in 2005 to 7 in 2007 for exports (and from 15 to 8 for imports), the regulatory burden placed on Croatian traders is still higher than in EU-15 and OECD economies. Simplifying trade procedures, including import procedures, is extremely relevant, because imported inputs represent more than 40 percent of total inputs in Croatian manufacturing.
87. Labor Skills. Croatian enterprises employ a smaller percentage of skilled production workers than counterparts in comparable countries. By 2007, Croatian companies employed an average of about 66 percent of skilled production workers (both employees and managers). This figure compares unfavorably with other upper-middle-income economies, such as Romania or Turkey, which at the end of 2004 employed 83.6 percent and 77.5 percent of skilled workers respectively. Nor does it compare well with the structure of the workforce in higher income economies, such as South Korea or neighboring Slovenia, where the percentage of skilled workers in the workforce reaches 87 percent and 79.8 percent respectively. Beyond this, the vast majority of skilled production workers in Croatia are employed by non-exporting enterprises (as compared to exporting) and public-owned (as compared to privately-owned) companies, which may constrain the contribution they make to the country’s economic dynamism and competitiveness.
88. Computer Use. A relatively large share of Croatian workers (44 percent) used computers in the production process in 2007, much larger than the level in China (33 percent) and India (15 percent) in 2003. However, the share of workforce using computers in Croatia decreases with firm size (a result that does not hold, for example, for Brazil or India). Computer use is the lowest

38
among young companies (similar to Brazil and India), and is also larger in the service sector than elsewhere (as is the case for most countries in our sample). Computer use is highest in the Zagreb region (and lowest in Istria). Domestic and foreign owned firms present similar levels of computer use, but privately-owned enterprises show a higher level than publicly-owned firms. The already relatively wide diffusion of computer use in Croatia suggests that there may be relatively limited additional scope for increasing technical efficiency through this route. This said, few of the national programs aimed at the development of entrepreneurship focus on technology adoption, contrary to the experience in many OECD countries.
89. Infrastructure. While the contribution of “web-use” to TFP is among the five most important factors identified, the diffusion of web use among Croatian firms still seems comparatively limited: just 55 percent of firms in Croatia reported using the Web for interactions with suppliers and clients in 2007, as compared to 63 percent in Romania and more than 88 percent in Slovenia in 2005. Connectivity still seems to be a problem for many firms: the duration for obtaining a telephone connection, among these firms that apply for it, seems to negatively affect firm productivity. With telecommunications regulations converging towards EU standards, better enforcement of the regulations may be crucial for the development of more efficient services in this sector. On a separate front, our survey finds that for a firm to have its “own transportation” is associated with higher TFP, but that relying on own transportation to a large extent reduces productivity. One plausible interpretation for these two results is that outsourcing logistics, a world-wide trend, is also a better alternative in Croatia, but that not having its own transportation at all may reduce firm productivity (possibly due to interruptions in the provision of outside logistics services).37
90. Access to Finance. Although 17 percent of firms surveyed cited “access to finance” as one of the top 10 obstacles for the development of their business in Croatia, 71 percent of the enterprises had a loan or an existing line of credit (as opposed to only 20 percent in Bulgaria or 54 percent in Turkey). The average number of years granted to pay off a loan is 4.5 years, with minor variations across firm size. Financially constrained firms may add up to a maximum of 20 percent of total firms. On this evidence, access to credit per se does not seem to be an area where substantial reserves of productivity gains could be unleashed. In this case, the positive impact on productivity observed in firms reporting “new investments from non-banks” and “new investments financed from equity” might be interpreted as evidence that equity and other type of non-banking financing (e.g. capital markets) may possibly be more efficient than banks in allocating resources to firms with higher productivity levels. One corollary of this interpretation would be to reinforce the importance for productivity growth of looking into developing non-banking financial institutions further in Croatia.
91. Summing up, the following measures, among others, could be considered to help increase aggregate productivity and thus help Croatia to achieve (and possibly sustain) higher rates of economic growth (a detailed discussion of these measures is provided in the Full Report):
• Enhance the process of creative destruction and market dynamism by (i) re-igniting the privatization process and improving corporate governance in remaining state owned enterprises, including reducing the level of state interference in commercial decisions; (ii) reducing state-aids for declining sectors and streamlining the bankruptcy process to improve exit conditions; (iii) further adopting market-friendly regulations (with the full implementation of regulatory impact assessment requirements and elimination of unnecessary government-generated barriers to entry); and (iv) liberalizing entry into the service (particularly retail and infrastructure) sectors;
37 Less than 8 percent of firms considered transportation services a severe or very severe obstacle to the expansion of their business in Croatia. Nonetheless, 77 percent of all Croatian manufacturers relied on their own transport as of 2007.

39
• Contribute to raising the average productivity (i.e., technical efficiency) of Croatian enterprises by (i) streamlining the process to obtain an import license; (ii) improving the supply of labor skills (as discussed in the labor section); (iii) using Croatia’s SME policies to better support technology adoption, particularly computer-use, in line with the OECD experience; (iv) improving the enforcement of telecommunications regulations, with a view inter alia to reducing the time needed to obtain a connection, and (v) looking into encouraging the further development of non-banking financial institutions. While some of these measures are fully aligned with the agenda for EU Accession (e.g. customs and telecom), others are less so. Also the time-frame for these recommendations varies widely, with some of them (e.g. developing NBFI and improving labor skills) requiring a more long-term approach than others.
92. While there are potentially major gains to be obtained, strengthening the process of creative destruction will inevitably create winners and losers, with a risk for the sustainability of reforms. Sector and regional differences may further accentuate the risk of policy reversals, and appropriate mechanisms should be considered to deal with these risks. Beside standard compensatory mechanisms, one possibility would be to bundle the competition-promoting reforms with (i) those related to the improvement of the investment climate, further enabling the expansion of productive enterprises and thereby the demand for labor, and (ii) LLL and VET policies to facilitate the employability of workers, as well as policies to facilitate job-matching.
C. Deepening Trade Integration
93. Export growth rates in Croatia have consistently been below those of other CEE countries, reflecting the incomplete restructuring of the country’s exportable sector. As Table 2 shows, the contribution to Croatia’s export growth coming from expansion at the “intensive margin” (i.e., the net expansion of sales of existing products to existing markets) has been meager when compared to the result for Upper Middle Income (UMI) countries as a whole. This result was caused essentially by a significant level of contraction and extinction of exports of many existing products to current markets, which largely offset such expansion as occurred. Indeed, there have been considerable changes in Croatia’s export structure compared to a decade ago, with textiles, apparel and leather, chemicals, food and wood products now accounting for roughly 30 percent of the total, compared to 55 percent in 1997.
Table 2: Decomposition of Export Growth in Croatia: 1995 to 2004 (%) Croatia UMI ECA Increase in Exports of Existing Products to Current Markets 113.6 102.6 89.8 Decrease in Exports of Existing Products to Current Markets - 72.7 - 19.8 - 14.7 Extinction of Exports of Existing Products to Current Markets - 24.1 - 6.6 - 7.3 Intensive Margin 16.8 76.2 67.8 New Exports of Existing Products to New Markets 69.6 22.7 29. 8 New Exports of New Products to Existing Markets 13.6 1.1 2.4 New Exports of New Products to New Markets 0 0 0 Extensive Margin 83.2 23.8 32.2
Source: Staff Calculations based on: Brenton, P and R. Newfarmer (2007) ‘Watching More Than the Discovery Channel: Export Cycles and Diversification in Development’, Policy Research Working Paper 4302, World Bank

40
94. Export shifts, however, have not included any significant rise in the share of exports of skill-intensive products. Rather, with the exception of transport equipment, most of the lost export shares in Croatia were made up for by the refined petroleum sector, a resource-based industry. Furthermore, the largest component of the transport equipment sector is shipbuilding products, a segment that has absorbed large state subsidies. Overall, with the exception of Bulgaria and Bosnia Herzegovina, the technological sophistication of Croatia’s exports is lower than that in most CEE countries.
95. Obstacles to deeper trade integration are more related to microeconomic than macroeconomic factors. Some appreciation of the exchange rate seems to have occurred in recent years, but to an extent that, in the evaluation of this report, has not substantially affected exports. Econometric analysis of the correlates of the probability to export at individual form level demonstrates that firm productivity (TFP) explains roughly ¼ of the probability of exporting, with the other four main important factors being (i) days to clear customs for exports; (ii) availability of own transportation; (iii) criminal losses, and (iv) foreign ownership. While criminal losses are difficult to analyze, the interpretation of two out of the three remaining factors (customs and foreign ownership) is reasonably straightforward.38 The report envisages two complementary strategies to improve export performance in Croatia: (i) attract export-oriented FDI and (ii) increase the supply of exportable goods.
Attracting Export-Oriented FDI
96. What is hindering Greenfield FDI in Croatia? Using the responses of managers of foreign owned-enterprises to the 2007 ICS as a “proxy” for foreign investors’ perception of the attractiveness of Croatia’s investment climate, and comparing them to the responses of domestic companies, indicates that (i) electricity supply and (ii) trade regulations are two areas that were identified by a larger share of foreign-owned enterprises (compared to domestic ones) as “severe obstacles” for the expansion of business in Croatia. Roughly ¼ of the foreign-owned firms also pointed to (i) inadequacies in labor supply, and (ii) tax rates, as “severe obstacles” (these responses were consistent with the perceptions of domestically owned enterprises). Access to land is also a relevant obstacle for the business expansion of foreign-owned enterprises in Croatia (Figure 20).
97. Power Outages. According to the 2007 ICS, 29 percent of the enterprises reported having experienced power outages in the previous year, a slight improvement relative to the situation in 2004, when over a third of the enterprises had been affected by power shortages.
38 The relevance of “own transport” is obviously contradictory with the worldwide trend of outsourcing transport services. We tentatively interpret it as an indication of the inefficiency of the transport services provided to exporters.
Figure 20:Percentage of Foreign Owned firms Identifying a Problem as a “ Major” or “Very Severe” Obstacle for the Expansion of Business in Croatia
24.419.7 17.9 16.8 14.2 12.2 12.2 9.8 9.4 8.9
25.3
05
10152025303540
Inad
equa
te la
bor
Tax
rat
e
Ele
ctri
city
Tra
de r
egul
atio
ns
Tax
ad
min
istr
atio
n
Acc
ess
to la
nd
Acc
ess
to f
inan
ce
Tra
nspo
rt
Lab
or
regu
lati
ons
Co
urt
Tel
ecom
mu
nica
tion
Foreign ownership>=50% Others <50%
Source: 2008 Croatia ICS-Staff Elaboration

41
Power outages are most severe in Slavonia and Dalmacija. There were on average 2.19 power outages per month with an average duration of 2.33 hours. The average weighted duration of power outages in a month in 2006 was 6.6 hours, with a high of 8.1 hours in Dalmacija and a low of 2.2 hours in Istria. In Slavonia and Dalmacija, over 50 percent of the firms interviewed had experienced a power shortage in a month. The costs incurred by firms may reach up to about 7 percent of annual revenues, as in the case of small firms in Slavonia.
98. Access to land. Foreign-owned companies own a lower share of the land that they occupy than domestically-owned companies. Foreign-owned companies with operations in Croatia own 43 percent of the land that they occupy, in contrast to the 70 percent of land ownership among domestically-owned firms. It is difficult to determine land ownership legally as, until recently, land registries and cadastre systems were poorly maintained. Partially as a result of possible ambiguities over ownership, registering a property in Croatia takes an average of 174 days, compared to 2 days in New Zealand and 92.4 days in the ECA region on average. The lengthiest procedure in the process of land acquisition is the registration of the property title transfer at the municipal courts. The main reason for the long duration is the existence of land registry case backlogs at the municipal courts.
99. Taxation. Whether taxation is affecting FDI into the export-oriented sector merits further analysis. At 20 percent, Croatia’s corporate income taxes are higher than several international competitors, such as Bulgaria (15 percent), Romania (16 percent), Hungary (16 percent), Poland (19 percent), Latvia (15 percent) and Lithuania (15 percent). However, at the same time the effective CIT rate is lower due to various tax deductions and exemptions offered to entrepreneurs. In addition, there are various state-level taxes and non-tax charges and fees that contribute to the overall burden of taxation. Paying taxes in Croatia also remains more administratively cumbersome than in the EU-15 in general.39
Increasing the supply of exportable goods
100. Developing the supply of exportable goods will require improvements in quality certification, trade-related services, and logistics. The lack of awareness of standards and quality requirements is a hindrance to exporting. Research indicates that a 10 percent increase in the number of shared standards between two countries enhances bilateral trade by 3 percent. Standards help to reduce the information costs that would have to be incurred by SMEs in seeking to place their goods in a foreign market. There are multiple issues for Croatia. First, compared to the less than 9,000 Croatian standards that are based on regional and international standards, Romania and Bulgaria have some 20,000 and 18,000 respectively. Secondly, in several cases where harmonized European standards have been adopted by Croatia, numerous technical regulations based on ex-Yugoslav standards stipulated by Ministries (about 9,000) have not been removed, thereby creating a dual standards system. Unfamiliarity with European standards serves as a hindrance in placing goods on European markets. Our firm-level analysis confirms that Croatian firms that upgraded their products (to meet higher standards) were more likely to export.
101. Besides improving the awareness of exporters, Croatia will need to strengthen its technical infrastructure for conformity assessment. Croatia will need to develop a network of independent certifying bodies and laboratories. The number of Croatia’s nationally accredited
39 According to the Doing Business 2009 Report, enterprises must make 28 payments for full compliance with the tax system, and on average spend 196 hours on the tax compliance process. This is twice the average number of payments within the EU-15. By comparison, Irish firms (the best practice economy in Europe for paying taxes) are required to make 9 payments and devote only 76 hours to the process. The shorter duration is due in part to the Irish online filing system. E-filing and e-payment of taxes, which have recently been launched by the Croatian Tax Administration, promise by reducing companies’ interaction with the tax officers also to reduce the formal and informal cost of paying taxes.

42
bodies, such as testing and calibration laboratories, and product certification and inspection bodies, may need to catch-up with those in other CEE countries. Croatia’s Accreditation Agency needs to become a full member of the European Co-operation for Accreditation. Finally, Croatia’s new quality and standards institutions will have to overcome their isolation at the regional and international level. The lack of integration of the standards, accreditation and metrology institutions creates technical barriers to trade and hurts domestic producers, both by restricting imports of productivity-enhancing capital goods into Croatia and by limiting access of Croatian exports to European and global markets.
102. A critical trade-related service is the provision of information about foreign markets. Croatian firms are hindered by their lack of information on foreign markets. Our analysis confirms that firms in Croatia that used the internet to access suppliers and clients (an indication of greater global visibility and marketing) were more likely to enter export markets than those that did not, thus pointing to the importance of marketing services for Croatian firms. In a survey of 450 exporters in Croatia, carried out by the Croatian Exporters Association, “insufficient or bad promotion activities” were regarded as among of the main obstacles to exporting. Among some 160 topics of interest identified by exporters, the ability to enter foreign markets ranked topmost. Indeed, seminars recently carried out by the Croatian Exporters Association on “market research” and “successful exporting and entering new markets” were oversubscribed, pointing to the need for more market information among Croatian exporting firms, particularly SMEs.
103. Croatia has an extensive network of transport infrastructure, primarily developed through a massive program of public funding. Unless Croatia’s freight railways manage to develop competitive corridor services with some urgency, however, they are likely to lose their highest revenue generating market to competition. Current infrastructure pricing policies in railways and ports result in Croatia subsidizing neighboring countries. Cost recovery principles are not applied at this point in ports or railways. While cargo pays for the provision of rail freight services, this coverage includes only a contribution to operating costs. Significant increases in port capacity are being developed, but they will come late compared to market needs, calling for further efficiency gains. The gap between installed capacity and forecast demand is substantial both in bulk cargo (Ploce) and container cargo (Rijeka, Ploce). While an ambitious program of infrastructure development is underway, in view of Croatia’s tight fiscal constraints, mobilizing private participation in infrastructure is recommended. Transit of goods through the country to third markets is an important “export” for Croatia. However, the country’s failure to develop efficient integrated corridor transport services risks losing this trade to its competitors such as Slovenia and (following EU entry) Western European rail companies (see also Box 6).
104. Summing up, to deepen trade integration, Croatia needs to attract FDI and expand the supply of exportable goods. Export hindrances are mainly related to microeconomic factors, as incomplete corporate restructuring has limited productivity gains in traditional export sectors as well as diversification towards new products and new markets. Croatia’s current degree of specialization in tourism exposes it to a highly volatile sector. Econometric analysis has also showed that cross-cutting issues are affecting the propensity of local firms to export, namely firm productivity; days to clear customs (for exports); and the availability of own transportation. The analysis also confirms that foreign owned firms are more likely to export. Attracting export-oriented FDI may therefore be a feasible strategy for further diversification of the country’s exports. The suggested policy measures are as follows:
• In order to attract export-oriented FDI, the report concludes that Croatia should (i) facilitate access to land; (ii) address electricity outages; (iii) improve trade regulations;

43
and (iv) further streamline regulations affecting foreign investment. Inadequacy of labor supply, tax rates, and tax administration are also considered among the top 10 obstacles for the expansion of business by foreign-owned companies. In this context, Croatia could benefit from strengthening its FDI promotion strategy. The report also explored, as an example of an alternative for further diversification in the service sector, policy measures that would enable the development of a competitive local logistics industry (see Box 6).
• In order to develop the supply of exportable goods, Croatia would need to (i) improve trade-related services; (ii) raise quality certification; and (iii) reduce logistics costs. An overall strategy to increase the level of information about foreign markets would be beneficial. The Metrology, Standards, Testing and Quality (MSTQ) infrastructure needs to be fully integrated to international norms. As Croatia has an extensive network of transport infrastructure, and public investments in roads have risen significantly in recent years, further efficiency gains in the transport sector require the continuation of railways restructuring, development of integrated corridor transport services, and the mobilization of additional private financing in infrastructure projects.
105. Leveraging the benefits of the global economy is important, even though in the short-term the expected decline in global trade in connection with the current financial crisis may limit the immediate benefits of such a strategy. Standard trade policies need to be complemented by measures to foster enterprise restructuring and market dynamism, so that exporting firms are motivated to raise their productivity (e.g., in shipbuilding) and new, more productive firms can enter the market. Synergies between trade and innovation policies should be also explored, as innovation policies may help export diversification and further trade integration may help technology absorption.
Box 6: Diversifying away from Tourism: The Case of Logistics Service With EU accession, Croatia has the potential to upgrade its trade logistics performance significantly and to expand its export of trade logistics services to neighboring countries. It can achieve this goal by enhancing its competitiveness as a transit country and adjusting its policies to ensure that transit sustainably contributes to its development. This, in turn, will allow the emergence of competitive logistics services, a major requisite for economic growth and competitiveness. While such an approach rests by nature on private sector efforts and innovation, the emergence of such competitive transit services in Croatia warrants close follow-up on the following aspects, from a policy and institutional standpoint: (i) corridor-based optimization across transport modes; (ii) a sustainable financial framework for each freight transport mode; and (iii) the optimized development of additional capacity, focused on market demand. Croatian authorities have already initiated activities in many of these areas, with results foreseen in the future. Source: Staff Elaboration

44
C. Fostering Technological Progress and Innovation
106. One factor behind Croatia’s relatively weak performance in innovation is the limited participation of the private sector in R&D activities. Total investments in R&D in Croatia represented around 1.0 percent of GDP in 2007. Croatia’s R&D intensity is lower than the EU-27 average of 1.8 percent, though slightly above average for the country’s income level (Figure 22(a)). The share of private R&D is also below the EU-27 average, and below that of comparable countries (e.g. Slovenia), and it has marginally decreased in the 2002-2007 period. The share of government R&D expenditure in total R&D expenditure has remained broadly constant at around 60 percent (Figure 21).
107. The share of Croatia’s labor force employed in R&D activities, particularly in the private sector, is low. Croatia ranks behind countries such as Slovenia and Estonia in terms of the share of the total labor force involved in R&D. The outlook is still less favorable when examining the share of R&D personnel in the enterprise sector, where Croatia has only 16 percent of its researchers working in businesses, while most researchers work in the higher education sector (42 percent) or the government sector (33 percent).
108. Overall, Croatia’s public sector is still the main investor in R&D. Some typical features of this system involve the centralized state planning and coordination of science policy, organizing research activities primarily around public institutes, and relying on supply-driven (instead of demand-driven) mechanisms to commercialize research. As a result, Croatia’s R&D system is considered less efficient than it could be if there was more private sector participation. Croatia’s R&D cost per patent is at the average for Europe (Figure 22(b)), but above that in such countries as Slovenia, Hungary, and Italy.
Figure 22: Research and Development Indicators across Europe and Central Asia Figure 22a Research and Development / GDP vs. GDP/Capita, 2004
Figure 22b: Efficiency of Research and Development Expenditure, 2004
BelgiumNetherlands
Portugal
Finland
France
Italy
Austria
GreeceKazakhstan
LithuaniaUkraine
Slovakia
Russia
LatviaGeorgiaBelarus
Armenia
Ireland
Germany
CzechCroatiaSlovenia
EstoniaTurkey
UK
SpainHungary
Bulgaria
0.0
0.5
1.0
1.5
2.0
2.5
3.0
3.5
4.0
0 10,000 20,000 30,000 40,000 50,000
GDP/capita (PPP$)
R&
D/G
DP
(%
)
Lithuania
Turkey
Belarus
PolandUkraine
KazakhstanBulgaria Russia
Portugal
SlovakiaRomania CroatiaLatvia
Spain
Hungary SloveniaArmeniaItaly
FranceIrelandGeorgia
FinlandGermany
0
50
100
150
200
250
300
350
400
0.0 1.0 2.0 3.0 4.0
R&D/GDP (%)
R&
D/p
ate
nt
(’0
00
s $
PP
P)
Source: UNESCO Science & Technology Statistics
Figure 21: Share of Business Sector R&D in Total R&D Expenditure
0%
10%
20%
30%
40%
50%
60%
70%
80%
EU
(27 c
ountr
ies)
Bulg
aria
Cze
ch R
epubli
c
Est
onia
Hungar
y
Pola
nd
Slo
ven
ia
Fin
land
Cro
atia
Turk
ey
2002 2003 2004 2005 2006
Source: Eurostat, 2008

45
109. R&D departments used to be well-integrated with production activities inside state-owned enterprises, but mostly disappeared after these enterprises were privatized. There are only a few cases of successful restructuring of R&D laboratories of former state-owned enterprises to meet new market conditions (see Box 7 for one of the few). At the same time, business investments not only amount to a low share of total R&D but are also concentrated in a few multinational companies, with a relatively minor contribution from locally owned-enterprises (and negligible participation of small and medium size firms). Some niches of commercial research have developed over the years, however, particularly in the software sector (see Box 8). The Science and Technology Policy 2006-2010 for Croatia addresses the concern over the limited role of the private sector in R&D, and sets targets to increase investments from the private sector with the goal of reaching a 1:1 ratio of public vs. private sector investment by 2010.
Box 7: Can R&D Laboratories of former SOE’s survive the market test? The Koncar Electrical Engineering Institute (KEEI) is a joint-stock research institute fully owned by Koncar Electrical Industries Inc. (KONCAR) holding group. KEEI was the research and development arm of Koncar from 1921 to 1991. The main activities of the institute’s 13 laboratories relate to electronics, and rotating machines, working with electrical utilities, monitoring, consulting, and the certification of products. The institute has been financially independent since 1991, although it still belonging to the Koncar Holding Group. Being financially independent allows KEEI to keep all of its profits. Ninety percent of the profits from KEEI are reinvested in business activities and ten percent are invested in strategic long term research and development. KEEI’s main customer base includes companies belonging to the Koncar group and Croatian utility companies. Its main competitor in the market is the Faculty of Engineering of Zagreb University, which provides similar services. Government agencies account for a tiny share of its revenues, with less than one percent of its sales. KEEI’s profits were 1 million euros in 2006, accounting for 10 percent of its turnover that year (10 million euros). Supervision services (e.g.: technical supervision of highways) represent a small share of these revenues but generate very high returns which are then reinvested in R&D activities. Staff salaries depend on results, as measured by the added-value, unlike most other research institutes where career progression depends more on scientific credentials and publications. Source: Staff Elaboration
110. Multinational companies in the health sector (clinical tests) and pharmaceutical sector have had relatively large R&D departments in Croatia. In the past, these companies benefited from the country’s knowledge base and academic excellence in the field of biochemistry and related subjects. In the last few years, however, the search for economies of scale and cost reduction in R&D has triggered a reorganization of the sector, with multinational companies concentrating R&D activities in selected laboratories with clear advantages in terms of cost-effectiveness. Declining profit margins in the pharmaceutical industry have been another major factor affecting R&D in the country.
Box 8: Private R&D in SMEs InfoDom Ltd. is a company dedicated to business processes, re-engineering and development of intelligent information solutions, and systems that support enterprise performance. Since its establishment in 1993, InfoDom has participated in leading IT projects in Croatia and provided the majority of IT solutions in the public sector.
InfoDom invests approximately 30 percent of its expenditures in R&D, and the technical staff spend approximately 25 percent of their time on in-house training. It has maintained research collaborations with academic institutions, particularly the Universities of Zagreb and Varazdin. It has also cooperated intensively with multinational companies from the IT sector such as IBM, Microsoft and Oracle.
Started with nine employees from the academic sector, InfoDom currently has more than 90 employees, and total revenue of approximately 50.5 million HRK (2007), and is one of the leading software developers in Croatia. It currently exports to Slovakia and Hungary and has a strategy for business expansion focused in the regional market that includes Serbia, Bosnia and Herzegovina and Macedonia. Source: Staff Elaboration
46
111. It would be useful to explore further the obstacles to the expansion of R&D in the private sector in Croatia. Interviews with managers of public programs supporting private sector R&D indicate a possible lack of supply of fundable projects. Reports mention that, despite systematic efforts to diffuse their programs to potential clients in the private sector, the number of applications has not significantly expanded over recent years. This may be related to the fact that such programs are still new, but may also reflect the fact that the incentives provided are not sufficient given the risks inherent to the activity (including difficulties for firms to protect their intellectually property in any innovations). Nonetheless, some programs are much older and do have a larger number of beneficiaries – such as the tax incentives for private R&D and the RAZUM Program of the Business Innovation Center of Croatia (BICRO). A third possible reason is the limited share of de novo firms in the economy (vis-à-vis state-owned and former state-owned enterprises), and the overall lack of corporate restructuring and market dynamism in Croatia. As economic history shows, corporate restructuring and the specialization it implies are highly correlated to technological progress and innovation.
112. A second obstacle to Croatia’s innovative performance is the lack of collaboration between R&D institutes, universities and the private sector. Anecdotal evidence suggests that patenting and licensing, and the development of joint research projects and spillovers from science-based companies are still novelties for the country’s research and development institutes as well as its public universities. For instance, it was only in 2007 that Rudjer Boskovic Institute, the well-known public research institute dedicated to basic research in natural sciences, started a systematic effort to commercialize the results of its research with the creation of a technology transfer office in the form of a limited liability company (Rudjer Innovations Ltd). Similarly, Brodarski Institute, the naval institute of the former Yugoslavia, which has a substantial record of technological developments in the shipbuilding industry, currently, has no more than a handful of research contracts with the private sector (corresponding to about 30 percent of total revenues). A 2004 statistical survey of the level of innovative activity in Croatian enterprises concluded that more than half the enterprises that introduced innovations in 2001-2003 attached very low importance to universities and research institutes as potential sources of information on innovation.
113. Several factors hinder industry-research collaboration in Croatia. A first reason is that the career progression of scientists and researchers is determined by their number of academic achievements, an approach that favors publications and basic research to the detriment of patents and applied research. A second reason is that research institutes rarely link their compensation policies to results in a measurable and transparent way that would provide clear incentives for a results-based approach by the research community. Furthermore, researchers very often do not control the overall budget for their research, a discouragement to fund-raising (and contract seeking) activities on their part. More fundamentally, ideological barriers still hamper the broader idea of commercializing science.
114. The provision of earmarked, non-competitive funding discourages the diversification of revenues, a key motivation for the commercialization of research. Institutional funding still accounts for most research funding for R&D institutes and is mostly not allocated based on measurable performance benchmarks. Competitive research funding is distributed in small fragments between a large number of beneficiaries and research fields, which limits its effectiveness in producing results, as research is typically considered a “lumpy” activity. Moreover, competitive research funding is allocated by a policy-making department embedded in the Ministry of Science, Education and Sports (MOSES), rather than by an implementing agency which is considered best practice in OECD countries, and this may raise concerns related to transparency and objectivity in grant allocation.

47
115. Governance issues may also have become more relevant for the efficient management of research institutes in Croatia after their centralization under the MoSES. Under the Law on Research and Development, the MoSES is responsible for the management and administration of the public R&D institutes.40 The Law defines three bodies for governing the institutes: the Governing Council, the Academic Council, and the director of the institute. The Minister appoints the members of each governing council. The Minister appoints members of the institute’s academic council, on the advice of the Minister’s Scientific Council (whose members the Minister also appoints). The academic council organizes the professional evaluation of projects (with the Minister having the right to make the final decision about each individual research project). Vacancies for the directorships of the institutes are publicly advertised but the Minister makes the final decision on the advice of the Scientific Council and the institute’s academic council, the members of both having been appointed by the Minister.
116. Business incubators, venture capital and technology transfer offices (TTOs) are in their initial stages. These are crucial mechanisms to facilitate the start-up of new, science-based companies. There are several self-described business incubators in Croatia, but most have little in common with incubators in the U.S. or Europe, as they are primarily oriented to the provision of real estate and other low-value added business services. BICRO is currently supporting the set-up of three new incubators that are planned to follow international best practice, while discontinuing public support to the previously-existing incubators, though some of those existing “quasi-incubators” (e.g. TERA) could have more market potential if they were reformed. Venture capital is essentially non-existent in Croatia, at least at a scale that would make it visible to most of the national innovation system players. The government is supporting the development of a Venture Capital Fund through BICRO. The development of TTOs has been delayed by the lack of legal integration between the faculties that constitute Croatia’s universities and the resulting ownership of intellectual property by individual faculties (as opposed to the universities). Recently, the Universities of Zagreb and Rijeka have managed to overcome this problem and have started establishing TTOs.
117. Another important limitation is the availability of human resources for R&D. Croatia does not have a large share of graduates in science and technology programs in its population. At 5.6 per thousand of population aged 20 to 29, Croatia’s share of science and technology graduates is lower than in most countries in the region, including Bulgaria, and much lower than the EU average of 13 percent. Further, the number of science and technology graduates has remained constant in Croatia while it has grown in other transition countries. Highly innovative countries like Finland have invested heavily in science and technology education at the university level (see Figure 23).
40 The Scientific Research Activities Law of 1993 changed the status of all research institutes formerly administered by the universities to “public institutes”, bringing them under the direct administration of the MoSES.
Figure 23: Tertiary graduates in science and technology per 1000 of population aged 20-29 years
02468
101214161820
EU
(27
cou
ntri
es)
Bul
gari
a
Cze
ch R
epub
lic
Est
onia
Hun
gary
Pola
nd
Slov
enia
Finl
and
Cro
atia
Tur
key
2001 2002 2003 2004 2005 Source: Eurostat, 2008

48
118. In order to deal with the lack of human resources for innovation, the Croatian government has been introducing some “Diaspora” – related programs. One of them is the “Unity through Knowledge Fund”, managed by MoSES, and designed to help Croatian scientists from abroad to return to Croatia or develop research-related activities located in the country (and/or involving local researchers). The program aims at financing projects between Croatian scientists in Croatia and those abroad through a competitive evaluation of research and technology proposals. Most Diaspora partners are entrepreneurs from the US, Australia, Spain and Sweden.
119. Overall, technology and innovation policy is still fragmented in Croatia, resulting in programs with overlapping objectives and a lack of rationalization of resources. The Ministry of Science, Education and Sports (MoSES) is the responsible administrative body for planning, funding and monitoring the overall science and education system. The Ministry of Economy, Labor and Entrepreneurship (MELE) also has programs particularly to increase business-industry linkages. These two ministries however do not seem to fully coordinate their policies and programs, as both offer programs for similar types of objectives and beneficiaries. Moreover, some MoSES technology commercialization programs with very similar objectives are managed by different agencies. Given the level of development of its programs and institutions, and its increasing commitments in terms of R&D expenditures, Croatia could benefit from a full-fledged assessment of its National Innovation System (NIS) and its impact on innovation, productivity and economic growth.
120. The following measures, among others, could be considered to foster technological progress and innovation and thus help Croatia to achieve (and possibly sustain) higher rates of economic growth (a detailed discussion of these measures is provided in the Full Report):
• Encourage an increase in private sector R&D: (i) benchmark existing tax-incentives compared to leading innovative economies and assess their impact on the promotion of private R&D; (ii) assess to what extent public R&D activities may be “crowding-out” private R&D (given the limited supply of human resources); and (iii) consider the potential to attract more R&D-intensive FDI jointly with the FDI promotion agency.
• Improve conditions for collaboration between universities and industry by: (i) reviewing criteria for progress in academic careers; (ii) simplifying legal requirements for cooperation; (iii) reassessing the overall incentives embedded in the legal regime (using the Bayh-Dole framework as a reference); (iv) reviewing the benefits provided by BICRO’s SPREAD program, possibly adopting a matching-grant scheme; and (v) promoting the development of technology/innovation “brokers” that would help the development of joint-projects to be supported by current programs.
• Facilitate the start up of science-based companies by: (i) supporting the development of technology transfer offices; (ii) reviewing the regulatory bottlenecks for the development of a venture capital industry in the country; (iii) encouraging market-oriented activities by public research institutes and technology parks; and (iv) promoting the restructuring of public R&D institutes by a schedule of progressively declining earmarked funding and the introduction of researcher-level incentives for diversification of revenues.
• Improve the overall governance structure of Croatia’s NIS by establishing a strategy for gradual implementation of a monitoring and evaluation system and consolidating and institutionalizing some of the programs (such as those for the
49
involvement of the Diaspora), and clarifying the roles of BICRO and the Croatian Institute of Technology.
121. In fostering innovation and technological progress in Croatia, two caveats should be kept in mind. First, because the main challenge is the commercialization of knowledge and not knowledge generation, standard S&T policy-measures should be complemented by selected investment climate reforms that encourage the private sector to demand knowledge (as for example, enterprise restructuring). Second, as innovation will be incremental in nature and not necessarily comprise radical breakthroughs, it would be advisable that S&T policies do not discriminate against, and if possible also support, progress in non-high technology sectors, including textile, footwear and agriculture.
5. Whither Strategy? Tailoring the Lisbon Agenda
122. This report has discussed four different options for how Croatia could reach and sustain higher rates of economic growth and thus speed up the process of economic convergence. It looked at “sources” or “reserves” of additional growth and discussed ways Croatia could unleash them. The four options could be summarized as follows:
a. Increase the contribution of labor to economic growth by raising labor participation and reducing unemployment. This in turn would require tackling disincentives for workers’ participation in the labor market, at the same time that restrictions for the adjustment of labor force to market conditions and the business cycle (firing conditions) are made flexible, the cost of labor is contained and skills mismatches are addressed. Addressing the skills mismatches, in turn, requires improving the responsiveness of vocational education and training to market demands at the same time that the provision of training (including life long learning services) is increased.
b. Improve allocative efficiency by promoting meaningful enterprise restructuring and by reforming product market regulation, particularly economic regulations (rather than administrative regulation) and including regulation in the infrastructure sector. Enterprise restructuring would also benefit from a better corporate governance regime and streamlined bankruptcy (exit) conditions, as well as the reduction of state-aids. Enterprise restructuring so far has been a major drag on economic growth rather than a source of market dynamism; The report’s study of firm-level productivity points to scope to raise technical efficiency (average productivity) by such measures as cutting red tape (e.g., reducing the time to get an import license), encouraging a further increase in the number of computer literate workers, reducing the incidence of power outages and increasing labor skills.
c. Deepen trade integration by promoting export-oriented FDI and developing the supply of exportable goods. For the latter, Croatia would need to expand its trade-related services (standards and quality, knowledge of foreign markets), further reduce its logistics costs and possibly expand and integrate its logistics infrastructure.
d. Foster technological progress by expanding private R&D, improving conditions for collaboration between universities and industry; facilitating the start up of science-based companies and strengthening the overall governance of Croatia’s National Innovation System.
50
123. While the report does not recommend the ultimate strategy or “policy-bundle” to be chosen, it does propose a framework for decision-making. Once the set of the “first-best” policies is mapped, policy-makers must identify what policies are politically feasible. Next, politically feasible strategies need to be checked for their consistency with the overall objective of raising and sustaining economic growth. Third, politically feasible and consistent reform-packages need to generate institutional requirements that are commensurate with the existing institutional endowments of Croatia.
• One critical factor is how to minimize the risk of reform reversals: policy-makers should take into account the appropriateness of the timing and sequencing of the reforms, as well as the credibility of mechanisms adopted to implement them and where appropriate compensate potential losers over time.
• When deciding which of the politically feasible measures are to be adopted, policy-makers need to take into account the several ways through which policies in one area complement or contradict objectives in other areas, generating different net-impacts on declared goals.
• Reform implementation is an institution-intensive activity and strong institutions are a scarce resource in transition economies. Adopting strategies whose institutional requirements are not commensurate with existing institutional endowments would increase the likelihood of reform reversal.
124. Applying this framework to the four strategies considered in this report might very well lead to a near-term focus on deepening trade integration and fostering innovation (a shortened version of the Lisbon Agenda), while measures related to expanding labor participation and employment could be adopted more gradually with a long-term perspective. Careful political consideration should also be given to a growth strategy based on tax-reduction (as discussed in more depth by the 2009 Public Finance Review). By strengthening Croatia’s international competitiveness, these measures would better position the country to fully benefit from EU Accession and to better manage the effects of the global financial crisis.
• In addition to the policy measures directly recommended for deepening trade and fostering innovation, the following complementary policy initiatives would be required:
- Advancing enterprise restructuring (privatization) and the promotion of stronger market competition (improving product market regulation and de-regulation).
- Adjusting the life long learning system to market needs, encouraging labor training by firms, and improving the supply of (selected) skills by possibly reviewing migration rules for labor market segments where the skills-gap is binding.
• Political resistance to the trade and innovation measures associated to the proposed strategy is likely to be comparatively low, with the exception of enterprise restructuring efforts. Compensatory policies for workers negatively affected by enterprise restructuring should be considered.
• Preliminary evidence on the positive association between access to non-banking finance and total factor productivity suggests further examination of the role of non-banking

51
financial institutions in the selection of investment opportunities and thus in fostering growth in Croatia.
52
References Alcala, F. and Ciccone, A. (2004) “Trade and Productivity”. The Quarterly Review of
Economics, vol. 119 (2), 2004.
Babic, Z., Matkovic T. and Sosic V. (2006) “Structural Changes in Tertiary Education and Impacts on the Labour Market”, Croatian Economic Survey, 2006
Bailey, M. N., Hulten, C., and Campbell, D. “The Distribution of Productivity.” Brookings Papers on Economic Activity: Microeconomics (1), 187-267, 1992.
Caselli, F. (2004) “Accounting for Cross-Country Income Differences”, CEPR Discussion Papers 4703, C.E.P.R. Discussion
Crnkovi�-Pozai�, S. (2008) “Effects of legislation, policy and institutions on labour force participation”, Background Paper
Dixit, A. (2007) “Evaluating recipes for development success”, The World Bank Research Observer, vol. 22, no.2, Fall 2007
Escribano, A. Guasch, J.L.; Orte,M. and Pena, J. (2008) “Croatia Investment Climate Assessment”, Background Paper prepared for the Report.
Gomes, Victor (2008). “Economic Growth and Predictions for Croatia”: A General Equilibrium Analysis. Background Paper prepared for the Report
Haussman, R.; Pritchett, L. and Rodrik, D. (2006), “Growth Accelerations.” Journal of Economic Growth, Vol.10:303-329, 2006.
Hsieh, C., & P. J. Klenow, 2007. "Misallocation and Manufacturing TFP in China and India," NBER Working Papers 13290, National Bureau of Economic Research.
Lejour, A.M. et al (2008): “The Economic Effects of the Lisbon Agenda Targets: The case of Croatia”: Background Paper prepared for the Report
MoE-FIN (1999): Education and Research 1999-2004. Ministry of Education Plan – Finland. Helsinki: Ministry of Education of the Republic of Finland. Excerpts related to lifelong learning policy available at: http://www.ilo.org/public/english/employment/skills/hrdr/topic_n/t14_fin.htm
Restuccia, D.,& R. Rogerson, 2007. "Policy Distortions and Aggregate Productivity with Heterogeneous Plants," Working Papers tecipa-283, University of Toronto, Department of Economics.
Crnkovi�-Pozai�, S. (2008) “Effects of legislation, policy and institutions on labour force
participation”, Background Paper
Tahvainen, S. (2006): Lifelong learning and adult training in Finland. Presentation given at the workshop Transnational exchange for active ageing. Sofia, October 19–20, 2006. Available at: http://www.activeageing.org/Workshop/Workshop_Bulgaria/Tahvanainen.pdf.

53
Summary Table – Croatia Growth Strategy: How to Reach and Sustain Higher Rates of Economic Growth GOAL/ ISSUE SHORT TERM MEASURES MEDIUM TERM MEASURES
Increasing Employment
Increasing labor force participation Tackling disincentives for the supply of labor embedded in the current social protection system
• Strengthen incentives for deferred retirement; tighten the system of benefits granted to war veterans and decouple reproductive behavior from unemployment status for women
Reducing unemployment Flexibilizing restrictions to the adjustment of the labor force to market conditions and business cycles (firing conditions); aligning labor costs to labor productivity and addressing the current skills mismatches
• Advance the reform of vocational education & training and life long learning to improve their responsiveness to market demands
• Reduce procedural and monetary costs of dismissal (perhaps combining this with measures to increase income security of unemployment)
• Review the statutory provisions on mandatory extensions of collective agreements to all employers in an industry
Raising Productivity
Improving allocative efficiency Strengthening the process of “creative destruction”
• Advance the privatization process and improve corporate governance in the remaining state-owned enterprises
• Reduce state-aid for declining sectors and streamline the bankruptcy regime to facilitate exit of uncompetitive enterprises
• Fully implement regulatory impact assessment and eliminate unnecessary government-generated barriers to entry
• Further liberalize entry into the service sector (particularly retail and infrastructure)
• Complete market-reforms in the agricultural sector to favor private sector development
Augmenting technical efficiency
Improving the investment climate (selected aspects)
• Reduce the time need to obtain a trade-related (particularly import) license;
• Adopt technology policies to facilitate ICT-use by SMEs in services; labor intensive and agriculture sectors
• Improve labor skills by investing in vocational education and training and life-long learning programs
• Increase the supply of personnel with secondary and graduate education, and possibly review immigration policy for selected professional occupations.
Deepening Trade Integration

54
Attracting FDI • Facilitate access to high/selected labor skills (graduate and secondary level); streamline access to land; reduce the time to obtain trade licenses and improve the access to reliable energy
• Further streamline regulations affecting foreign investment
• Improve the security and reliability of power supply
• Enhance Croatia’s FDI promotion strategy towards R&D-intensive and export-oriented companies
Increasing the supply of exportable goods
• Improve awareness of standards and quality requirements
• Strengthen the national quality system; expand the availability of quality certification institutions; and enhance Croatia’s trade promotion strategy
• Enhance Croatia’s competitiveness as a transit country
• Improve the access of small companies oriented to the domestic and local markets to transportation services
Fostering Technological Progress and Innovation
Encouraging private R&D and innovation
Adequacy of incentives and availability of researchers
• Review the framework and the administration of tax incentives, grants and loans for greater efficiency
• Adopt a brokers program to facilitate the matching between the enterprise needs and existing programs
• Increase the supply of scientists and engineers by adjusting higher-education policies; possibly reviewing immigration policy and encouraging the internal integration of local scientific community.
• Strengthen the institutional capacity and gradually increase the funding for UKF (and related) programs
Improving the incentive regime for collaboration between research institutes and the private sector
Enable the commercialization of research results and research capacity
• Review criteria for progress in the academic career
• Support the development of technology transfer offices in universities
• Simplify and broaden the scope of Bicro’s SPREAD Program
• Further facilitate the start up of science-based companies
• Simplify the legal requirements for collaboration between public universities, research centers and the enterprise sector;
• Progressively reduce earmarked non-competitive funds for research institutes
Improving the overall governance structure of Croatia NIS.
• Implement a monitoring and evaluation system
• Institutionalize successful innovation programs
• Clarify the roles of different institutions in the NIS
• De-politicize appointments to institutions of Croatia NIS

55