crm software vendors’ evaluation survey perspectivehosteddocs.ittoolbox.com/gccrm082605.pdf ·...
TRANSCRIPT

CRM Software Vendors’ Evaluation
Survey Perspective
Quarter 3, 2005

2
2CRM Software Vendors’ Evaluation – Survey Perspective
About Us
GCCRM Vision
ROADMAP CRM BEST PRACTICE through the collaboration of global intelligence on evaluation and benchmarking.
GCCRM is an independent CRM evaluation organization founded in 2001. Through evaluation, enhancement and benchmark with best practices, GCCRM helps to roadmap organizations’ CRM - where they are, where to go and how to get there. GCCRM preaches the belief of “CRM Success Beyond SoftwareTM” via awards, methodology, research & portal.
GCCRM Evaluation Guide It is a 360-degree, vendor-independent, easy-to-read evaluation guide for management and decision makers. Since the launch in 2002, the guide (previously named as China CRM Solution Guide) is the most influential CRM solution guide book in the region. Ten-of-thousand copies have been downloaded at GCCRM.com. An upgraded version will be launched in Q3 2005, including the latest survey results on CRM software vendors, outsourcing call center vendors, and CRM consulting vendors. Vendors will be featured and analyzed from four different angles: global perspective from world-renowned analysts, China perspective from local research team, survey perspective from the online and offline research findings and user perspective from interviewing the vendors’ clients.
Contact Us:
Ms Alice Tse Operations Director GCCRM Email: [email protected]: 86 21 63512506 URL: www.gccrm.comAddress: Suite 709-710, 400 Zhejiang (C) Road, Shanghai 200001
Copyright © 2005 GCCRM All Rights Reserved
The copyright in and title to the report ‘CRM Software Vendors’ Evaluation – Survey Perspective’ belongs to GCCRM. Please contact [email protected] should you want to reprint or quote any part of this report. Any agreed copy must be marked with
all proprietary notices which appear on the original and will be subject to the requirement that you will acknowledge on the face of the reproduced material that it belongs to GCCRM

3
3CRM Software Vendors’ Evaluation – Survey Perspective
Contents
Preface.........................................................................................................................................................5 Section 1: Basic Findings.............................................................................................................................7 1. Product Survey ........................................................................................................................................7
1.1 Product Rating ............................................................................................................................7 1.2 Development of CRM Vendors Vary............................................................................................ 8 1.3 Customer Satisfaction Survey .....................................................................................................9
2. Brand Image Rating ...............................................................................................................................10 2.1 Siebel, SAP and Oracle Keep the Lead ....................................................................................10 2.2 Reshuffle in the Bottom 3 Positions .......................................................................................... 11 2.3 Microsoft CRM Catch the Lead, Aligning with the 1st Tier......................................................... 11
3. Survey on Customers’ “Most Preferable Choice” ...................................................................................12 3.1 Customers’ “Most Preferable Choice” Consistent with Brand Image Ranking...........................12 3.2 Siebel Leads the Market with Distinguished Privilege ...............................................................12 3.3 Reasons behind Customers’ Most Preferable Choice ...............................................................13
4. Survey on Customers’ “Least Preferable Choice” ..................................................................................15 4.1 Overall Ranking in “Least Preferable Choice” ...........................................................................15 4.2 Overseas Vendors Need Further Localization...........................................................................15 4.3 Reasons behind Customers’ “Least Preferable Choice”............................................................16
Section 2: Summary...................................................................................................................................18 1. A Full Analysis of 10 the CRM Software Vendors...................................................................................18
1.1 Major Gap between the 2 Tiers .................................................................................................18 1.2 Uneven Development within the Tier......................................................................................... 19
2. Correlations: Choices to Product and Brand Image...............................................................................20 2.1 Closely Correlated between Most Preferable Choice and Brand Image ...................................20 2.2 Relately Correlated between Least Preferable Choice and Product .........................................21
3. Existing and Potential Clients’ Expectations on CRM Software Vendors ...............................................22 3.1 Product......................................................................................................................................22 3.2 Service ......................................................................................................................................22 3.3 Others .......................................................................................................................................22
Appendix: Sample Questionnaire...............................................................................................................24

4
4CRM Software Vendors’ Evaluation – Survey Perspective
List of Figures Figure1. Product Rating of the 10 CRM Software Vendors..........................................................................7 Figure2. Score Distribution of the 10 CRM Software Vendors .....................................................................8 Figure3. Rating of the 10 CRM Software Vendors’ Products .......................................................................9 Figure4. Brand Image Ranking of the 10 CRM Software Vendors.............................................................10 Figure5. Score Distribution of Brand Image Rating of the 10 CRM Software Vendors .............................. 11 Figure6. Customers’ Most Preferable Choice of CRM Software Vendors ..................................................12 Figure7. Reasons of Customers’ Most Preferable Choice .........................................................................13 Figure8. Customers’ “Least Preferable Choice” .........................................................................................15 Figure9. Reasons of Customers’ “Least Preferable Choice”......................................................................16 Figure10. Scatter Diagram of 10 CRM Software Vendors, Product vs Brand Image .................................18 Figure11. Comparison of Product and Brand Image Rating between Tier 1 & 2........................................19 Figure12. Correlations: Brand Image Ranking vs Most Preferable Choice; Product Ranking vs Most Preferable Choice ......................................................................................................................................20 Figure13. Correlations: Brand Image Ranking vs Least Preferable Choice; Product Ranking vs Least Preferable Choice ......................................................................................................................................21
5
5CRM Software Vendors’ Evaluation – Survey Perspective
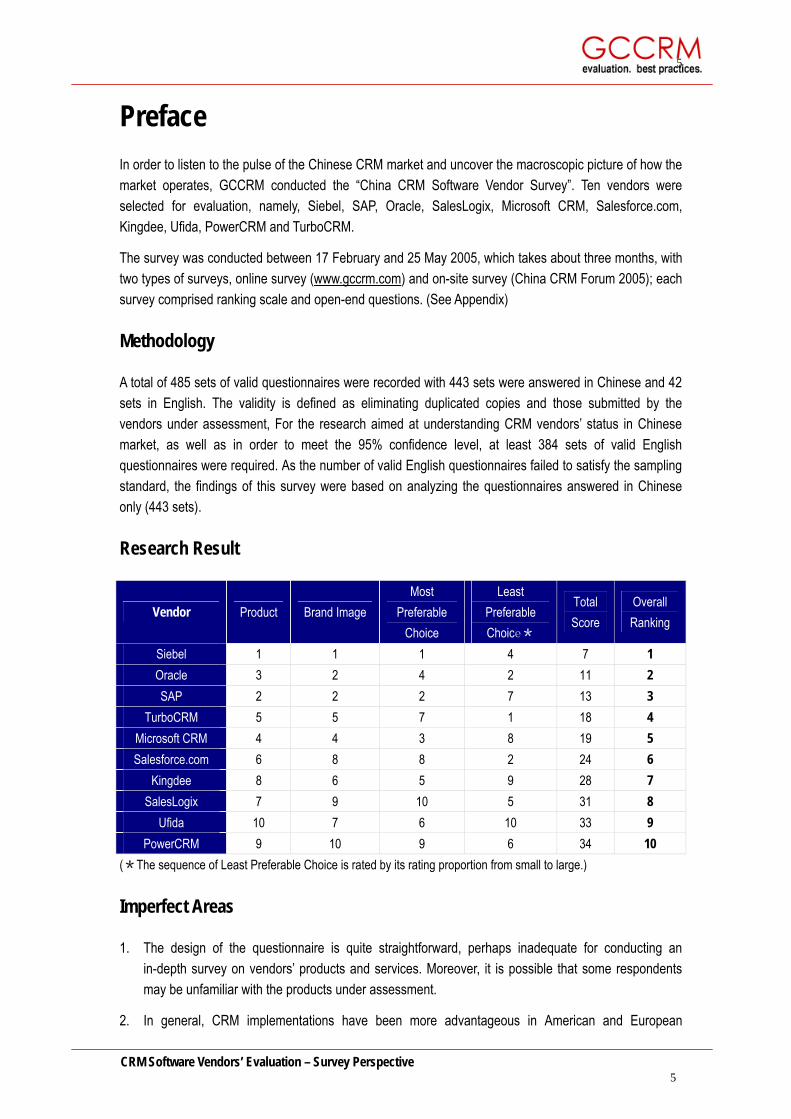
Preface In order to listen to the pulse of the Chinese CRM market and uncover the macroscopic picture of how the market operates, GCCRM conducted the “China CRM Software Vendor Survey”. Ten vendors were selected for evaluation, namely, Siebel, SAP, Oracle, SalesLogix, Microsoft CRM, Salesforce.com, Kingdee, Ufida, PowerCRM and TurboCRM.
The survey was conducted between 17 February and 25 May 2005, which takes about three months, with two types of surveys, online survey (www.gccrm.com) and on-site survey (China CRM Forum 2005); each survey comprised ranking scale and open-end questions. (See Appendix)
Methodology
A total of 485 sets of valid questionnaires were recorded with 443 sets were answered in Chinese and 42 sets in English. The validity is defined as eliminating duplicated copies and those submitted by the vendors under assessment, For the research aimed at understanding CRM vendors’ status in Chinese market, as well as in order to meet the 95% confidence level, at least 384 sets of valid English questionnaires were required. As the number of valid English questionnaires failed to satisfy the sampling standard, the findings of this survey were based on analyzing the questionnaires answered in Chinese only (443 sets).
Research Result
Vendor Product Brand Image Most
Preferable Choice
Least Preferable Choice*
Total Score
Overall Ranking
Siebel 1 1 1 4 7 1 Oracle 3 2 4 2 11 2 SAP 2 2 2 7 13 3
TurboCRM 5 5 7 1 18 4 Microsoft CRM 4 4 3 8 19 5 Salesforce.com 6 8 8 2 24 6
Kingdee 8 6 5 9 28 7 SalesLogix 7 9 10 5 31 8
Ufida 10 7 6 10 33 9 PowerCRM 9 10 9 6 34 10
(*The sequence of Least Preferable Choice is rated by its rating proportion from small to large.)
Imperfect Areas
1. The design of the questionnaire is quite straightforward, perhaps inadequate for conducting an in-depth survey on vendors’ products and services. Moreover, it is possible that some respondents may be unfamiliar with the products under assessment.
2. In general, CRM implementations have been more advantageous in American and European

6
6CRM Software Vendors’ Evaluation – Survey Perspective
corporations. As a result, the findings of this survey are meant to reflect the performances of CRM vendors in China only rather than in the global market.
3. CRM market in China is still at the initial stage of development; together with many uncertaineries that the vendors and users work on the market, therefore, the vendors’ overall ranking may soon vary.
The Survey Perspective on China CRM Software Vendor together with the Global Perspective, China Perspective and User Perspective are the four sections in China CRM Software Vendors’ Evaluation Guide.

7
7CRM Software Vendors’ Evaluation – Survey Perspective
Section 1: Basic Findings
1. Product Survey
1.1 Product Rating
1.1.1 Siebel is the Winner, Followed by SAP and Oracle
As shown in Figure 1, Siebel has the highest score of 4.04 among the ten selected CRM vendors; SAP comes second with a score of 3.91 whereas Oracle ranks third with a score of 3.48. Siebel, SAP and Oracle secure the top three positions by their solid product capacities; their scores are 14%, 11% and 9%, respectively, higher than the mean score of 3.53.
Average
3.1
3.3
3.5
3.7
3.9
4.1
Siebel SAP Oracle MicrosoftCRM
TurboCRM Salesforce.com
SalesLogix Kingdee PowerCRM Ufida
Figure1. Product Rating of the 10 CRM Software Vendors
Regarding the score distribution of each CRM vendor, Siebel, SAP and Oracle again are the top three vendors receiving the highest percentage of “Very Good” rating (Very Good = 5) with 39.6%, 29% and 13% respectively (Figure 2). The respective rankings of these three vendors have remained unchanged when compared with the findings obtained in Product Rating. In addition, they are also the three CRM vendors which have the lowest percentage of “Very Poor” rating (Very Poor = 1) with 1.0% 1.8% and 1.9% respectively.
1.1.2 Ufida, PowerCRM and Kingdee Lag Behind
As shown in Figure 1, Ufida, PowerCRM and Kingdee are rated as the bottom three CRM vendors with a score of 3.16, 3.18 and 3.27 respectively; and they are 10.5%, 10.0% and 8.4 % , respectively, below the mean score (mean: 3.53).
Regarding the score distribution(Figure 2), Ufida, PowerCRM and Kingdee are also the top three vendors

8
8CRM Software Vendors’ Evaluation – Survey Perspective
receiving the highest percentage of “Very Poor” rating (Very Poor =1) , with 7.7%, 6.3% and 6.1% respectively; and again, they are the three vendors receiving the least percentage of “Very Good” rating, with 11.7%, 13.0% and 8.7% respectively.
0% 25% 50% 75% 100%
PowerCRM
Ufida
Kingdee
SalesLogix
Salesforce. Com
TurboCRM
Microsoft CRM
Oracle
SAP
Siebel
Very GoodGoodNormalPoorVery Poor
Figure2. Score Distribution of the 10 CRM Software Vendors
1.2 Development of CRM Vendors Vary
1.2.1 Overseas CRM Vendors have Strong Capacities but Uneven Development
The survey shows that CRM vendors from overseas have very solid product capacities as the top three products ranked by the respondents are all developed by vendors from overseas. However, the development of overseas CRM vendors is not level. In spite of Siebel, SAP, Oracle and Microsoft CRM capturing the top three positions, Salesforce.com and SalesLogix receive below the mean scores (mean: 3.53) of 3.45 and 3.34 respectively, taking the 5th and the 6th positions respectively among the overseas CRM vendors under evaluation.
Compared with local CRM vendors in China, such as TurboCRM, their scores in Product Rating (Salesforce.com: 3.45; SalesLogix: 3.34) are lower than that of TurboCRM (3.52); and they have a poor “Very Good” rating, with 14% and 13.1% respectively, whereas TurboCRM has 15.7%.
1.2.2 Local CRM Vendors have Weaker Capacities but Unbalanced Development
The survey on Product Ratings reveals that local CRM vendors have weaker product capacities as the bottom three vendors ranked by the respondents are all local CRM vendors. However, among the four local CRM vendors under assessment, TurboCRM has an outstanding performance with a score of 3.52 in Product Ratings, taking the 5th position behind Siebel, SAP, Oracle and Microsoft CRM and surpasses the overseas CRM vendors Salesforce.com and SalesLogix.
9
9CRM Software Vendors’ Evaluation – Survey Perspective
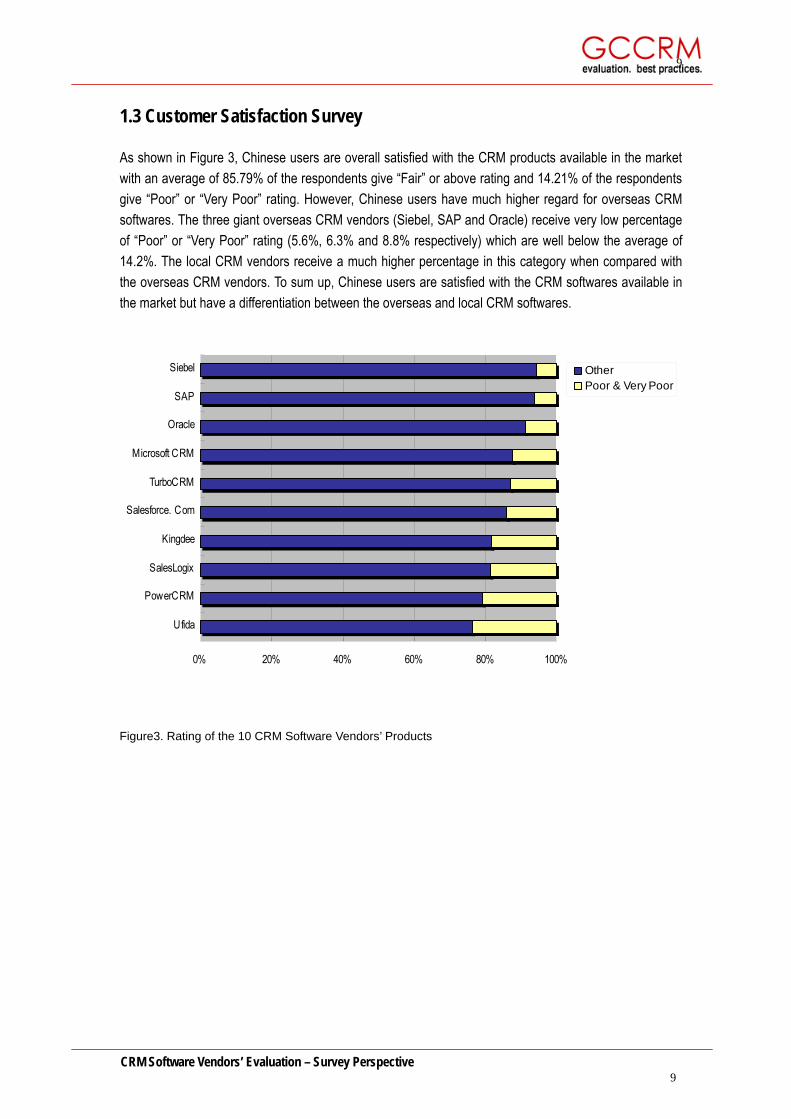
1.3 Customer Satisfaction Survey
As shown in Figure 3, Chinese users are overall satisfied with the CRM products available in the market with an average of 85.79% of the respondents give “Fair” or above rating and 14.21% of the respondents give “Poor” or “Very Poor” rating. However, Chinese users have much higher regard for overseas CRM softwares. The three giant overseas CRM vendors (Siebel, SAP and Oracle) receive very low percentage of “Poor” or “Very Poor” rating (5.6%, 6.3% and 8.8% respectively) which are well below the average of 14.2%. The local CRM vendors receive a much higher percentage in this category when compared with the overseas CRM vendors. To sum up, Chinese users are satisfied with the CRM softwares available in the market but have a differentiation between the overseas and local CRM softwares.
0% 20% 40% 60% 80% 100%
Ufida
PowerCRM
SalesLogix
Kingdee
Salesforce. Com
TurboCRM
Microsoft CRM
Oracle
SAP
Siebel OtherPoor & Very Poor
Figure3. Rating of the 10 CRM Software Vendors’ Products

10
10CRM Software Vendors’ Evaluation – Survey Perspective
2. Brand Image Rating
2.1 Siebel, SAP and Oracle Keep the Lead
The overall ranking of Brand Image is consistent with that of the Product Ratings. Siebel, SAP and Oracle, again win the top three positions, receiving a score of 4.05, 4.03, and 4.03 respectively, and are 12.8%, 12.3% and 12.3% higher than the mean score (mean: 3.59) respectively. (See Figure 4)
Average
3.1
3.3
3.5
3.7
3.9
4.1
Siebel Oracle SAP MicrosoftCRM
TurboCRM Kingdee Ufida Salesforce.com
SalesLogix PowerCRM
Figure4. Brand Image Ranking of the 10 CRM Software Vendors
As illustrated in Figure 5, Siebel and SAP receive the highest percentage of “Very Good” rating, with 41.2% and 39.1% respectively, keeping a good mile from their rivals and consolidating their dominant position in the Chinese market.

11
11CRM Software Vendors’ Evaluation – Survey Perspective
0% 25% 50% 75% 100%
PowerCRM
SalesLogix
Salesforce. Com
Microsoft CRM
Oracle
Kingdee
TurboCRM
Ufida
SAP
Siebel
Very GoodGoodNormalPoorVery Poor
Figure5. Score Distribution of Brand Image Rating of the 10 CRM Software Vendors
2.2 Reshuffle in the Bottom 3 Positions
Unlike the ranking in Product Ratings, the bottom three positions in Brand Image ranking have changed significantly. Two overseas CRM vendors Salesforce.com (3.25) and SalesLogix (3.19) fall down to the bottom three, replacing Ufida and Kingdee. Meanwhile, PowerCRM remains in the bottom three, in both Product Rating and Brand Image Rating (3.15).
The score distribution in Image Brand Rating reveals that Ufida, Kingdee and PowerCRM receive the highest percentage of “Very Poor” rating (8.4%, 5.4% and 5.2% respectively), their performances in this category match with that in Product Rating.
For the two overseas CRM vendors Salesforce.com and SalesLogix, although some Chinese users have high regard for their products, they need to strengthen their brand advertising in the Chinese market.
2.3 Microsoft CRM Catch the Lead, Aligning with the 1st Tier
Microsoft CRM receives a better score in Brand Image, from 3.6 in Product Rating to 4.02 in Brand Image Rating, aligning itself with the first tier in Brand Image Rating.
Despite having a powerful brand and a remarkably high score in Brand Image Rating, Microsoft CRM’s products need to be advanced as they are incompatible with their sophisticated brand image (as shown in its Product Rating and Brand Image Rating). In fact, Microsoft CRM has been lagged behind by Siebel and SAP, which are the brand leaders in the Chinese CRM market.

12
12CRM Software Vendors’ Evaluation – Survey Perspective
3. Survey on Customers’ “Most Preferable Choice”
3.1 Customers’ “Most Preferable Choice” Consistent with Brand Image
Ranking
Having analysed customers’ Most Preferable Choice on CRM vendors (Figure 6), we can divide the CRM vendors into three Tiers. The 1st Tier comprises overseas vendors Siebel, SAP, Microsoft CRM and Oracle; the 2nd Tier includes local vendors Ufida, Kingdee and TurboCRM; while the 3rd Tier, a combination of overseas and local vendors, comprises Salesforce.com, PowerCRM and SalesLogix. The ranking in Customers’ Most Preferable Choice is basically consistent with that in Brand Image.
0.00%
7.00%
14.00%
21.00%
28.00%
35.00%
Siebel SAP MicrosoftCRM
Oracle Kingdee Ufida TurboCRM Salesforce.com
Pow erCRM SalesLogix
Figure6. Customers’ Most Preferable Choice of CRM Software Vendors
3.2 Siebel Leads the Market with Distinguished Privilege
As shown in Figure 6, Siebel remains to be the market leader and prevails over other CRM vendors on Customers’ Most Preferable Choice by receiving the highest percentage of 30.34%, leaving its rivals far behind, including the vendors in the 1st Tier, SAP (19.94%), Microsoft CRM (13.48%) and Oracle (11.24%).

13
13CRM Software Vendors’ Evaluation – Survey Perspective
3.3 Reasons behind Customers’ Most Preferable Choice
21.50%
16.90%
11.60%
0.00% 5.00% 10.00% 15.00% 20.00% 25.00%
Brand Image
Product
Industry Experience
Figure7. Reasons of Customers’ Most Preferable Choice
The three most important reasons are:(Figure 7)
1. Brand Image. 21.5% of the respondents made vendors’ prestigious brand image as the reason of Most Preferable Choice.
2. Product. 16.9% of the respondents made vendors’ one-up product as the reason of Most Preferable Choice.
3. Industry Experience. 11.6% of the respondents made vendors’ ample industry experience in implementation as the reason of Most Preferable Choice.
3.3.1 Why Overseas Vendors
The three main reasons for choosing overseas CRM vendors as the Most Preferable Choice are:
1. Prestigious Brand Image: 23.6% of the respondents said because of the prestigious brand image, they had high regard for its products.
2. Distinguished Application Functions: 18.6% of the respondents made their Most Preferable Choice mainly based on the product itself, such as product integration, design concept, and how user friendly it was.
3. Extensive Implementation: 12% of the respondents said CRM vendor’s ample experience in implementation was their major consideration as this would facilitate the enterprises in CRM implementation.

14
14CRM Software Vendors’ Evaluation – Survey Perspective
3.3.2 Why Local Vendors
The three main reasons for choosing local vendors as the Most Preferable Choice are:
1. Privilege in Localization: 31.1% of the respondents said privilege in localization was the main reason because local CRM vendors were more familiar with the overall situation in China and the Chinese CRM market. Chinese clients felt much easier to communicate with local vendors and the products offered by local vendors were suitable for the practical situation in China. Therefore, local vendors are their Most Preferable Choice.
2. Cheap Price: 15.6% of the respondents said price was the major reason. Compared with overseas CRM giants, local CRM vendors have a great advantage in pricing. As a result, quite a number of Chinese users picked local CRM vendors as their Most Preferable choice.
3. Comprehensive After Sales Service: 12.5% of the respondents said a comprehensive after sales service was their major consideration. They believed it was much convenient to get after sales service from local CRM vendors. Consequently, service is one of the main reasons.

15
15CRM Software Vendors’ Evaluation – Survey Perspective
4. Survey on Customers’ “Least Preferable Choice”
4.1 Overall Ranking in “Least Preferable Choice”
As illustrated in Figure 8, Ufida and Kingdee are top of the list when respondents are asked to choose their “Least Preferable Choice” among the selected CRM vendors; receiving the highest percentage of 25.7% and 18.27% respectively, far exceed their rivals. Siebel and Oracle receive a much lower rating of 5.57% and 5.26% respectively. Despite gaining users’ recognition in “Customers’ First Choice”, the two overseas vendors Microsoft CRM (11.46%) and SAP (8.67%) hold the 3rd and 4th positions respectively in “Customers’ Least Preferable Choice” ranking. Moreover, local CRM vendor TurboCRM is the one receiving the lowest percentage of 4.95%.
0.00%
7.00%
14.00%
21.00%
28.00%
Ufida Kingdee MicrosoftCRM
SAP Pow erCRM SalesLogix Siebel Oracle Salesforce.com
TurboCRM
Figure8. Customers’ “Least Preferable Choice”
4.2 Overseas Vendors Need Further Localization
The CRM giants from overseas have embraced the Chinese market by their cutting-edge products and brand images, but to sustain their marketplace dominance is not an easy task. Overseas CRM vendors Microsoft CRM and SAP hold the 3rd and 4th positions in the survey on Customers’ “Least Preferable Choice”, lag closely behind Ufida and Kingdee; in addition, Siebel and Oracle are also on the list. As some of the respondents explained why overseas vendors were their “Least Preferable Choice”.
“CRM vendors from overseas fail to provide tailor-made products aiming at different industries and it’s impossible for them to fully understand the situation in China in a short time because CRM is not simply just software, it has to integrate with various interface in implementation.”

16
16CRM Software Vendors’ Evaluation – Survey Perspective
4.3 Reasons behind Customers’ “Least Preferable Choice”
29.80%
17.70%
8.90%
0.00% 5.00% 10.00% 15.00% 20.00% 25.00% 30.00% 35.00%
Industry Experience
Brand Image
Product
Figure9. Reasons of Customers’ “Least Preferable Choice”
The three most important reasons are:(Figure 9)
1. Product. 29.8% of the respondents made vendors’ product itself as the reason of Least Preferable Choice.
2. Brand Image. 17.7% of the respondents made vendors’ brand image as the reason of Least Preferable Choice.
3. Industry Experience. 8.9% of the respondents made vendors’ industry experience in implementation as the reason of Least Preferable Choice.
4.3.1 Why Local CRM Vendors
The three main reasons for choosing local CRM vendors as the “Least Preferable Choice” are:
1. Product: 30.2% of the respondents said the product itself was the main reason why they would try to avoid choosing local CRM vendors, for instance, impractical, poor quality and service. Thus, the poor performance of CRM products offered by local vendors was the most common explanation given by the respondents.
2. Immaturity: 17.5% of the respondents said the immaturity of local CRM vendors was one of their main considerations. Being scarcely implemented, local CRM software was unpopular among the Chinese users.
3. Brand Image: 15.9% of the respondents considered the brand image as the major reason. They believed the local CRM vendors were amateurs in CRM software. As some of the respondents pointed out, Ufida and Kingdee were proficient financial software providers but just started in developing CRM software.
17
17CRM Software Vendors’ Evaluation – Survey Perspective
4.3.2 Why Overseas Vendors
The three main reasons for choosing overseas CRM vendors as the “Least Preferable Choice” are:
1. Adaptability: 29.5% of the respondents said adaptability was the major concern. Some respondents said overseas CRM software was mainly designed for giant enterprises, and was inadequate for Chinese users.
2. Brand Image: 19.7% of the respondents said brand awareness was the most important reason. Some said they were not familiar with overseas CRM vendors, not to mention using their products.
3. Price: 13.1% of the respondents said price was the core factor. When choosing between local and overseas CRM software, price is the main concern for Chinese users.

18
18CRM Software Vendors’ Evaluation – Survey Perspective
Section 2: Summary
1. A Full Analysis of 10 the CRM Software Vendors
Figure10. Scatter Diagram of 10 CRM Software Vendors, Product vs Brand Image
Using the scores obtained in Product Rating and Brand Image Rating to plot a scatter diagram, then moved the central point to the Product mean score and Brand Image mean score (i.e. 3.53, 3.59) as shown in Figure 10, two main clusters (the two oval-shaped figures) could be found. To facilitate our analysis, the orange oval-shaped figure is defined as Tier 1, comprising 4 overseas CRM vendors, namely, Siebel, SAP, Oracle and Microsoft CRM; the 3rd Quadrant oval-shaped figure is defined as Tier 2, comprising 6 CRM vendors, namely, TurboCRM, Salesforce.com, Kingdee, SalesLogix, Ufida and PowerCRM.
1.1 Major Gap between the 2 Tiers
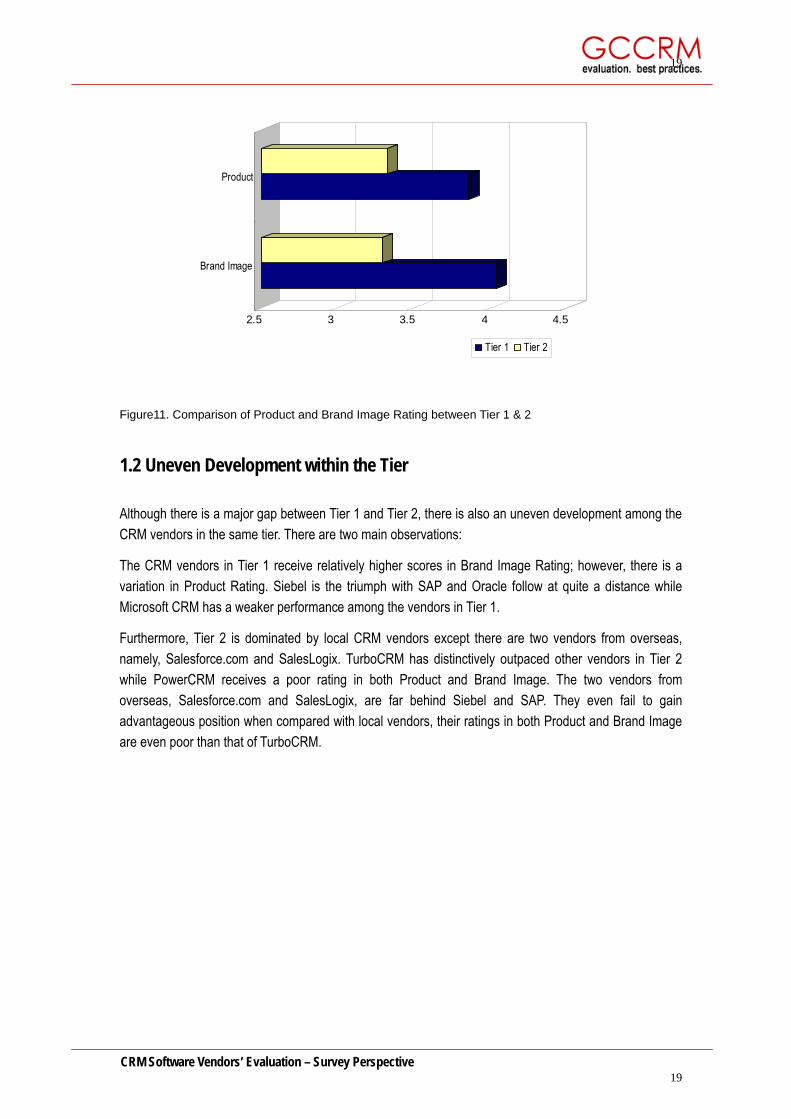
Given the scores obtained by each tiers, one could see a major gap between the 2 tiers (Figure 11). For Product Rating, Tier 1 and Tier 2 receive a mean score of 3.85 and 3.32 respectively. While in Brand Image Rating, Tier 1 attains a mean score of 4.03 whereas Tier 2 has 3.29 only. With a full suite of CRM application, strong technological development and prestigious brand image, the 4 overseas CRM vendors from Tier 1 have secured their positions at the top of the pyramid and become the pioneers in the market. CRM vendors in Tier 2, a combination of local and overseas vendors, are amply distant from those in Tier 1, owing to their own limitations such as product or brand advertising,
19
19CRM Software Vendors’ Evaluation – Survey Perspective
2.5 3 3.5 4 4.5
Brand Image
Product
Tier 1 Tier 2
Figure11. Comparison of Product and Brand Image Rating between Tier 1 & 2
1.2 Uneven Development within the Tier
Although there is a major gap between Tier 1 and Tier 2, there is also an uneven development among the CRM vendors in the same tier. There are two main observations:
The CRM vendors in Tier 1 receive relatively higher scores in Brand Image Rating; however, there is a variation in Product Rating. Siebel is the triumph with SAP and Oracle follow at quite a distance while Microsoft CRM has a weaker performance among the vendors in Tier 1.
Furthermore, Tier 2 is dominated by local CRM vendors except there are two vendors from overseas, namely, Salesforce.com and SalesLogix. TurboCRM has distinctively outpaced other vendors in Tier 2 while PowerCRM receives a poor rating in both Product and Brand Image. The two vendors from overseas, Salesforce.com and SalesLogix, are far behind Siebel and SAP. They even fail to gain advantageous position when compared with local vendors, their ratings in both Product and Brand Image are even poor than that of TurboCRM.

20
20CRM Software Vendors’ Evaluation – Survey Perspective
2. Correlations: Choices to Product and Brand Image
To examine the relations among Customers’ choice (Most Preferable Choice or Least Preferable Choice), Product and Brand Image, we apply the Theory of Correlation (let r be the correlation coefficient). The closer coefficient is to the absolute value of 1, then the greater is the correlation.
2.1 Closely Correlated between Most Preferable Choice and Brand Image
Computation shows that the correlation coefficient between Brand Image Ranking and Customers’ Most Preferable Choice Ranking is 0.94; and the correlation coefficient between Product Ranking and Customers’ Most Preferable Choice Ranking is 0.73 (Figure 12).
0 2 4 6 8 10 120
2
4
12
6
8
10
r = 0.94
Figure12. Correlations: Brand Image Ranking vs Most Preferable Choice; Product Ranking vs Most
Preferable Choice
To customers’ most Preferable Choice Vendor, customers’ Most Preferable Choice is closely related to both Product and Brand Image; and the correlation between Brand Image and Customers’ Most Preferable Choice (r = 0.94) is stronger than that between Product and Customers’ Most Preferable Choice (r = 0.73). When r = 0.94, we could deduce that the two variables are absolutely correlated. As a result, there is a strong correlation between Brand Image, Product and Customers’ Most Preferable Choice, but that between Brand Image and Most Preferable Choice is stronger..
0 2 4 6 8 10 120
2
4
12
6
8
10
Product Ranking VS Most Preferable Choice Brand Image Ranking VS Most Preferable Choicer=0.43M
ost Preferable t Choice
Most Preferable t C
hoice
Product Ranking Brand Image Ranking

21
21CRM Software Vendors’ Evaluation – Survey Perspective
2.2 Relately Correlated between Least Preferable Choice and Product
Similarly, the correlation coefficient between Product Ranking and Customers’ Least Preferable Choice Ranking is 0.43; and the correlation coefficient between Brand Image Ranking and Customers’ Least Preferable Choice Ranking is 0.11(Figure 13).
Figure13. Correlations: Brand Image Ranking vs Least Preferable Choice; Product Ranking vs Least
Preferable Choice
Furthermore, the correlation coefficient between Product Ranking and Customers’ Least Preferable Choice is 0.43, and the correlation coefficient between Brand Image Ranking and Customers’ Least Preferable Choice is .011. When r = 0.43, it means the two variables have an acceptable degree of correlation. Whereas r = 0.11, it means the correlation between the two variables is very weak. Therefore, Customers’ Least Preferable Choice is moderately correlated to Product but hardly correlated to Brand Image.
In conclusion, for the Chinese users, there is a strong correlation between Customers’ Most Preferable Choice and Brand Image; and a moderate correlation between Customers’ Least Preferable Choice and Product.
0 2 4 6 8 10 120
2
4
6
8
10
12 r = 0.73
0 2 4 6 8 10 120
2
4
12
6
8
10
r=0.11
Product Ranking VS Least Preferable
Least Preferable Choice
Product Ranking
B
ing
rand Image Ranking VS Least Preferable
Least Preferable Choice
Brand Image Rank

22
22CRM Software Vendors’ Evaluation – Survey Perspective
3. Existing and Potential Clients’ Expectations on CRM Software
Vendors
3.1 Product
More than 45% of the respondents have expressed their opinions or suggestions which could be concluded as follow:
1. Price. Price is the biggest concern. Respondents said most of the CRM products were expensive, anticipating a price adjustment in accordance to the situation in China.
2. Localization. CRM products developed by overseas vendors should be localized to meet the development of Chinese enterprises. Moreover, local vendors should learn the successful experience from overseas vendors to improve the quality their products.
3. Product Development. Systems integration, compatibility of softwares, ease of use, and a full suite of CRM application functions are the major concerns listed by the respondents. Respondents are particularly desperate for solutions for system integration and ease of use.
3.2 Service
In questionnaire survey, 19.4% of the respondents have expressed their suggestions on CRM vendors, mainly about the after sales service, training package and consultation service:
1. After sales service. Vendors should reinforce their after sales services, taking customers’ standpoint to find out what exactly are the services required by the customers instead of pushing the sales of their products only.
2. Training service. Some respondents hoped vendors could provide a full suite of training services for customers because a suitable training package could help enterprises to better understand and fully utilize the products.
3. Consultation Service. A small percentage of respondents suggested that a CRM vendor should integrate its advantage in knowledge as a consultant to provide consultation service. This is also an important element for successful implementation of CRM projects.
3.3 Others
Some respondents expressed their expectations on the future development in the Chinese CRM market, 27.2% of them focused on the adaptability, knowledge promotion and standardization:
1. Marketplace adaptability. Many respondents suggested the CRM vendors to focus on the prospect of small and medium-sized enterprises in China, and categorize their products for different industries.
2. Knowledge promotion. Many respondents mentioned about knowledge promotion and case study.
23
23CRM Software Vendors’ Evaluation – Survey Perspective
They hoped the promotion could move beyond conceptual or theoretical aspects by integrating case study on enterprises with successful CRM implementation. Moreover, there is a strong demand in learning and enhancement of CRM knowledge base.
3. Standardization. Some respondents suggested that there should be a standard specification; more research and reports should be customised for the Chinese enterprises, in addition to facilitating the prosperity and healthy development of the market via CRM promotion.

24
24CRM Software Vendors’ Evaluation – Survey Perspective
Appendix: Sample Questionnaire
1. Please rate the following CRM software vendors Product and Brand Image based on your own experience or perception: (Rating scale: 1- Very Poor, 2- Poor, 3- Normal, 4- Good, 5- Very Good, N.A.- Not Applicable)
Vendor Product Brand Image
Kingdee 5 / 4 / 3 / 2 / 1 /N.A 5 / 4 / 3 / 2 / 1 /N.A
Microsoft CRM 5 / 4 / 3 / 2 / 1 /N.A 5 / 4 / 3 / 2 / 1 /N.A
Oracle 5 / 4 / 3 / 2 / 1 /N.A 5 / 4 / 3 / 2 / 1 /N.A
PowerCRM 5 / 4 / 3 / 2 / 1 /N.A 5 / 4 / 3 / 2 / 1 /N.A
Salesforce.com 5 / 4 / 3 / 2 / 1 /N.A 5 / 4 / 3 / 2 / 1 /N.A
SalesLogix 5 / 4 / 3 / 2 / 1 /N.A 5 / 4 / 3 / 2 / 1 /N.A
SAP 5 / 4 / 3 / 2 / 1 /N.A 5 / 4 / 3 / 2 / 1 /N.A
Siebel 5 / 4 / 3 / 2 / 1 /N.A 5 / 4 / 3 / 2 / 1 /N.A
TurboCRM 5 / 4 / 3 / 2 / 1 /N.A 5 / 4 / 3 / 2 / 1 /N.A
Ufida 5 / 4 / 3 / 2 / 1 /N.A 5 / 4 / 3 / 2 / 1 /N.A
2. Please answer the following questions:
□Which CRM software vendor is your first choice? Why? □Which CRM software vendor is your Least Preferable Choice? Why? □Any suggestions to CRM software vendors?