critical stresses for slip, twinning, and …shipstructure.org/pdf/66.pdf · lattice twinning...
TRANSCRIPT
.-.-.. -
1:
S’ERIAL NO. SSC-66
,,‘,
-.. ,-L,.,. ..
/,.....
,,
CRITICAL STRESSES
;“
,“
,,
FINAL REPdRT
(Proiect SR-1 08)
on
FOR SLIP, TWINNING, AND CLEAVAGE
IN SINGLE CRYSTALS OF IRON
,, ,,
by
J. J. COX, JR.
Carnegie Institute of Technology .,
I Transmitted through\
‘,’, NATIONAL RESEARCH COUNCIL’S
COMMITTEE ON SHIP STEEL
I Advisory to
SHIP STRUCTURECOMMITTEE,,, ,,.’
‘) I
,.,
Divisi~n of Engineering and Irtdu$trid I&earch
National Academy of, Sciences L National Research Council
1’ Washington, D. C.
February 1, 1954 “
..— .-”,., .—-—.-—. ..—--- -----
—
SHIF’ STRUCTURE COMMITTEE
.,MEMBER AGENCIES:
ADDRESS COF?RE5PONDEiVCE TO:
SECRCTA?WBURI!AUOF SHlp9 DEPT.“ ‘Avy SHIPSTRUCTURECO14tibTTEE~lLlrARySEA TRANSPORTATIONSERVICE.DEPT.OF NAvr
UNITEDSTATESCOASTGuARD,‘ntAsuRy ‘CPT”U. S. COAST GUARD HEADCIW.RTER~WASHINGTON2$.~. c.
MARITIMEADMINlSTRATION.“PT” ‘F cO”M=RcKAMfiRlcAt4 BuREAUOP sHlpFINQ
February 1, 1%3
AS part of its research .Pro~r~ re~~t~d ~<~“k~~~+improvement of hull structures of snips9 the b~.~pLY:mC~LrGCommittee is sponsori% an invest:,qat~onon
critical s?~’esses
for slip, twinni%y and cleavage m s~ngle Crystalsmof irma.tthe Carnegie Institute of Technol:W.
Herewith 1s 2 sOpY
of the Final .Report,SSC-66, of the mvestigation9 e::i’~led‘lCriticalStress~:sfor Slip? Twinning, ~nd CleaT~a&emSin~le Crystals of Iron’iby J. J. Cox, Jr.
T:he project has been conducted with the advisory
assistance or the Committee on Ship Steel of the Natimal
Academy of Sciences-National Research Council~
Any questions, comments, criticism or othermatters pertaining to the Report should be ~ddressed tothe Secretary, Ship Structure Committee.
This Report is beinfldistributed to thoseindividuals and agencies associated with and interestedin the work of the Ship Structure Committee.
Yours sincerely$
Km K. CONARTRear Admiral, U. S. Coast GuardChairman, Ship Structure
Committee
. . -
FINAL REPORT
(Project SR-108)
an
CRZTICAL ST13ESSESF(I?3SLIP9 TWINN1NG9 Am
IN SINGLE CRYSTALS OF IRON
by
J. J. COX9 Jro
CLEAVAGE
CARNEGIE INSTITUTE OF TECHNOLOGYMETALS RESEARCH LABORATORY
Department af the NavyBureau of ShipS Contract NObs-50230
BuEIIipsProject No. NS-011-W8
far
SHIP STRUC~M COMMITTEE
i
SYNOPSIS
An X-Ray, optical and metallographic study of the stresses
for--and mechanisms of--SMP5 twinning and fracture in single
crystals of iron prepared from decarburized mild steel has
been made.
The selection of the glide ellipse has “beenfound to be
a function of the relative difficulty of atom motions at
various positions along a <111) ; this function being affected
by temperature and distribution of stresso A critical shear
stress criterion applies.
Twinning has been found to occur on {112] type planes
and in <111) directions below -170- ~. as predicted by a
critical shear stress law, mutatis mutandis. The twinning
stress is greatly affectiedby slip.
BMttle fracture could be accounted for by a critical
nomal stress theory within wide limits of error. Ductile
fractures predominated for specimens where a cleavags
[1001$ was more than 65 degress axiso Various effects
prestraining were observed.
plane~
of
ii
OF CONTENTS
LIST OF
LIST OF
Geoooo 000000 .40
004090 Ooooom 00
LITHWTT,JRESLa
the process. o 0 0 0 0& EUmUa banal theory.mathematical analysis.
Falmmlmrst & Schmid”s indirectDeformation of silicon ferrite.Eli-planarCooperative sljp. . .
00
Ou
00
00
00
o
0
00
0
observations.000000 e
0’5 ’3000 0
0
0
a
00
0
0
0
0
0
0
0
0
0
0
0
0
0
0
B
0
0
0
0
~.
0
0
0
0
0
0
0
0
0
0
a
o
0
0
0
a
0
0
0
0
0
0
0
0
0
0
0
0
0
0
0
0
0
0
0
0
0
0
0
0
0
0
9
0
0
‘a
o
0
0
0
0
0
0
0
4
56
252626
323334
556268
n7878$’985
EXPERIMENTAL RESULTS AND DISCUSSION o . 0 . 0 . . . . 0 .
Introduction,. . . . . . . . . . . . . . . . . . . .u“”””””””””””~ “0”0”””0””0
Behavior of the glide ellipse at varioustemperatures. . . . . . . . . . . . . . . .Change in the glide elli~se with temperature
with temp~rature . . . . . . . .Surface manifestations of slip .Asterism and lattice distortion,
TWinnig. o .3 . 0 0 . (1 00 a . .
Fracture. . . . . . . . . . . . .Introduction . . . . . . .Large specimens. . . . . .Small specimens. . . . . .Brittle fractures. . . . .Ductile fractures. . . . .The nature
(3C)NCLUSIONS. . . . . .
ACJTJTWLEDGMZ:T . . . .
KD3L1OGRAPHY. . . . . .
of the fracture
000000 0.3
Ooeooo 00
ooooee tiu
000
.30.5
00,0
O*U
000
eoo
● OO
e
.3
0
e
o
0
0
0
e
a
surface
● oc.a
Ooeo
900G
shear0
0
0
0
0
a
*
0
0
0
9
m
u
o
0
0
0
0
0
*
a
o
0
&
0
●
o
0
0
0
0
0
0
0
0
0
0
a
0
0
0
0
0
0
0
0
0
e
o
e
e
D
Q
*
o
0
e
o
.7
0
.3
●
Q
0
0
Q
I
,.
iv
LIST OF FIGURES
!u.u2 PaEe
Relative values of critical resolved normal andshear stresses for slip twinning and cleavage insing~e crystals Qf low silicon ferrite. . . . . .
Critical resolved shear stress of the (130) planefor ingot iron single crystals. . . . . . . . . .
Plan view of atoms cm a (113] plane . . , . . . .
Side view ~f’(~~~) Slip o 0 0 . 0 0 0 Q o 0 Q o 0
side V~~W d [223) dip . . . . . . . . . . . . .
SMR view of’(112] slip to the left . . . . . . .
Side V~12W d (112] Slip to the right. o 0 0 0 0 0
Hypothetical S+\S110 versus~ curve . . . . . . ~
Qualitative S+jS110 versus +’curve for variousalloys and test ~onditi~nsO . . . . . . . . . . .
Lattice slip (classical). . . . . . . . . . . . .
Lattice twinning (classical). . . . . 0 e o 0 0 0
Body centered cubic unit cell . . . . . . . . b G
(110) projection or bee. lattice. . . . . . . ~ .
(110) projection of’bee. lattice with twinningshear applied to the first atom layer . . . . . .
Bee. tiwintwo atom layers thick . . . . . . . . .
Plan view of (112) plane. . . . . . . . . . . . .
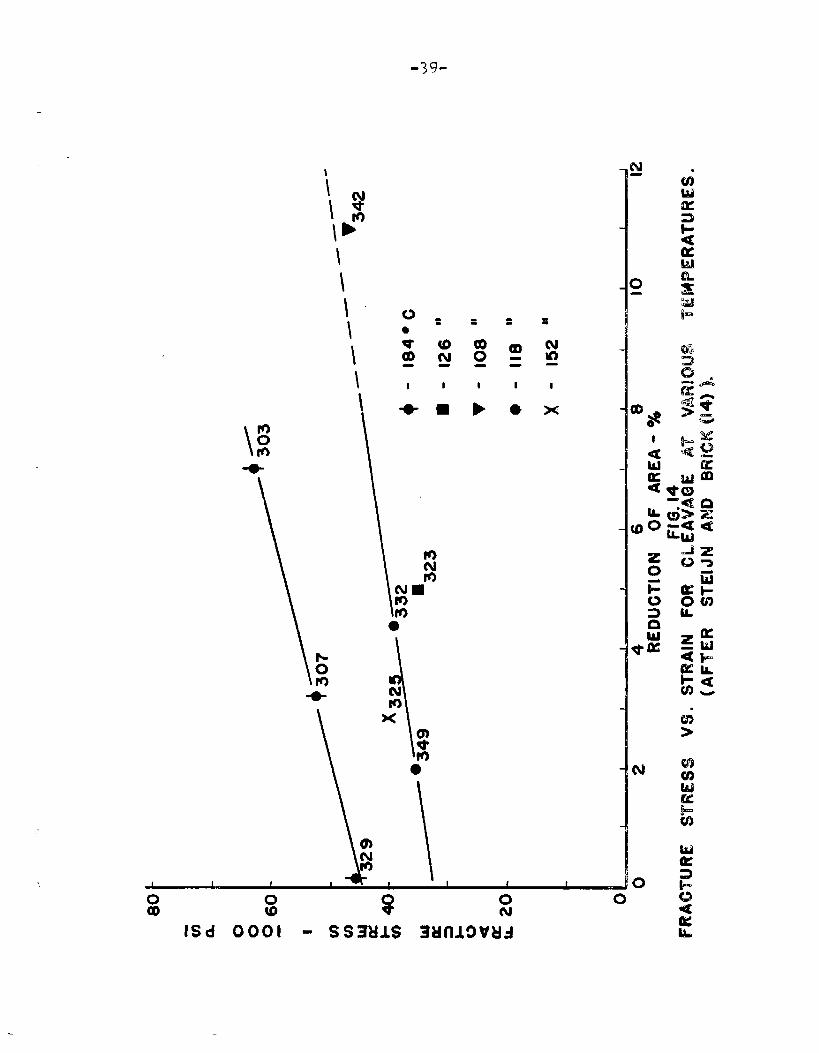
Fracture str~ss for cleavage as affected by reduc-tion in area at the fracture. . . . . . . . . . .
S.A.E. 1008 stock ~iasreceived” . . . . . . . . .
Dimensions of singl~ crystal test bars. . . . . .
8
3.2
3.5
15
15
37
17
22
23
27
27
29
29
29
30
so
39
w+
%5
.—
v
I&h_
T7.
180
190
.200
21.
.220
23‘3
24-0
250
260
270
28‘3
290
300
310
32.
330
340
35.
36.
37.
w
Layout of furnace windings. . . . . . . . . . .
Cross section of furnace. . . . . . . . . . . .
Flow sheet of gas system. . . . . . . . . . . .
Water vapor-hydrogen-iron equilibrium diagram .
Gas system. . . . . . . . . . . . . . D . . . .
Vapor pressure d water versus temperature. . .
Specimens in racks... . . . . . . . . . . . .
S.A.E. 1008 %s decarburizedtl. . . . . . . . .
Tool for making gauge marks . . . . . . . . . .
Grain si~e of strain anneal specimens as afnnction of strain. e o 0 0 . 0 . 0 * o 0 0 0 0
Photograph of ~lectropolisher . . . . . . . . .
Wiring diagram of eleetropolisher . . . . . . .
Specimens el=ctropolished--and etched . . . . .
GDniometsT and camera on X-Ray machine. . . . .
Gonicmeter and long specimen. . . . . . . . . .
Standard (001) pro~ection with tensile axis . .
Coordinates for calculation of resolved shearstress. . . . . . . . . . . . . . . . . . . . .
Coordinates for calculation of resolved normalstress. 0 0 0 0 0 00 0 0 . 0 0 m Q 0 0 0 Q 0 0
Hypothetical specimen with slip traces. . . . .
!hniometer and specimen on metallogra~h . . . .
Standard (001] projection showing specimen axisi3slip data and axis migration. . . . . . . . . . 77
vi
380 Tensile machine$ accessories and recordingequipment. .0 . .0 . . . e o 0 0 0 0 0 0 0 0 OQ 80
koa o Orientation of slip Specimens. . . . . . . . . . . 88
Wb o Slip orientations with respect to regions ofhighest resolved shear stress. . . . . . . . . . . 88
kl e Summary of slip planes? maxhmun shear plan@s5 andvarious crystallographic planes for all specimenstestedinsMp.000eOuO ~0~000000090
k3--46.Stereographic projections of specimens tested forslip behavior showing slip plane data$ axis migra-tions~ and maximum shear stress poles:Specimens A-77 BR-3Y A-1 and A-3 . . . . . . . . . 95 .
47--50 ~Stereographic projections of specimens tested forslip behavior showing slip plane data, axis migra-tions, and maximum shear stress poles%~pecimen~ A-53 A-49 A-22 and A-6 . . . . . . . . . 96
51--fi.Stereographicprojections of specimens tested forslip behavior showing slip plane data, axis migra-tions and maximum shear stress poles:Specimens A-99 A-11$:-D-3and BR-20 ~ . . 0 0 . 0 0 %’
55. Variation of resolved shear stress with temperaturefor slip and twinning~ o 0 . . 0 0 Q o 0 0 0 0 Q o ‘%3
600 Slip lines in scratch (dark field) o 0 0 0 0 0 Q 0~~~
610 Clustering of slip lines . . . . 0 0 0 0 0 0 0 0 01~5
N&l& WL!2
Laue photogram of undistorted specimen. . . . . . 106
Laws photogram of strained specinen . . . . . . 0 106
orientation of twinning specimens 0 . . . . . 0 n 108
Twinning near a fracture surfaceO . e 3 . . . . 0 114
Load--time curve for twinning . . . . . . . . e Q Ilk
Cross-hatched
Notched twins
Fracture orientations
Fracture orientations
Fracture orientations
Resolved no~mallarge specimens
Resolved normalsmall specimens
Fracture stress
*08QOG’ e*O**O 00 116
Oooam oeoo~ Oooo 116
00000 000000 00 0 LL/
(restrained) . . . . . . . 137
(large specimens) . . . . . 117’
stress versus orientation for—Oaooo 0*000 OCIOO* 00 120
stress versus orientation forOaO*OO novooo ● oiao o 123
of ductile specimens v~rsusreduction in area at the fracture . . . . . . . ~ 227
Fracture specimens (side view). . . . . . . . . . 129
Fracture specimens (side view). . . . . . . . . 0 129
Fracture specimens (side view). . . 0 a e . 0 0 0 130
Fracture specimens$ prestrained (side view) . . . 13tl
Fracture sp~cirnens~prestrained (side view] . . . 130
I?ractograph
Fmctograph
Fractograph
Fractograph
,.‘viii
LIST OF TABLES
I
11
11I
IV
v
~.l.
VII
VIII
IX
x
Ratios of critical shearing strengths of (110)~ (112),and (123] planes of silicon ferrite at varioustemperatures. . . . . . . . . . .0 . . . . . . . .0
Atom movements for slip cm various planes of the~~117 zone. . ..,.. 00000 00000 00000 ~oao
Shearing strength of various planes in the [~11] zone~.nrelation to the strength of the (110) pla,ne.
Cooling media for the tensile tests at varioustemperatur~s. . . . . . . . ~. .0 . . . . . .
Stress at yielding resolved onto various planesthe ~11” zone. . . . .0 . . . . . . .0 .0 .
Resolved shear stress for twinning in the experimen.tally observed twins. . . . . . . . . . . . . . . . .
Resolved shear and normal stresses for various twinsystem300.000000.OOOafterpag~o ~ ~ ,.. . . ~ ~ ~ ~ ~
Fracture data for large specimens . . . . . . . . . .
10
M
20
20
85
98
109
112
118
Fracture data for small specimens . . . . . . . . . . 124
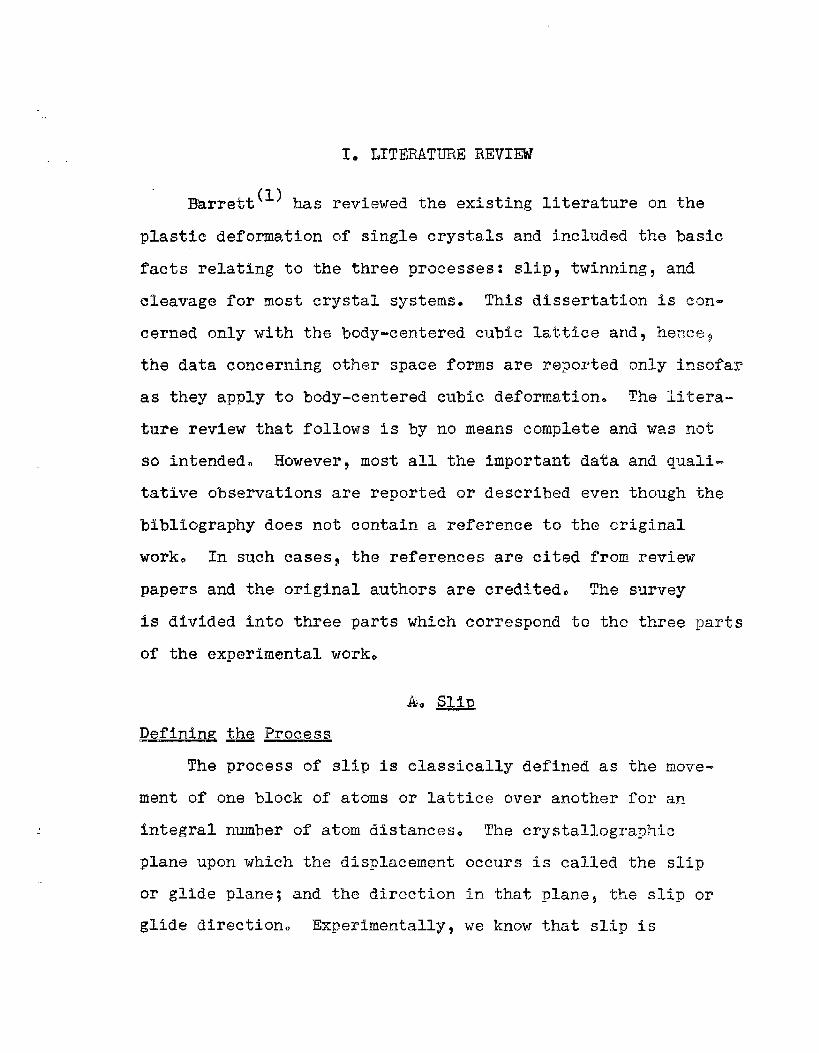
1. LITEMTURE REVIEW
Barrett(~) has reviewed the existing literature on the
plastic deformation of single crystals and included the basic
facts relating to the three processes: slip, twinning, and
cleavage for most crystal systems. This dissertation is con-
cerned only with the body-centered cubic lattice anda henceg
the data concerning other space forms are reported only insofar
as they apply to body-centered cubic deformation. The Mtera-
ture review that follows is by no means complete and was no%
so intended. However, most all the important data and quali-
tative observations are reported or described even though the
bibliography does not contain a reference to the original
work. In such casesa the references are cited from review
papers and the original authors are credited. The survey
is divided into three parts which correspond to the three
of the ~xperimental work.
& slip
DefininR the Process
parts
The process of slip is classically defined as the move-
ment of one block of atoms or lattice over another for an
integral number of atom distances. The crystallographic
plane upon which the displacement occurs is called the slip
or glide plane; and the direction in that plane5 the slip or
glide direction. Experimentally, we know that slip is
-.2-
accompanied by work hardening~ bending of th~ glide plane
(flexUral glide}3 cross slip and many other related processes.
This textbook picturey howevery can still be used when com-
paring slip with twinning or with cleavage although it is
much too simPle to be COJV@C~e
IrI ~ae~-cmt~~d CU~fLC and hexagonal metals$ the slip
plane is normally “theplane of highest atom density while the
direction is the di~ection of’closest atom spacing in that
plane. MetallograpMc c9bservationof the traces of the slip
planes on polished surfaces of these metals have shown more
cw less straight Mnes which have been geometrically analyzed
to confirm these results. The ‘~~dy-centered.cubic metals have
also been shown to exhibit slip on the close-packed direction$
but the straight-line traces indicative of Uni-planar slip$
have not been found. Instead9 the sliR lines were always
wavy and in many instanc~s widely branched,and forked. It
is for this reason that much contention is found in the
literature concerning the nature of body-centered cubic slip
and its origin.
..
-3-
from distortions of a gridwork engraved on the polished surfaces
of the specimens. Data obtained in this work indicated that
slip took place along the close-packed [111] directions and on
a plane which lay adjacent to or coincided with the plane of
maximum shear stress containing the slip direction. In the
tension tests, when the slip plane did not coincide with the
maximum shear stress plane, it was always inclined toward the
nearest (112) plane. On this basis, they concluded that slip
was non-crystallographic or ‘Ibanal.ftThe physical picture of
the ~’banalltmechanism was one of a bundle of hexagonal rods
where the rod axis represented the slip direction. This ac-
counted for the forkedness of the slip lines when viewed in
a plane perpendicular to the slip direction and their more or
less straight character when viewed in a plane parallel to the
slip direction. An alternate mechanism where slip could occur
on two (112) or (110) planes containing the same slip direction
was advanced but rejected in favor of the banal mechanism be-
cause it was contrary to what had been found for other metals.
The authors felt that only in certain accidental cases would
specimens be oriented in such a manner that the shearing stress
on two planes would be close enough to cause di-planar or
cooperative slip.
Taylor~s Mathematical
In a later work,
fi-brasscrystals5 also
Analysis
Taylor(3] studied the deformation
a body-centered cubic structure.
of
Taylor
-h-
found that$ when the slip plane did not coincide with the
maximum shear stress plane containing the slip direction$
was always inclined toward the nearest (110) plane. This
enabled.him to construct a mechanism where the resistance
shear of any plane in the zone of the slip direction could
be found as a function OY the
and the nearest (110) plane.
could then be calculated from
where 1? = force
P = yield
A= cross
e5 = angle
x= angle
it
to
angle~ between the slip plane
The stress on t“hisslip plane
the following equation:
eosg Cos (x+)
plane
load in axial tension or compression
sectional area of the specim:n
“betweenthe slip direction and tensile axis
between the plane of maximum shear stress
Containing the slip direction and -Eheclosest (110)
datum plane
$= angle between the glide plane and the closest (110]
datum planeO
Differentiating and dividing through by ??awe arrive at
“5-
Here the symbol F. is the resistance to shear of the (llG)
datum plane where ~is equal to zero. If the relationship
between x and~ is known, then the variation in shear re-
sistance along the slip zone can be calculated as a function
Ofpo The author believes that this is a confirmation of
the hexagonal rod movement of the banal theory since the
experimental curve of ‘#vs x is of the same slope as the one
predicted by the banal mechanism. For #-brass, the slip lines
were wavy but not as pronounced as in d-iron. No explanation
for this difference was proposed.
Fahrenhorstns and Schmidls Indirect Observations
The investigation of Fahrenhorst and Schrnid(4)gave refe-
rence to several indirect methods of determining the slip
mechanism of %-iron. From measurements of the yield stress
of various crystals of known orientation, it was possible to
calculate the critical resolved shear stress on various
assumed glide planes. The four planes for which calculations
were made were: (1) (11O) planes; (2) .(112)planes; (3) (123)
planes; and (~) the plane of maximum shear containing the slip
direction. This yielded four curves of a slope similar to
the yield point versus orientation curve. Since the curve for
assumed
authors
correct
It
(123) slip best fitted the experimental eurve~ the
concluded that the slip system (123): ~111-’ was the
one.
becomes immediately evident, when some simple calculations
-6-
am made, that values of stress obtained from any one of the
four assumptions do not differ significantly, and the scatter
among these values is less than the experimental error involved
in the measurements. Hem e~ such a method of analysis does
not only not prove any of the assumptions to “becorrects but
it eliminates the possibility that some other correlation
might exist.
The second indirect method used by Fahrenhorst and
Sehmid was to plot the course of the specimen axis during
its migration on straining. Using the same four assumptions
Fahrenhorst and Smhmid found that the migration predicted by
(~~3) slip gave the best correlation with experimental,~b~er-
vations. However$ many specimens did not conform to this
predicted behavior.
The third method employed by these Investigators was to
plot curves of shear stress versus shear strain for the same
four assumed sllp systems. Again the curve fer the system
(123): [111~ gave the least variation from experiment; buts as
In the first part of the study~ significant differences do not
exist and lie well within the experimental error.
Deformation Q Silipon Ferrite
Bkrretty Anse12 and Mehl(5) studied the behavior of single
crystals of ingot iron and silicon.ferrites of various composi-
tions. The stresses for slip were only studied qualitatively
and hence only broad generalizations could be made on this
-7-
subject. Tension, compression, torsion and bending were the
methods used to deform the specimens. The use of thin sheet
specimens necessitated the trace normal method to be used for
determination of the indices of the glide plane. All 194 sets
of glide traces investigated were said to be explained by slip
on planes of the type (110), (112) or (123) and in the Clll]
direction. When the measured glide trace was found to diffe~
from one of the three planes by more than 7?, the specimen
was regarded as ‘[nogood“ and the data were not recorded. When
individual sets of measurements had a range of more than 10°5
they again were considered to represmt bad data and were not
tabulated.
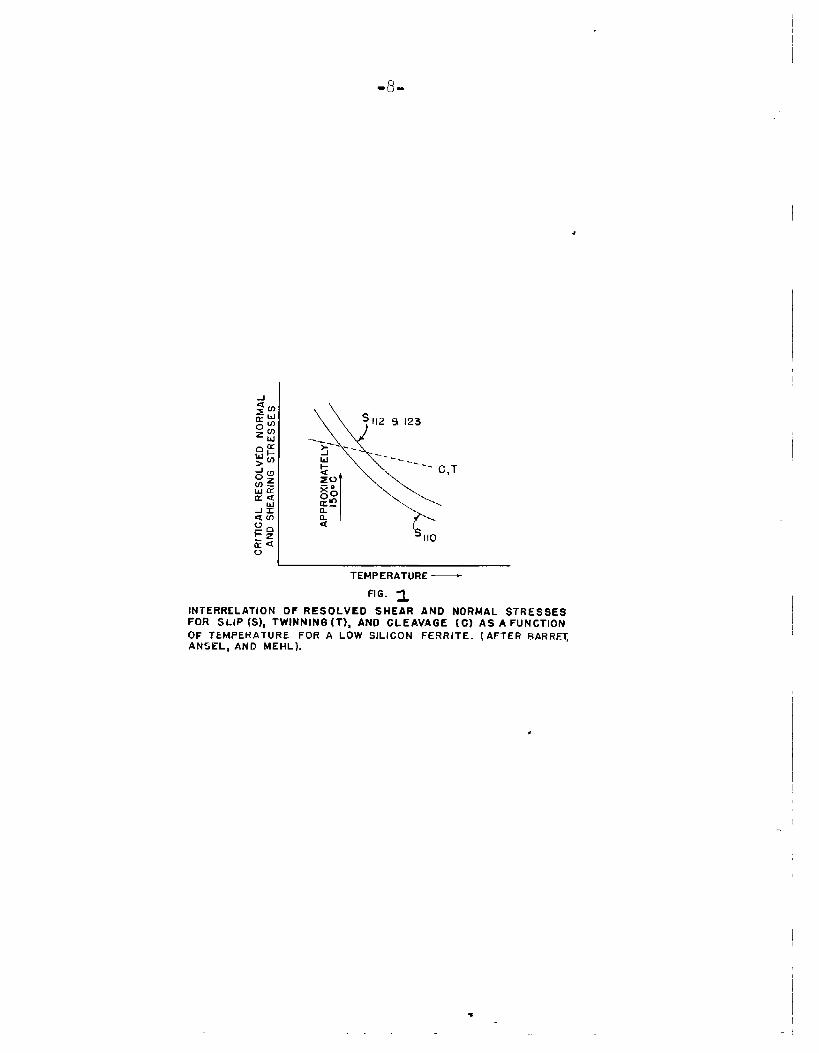
Silicon contents in excess of 4% were found to limit slip
to (110) planes regardless of the test temperature. For
f’initescontaining less than %% silicon, lowering the test
temperature below Tom temperature favored (110) slip. The
temperature at which (110) uni-planar slip occurred increased
from -19CPC at l? Si to -70QC at ~z silicon. The waviness of
the slip lines wqs found to decrease as the tendency for uni-
planar (110) slip increased--with lower temperatures and in-
creased silicon contents. The variation of critical resolved
shearing stress with temperature is shown qualitatively in Fig. 1.
Di~lanar Cooperative Slip
Chen and Maddin(6) studied deformation in single crystals
of body-centered.cubic molybdenum produced from exaggerated
-8-
TEMPERATURE—
FIG. ~
INTERRELATION OF RESOLVED SHEAR AND NORMAL STRESSESFOR SLIP(S), TWINNING(T), AND CLEAVAGE (C) AS A FUNCTIONOF TEMPERATURE FOR A LOW SILICON FERRITE. (AFTER BARRE~ANSEL, AND MEHL).
-9-
grain growth of sintered rods. Orientations of the five
crystals studied were determined by back reflection tech-
niques while the t~aces of the glide planes
microscopically. These data indicated that
could occupy any position in the [111~ zone
Taylor(3) (2)and Taylor and Elam . However,
were determined
the glide ellipse
in agreement with
Chen and Maddin
chose to use the X-Ray asterism of the deformed crystals to
determine the operative glide planes and chose the alternate
conclusion, discarded by Taylor and Elamj that slip on two sets
of (110) planes could always account for the observed position
of the glide plane. For example, when the glide ellipse coin-
cided with a (112) plane, it would actually consist of slip
on equal segments of two adjacent (110) planes containing the
same direction. Such a mechanism can explain the observation
that the glide ellipse can occupy any position in the ~111]
gone and that the glide traces should be very wavy when viewed
perpendicular to the glide direction and straight when viewed
parallel. It is also consistent with the early proposals since
the (110) plane is the most densely packed.
ODinskyis and Smoluchowskils Theoretical T~eatment
Opfnsky and Smoluchowski(7)in their theoretical treatment
of slip in the body-centered cubic lattice divided the stereo-
graphic unit triangle into several regions which indicated the
favored slip system if the axis of the specimen fell in that
region.
-1o-
The calculations were made on the basis that each of the
ylanes has the same critical shearing strength which is highly
improbable as the authors point out although it is as good an
assumption as can be made in this case. By workhg backwards
from the known boundaries in the basic unit triangle where
slip occurs on the (110)~ (123) or (112) planes the resis-tance
to shear of these planes were calculated. This is in.many ~e-
spects similar to the Taylor analysis, for it predicts the
position of the glide plane with r~spect to the relative re-
sistances to shear of the various planes i.nthe slip zone.
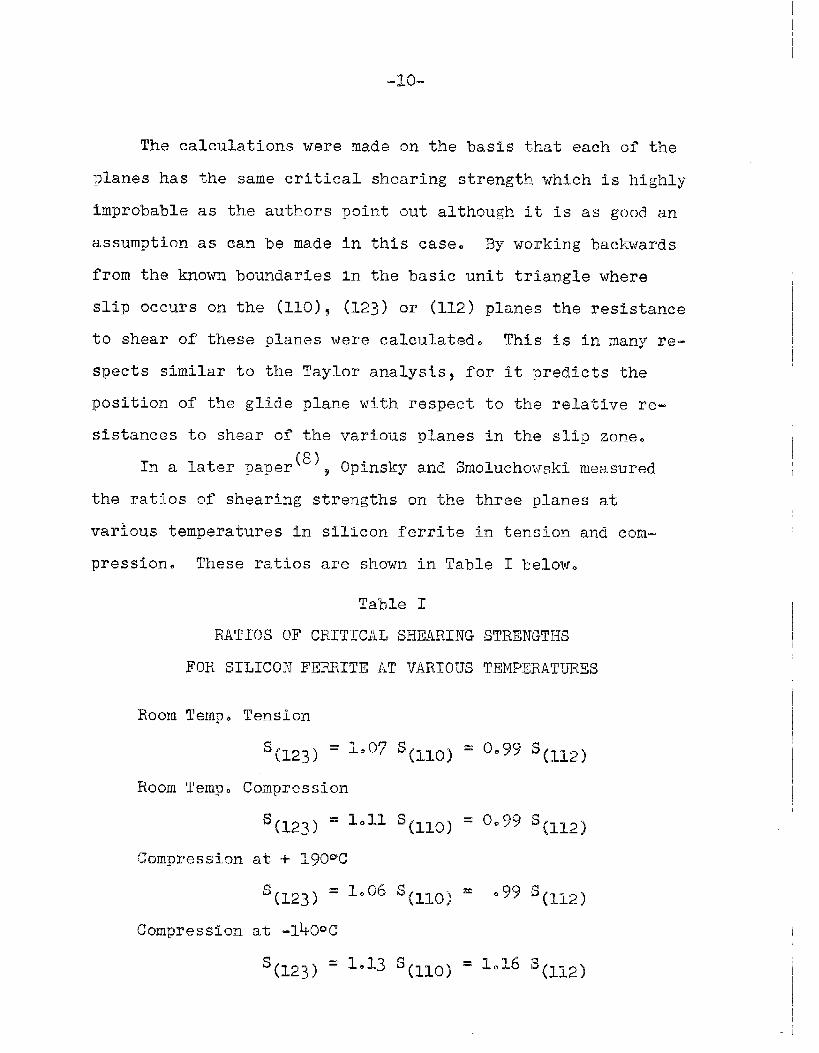
In a later paper(8)~ Opinsky and Smoluchowski measured
the ratios of shearing strengths on the three planes at
various temperatures in silicon ferrite in tension and com-
pression. These ratios are shown in Table I below.
Table T
RATTOS OF CRITICAL SHEARING
FOR SILICON FERRITE AT VARIOUS
STRENGT1lS
TEMPERATURES
Room Temp. Tension
Room Temp. Compression
“n-
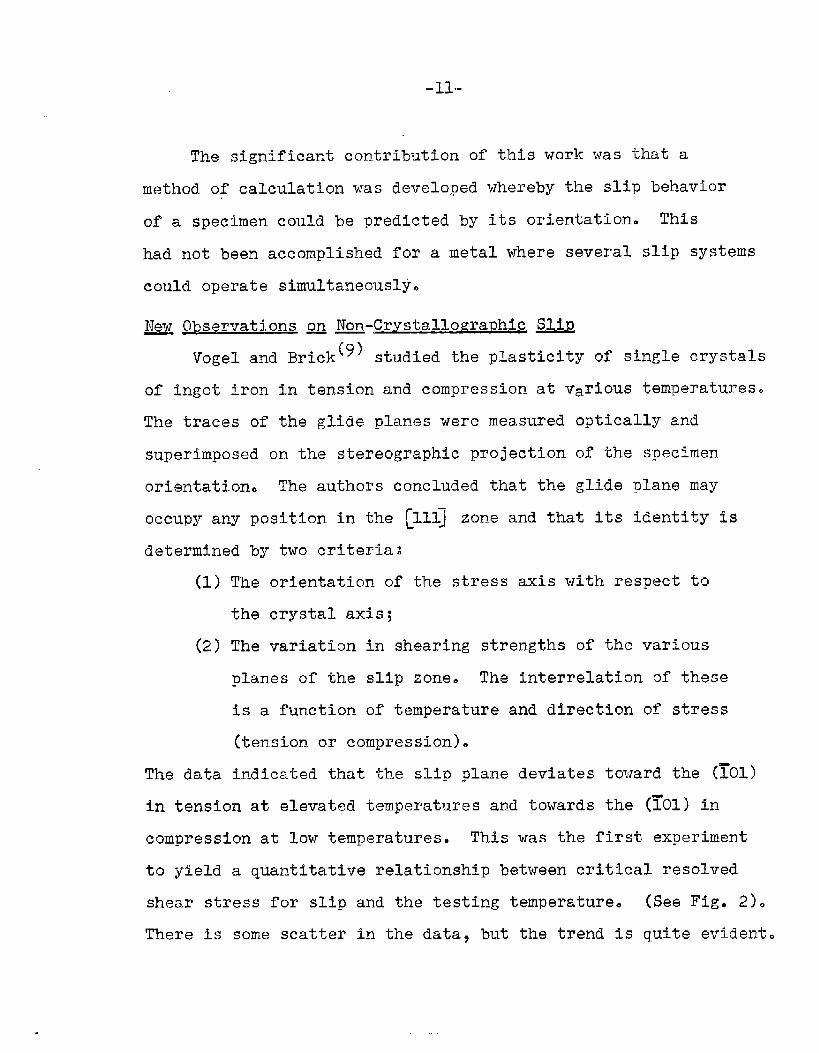
The significant contribution of this work was that a
method of calculation was developed whereby the slip behavior
of a specimen could be predicted by its orientation. This
had not been accomplished for a metal where several slip systems
could operate simultaneously.
New Observations on Non-Crystallo~raphicSlip——
Vogel and Brick(9) studied the plasticity of single crystals
of ingot iron in tension and compression at various temperatures.
The traces of the glide planes were measured optically and
superimposed on the stereographic projection of the specimen
orientation. The authors concluded that the glide plane may
occupy any position in the [111] zone and that its identity is
determined by two criteria:
(11
(2)
The data
The orientation of the stress axis with respect to
the crystal axis;
The variation in shearing strengths of the various
planes of the slip zone. The interrelation of these
is a function of temperature and direction of stress
(tension or compression).
indicated that the slip plane deviates toward the (~01)
in tension at elevated temperatures and towards the (701) in
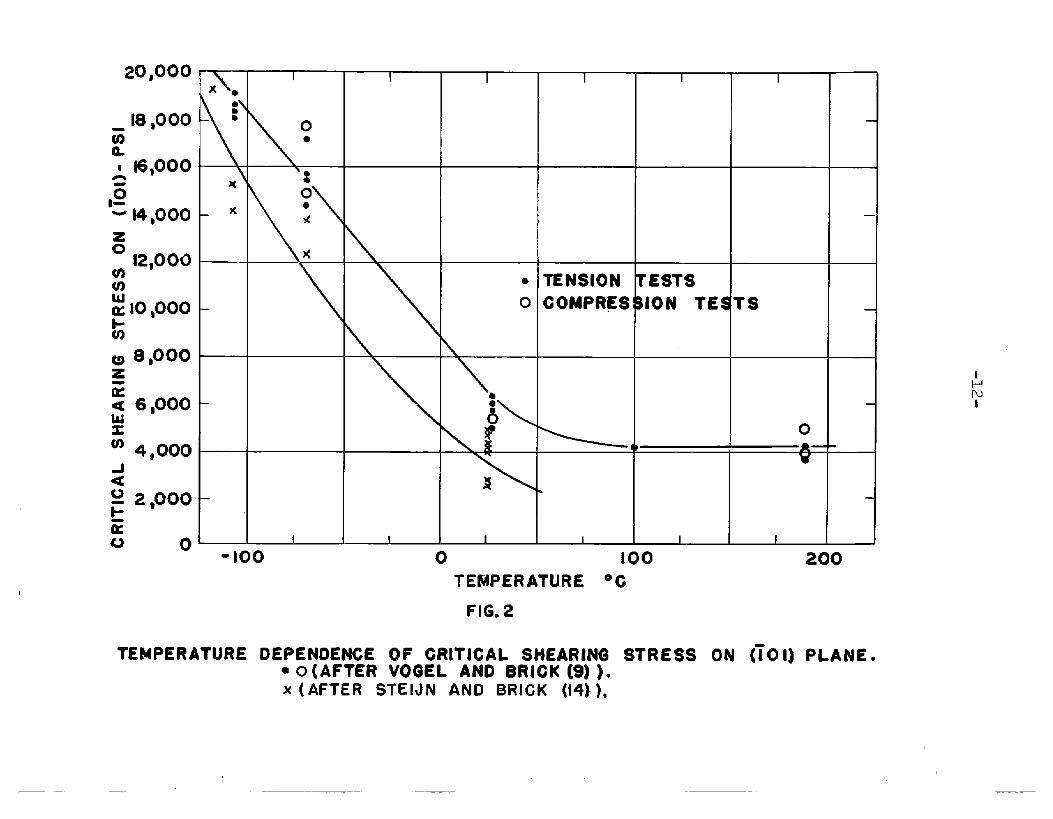
compression at low temperatures. This was the first experiment
to yield a quantitative relationship between critical resolved
shear stress for slip and the testing temperature. (See Fig. 2).
There is some scatter in the data, but the trend is quite evident.
20,000
_ t8 ,000
z
aa 6,000u
-100
I I I I I
TENSION
IVESTS
COMPRES 10N TE TS
100 200
—
TEMPERATURE ‘G
FIG. 2
TEMPERATURE DEPENDENCE OF CRITICAL SHEARING STRESS ON (hi] PLANE.•O(AF~E~ vo~EL A~~ BRICK(9)).x(AFTER STEIJN AND BRICK (i4j),
— .—
Dislocations and @iD——
The literature contains voluminous references to the
slip behavior of’metals as reconciled by dislocation theory$
but none of these works has revealed a mechanism which could
clearly account for body-centered cubic slip behavior. Chalmers
of most dislocation theory) determined a parameter
predict the slip systems in various metals. The
and Martins have simply (simple in contrast ‘bothe complex
mathematics
‘whichcould
pararneter$designated as #’yis defined as the ratio of the
$urge~s vector to the in’berplanardistance. According to this
theorya slip should occur on the planes and in the direction
for which @ is a minimum. For body-centered cubic metals
slipping in the [111] direction~ the first choice of slip
would be (110]5 the second (112) and the third (123)0 If the N
parameters are listed for various directions however? it is
seen that body-centered cubic metals should slip on (110) and
(1OO) planes in [100] directions rathe~ than on (112’)planes
in ~.11] directions. Although this has never been recorded?
it does not give dislocation theory a ~~’blackeye~Ssince the
approach is quite empirical as was pointed out by the authorq
T’JhLModified Taylor i?malysi~
The most compl~te investigation of slip in.body-centered
cubic iron is the recer,twork of Steijn and Blick(14)0 This
investigation has brought forth an analysis which will be dee
scribed in detail since it pertains quite pertinently to this
-14-
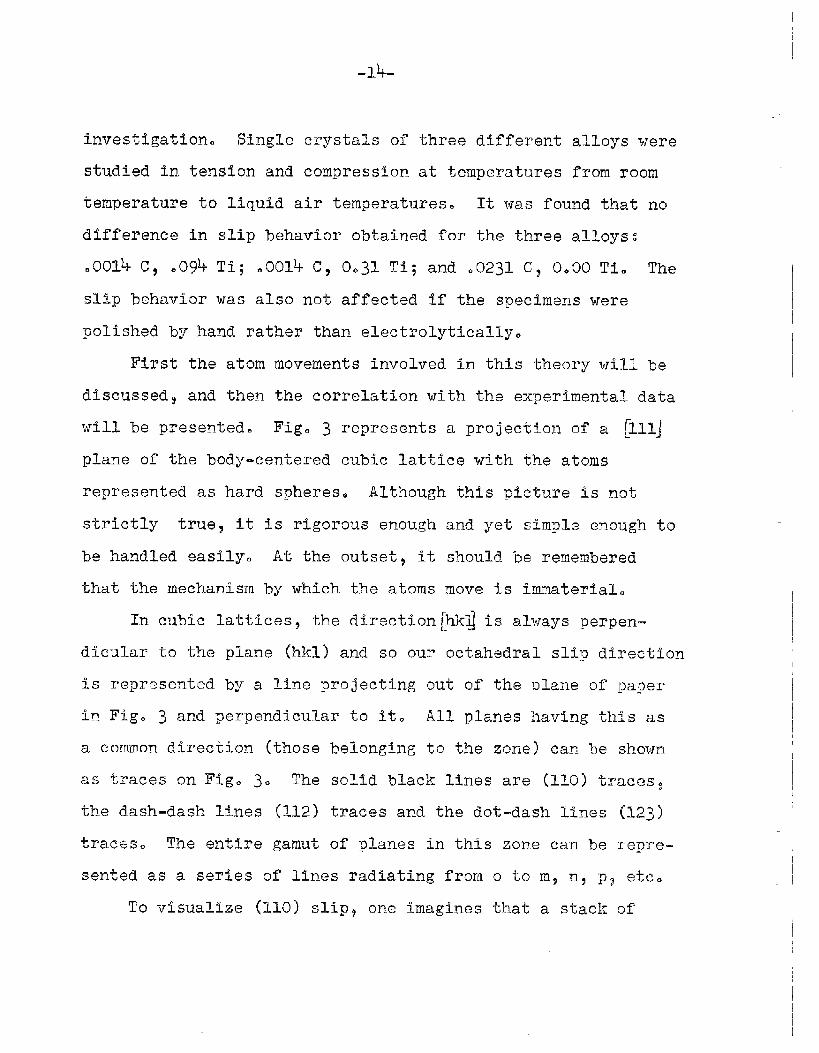
Investigatione Single crystals of three different alloys were
studied in tension and compression at temperatures from room
temperature to liquid air temperatures. It was found that no
difference in slip behavior obtained for the three alloys:
.0014 c, .09k Ti; .0014 C9 0031 Ti; and 00231 C5 0.00 Ti. The
slip behavior was also not affected if the specimens were
polished by hand rather than electrolytically.
First the atom movements involved in this theory will be
discussed$ and then the correlation with the experimental data
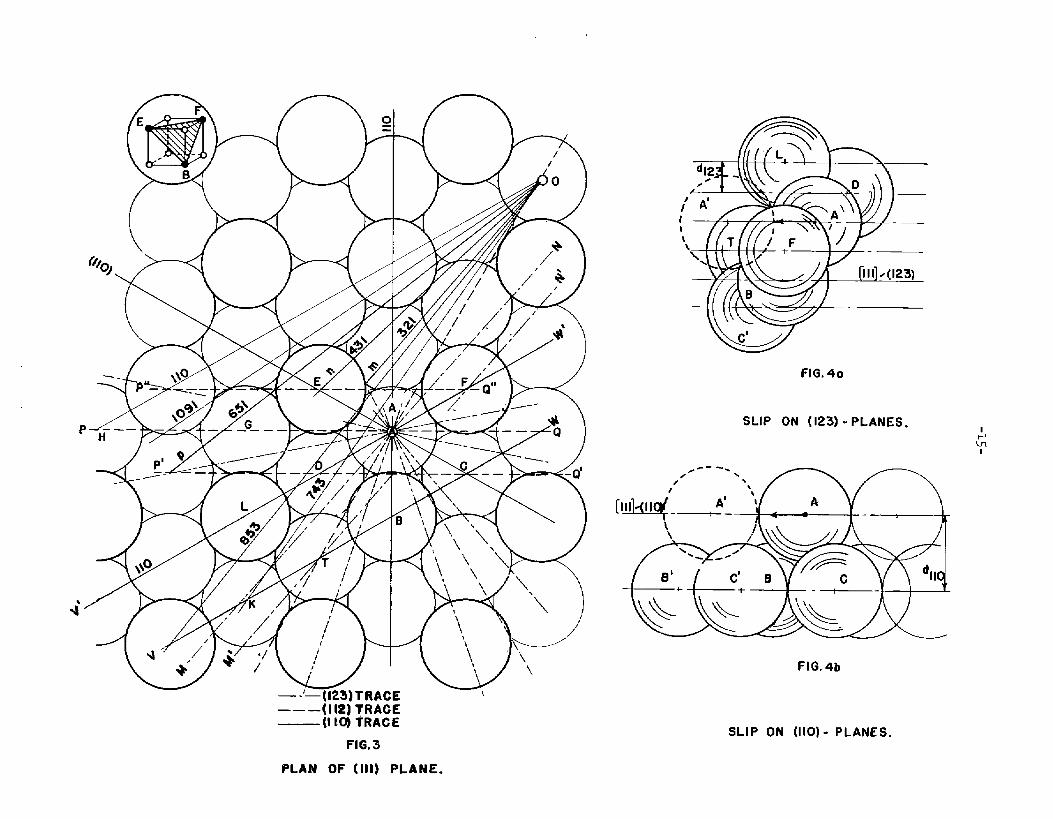
will be presented. Fig. ~ represents a projection of a [!11]
plane of the body-centered cubic lattice with the atoms
represented as hard spheres. Although this picture is not
strictly true? it is rigorous enough and yet sim~le enough to
be handled easily. At the outset, it should be remembered
that the mechanism by which the atoms move is immaterial.
In cubic lattices$ the direction[hkj is always perpen-
dicular to the plane (hkl) and,so oluroctahedml slip direction
is represented by a line projecting out of the plane of paper
in Fig. ~ and perpendicular to it. All planes having this as
a common direction (those belonging to the zone) can be shown
as traces on Fig. 3. The solid black lines are (110) traces5
the dash-dash lines (112) traces and the dot-dash lines (123)
traces. The entire gamut of planes in this zone can be repre-
sented as a series of lines radiating from o to m? na p? etc.
To visualize (110) slip~ one imagines that a stack or
P
FIG. 40
SLIP ON (123) - PLANES.
FIG. 4b
I
GI
SLIP ON (110)- PLANES.FIG.3
PLAN OF (Ill} PLANE.

-16-
(l~o) planes slldes as a block over the atoms On and ~elow ~~e
trace v-w. The movement of’atom A to its next position along
~1111 is exactly the same as the movement of atoms D? L~ F$
etc.5 ~ince these atoms are Indistinguishable. This movement
is designated as an A-type movements a side view of which is
shown in Fig. ~-.
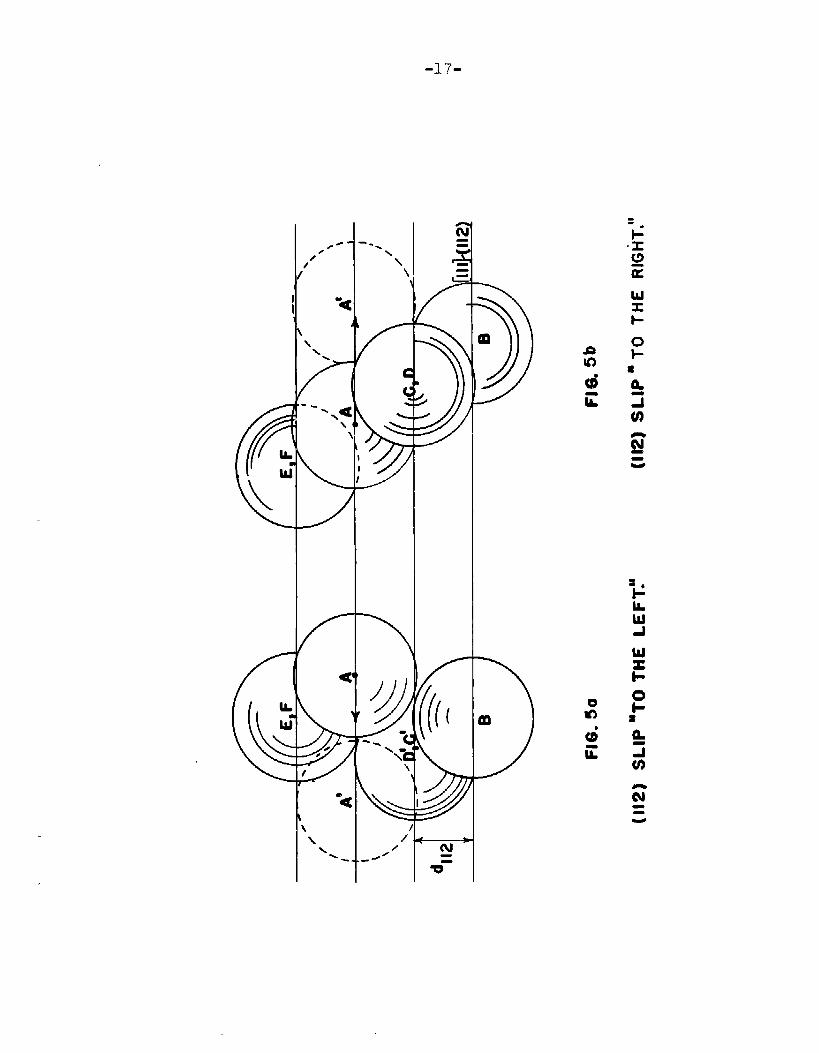
In (112) Slipj a stack of planes of a given thickness
slides in block form over the atoms on and belcw the trace
PUQU. The movement of atoms A5 G$ and H is indistinguishable
and is called a B-type movement~ Although the mechanism is
not Importantq it can be seen to involve riding up over atom
Band then passing through the region bounded by atoms C x D
ccrtheir equivalent in the plane Immediately stave the plane
M the paper.
‘ince ’112 is less than the radius of the atoms~ it can
be seen that the atoms E~ F~ etc. of plane PttQVUare affected
by the movement of atoms Aj G9 and H of plane PUQU and cannot
move independently or them. This movement of atoms on plane
P9~Q~]is called a C-type movement. Thus slip on (112] planes
is composed of an equal number of B“and C type movements.
Figs. ~a and ~b show the side view of such movements. Although
the atom movements for right- and left-handed slip are the
same~ the order in which they occur is reversed. Steijn
postula-~esthat this is the reason for Taylores division of
data into two groups$ one for each slip direction.
-17-
r
-u6 )
0
tiii
LIDwd
“Ni-
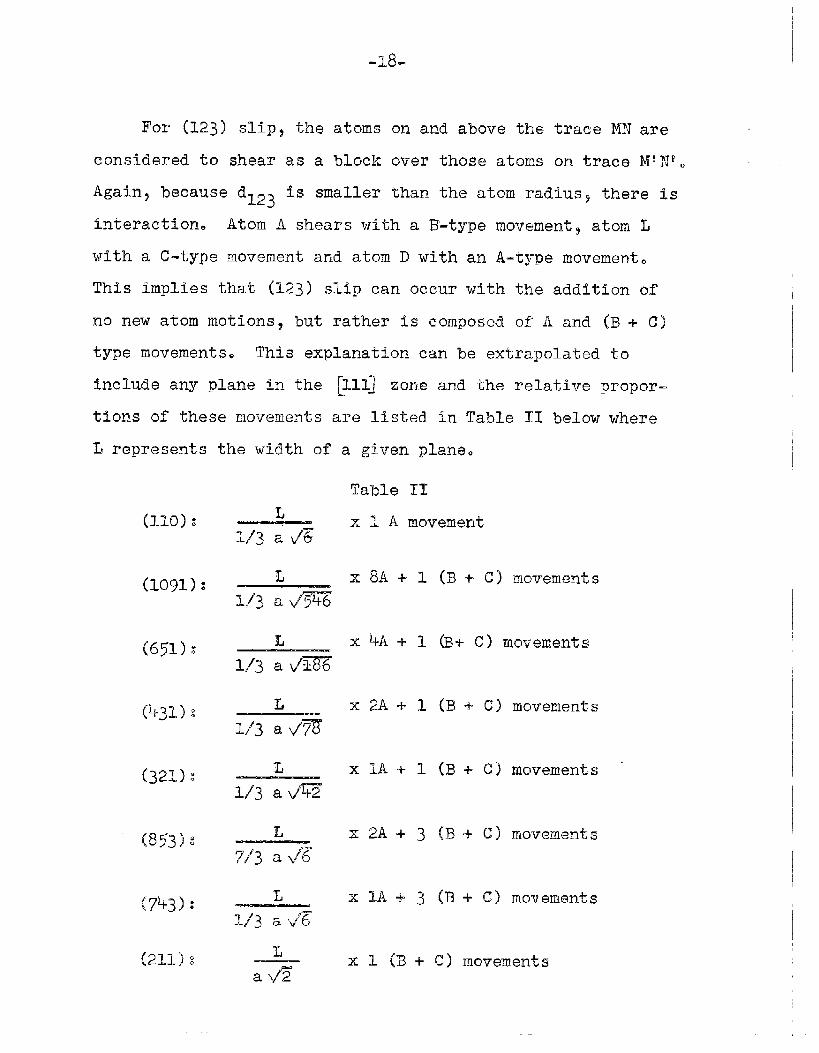
For (123) slipt the atoms
considered to shear as a block
Again5 because d123 is smaller
on and above the t~ace MN are
over those atoms on trace MSN9.
than the atom radius~ there is
interaction. Atom A shears with a B-type movement! atom L
with a C-type movement and atom I)with an A-type movement.
This implies that (123) slip can occur with the addition of
no new atom motions? but rather is composed of A and (B + C)
type movements. This explanation can be extrapolated to
include any plane in the [111] zona and the relative propor-
tions of these movements are listed in Table TI below where
L represents the width of
L
L
1/3 U/w
7[3 av%
I.!
z
a given planeO
Table 11
x 1 A movement
x 8A + 1 (B + C] movements
x kA + 1 (B+ C) movements
x 2A + 3 (B + C) movements
x 2A + 3 (E + C) movements
x 1 (B + C) movements
.19-
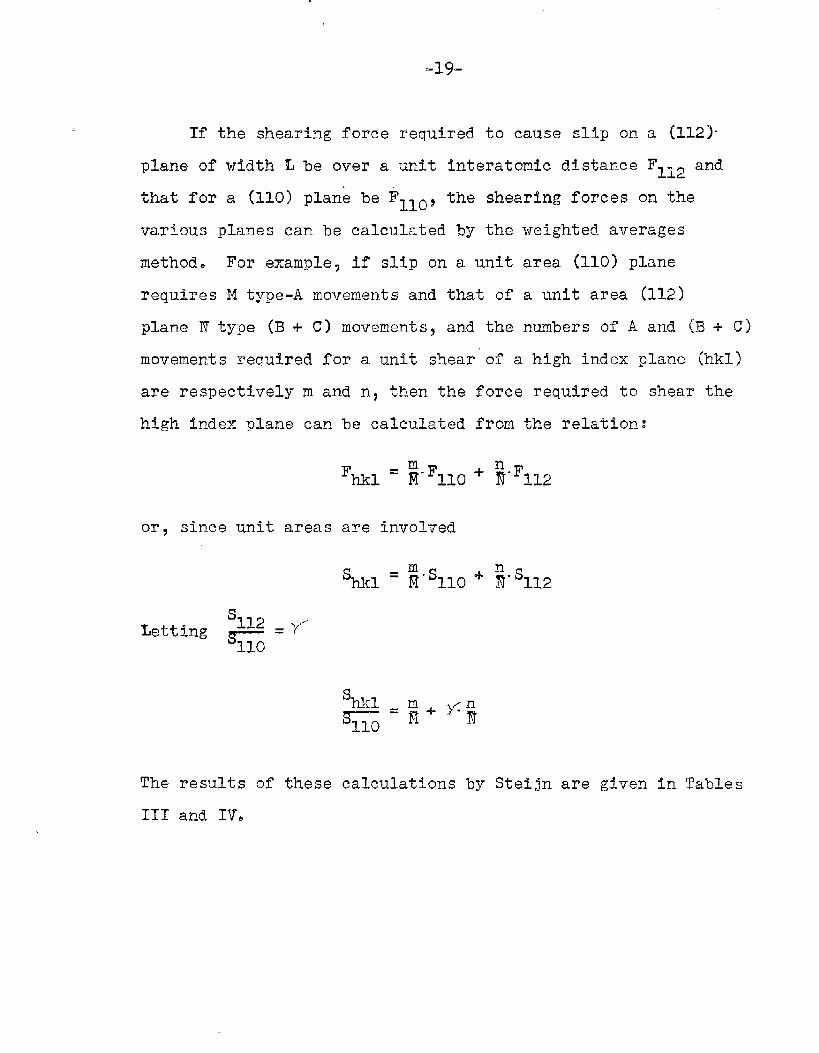
Tf the shearing force required to cause slip on a (U2)-
plane of width ~-be over a unit interatomic distance F112 and
that for a (110) plane be F1lO~ the shearing forces on the
various planes can be calculated by the weighted averages
method. For example~ if slip on a unit area (110) plane
requires M type-A movements and that of a unit area [112)
plane N type (E+ C) movements? and the numbers of A and (B + C)
movements required for a unit shear’of a high index plane (hkl)
are respectively m and n, then the force required to shear the
high index plane can be calculated from the relation~
or, since unit areas are involved
%12Letting ~- =Y’110
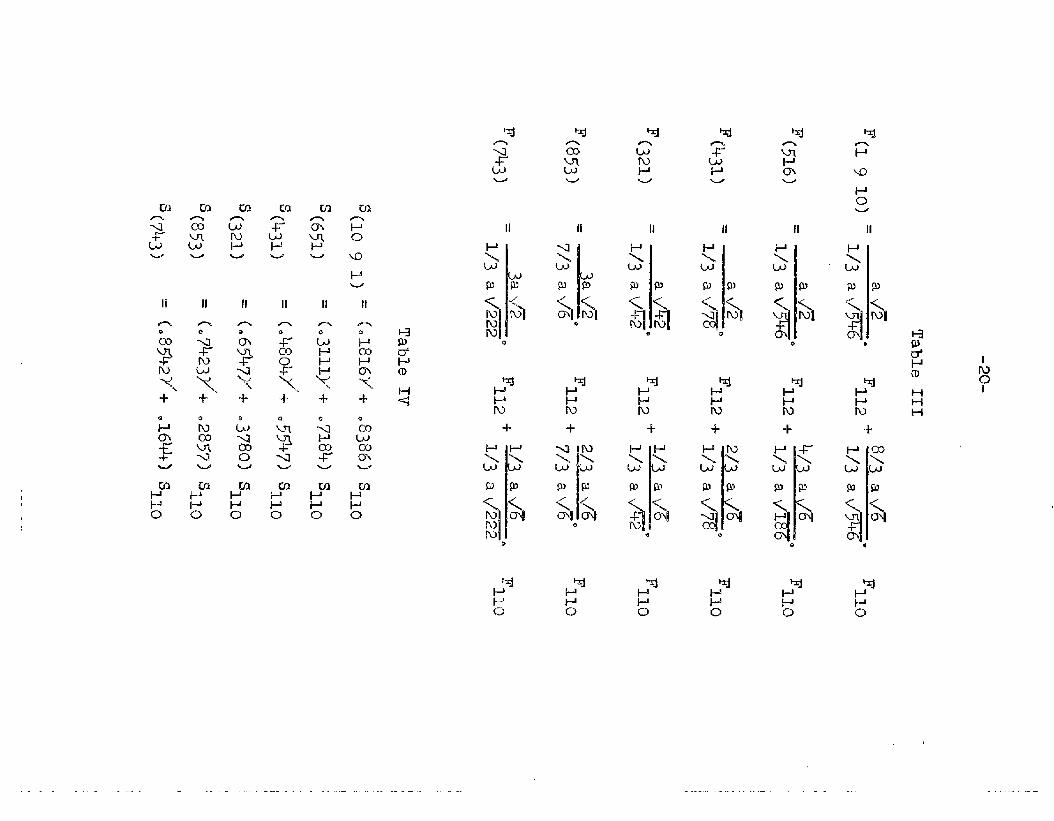
The results of these calculations by Steijn are given in Tables
111 and IV.
n
aw
Po
ccl mn
w0
II
II II
&-s
a
m
+ -+
c1 0
(AJ-Jmo
0
Pa-i4=-F-
P.Jco
-+
il- G
m+-JP0
mL0
.’
-21-
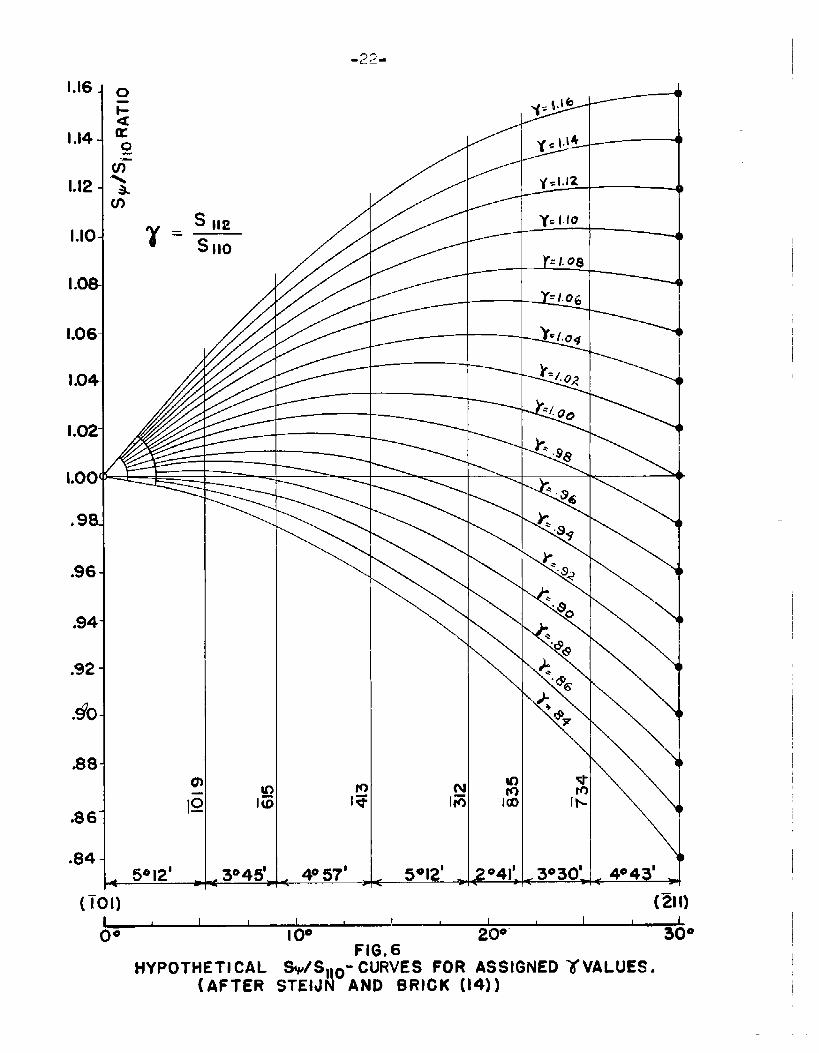
By assuming various values of # , Steijn obtained the series
of curves shown On Fig. 6. The significance of they parameter
is quite evident, and it would be extremely helpful if this
ratio could be theoretically calculated. All that is known
concerning it is that alloying elements should affect the
parameter differently, depending especially upon atomic radius
and perhaps upon other factors which govern alloying behavior.
Temperature should also affect the~ ratio quite markedly.
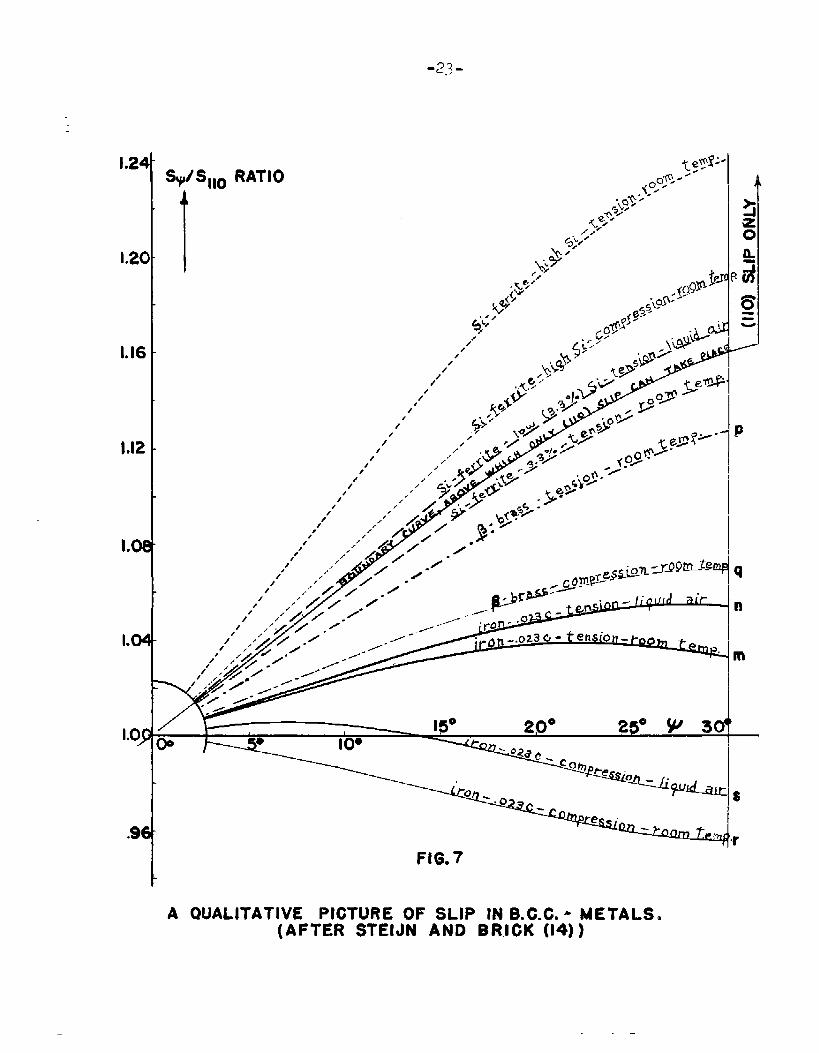
A summary curve by Steijn shows the quantitative lie of the
data of various investigators (Fig. 7). The difference in
behavior of crystals in tension and compression is manifest
on a different S~liSl10ratioq Why this should be changed by
changing the stress direction is not known although Steijn
postulates that the elastic deformation which always precedes
plastic flow affects it greatly. Perhaps if a lattice is
elastically compressed by alloying elements, then behavior
in tension is affected.
& Summary of the——
Tn general,
Various Theories
two points of view can be distinguished in
the literature concerning body-centered cubic slip.
The one is that slip occurs on the (110], (112) and
(123) planes or combinations of these and in the [111] direc-
tion. It is obvious that the extreme waviness of the slip
lines as always observed cannot be accounted for~ and certainly
cannot be designated as slip on true crystallographic planes--at
1.16
1.14
1.12
1.10
I.oe
1.06
1.04
1.02
I*OC
●9E
.96
.94
.92
.4C
se
.86
.84
= s ,,g7 Silo
-“”.
\
\
\
\
\
4’4
- Y*/,oq 1
)
b
*
Ic
,3030’ 4043’?
(211)
4°57’ 1+ 5012’<
0-1 I I ( I I I
I0° 20° 30°
I
FIG.6HYPOTHETICAL %+ ~- CURVES FOR ASSIGNED lfVALUES.
(AFTER STEIJ~ AND BRICK (14))
73”-L.
1.24
I*2Q
1.16
1.12
Lot
I*W
I.oj
.9E
s, ‘%0 RATIO
t
//
/
//
/’//’/ ,/’
/#’ /
FIG. 7
A QUALITATIVE PICTURE OF SLIP IN B.G.Co m METALS.(AFTER STEIJN AND BRICK (14))
-24-
least within the resolving power of our present-day measuring
equipment.
The second viewpoint, which is in direct opposition to
the first? is that of Taylor wherein it is postulated that
slip occurs in an octahedral direction but not necessarily
on low index crystallographic planes. In other words$ the
pole of the integrated glide ellipse$ which will be defined
as the pole representing the average slope of the wavy slip
linesz can occupy any positim in the ~111~ zone depending
upon the variation of the resolved shear stress. The glide
plane favored in compression is not the same as that one
favored in tension and hence the concept of opposite slip
direction necessarily caused the data of Taylor to be grouped
into tensile behavior and compressive behavior.
The work of Steijn and Brick has reanalyzed the Taylor
method and built, using the Taylor work as a foundation~ a
theory which allows slip to occur on any !Iintegratedplane’i
in the [Ill] zone by combinations of three types of atom
movements. The data for compression and tension were resolved
into one group on th~ basis of a normal stress affecting the
active slip plane. The waviness of the slip lines was also
explained by using the various combinations of the three atom
motions involvedb
Dislocation theory was found not to clear the picture
and WaS llOtdiscussed. Likewise the methods using X-Ray
-25-
asterism were found not to be of consequence in obtaining
insight into the mechanism of slip in~-iron.
~. Twinning
Introduction
The study of twinning and the criteria for its occurrence
comprises the second part of this review. Evalls(l~~has de-
fined a twinned crystal as follows~
If in a compound crystal made up of two structuresof the sarn~form there is a co-linear common planel butthe two structures are not co-directional? the cormmonplane is termed a twin plane~ and the common line whichis its normal? a twin axis; and the two structurestogether constitute a twin crystal and its parent. (un-derscoring added by the author.)
The physical conditions necessary for twinning have been set
(16) .forth by Preston .
1. llThetwinning plane can only be such that the opera-
tion of twinning does not bring atom centers closer
than the closest approach of atoms in either component
of the twin.l’
2. l’Thecomponents of the twin must have in common at
least one plane of atomsoli
The plane of atoms between the twin components is known
as the composition plane. TMs may be the twinning plane?
another plane, or in some cases a non-crystallographic surface.
In this common plane, there is an array of atoms that belong
to both the twin.and its parent crystal and necessarily a
distortion of this boundary region caused by th~ differences
-26-
in interatomic spacing necessary to promote coherency across
the twin interface. When the twinning plane coincides with
the composition planeq this distortion,becomes a minimum.
- of Twins.—
Plastic theory allows for two distinct types of deforms.
tiorl~ slip and twinning. They are best differentiated by
reference to a sketch of the lattice such as shown in Figs.
8a and 8b. It is readily seen that in twinning~ as opposed
to slip$ the displaced portion.of the lattice has assumed a
distinctly different orientation from its parent. Metals~
in generaly exhibit two separate types of twins~ growth, Or
congenital twins$ and deformation twins. Since we are con-
cerned with the body-centered cubic lattice, let it s’~ffice
to say that only growth twins have been proved to exist in
face-centered cubic metals while hexagonal metals exhibit
both growth and deformation twins. The body-centered cubic
metals? how.ever~exhibit only deformation twins.
A- _ents ,iiBody-Centered Cubic Twinning
In 1928 Mathewson and Edmunds(17) first proved that
Neumann bands produced by low temperature shock on ~-iron were
true deformation twins. ‘Thetwinning plane was of the (112)
type and the direction [11~ . It can be shown that on the
body-centered lattice the sense of direction in a twinning
movement is of utmost importance and must be defined if the
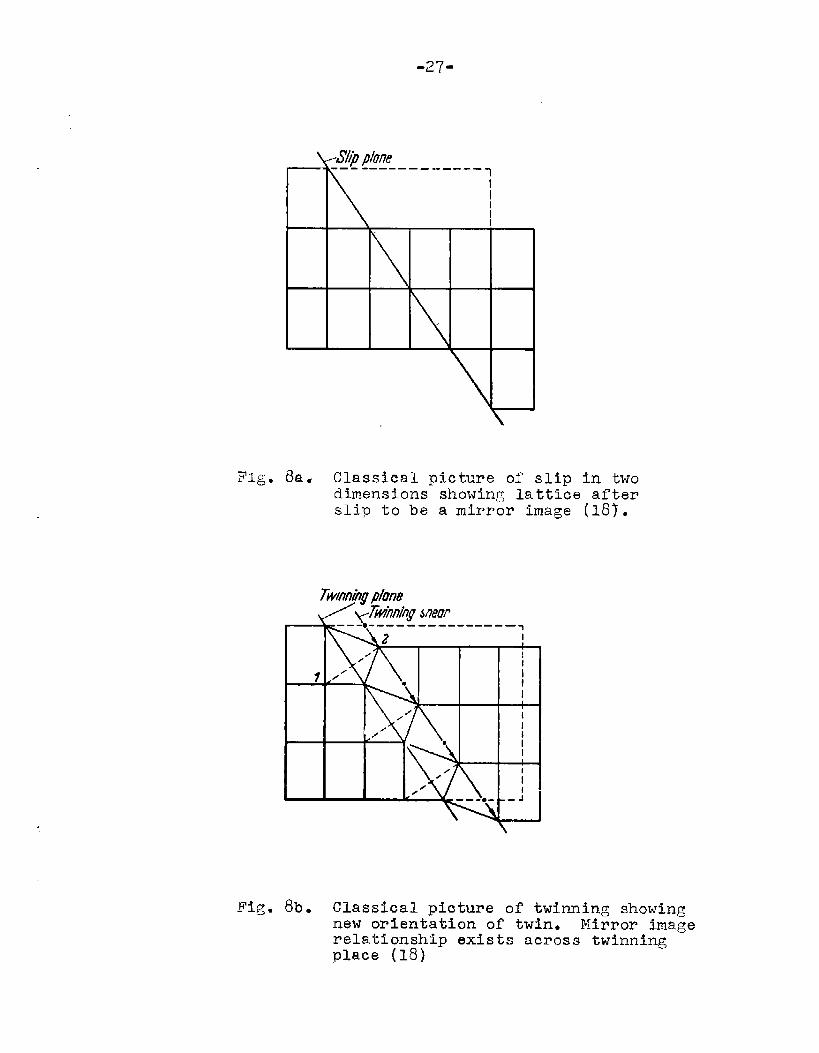
Fig. ik ● Classical picture of slip in twodimensions showing lattice afterslip to be a mirror image (18).
——-’m----=- --------— ,I
1I
//
0/
Fig. 8b. Classical picture of twinning showingnew orientation of twin. Mirror imagerelationship exists across twinningplace (18)
-28-
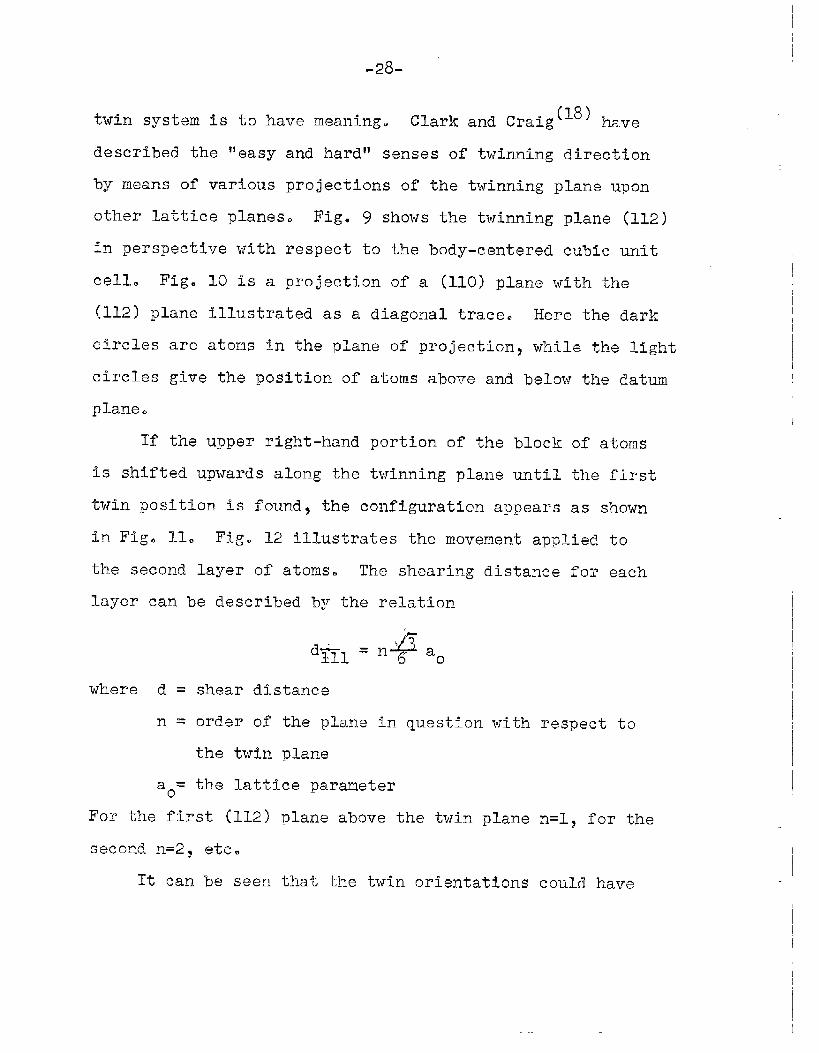
twin system is to have meaning. Clark and Craig(18) have
described the “easy and hardilsenses of twinning direction
by means of various projections of the twinning plane upon
other lattice planes. Fig. 9 shows the twinning plane (112)
in perspective with respect to the body-centered cubic unit
cell. Fig. 10 is a projection of a (110) plane with the
(112) plane illustrated as a diagonal trace. Here the dark
circles are atoms in the plane of projection, while the light
circles give the position of atoms above and below the datum
plane.
If the upper right-hand portion of the block of atoms
is shifted upwards along the twinning plane until the first
twin position is found$ the configuration appears as shown
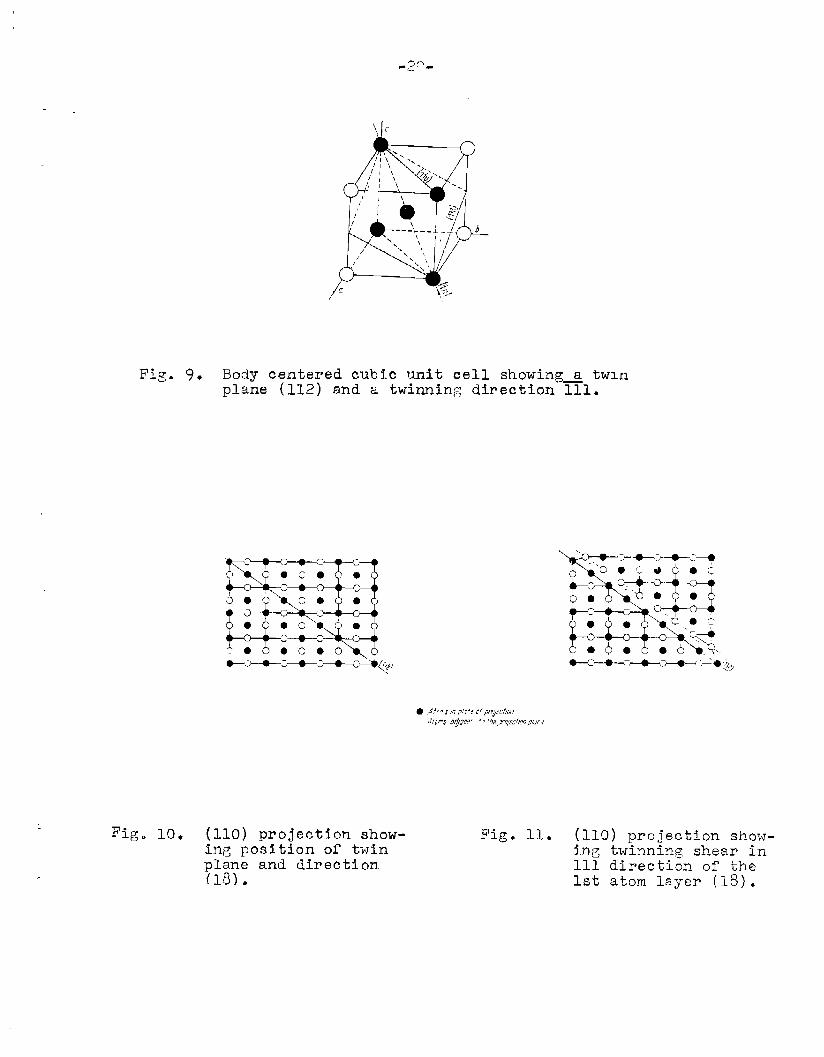
in Fig. 11. Fig. 12 illustrates the movement applied to
the second layer of atoms. The shearing distance fo~-each
layer can be described by the relation
.&l‘fil = n‘k a.
where d =
n ~
a =o
shear distance
order of the plane in question with respect to
the twin plane
the lattice parameter
For the first (112) plane above the twin plane n=l~ for the
second n=25 etc.
It can,be seen that the twin orientations could have
J-, ,,
-,.:. ,.-
~~g. 9. Body centered cubic unit cell showing a tw~nplane (112) and a twinnin,qdirectionml.
/
Fig. 10. (110)projection show-ing position of twinplane and direction(15).
Fig. 11. (110)projection show-ing twinning shear in111 direction of the1st atom layer (18).
-30-
Fig. 12. (1~~~..~~ojectionshowing twinning111 direction applied
to two atom layers (18)
9 e ,_\●:.:/ ‘..,
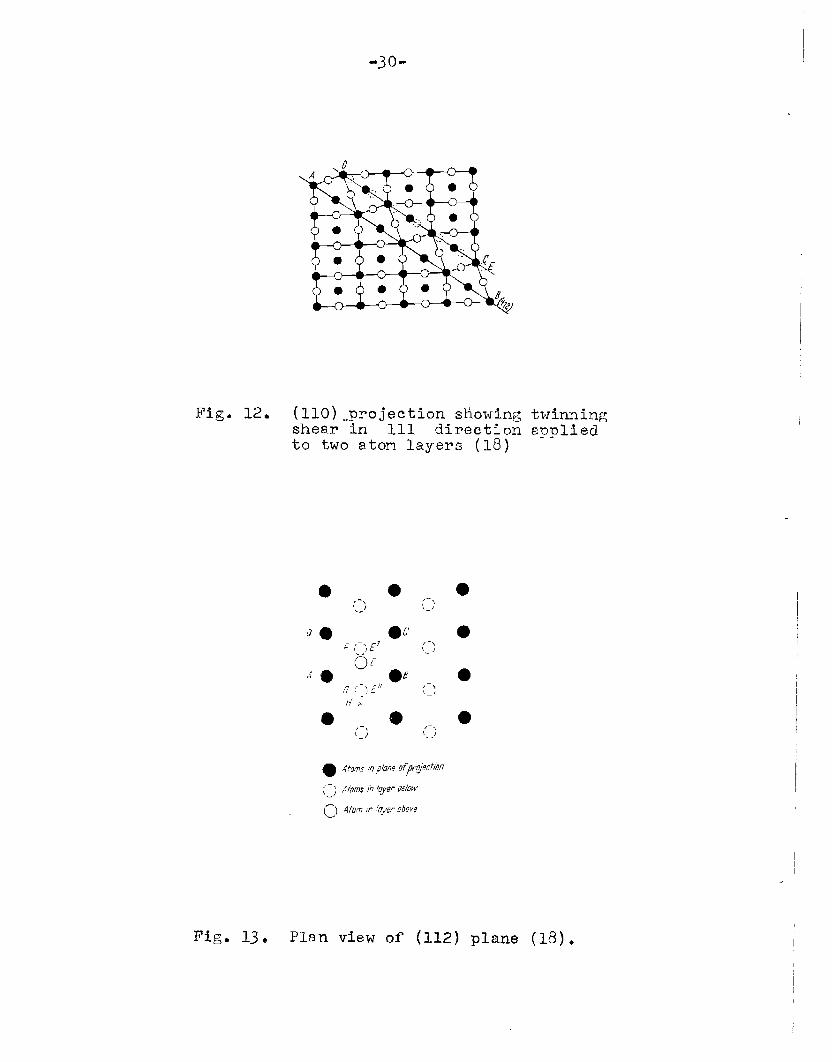
Fig. 13. Plan view of (112) plane (18).
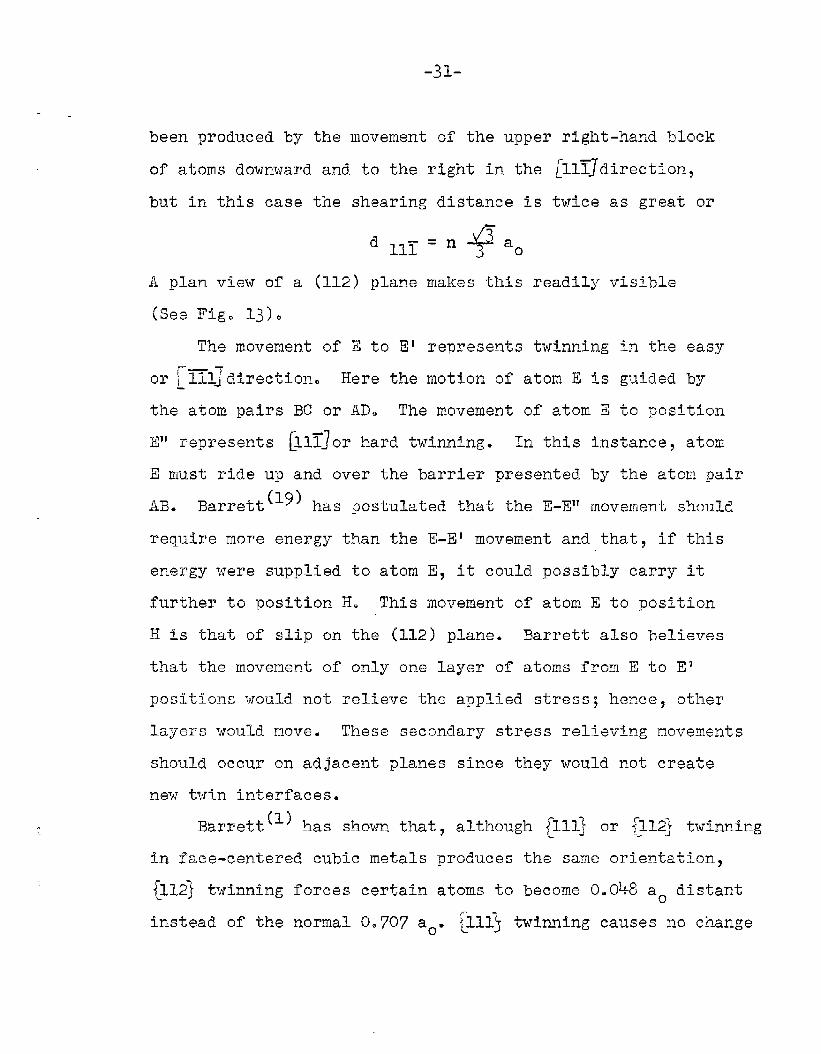
been produced by the movement of the upper right-hand block
of atoms downward and to the right in the [11~’direction~
but in this case the shearing distance is twice as great or
dllr=n~
ao
A plan view of a (112) plane makes this readily visi’cle
(See Fig. 1~).
The movement of E to El represents twinning in the easy
or ~~l~directior.. Here the motion of atom E is guided by
the atom pairs
~“ represents
E must ride up
EC or AD. The movement of atom E to position
[ll~]orhard twinning. In this instance$ atom
and over the barrier presented by the atom pair
AB. Barrett has postulated that the E-E” movement should
require more energy than the E-E! movement and thata if this
energy were supplied to atom E, it could possibly carry it
further to position H. This movement of atom E to position
H is that of slip on the (112) plane. Barrett also believes
that the movement of only one layer or atoms from E to El
positions would not relieve the applied stress; hence, other
layers would move. These secondary stress relieving movements
should occur on adjacent planes since they would not create
new twin interfaces.
Barrett‘1) has shown that, although [111] or {112} twinning
in face-centered cubic metals produces the same orientation,
{1,12]twinning forces certain atoms to become 0.048 a. distant
instead of the normal 0.707 ao. ~111~ twinning causes no change
I
I
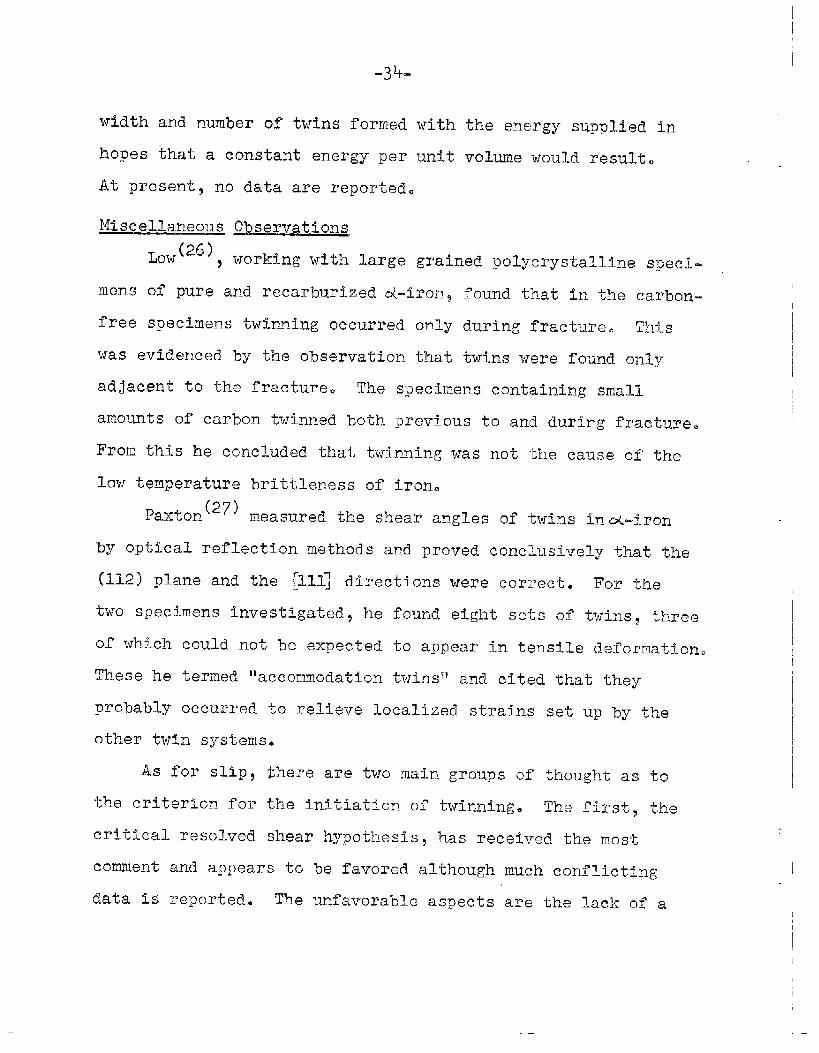
-33-
bore resolved shear stress considerably lower than the
maximum. Also twins occurred in the shoulder of the test
specimens where the area was approximately four times as
great as the minimum section.
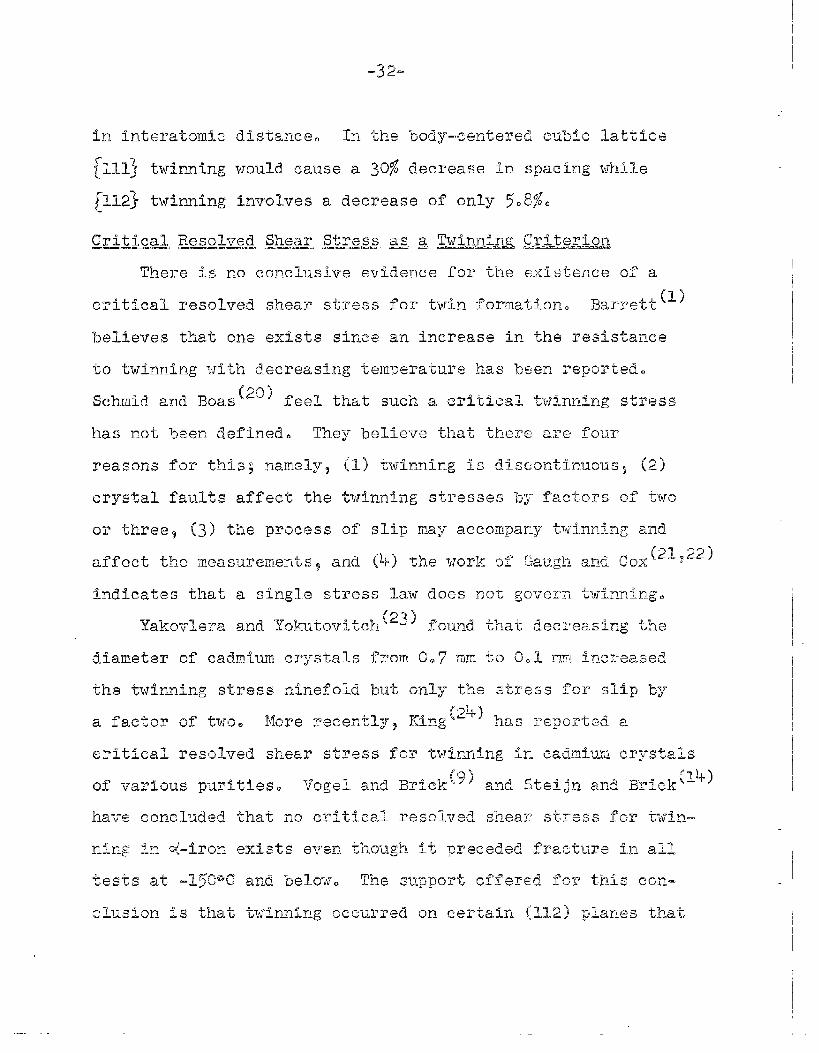
EnergX Criteria for Twinninq in Metals——
The rapid rates of loading encountered in impact
testing favor the formation of twins. An immediate release
of this shock load seems to promote twin formation.also. On
the contrary, the slip process is retarded by shock loading,
thus giving the impression that the movement or diffusion of
dislocations through the lattice requires the application of
the stress causing these movements over a critical period of
time; the extent of the time depending upon the testing tem-
perature. While slip is prone to cause small amounts of shear
on large numbers of adjacent planesl twinning us”~allyoccurs
over a stack of planes of greater height but in a lesser
number of sites.
postulations that
twin formation.
These considerations led to a great deal of
an energy change was the driving force for
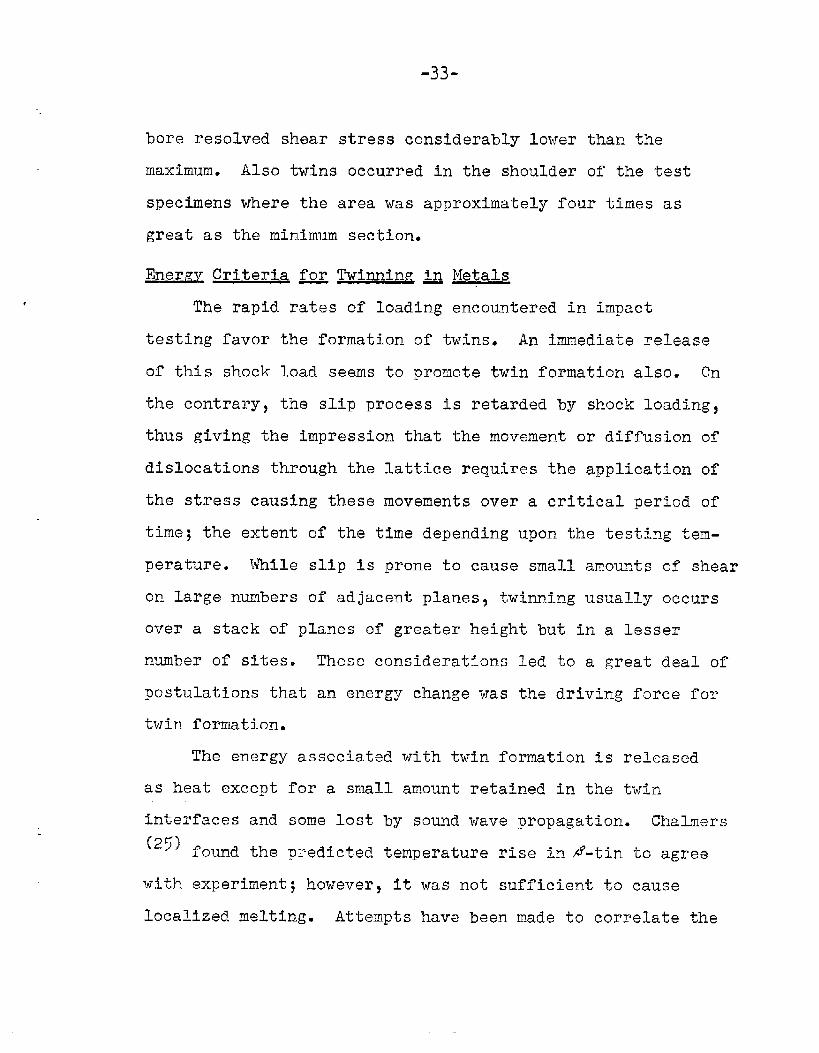
The energy associated with twin formation Is released
as heat except for a small amount retained in the twin
interfaces and some lost by sound wave propagation. Chalmers
(25) found the predicted temperature rise in ~-tin to agree
with experiment; however, it was not sufficient to cause
localized melting. Attempts have been made to correlate the
-34-
width and number of twins formed with the energy supglied In
hopes that a constant energy per unit volume would result.
At present, no data are reported.
Miscellaneous Observations
nlerls
free
Low (26 ) ~ working with large grained polycrystalline speci-
of pure and recarburized &-ironq found that in the carbon-
Specimens twinning occurred only during fracture. TM s
was evidenced by the observation that twins were found only
adjacent to the fracture. The specimens containing small
amounts of carbon twinned both previous to and during fracture.
From this he concluded that twinning was not the cause of the
low temperature brittleness of iron.
Paxton(27} measured the shear angles of twins ind.-iron
by optical reflection methods and proved eonclusiv~ly that the
(112) plane and the “~111~ directions were correct. For the
two specimens investigated? he found eight sets of twins? thee
of which could not be expected to appear i.ntensile deformation.
These he termed “accommodation twins” and cited that they
probably occurred to relieve localized strains set up by the
other twin systems.
As for Slipy there are two main groups of thought as to
-thec~iterion for the initiation of twinning. The firsts the
critical resolved shear hypothesis has received the most
comment and appears to be favored although much conflicting
data is reported. The unfavorable aspects are the lack of a
.—
-35-
truly constant resolved shear stress
nature of the process.
The second viewpoint is that of
appears to have some basis for being
and the discontinuous
energy association. ThiS
correct, but the experi-
mental work is scant? and no conclusions can be drawn concern-
ing its validity. All in all, it can be “statedthat twinning
is an extremely complex process, affected by so many variables
that few reliable investigations have been performed that do
not include the measurement of other phenomena with twinning.
C_.Cleavage
The literature on the general problem of fracture of
metals is perhaps the most voluminous of any m~tallurgical
subjects? and yet almost nothing is known about the funda-
mentals of metallic fracture. The particular type of fracture
known as cleavage has been investigated to a small extent in
polycrystalline metals of all crystal systems and for single
crystals OT certain hexagonal metals such as zincj cadmium$
etc. A search of the Tfterature reveals almost no work on the
cleavage of the body-centered lattice. This section of the
literature review will be composed of a short dissertation on
the rules that apply generally to single-crystal cleavage and
the few inconsequential bits of experimental data.
General Considerations ~ Cleava~e
TJndercertain experimental conditions, low temperatures,
high strain rates~ and special orlentations~ single crystals
will fracture by cleavage on low index crystallographic
planes. The yield point! elastic limit and fracture point
may be coincident in which case the tern “true brittle ‘be-
havior~fmay be used; howevera plastic deformation in the
form of slip or twin~ing may precede cleavage.
The cGncept of a critical resolved shear stress was
proposed as a criterion for the initiation of slip and twiu-
ning and a similar theo~ya the critical resolvwd normal
stress theory~ has been p~oposed for cleavage failure. This
theory ap~~liesonly when the fracture is a flat plane surface$
and the stress for cleavage i~aybe calculated Srom the relation
N=:cos 2d
-37-
strength with increasing prior deformation. zener~~s) points
out that this concept should here-examined. The flow stress
curve was defined as the plot versus strain of the tensile
stress necessary for continued plastic flow. The fracture
stress was then defined as the plot against strain of the
tensile stress which would be needed to produce fracture
if plastic flow did not occur. Zener says that ‘~according
to oLm present viewpoints regarding the Initia”hionof fraetu~e
in metalsp fracture cannot occur independently of deformation~
and therefore there is grave danger that the concept of’the
fracture
Theories
The
stress curve is purely a figment of our imaginaiiono$~
~ Cleavage Stremths
theoretical strength of metallic perfect crystal has
been calculated from the ene~gy required to form the two
surfaces of the cleavage planes and been found to be 102 to
103 times greater than obse~ved. The reasons for the lack of
metal crystals to achieve theoretical strength have been
attributed to pre-exist~nt microcrackst cracks forw.edduring
deformation and other inhomogeneities such as g~ain bounda-
ries, inclusions etc.
In cubic crystalst particularly body-centered cubic ones9
it has been often proposed that the problem of fracture can be
resolved by studying the relative stresses for slip? twinning
and cleavage. Barrett‘3) states that ‘~whena stress is agplied
to a crystal, it should cause slip, twinningl or cleavagey de-
pending on whether the resolved stress on the slip plane in the
-38-
slip direction, or on the twinning plane in the twinning
direction~ or normal to the cleavage plane is first to
exceed the critical value for the process concern.ed.t~
Experimental Work cm q-iron Crystals—— — b
Schmid and Boas(20) show a macro-photogra,phof a
cleavage plane of d-iron which exhibits a rough striated
appearance. p~~~o~fl,@~J crystals fractured with almost
no plastic flow and he reco~ded.the fracture stress to be
~“~27kgm per sq. mm. St~ijn and Brick pulled several single
crystals to fracture at various temperatures. The results
of their investigation are shown in Fig. Ik. It can be
seen that the cleavage stress inc~”easeswith the amount of
strain at constant temperature. This cume does not tell
anything of the effect of orien.tationpand even worse the
authors did not report whether their “fracture stressesll
were critical resolved normal stresses or tensile stresses.
Tt appears f~Om the text of the~Lr work that the stresses
are kme stress (load at fracture divided by the area of
the fracture cross section.)
TT. FXPGRTMENTAL PIXICEDUREAND TECHNIQUES
In a funclammtal investigation one would,desire$ as a
starting material? a quantity of the metal being studied in
‘imr~stj~andIts “ ~lclean.estR’fOT’Kle With this in mind% the
first attempts to Erow single crystals of iron,were made with
—.
-39.
\
\
\
\
\
\;to
●
●
:
m
I
●
,,, \,\,,,
mNm

-40-
,.
various “high-:purity11irons available commercia~].y.
Westinghouse Puron was investigated and discarded despite
its relatively high purity because of the prohibitive number
of inclusions. Carbonyl iron was eliminated from considera-
tion because no adequate vacuum melting facilities were
available to cast it into usable fern. National Research
Corporation vacuum melted iron appeared to be the best choice
both with respect to purity and inclusion count.
Attempts at Growth ~ Various Methods.— . —
Several ten-pound ingots were purchased and cut into speel-
imensof various shapes. It was decided that three methods
would be investigated to find a satisfactory means of mass
Prod~cl~W single crystals long enough for test purposes. These
methods were: (1) strain-anneal; (2) strain-temperaturegra-
dient; and (3) transformation.
In simple termsl the strain-anneal me-thodconsists of
plastically deforming a series of test specimens in varying
amo’mts and then allowing them to recrystallize at some tempera-
ture below any phase change; for iron~ this wculd be the~to%
transformation at 910GC0 The strain-temperature gradient method
is really just a modified.form or the strain-anneal method where5
instead of allowing the whole speeimen to ~ea~ to Some sll~.
critical temperature at a low rate, the specimsn is drawn through
a furnace with a temperature gradient. Usually the specimens
I
-41-
used in this method are deformed.by rolling, drawing, or other
methods of severe ylastic deforr,ation. The transformation
method uses the technique of the strain-temperature gradient
method but a different principle. Here the specimen is held
In a part of the furnace where the temperature is higher than
910~ (Ae3). It is then drawn through the gradient, and.sup-
posedly a TUCM forms when the end of the specimen passes
through the~>+ transformation and grows at the rate at which.
the specimen is being pulled.
For the strain anneal experiments, ten series of twelve
specimens each were strained in tension from 1.75 to ~~.Oper
cent elongation In two inches in increments of 0.25 per cent.
Each series was heated at 5@F per hour to a temperature of
880°C5 held for ten hours and cooled to room temperature.
The series having a strain of 3.25 per cent elongation yielded
two single crystals about one and one-half inches in length.
These crystals were boun,dedby other very large crystals that
extended to the ends of the test specimen. When the same
strains were used on a similar series from a second lT.R.C.
ingot no single crystals were produced.
For the strain-temperature gradient work~ again tsn series
of twelve specimens each were machined in,torectangular bars
112 inch by li2 inch by 10 inches long. These were rolled
from 30 to 75 per cent reduction in thickness in increments
of five per cent. Each series was heat treated by drawing
-42-
through the gradient furnace at various speeds. Rates from
0.1 inch per hour to 10.0 inches per hour were IJsed without
Recentlyy(k
success. Low 3 ) has grown.long single crystal wires
of N.R.C. iron by this method. Perhaps the section size is
the critical parameter.
The transformation work was initiated with cylindrical
roflspecimens 1!2 inch round and six inches in length. At
Tirstj draw speeds were on the order of six inch~s per honr~
and t’hm were decreased until the first noticeable chav.gein
grain.size was producpd. It was found that, as slower and
slower draw speeds were used? the grain size increased to a
maxim-m and tb.enleveled off. The greatest grain size produced
was about 10 millimeters of length and extended completely
through the cross section. Tapering the specimens so that the
section where the first nucleus formed was smal.lyhad no
beneficial effects.
These initial experiments indicated that the strain-anneal
r,ethcdpossessed ‘kh~most possibilities of prcducinE large
crys-hals7but that rqmoducibility among the v~rious ingots
of National Research Corporaticm ImrI was not to be expected.
Since larger heats of this mate~ial were Pot available it
was decided to .aba~dm it in favor of another. The other
al.termati,veswere JkrmcoIron and decarlmrized mild.steel.
Th~se wers compared.with respect to purity and inclusion
l=ati~.,gant!SAE 1008 steelj silicon kil.ledlwas chosen on the
43-
basis of its cleanliness and availability.
Specimen FTe-naration
The starting material was received in the form of a 400-
foot coil of 3/4 inch round hot-rolled stock. The “as-received?’
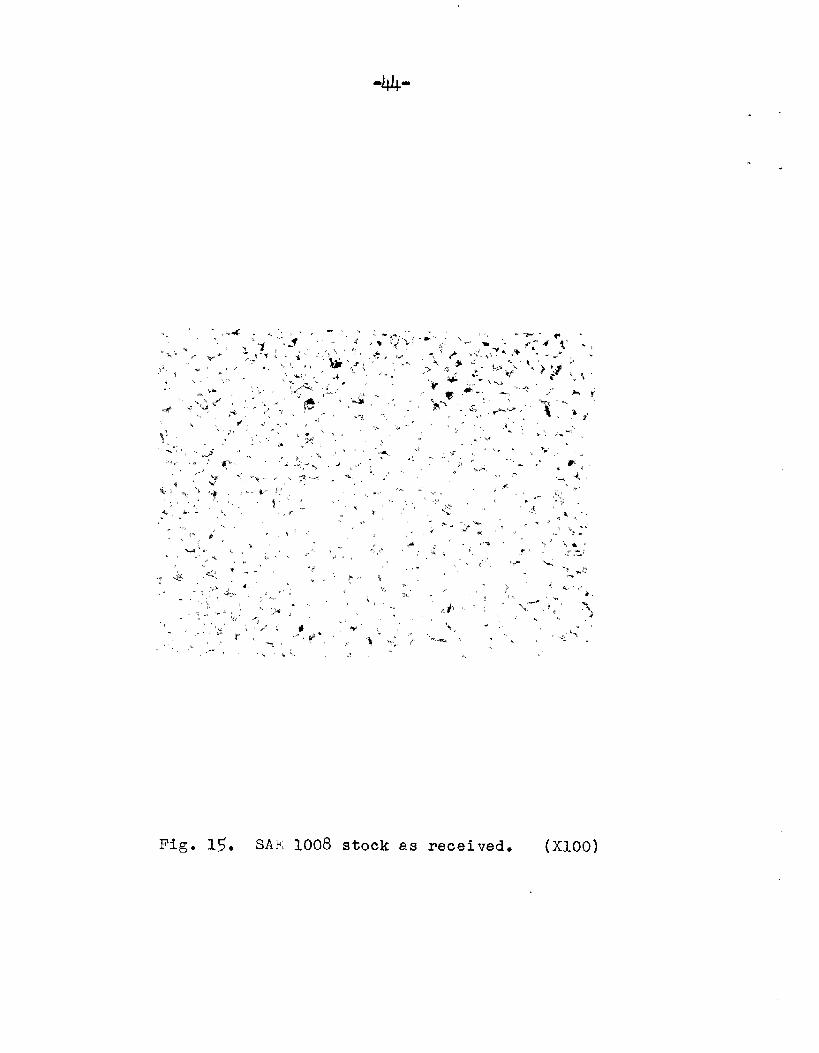
grain size was ASTM #7-8. A representative photomicrog~aph
of this material is shown in Fig. 15. An unetched sample
showed the material to contain fewer inclusions~ especially
FeOa than even the ~Thighpurityr’laboratory irons previously
described. The heat analysis accompanying the steel listed
the impurities as follows:
& !Si Mn P s Cr Ti MO Ni Cum = ~ 0.010 0.027 ~ ~ 0.01 m ‘m
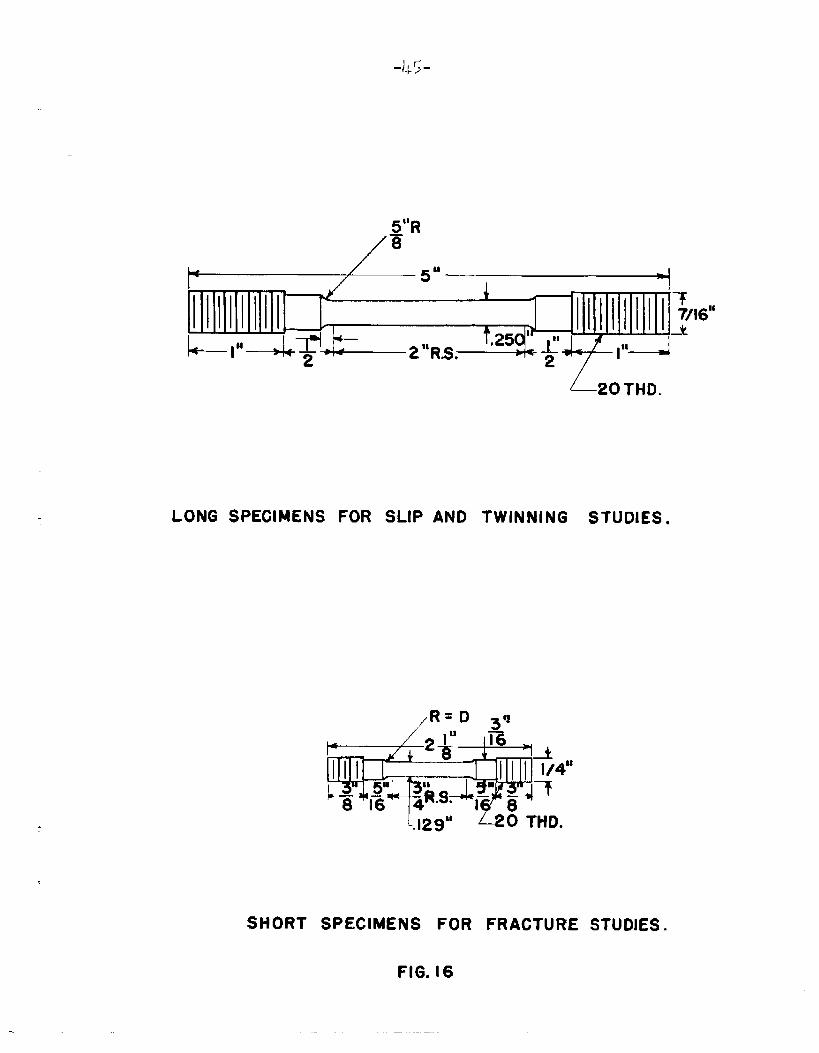
Specimens were machined from the stock to the dimensions
shown in Fig. 160 Tt was believed that the radius of the
shoulder portion would be a critical factor in determining
the critical strain. Later results frcm specimens of radically
different design showed this to be incorrect. The long ~auge
section was used in order that the ratio cf gauge length to
gauge diameter should always exceed the usual minimum accepted
value of four to one. The diameter was maintained as large
as possible with respect to the over-all geometry of We speci-
men so that the radius of curvature would not be so great that
experimental errors in the optical measure~men.tswould be excessive.
-44”
Fig. 15. SAE 1.008stock as received. (Xloo)
~“R
/0
L 20THD.
LONG SPECIMENS FOR SLIP AND TWINNING STUDIES.
029” &O THD.
SHORT SPECIMENS FOR FRACTURE STUDIES .
FIG. 16
-46-
Decarburization: Equipment and Technique
The decarburization of specimens occup~ed an important
phase of the investigation and hence should be dealt with in
some detail. The mechanism of the water saturated-hydrogen
decarburization of metals-is not well known, but the techniques
involved have been studied extensively.
Furnace ConstructionI
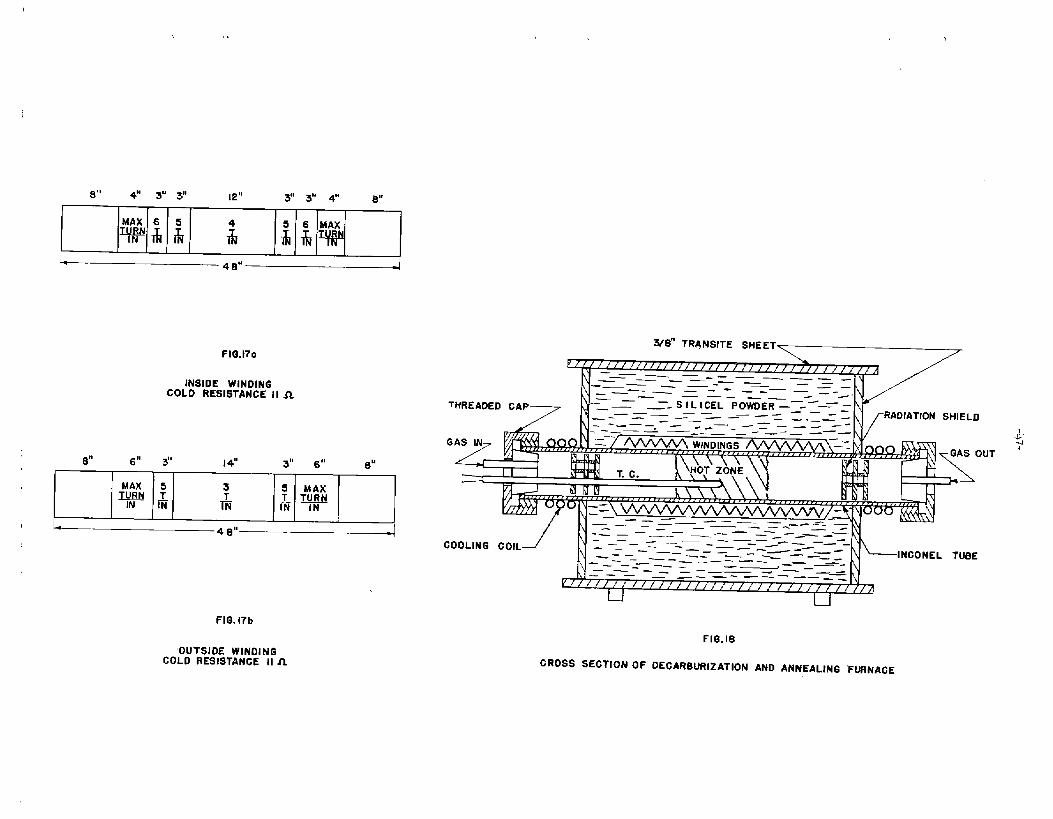
Theheat treating furnaces were constructed about a 3 l\2- ~
inch Inconel tube, 48 inches long. This tube was wrapped in
mica sheet to insulate it from the resistance windings. Many ~
high temperature ‘Iburn-outsitled to the belief that the organic
binding material of the mica sheet was embrittling the resist-
ance wire. To prevent this, a burning-out treatment was used
which consisted of inserting a high-pressure blow torch first
into one end of the tube and then the other and allowing the
binding material to ignite. An eight-hour treatment proved
sufficient to remove the sulfurous binder and prevent subsequent
embrittlement.
Next, the first layer of windings of #9 Kanthal wire was
placed on the tube directly over the mica sheet. The spacings
are shown in Fig. 17a and must he detemined empirically from
the heat flow characteristics of the furnace geometry. The
tube was then painted with several coats of special ‘Ilow-silicaii
alundum cement. This special adhesive again prevents attack
!
I
8“ 4“ 3“ 3“ 12“ 3“ 3“ 4“ 8“
MAX 6 5
w Tk h i
s 6 MAX
& h w
FIG.170
INSIDE WINDINGCOLD RESISTANCE 11~
THREADED CAP—
A
7
0“ 6“ 3“ I4“ 3“ 6“ 8“
MAX 5IL# &
5 MAX: I T-
Iti iri
FIG. i7b
“OUTSIDE WINDINGCOLD RESISTANCE IIJL
*8” TR~tW31TE SHEET
F//// //////(//////,,/,/,,,,,,,,,, ,,,,,,4
i—— —_. - —.— —— . .
—— _’ \—— — -— —== ——— .
_—— ——- -—. — —_-
$—_—_ —— _ —.
—_— _- S I L ICEL POWDER ——---——Z /—— ———-— —— ——— —___ .__— _——
A > /
F?ADIATION SHIELD_— — _—-— —
.--_— J_ -- — ———— -_. —-_ -—-— ———
v/ / / / / , ? ,1,-&– –—– —.- = = ~. =–—_–_—’-., i //i //// ///{////////’;/~u
CROSS SECTiOH oF
FIG.18
DEGARBIMIZATION Am
l-i
AIWJEALING
L-L
1
-48-
by silica on the resistance windings. Sauereisen electrical
resiste~ cement was applied as a pasty mixture until the
outline of the wire windings could not be seen and then a
few more coats were applied for added strength. Next, a
few more thin coats of the low silica cement were applied to
protect the next winding from silica attack. The second
layer of windings is spaced according to Fig. 17b. More
alundum cement and then a final thic’kcoating of Sauer~isen
cement completed the heating element assembly.
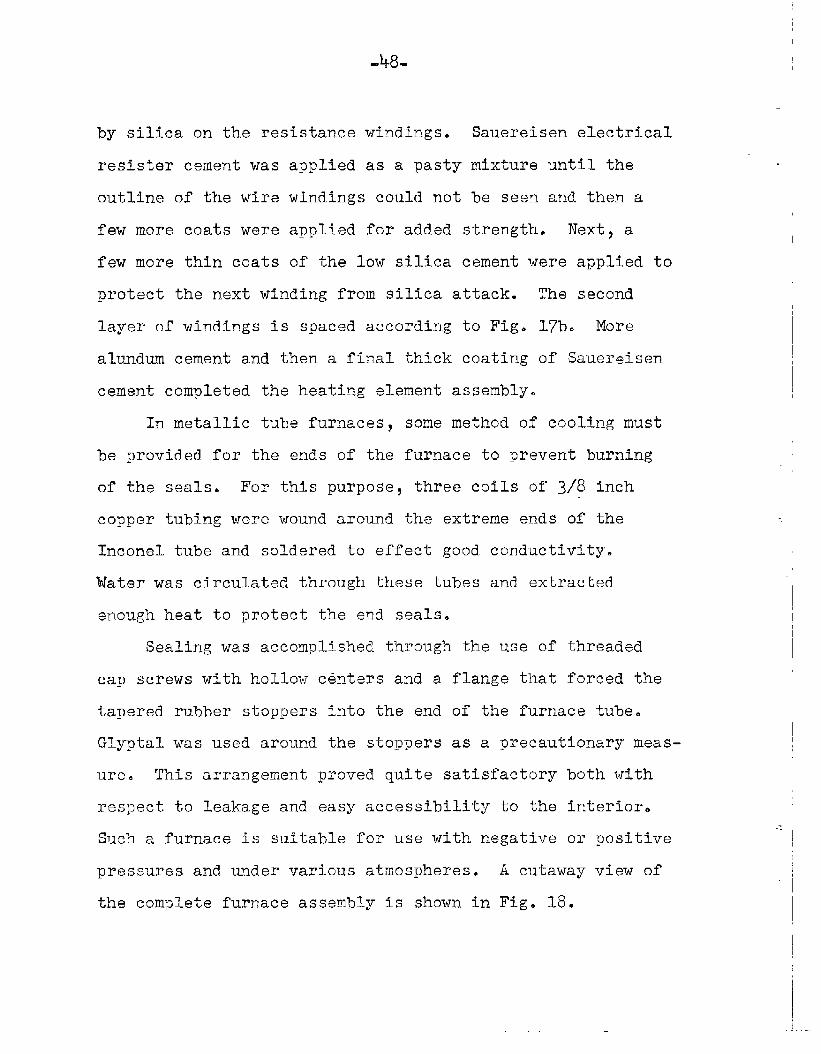
In metallic tube furnaces, some method of cooling must
be provided for the ends of the furnace to prevent burning
of the seals. For this purpose, three coils of 3\8 inch
copper tubing were wound around the extreme ends of the
Inconel tube and soldered to effect good conductivity.
Mater was circulated through these tubes and extracted
enough heat to protect the end seals.
Sealing was accomplished through the use of threaded
cap screws with hollow centers and a flange that forced the
tapered rubber stoppers into the end of the furnace tube.
Glyptal was used around the stoppers as a precautionary meas-
ure. This arrangement proved quite satisfactory both with
respect to leakage and easy accessibility to the interior.
Such a furnace is suitable for use with negative or positive
pressures and under various atmospheres. A cutaway view of
the complete furnace assembly is shown in Fig. 18.
..
. . . ..
-49-
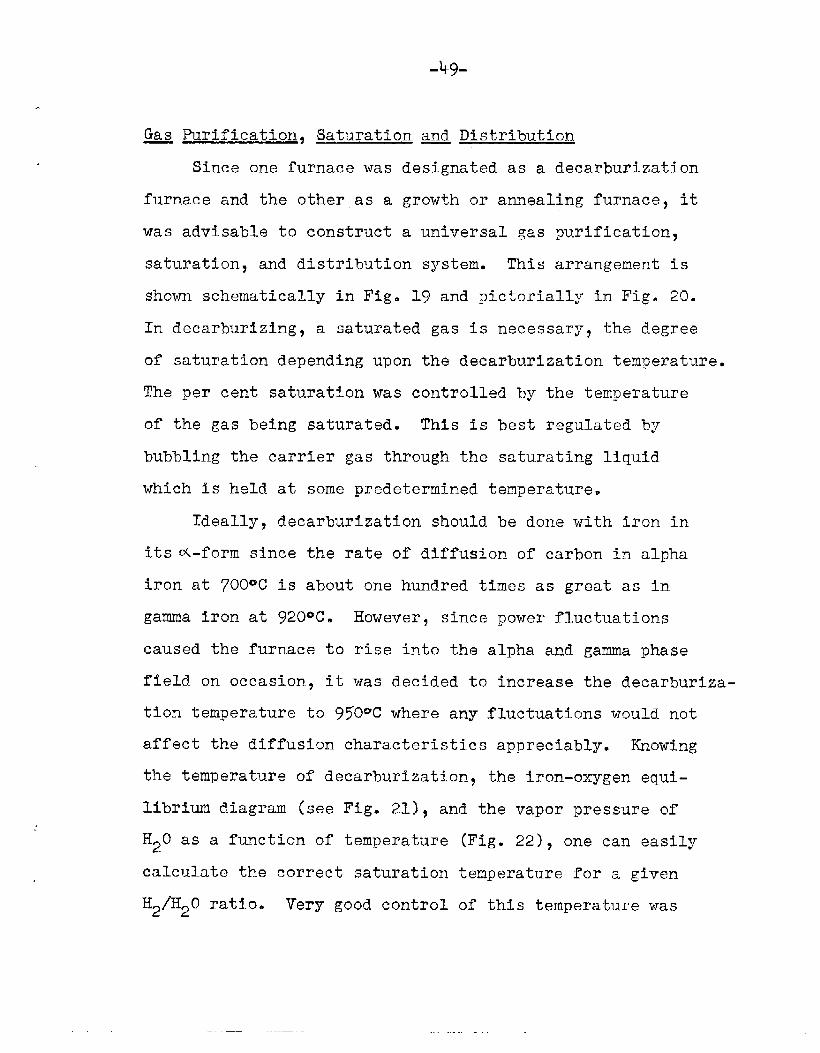
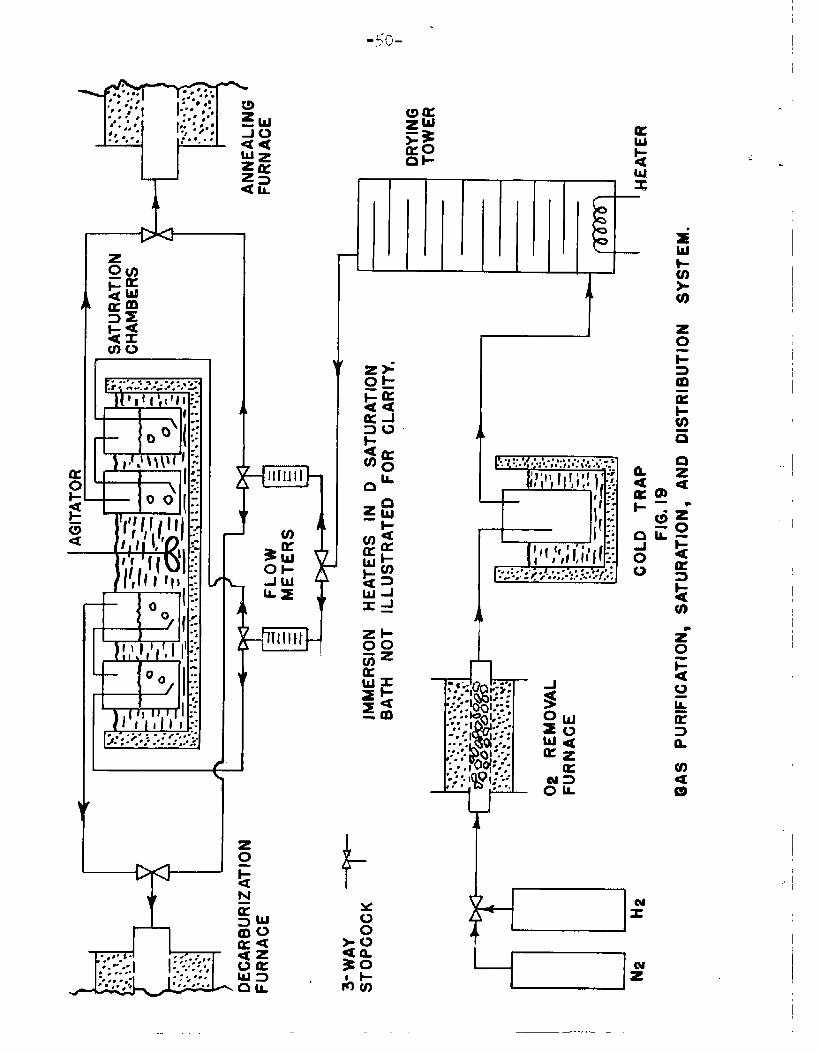
= Purification, Saturation and Distribution
Since one furnace was designated as a decarburization
furnace and the other as a growth or annealing furnace, it
was advisable to construct a universal gas purification,
saturation, and distribution system. This arrangement is
shown schematically in Fig. 19 and pictorially in Fig. 20.
In decarburizing, a saturated gas is necessary, the degree
of saturation depending upon the decarburization temperature.
The per cent saturation was controlled by the temperature
of the gas being saturated. This is best regulated by
bubbling the carrier gas through the saturating liquid
which is held at some predetermined temperature.
Tdeally, decarburization should be done with iron in
itsti-form since the rate of diffusion of carbon in alpha
iron at 700@C is about one hundred times as great as in
gamma iron at 920cuc. However, since power fluctuations
caused the furnace to rise into the alpha and gamma phase
field on occasion, it was decided to increase the decarburiza-
tion temperature to 950”C where any fluctuations would not
affect the diffusion characteristics appreciably. Knowing
the temperature of decarburlzation, the iron-oxygen equi-
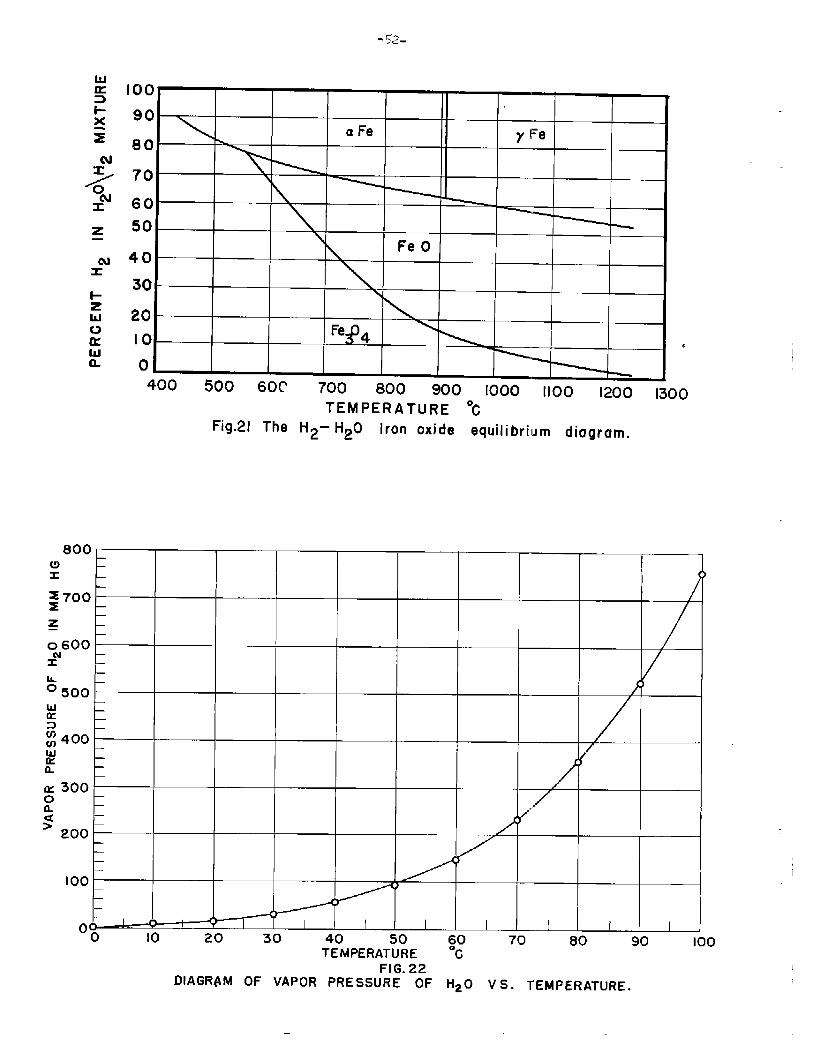
librium diagram (see Fig. 21), and the vapor pressure of
H20 as a function of temperature (Fig. 22), one can easily
calculate the correct saturation temperature for a given
H2/H20 ratio. Very good control of this temperature was
.
-50-
aa
t
L
-m
-----. . . . ..
. .,.....1,.
C3
.— —.. . .——
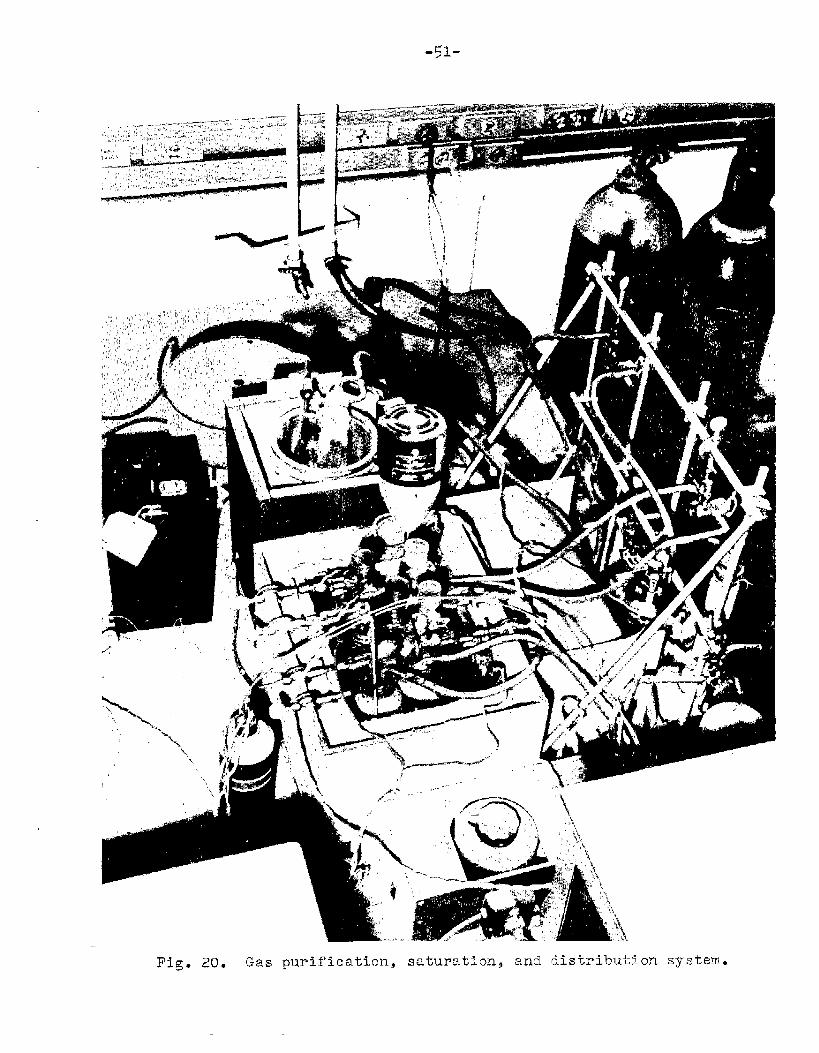
--%+-
Fig. 20. Gas puri~ication$saturation and distributionsystem..
1004
90a Fe
80 \ y Fe
70 \
60
50\ Fe O
40
30 \
20
10Fe+4
<>
0400 500 60C’ 700 800 900 1000 1100 1200 1300
TEMPERATURE ‘CFig,21The H2– H20 iron oxide equilibrium diagram.
}1 I
I
III
1
1
I I I I1I n
1 \ 1 I10 20 30 40 50 60 70 80 90 100
TEMPERATURE ‘cFIG. 22
DIAGR4M OF VAPOR PRESSURE OF H20 VS. TEMPERATURE.
—
-!73-
obtained with two immersion heaters, a mercury thermore2ulatorY
and a bath of light-weight paraffin.oil kept in motion.with a
mechanical stirrer. The current supplied to one heater was
regulated until the equilibrium temperature of the bath was
one to two degrees below the desired temperature. The second
heater in conjunction with the thermoregulator controlled
only the range between the equilibrium temperature or the
first heater and the control temperature. Temperatures may
be controlled within + 0.02~C in this ~.anner. The tube lead.
ing frcm the saturators to the furnace was kept above the
saturation temperature to prevent precipitation of water from
the carrier gas. The flow rate was regulated until a small
flame could be struck and maintained at the exit eml of the
furnace.
T’echniaue
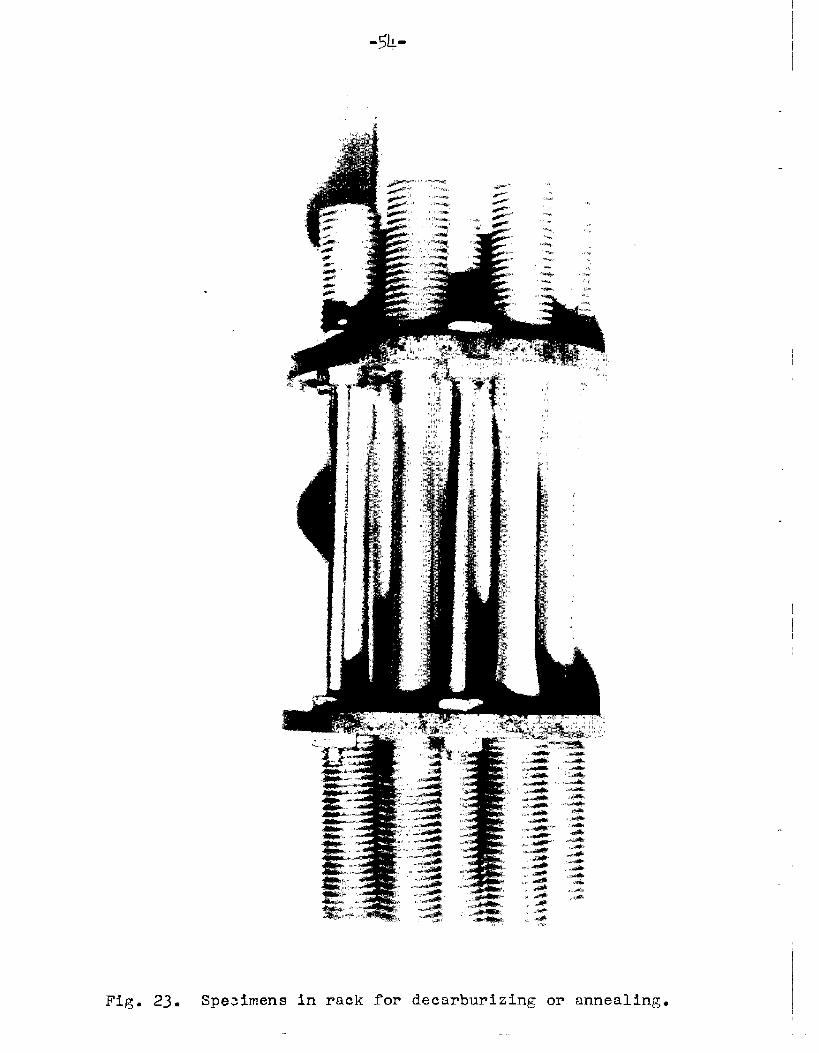
A series or batch of specimers consisted of a grou~ of
thirteen placed In two racks as illustrated in Fi’g.Z3. These
racks were placed on either side of the exact center of the
furnace tube. Constancy of temperature was maintained + ,2°C
in a 15-inch region of the furnacey so al-1portions of the
specimens were at the sam~ temperature. The furnace was first
flushed with nitrogen to remove any air, then dry hydrogen
was used until the specimens reac~hedthe decarburization
temperatlui”e.After r~aching tem:]erature?the furnace was
switchefito the wet hydrogen mixture. Caution must be exercised
-54-
.
Fig. 23. Spe~imens in rack for decarburizing or annealing.
-5J5-
that no wet gas be allowed to contact the specimens while
they are in the two phase (~+1”) region or else columnar
grains will grow from the surface of the specimen inward
as a result of diffusion in a two-phase region. These grains
are impossible to refine into an equiaxed structu~e and there-
fore void the specimens for further use.
After decarburization had occurred for one hundred
hours? a resistance of four ohms was inserted in series with
the windings. This resistance was sufficient to decrease
the equilibrium temperature of the furnace to about 8%OQC and
hence caus@ it to cool to this temperature at a rate slow
enough to prcduce a grain size of ASTM #3-k. This grain size
is ideal for straining. It is big enou~h to permit critical
strains which are large enough to be measured easily and yet
small enough to permit a homogeneous strain. The atmosphere
was changed to dry hydrogen for the cooling treatment so
that no bluing of the specimens wo-cddoccur. A representative
photomic~ograph of the structure is shown in Fig. 2k. A
typical analysis of the decarburized material is 0.019~
carbon.7.009% oxygen> .0003~ hydrogen$ and .0018% nitrogen.
The analyses of the other elements remains the same as in
the original steel.
Determination of the Critical Strain.—
for ExaRRcrated Grain Growth——
After decarburization~ the specimens were grepareclfor
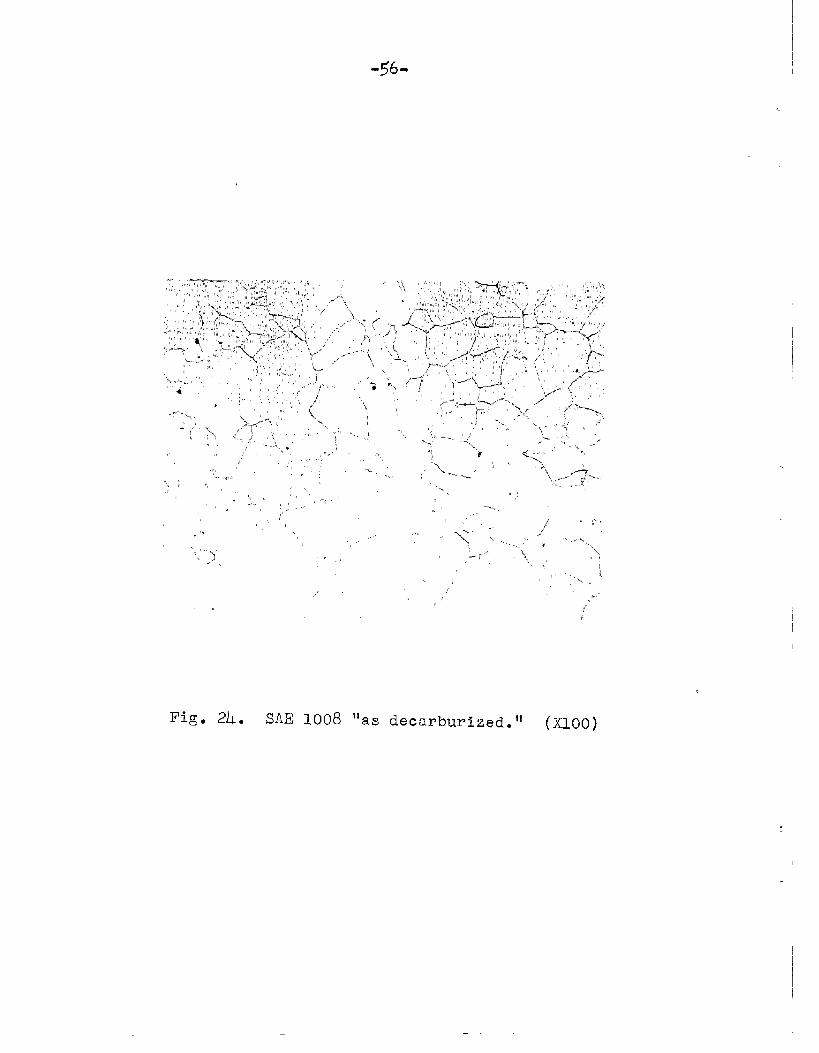
Fig. 24. SAE 1008 ‘lasdecarburi~ed.l~ (X.loo)
-57-
straining by marking with one inch gauge scratches. The
marking device is shown in Fig. 25. This tool was clamped
in the tool rest of a metal working lathe, and the speci-
men,placed between the centers. The jig was advanced until
it touched the gauge section? and the specimen rotated until
a scratch of about ten degrees of arc length was produced.
Very light pressure of the jig was used since the soft
material of the specimen was easily indented. The gauge
marks were one inch in length plus or miv.usa fraction.
‘Theaccuracy was not important since individual specinen.s
were measured before straining.
Straining was performed on the 2400-lb. range of a
Baldwin Southwark Universal Hydraulic Testing Machine. All
elongations were measured with a Gaertner optical cathetometer
having a sensitivity of + .00005 inch. This is greatly in
excess of that needed for such measurements. ‘Thefirst
series was strained from 2.0 to 4.0 per cent elongation.in
one inch, measured in the relaxed state, in increments of
0.2 per cent elongation. The series was then placed in the
annealing furnace and heated rapidly to 350°C under dry
hydrogen. Upon reaching 350@C, the program controller was
activated and a heating rate of 50F per hour was applied.
This heating rate was maintained until the bars reached
880”c at which temperature the furnace was maintained for
80 hours and then.allowed to furnace COOI to room temperature.

●
r-l0Es
I
$;I
I
I
- !59-
After removal from the growth anneal, the bars were
found.to have a coarse-grair.edsurface nade visible by
heat etching. They were then sectioned Iongitxdinally
through the mid-secticn~ polished through #000 metallc-
graphie paper and etched in 3% Nital. The complete series
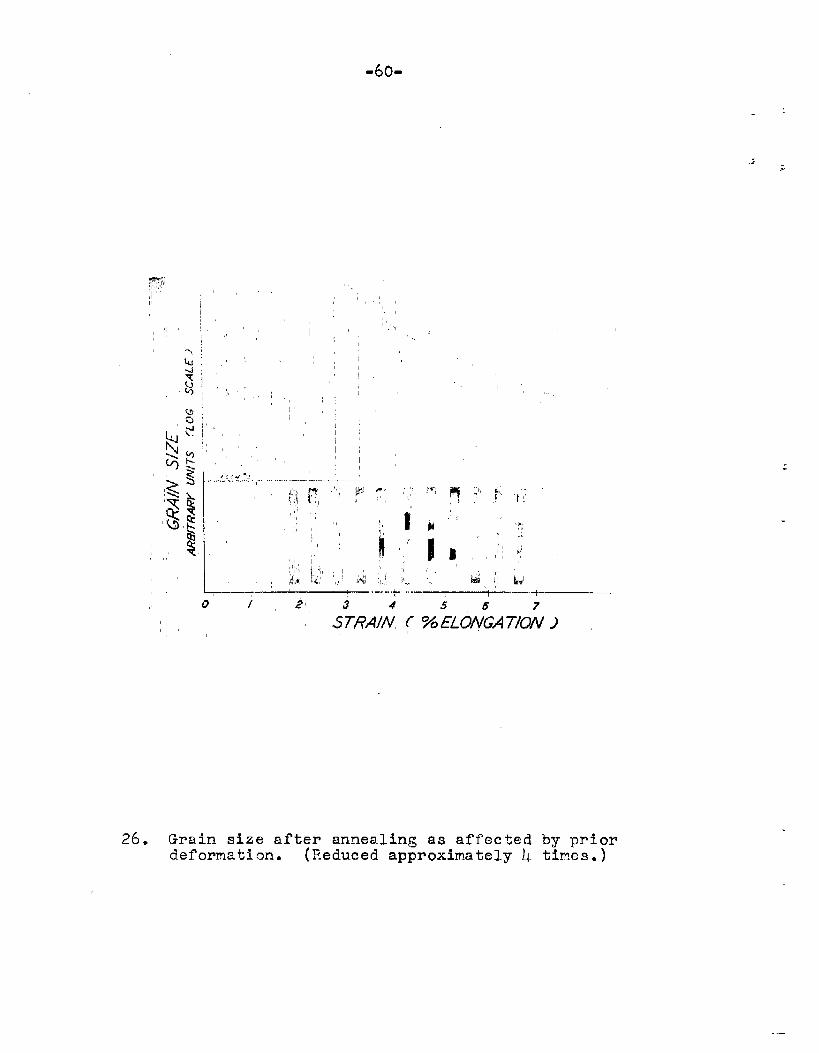
of specimens is khown superimposed on the theoretical
grain size--deformation plot of Fig. 26. It can be seer~
that the critical strain lies at 3.2% elcn~ation. The
dotted ~ineS indicate that this may be a ran~e as s~bse-
quent tests have indicated. The single crystal extended
throughout the gauge section and well up into the shoulders
where it was bounded on both ends by a fine grained
polycrystalllne aggregate. Tt was thought that this would
provide a single crystal which could be tested under con-
ditions where the influence of the gri~s would be at a
minimum.
The 3.L~ s~~ah was used for all subsequent series
yielding about 50Z usable single crystals. Late~ experi-
mmts on specimens of a one-inch gauge length gave yields
of 95% single crystals. This indicated rather conclusively
that the yield depended upon the length to which the crystals
were required to grow. All spec~mens whfch were not single
CTJ~Sta~swere bi- er tri-crystals with their boundaries
very nearly perpendicular to the sp~cime.naxis.
-60-
pyvj’ ,,,,’
1’ ~’/,,!“!,,,;, ,,
,!, : 1 ,,,,,
G3o
,i’
!,
,,,,,
,,”
:,’‘1 .’~1,, ‘1,1 s..
,,,,’~! 11,
,,
1,’:! “;[
g,, ,1i’,,’
1’, < 1,,.,1’” 1,,
I.%.:::!:, -L--.;.-...:
26. Grain size after annealing as affected by priordeformation. (Reduced approximately 4 times.)
-61-
Needless to say?
ElectropolishinZ
the cutting in half of a specimen to
inquire of its llsiriglecrystalness1’ruins it for test purposese
The technique of electropolishing seemed to lend itself
admirably both to the removal of the fine grained,surface
layer and to preparation of the surface for X-ray and
metallographic examination.
Although electropolishing
use, it is to be regarded more
llhatproduced good results for
for another. Tt was therefore
procedure for the decarburized
tion, and it will be described
has become widespread in its
as an art than a science.
one produced disastrous results
found necessary to develop a
steel used in this investiga-
in detail. There are many
hundreds of references to electropolishing techniques but
none will be cited here. Any of the papers by Jacques
serve as references to particular electropolishing procedures?
as he has devoted his life to such studies. The following
information may be regarded as a successful alloy of hearsay
and experience:
For iron, the three electrolytes that have received most
usage are perchloric acid-acetic anhydride, perchloric acid-
ethyl alcohol, and chromic acid-ortho phosphoric acid. The
perchloric acid is best for metallographic specimens where
a uniform circulation of electrolyte across a comparatively
small surface Is possible. However, to polish the entire
-62-
II
I
gauge section of a cylindrical tensile specimen, the control
of agitation necessary to prevent pitting and chalking is
quite impossible. For this reason, the perchloric mixtures
were discounted.
Various mixtures of chromic and orthophosphoric acids
were investigated including those with additions of a few
per cent of sulfuric acid.. The composition which gave the
best results was 10 per cent of dry chromic acid and 90 per
centl by weight, of orthophosphoric acid (85Z strong). The
sulfuric acid produced no visible benefits and was therefore
omitted.
When a curve of voltage versus current is plotted for
most electrolytes, a leveling off or plateau is found whe~e~
over a small range, an increase in current produces no
change in voltage. The current values corresponding to
this plateau are the ones chosen for polishj.ng. NO such
effects were found for the electrolyte used in this work.
Consequently, the method of trial and error was used until
the correct value of 10 amperes per square inch was found
to give the optimum results. The resulting voltage drop
which depends on the cathode to anode distance was about
25 vOltso
Most proponents of the chromic-orthophosphoricelectrolyte
suggest heating the bath to 70-80@c. In this work, it was
found better to cool the bath so that the temperature was
—
I
I
-- I
I
-63-
never greater than room temperature. The large currents
needed for the relatively large surfacesl and the rather
low electrical conductivity of iron conti”ibuteto heating
of the specimen. This heat was conducted away as rapidly
as possible by a circulating water bath which surrounded the
electrolyte container. A high-speed stirrer was used to pre-
vent local overheating at the specimen-electrolyteinterface.
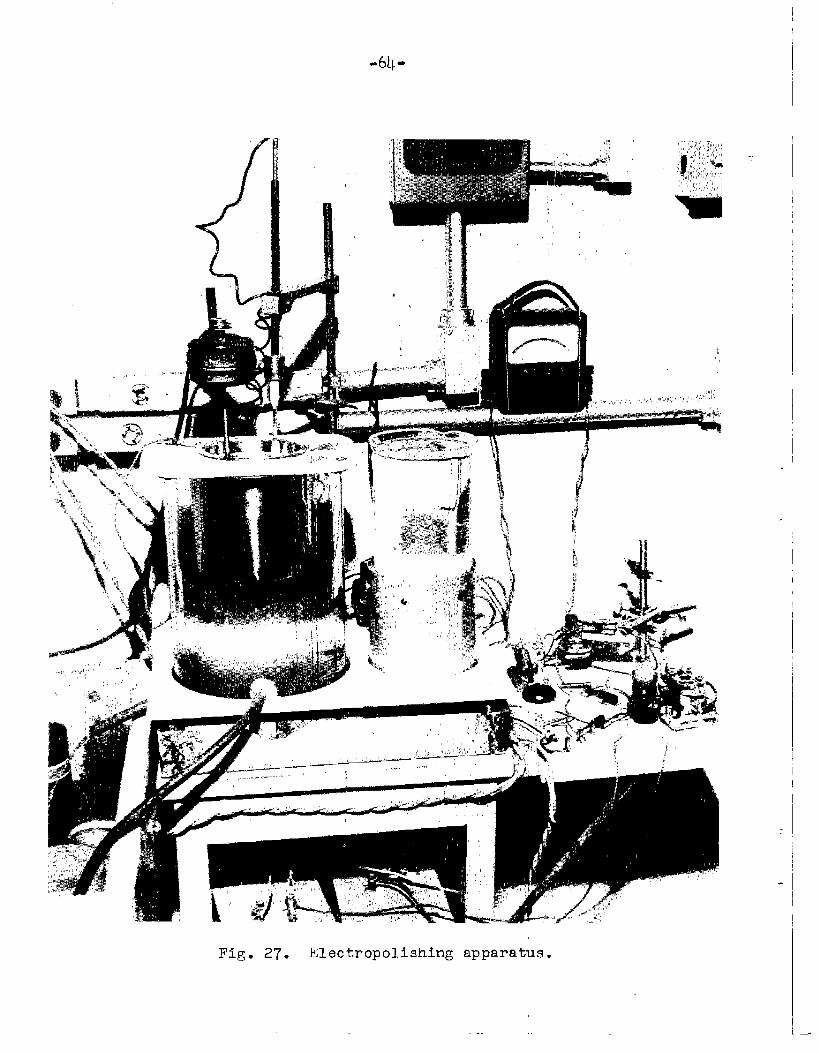
A photograph of the electropolishing apparatus is shown
In Fig. 27 and illustrates the relative position and size of
the various components. The throwing power--or perhaps bet-
ter, the throwing-off power--of this electrolyte is very
low. Thus a cathode of similar geometry to the surface being
polished must be used. In this apparatus, a stainless steel
beaker served both as a cathode and a container for the
electrolyte. A specimen can be seen mounted in its swiv-
eling bracket, ready for immersion into the polishing bath.
The ends of each specimen were protected from electrolytic
attack by a coating of Halowax (chlorinatedform) supplied
by the Fisher Scientific Company. This wax has a melting
point of 100~C and is easily peeled from the specimen after
polishing.
The cooling bath of circulating tap water anc~crushed
ice proved insufficient to conduct away the necessary amount
of heat. Overheating of the specimen accompanied by severe
pitting resulted. This could be stopped by turning off the
current f~r one minute out of every two, but s-richan arrangement
-.
-6k-
!
1
.- 1
I
Fig. 27. Electropolishingapparatus.
-65-
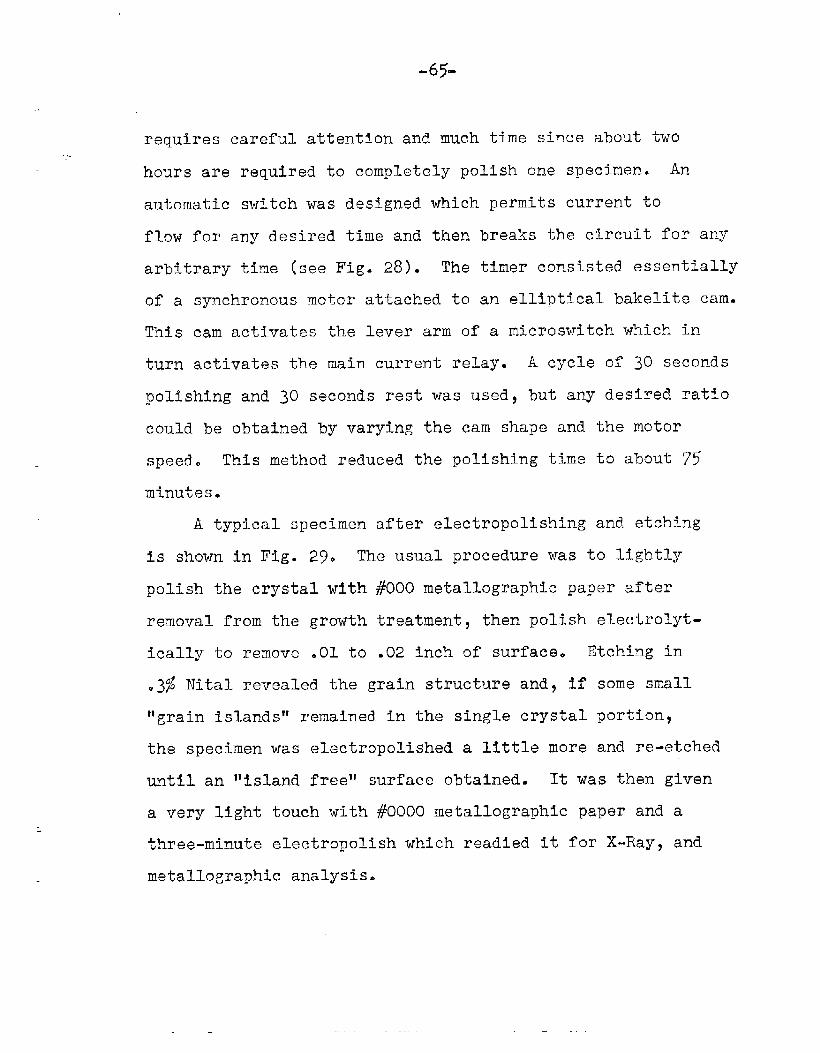
requires careful attention and much time since about two
hours are required to completely polish one specimen. An
automatic switch was designed which permits current to
flow for any desired time and then breaks the circuit for any
arbitrary time (see Fig. 28). The timer consisted.essentially
of a synchronous motor attached to an elliptical bakelite cam.
This cam activates the lever arm of a microswitch which in
turn activates the main current relay. A cycle of 30 Seconds
polishing and 30 seconds rest was used, but any desired ratio
could be obtained by varying the cam shape and the motor
speed. This method reduced the polishing time to about 75
minutes.
A typical specimen after electropolishing and etching
iS shown in Fig. 29* The usual procedure was to lightly
polish the crystal with #000 metallographic paper after
removal from the growth treatment, then polish electrolyt-
ically to remove .01 to .02 inch of surface. Etching in
03% Ni.talrevealed the grain structure andy if some small
“grain islands” remained in the single crystal portion$
the specimen was electropolished a little more and re-etched
until an ltfslandfreel~surface obtained. It was then given
a very light touch with #0000 metallographic paper and a
three-minute electropolish which readied it for X-Ray, and
metallographic analysis.
—
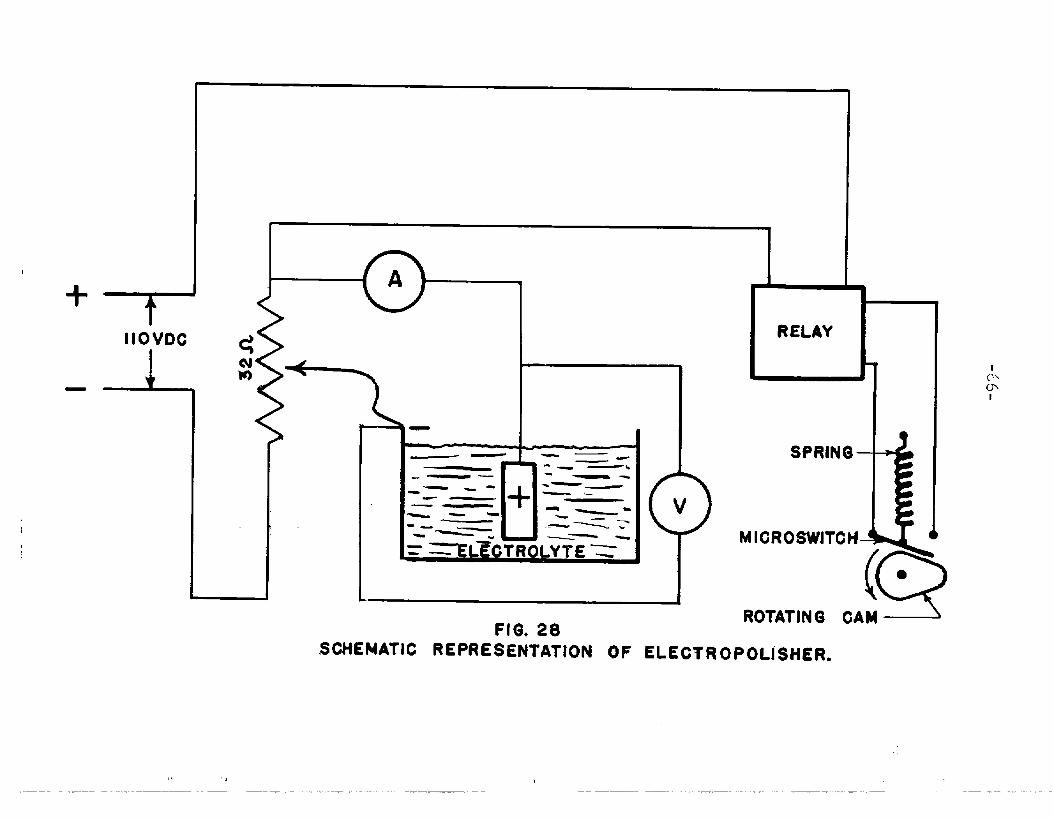
‘TIIOVDC
-_L-
1 1
-
——
—.-ti—
.— L+-—--.—~—-=amc~ll
— —--— —..— _-———.
-.~-.< -7_— -
LYTE =
FIG. 28
SPRING
MICROSWITC}
(!(2
•1
h
ROTATING CAM ~
SCHEMATIC REPRESENTATION OF ELECTROPOLISHER.
,, ,,..———.. .— .—...—.—
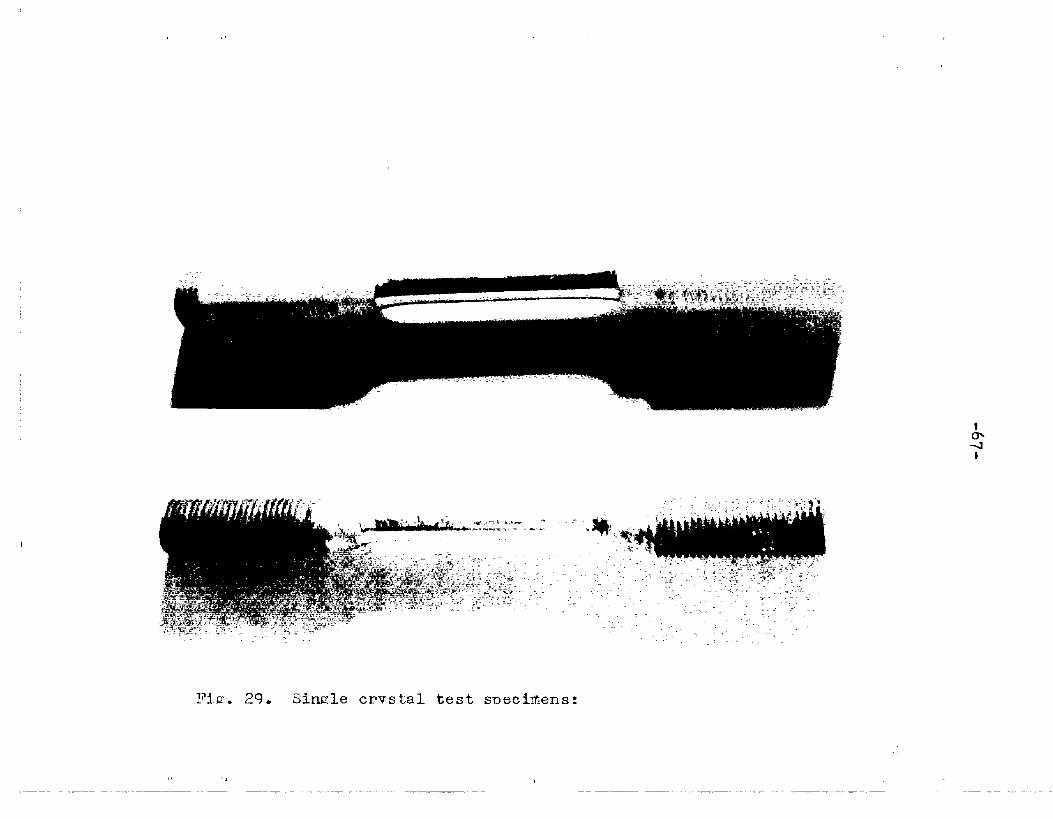
.. —.,
--- ‘..-.’”--- . .
. .:’ -- ~,- ,~..: .,=
. . . . . .. –,.,.:-! ,-.~.. g,;,,.., ‘.:’,.>, . .
,-,<. . . . ~.. -, .-,., .. ’.> .,, ,:. . ...’..>..-.,-,...-.-.,—:— .,>.=,-. \
.,, ,..-..-. ,’.
Fig. 29. Single crystal test specimens;above: after electropolishing showing waxed ends.below: wax removed and etched
-68-
1
I
X-Ray Determination ~ Crystal Orientation
The orientation of a single crystal or an individual
grain in an aggregate can be determined most c~nveniently
(1)and accurately 5~Tmeans of the back reflection Laue.method .
This technique, which was developed by Greninger(36)~ has been
summarized by Barrett‘1) and described in detail by 0pinsky(37).
There are essentially four steps in the determination of
the angle between any crystallographic direction and a given
geometric direction in a specfrnen. They are: ~
(1)
(2)
(3)
(4)
To take a back-reflection Laue pattern of the specimen;
To plot on a Wulff net, with the aid of the Standard
Greninger chart, the stereographic projections of the
specimen axis and the zone axes responsible for all
the prominent hyperbola on the X-Ray pattern;
To draw all the great circles which ark 90° away from
the projections of the zone axes and examine them for
the basic stereographic unit triangle, the vertices
of which give the positions of the [100} , {110~ ,
and {111~ projections;
For complete indexing of all the intersecting points
of the great circles, change the stereographic pro-
jection of step 3, by rotation, into one of the
@OO-} , ~110] , or [111]. BYthree standard forms, ~ -
comparison of the pattern with the corresponding
known standard pattern, these indices can be determined.
I
I
I
(
.- ,_
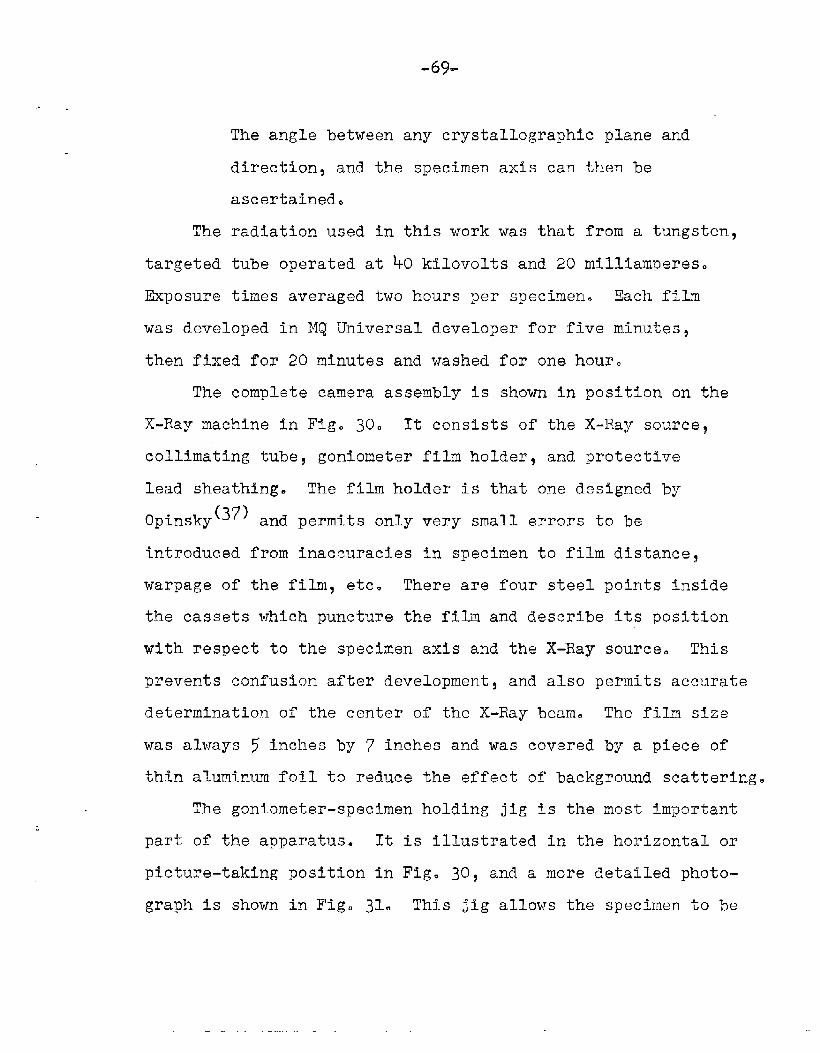
-69-
.. .
The angle between any crystallographic plane and
direction, and the specimen axis can then be
ascertained.
The radiation used in this work was that from a tungsten,
targeted tube operated at 40 kilovolts and 20 milliamperes.
Exposure times averaged two hours per specimen. Each film
was developed in MQ Universal developer for f~ve min’~tes,
then fixed for 20 mtnutes and washed for one hour.
The complete camera assembly is shown in position on the
X-Ray machine in Fig. 30. It consists of the X-l<aysource$
collimating tube, goniometer film holder, and protective
lead sheathing. The film holder is that one designed by
{Opinsky 37) and permits only very small errors to be
introduced from inaccuracies in specimen to film distances
warpage of the film, etc. There are four steel points inside
the cassets which puncture the film and describe its position
with respect to the specimen axis and the X-Ray source. This
prevents confusion after development, and also permits accurate
determination of the center of the X-Ray beam. The film size
was always ~ inches by 7 Inches and was covered by a piece of
thin aluminum foil to reduce the effect of background scattering.
The gonforneter-specimenholding jig is the most important
part of the apparatus. It is illustrated in the horizontal or
picture-taking position in Fig. 30, and a more detailed photo-
graph is shown in Fig. 31. This jig allows the specinen to be
—
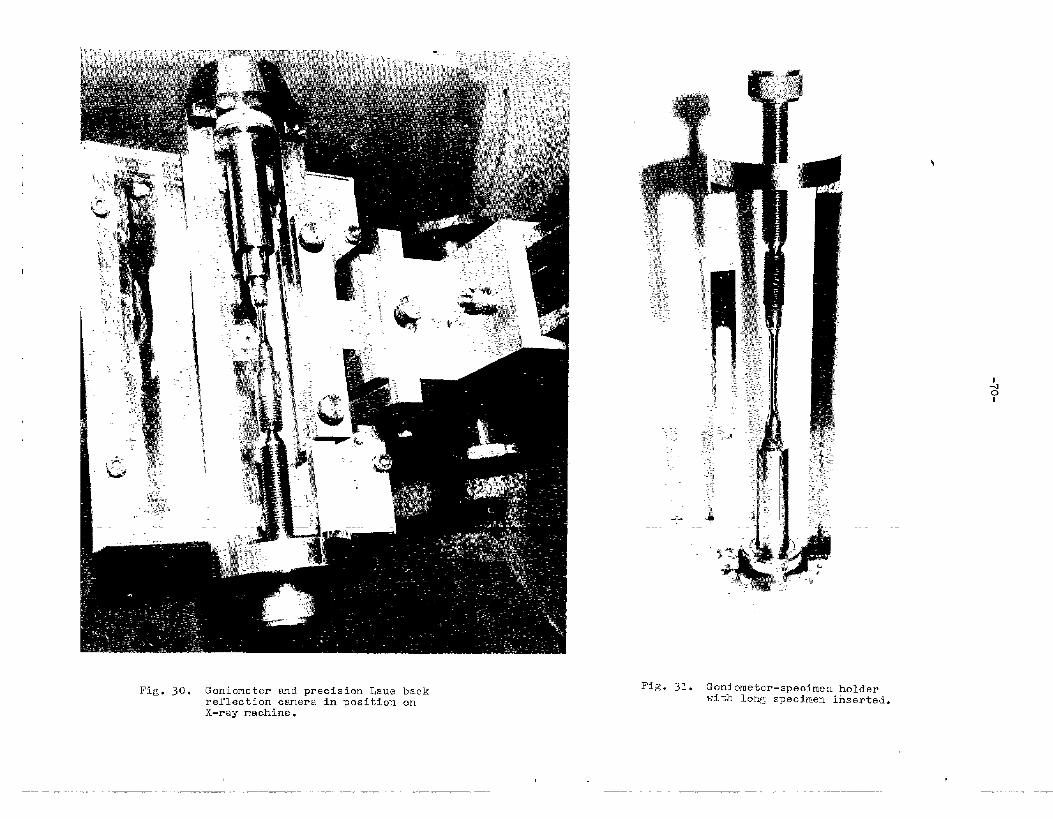
Fig. 30. ,>oniometerandprecision Laue backreflection camera in position onX-ray machine.
—— —.
Fig.31. Goniometer-specimex holderwith lon~ specir:en inserted.
.. —
i
.,

.71.
moved horizontally or vertically in the X-Ray machine as
well as to be rotated about its longitudinal axis. The
exact position of the specimen for each X-Ray exposure
was determined by noting the readings on th@ ho~izonta~!
vertical, and rotational stalest hence the same point on
the specimen could be reached by duplicating these
readings.
The stereographic projections were always rotated
to bring the spectinenaxis into the stereographic unit
triangle of a @OO~ standard projection bounded by the
planes (001)5 (011) and (~11). Sometimes two rotations
were necessary to do this. If the specimens were of
such an orientation that this was very complicated, the
opposite end of the specimen designated as F~ was rotated
into the unit triangle with vertices (001)~ (Oil)? and
(111). A typical standard projection showing the speci-
men axis as F is illustrated in Fig. 32.
Determination of the Glide Planes—— ——
and Fracture Surfaces ~ Optical Trace Methods
An experimental study of the planes of deformation in
a crystal lattice requires a method of detecting the orienta-
tion of the deformation.marking on the specimen surface and
then transla”kingthese data to the orientation of the crystal
lattic~e tdhenthe crystal orientation, the slip (or twin)
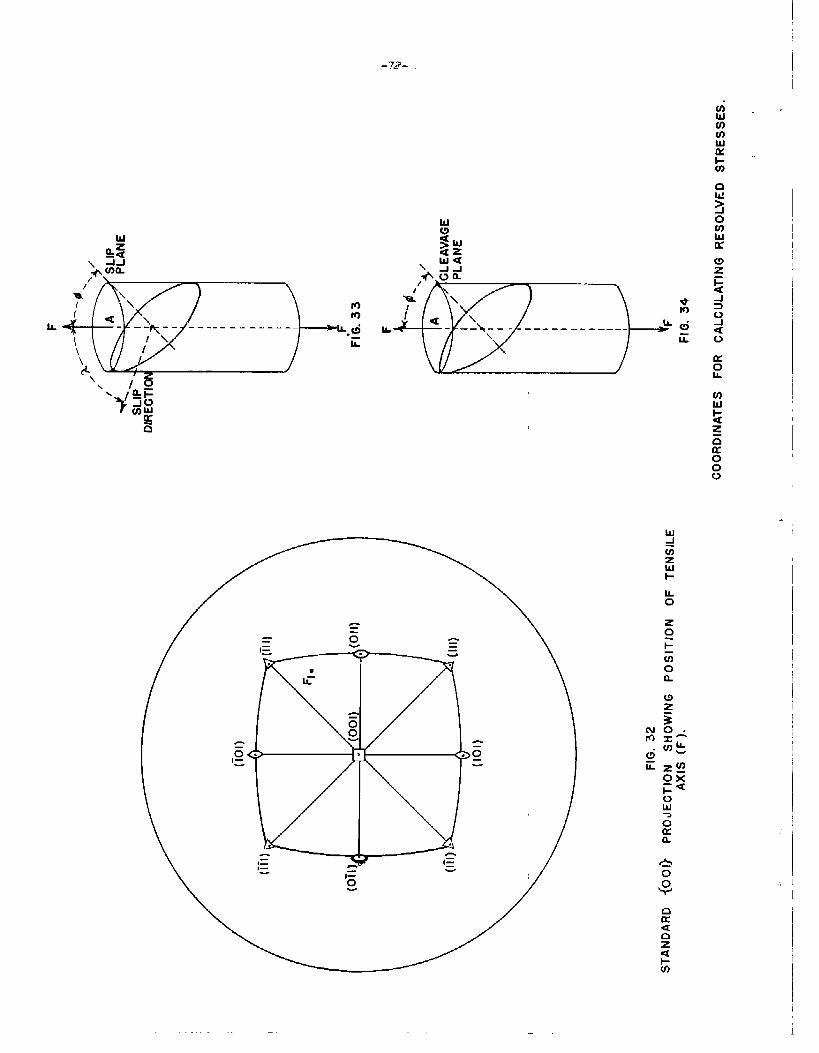
-72-
tl . ..
U-Jm
IL0
m0CL
0“.. ,
—
,.
-73-
direction and the slip (or twin) plane are known, the resalved
shear stress for slip (or twinning), Sshear can be calculated
from the equation:
sRF
shear I Cos d CoS)- (tSeeFig. 33)
where F = applied force along the stress axis
A = cross sectional area of the specimen
6 = angle between
plane and the
1 = angle between
the normal to the slip (or twin)
stress axis
the stress axis and the slip (or
twin) direction.
Also, the resolved normal stress for cleavage, N(cleavage)$
can be calculated from the equation:
N = ; COS2 6 (See Fig. 34)cleavage
where the terms are defined as above. The values of $ and A
therefore must be evaluated from the stereographic projections.
The various pros and cons of square specimens instead of
cylindrical ones were studied. The square specimen has the
advantage of having flat surfaces which are easily focused
on the microscope. However, the angles between the faces of
the specimen must be accurately known. Also, since the ability
to see the slip lines,depends on the direction of slip? the
ability to see the trace of the glide plane when it coincided
with one edge of the specimen would be severely lessened. For
these reasons? and many others, the choice of cylindrical
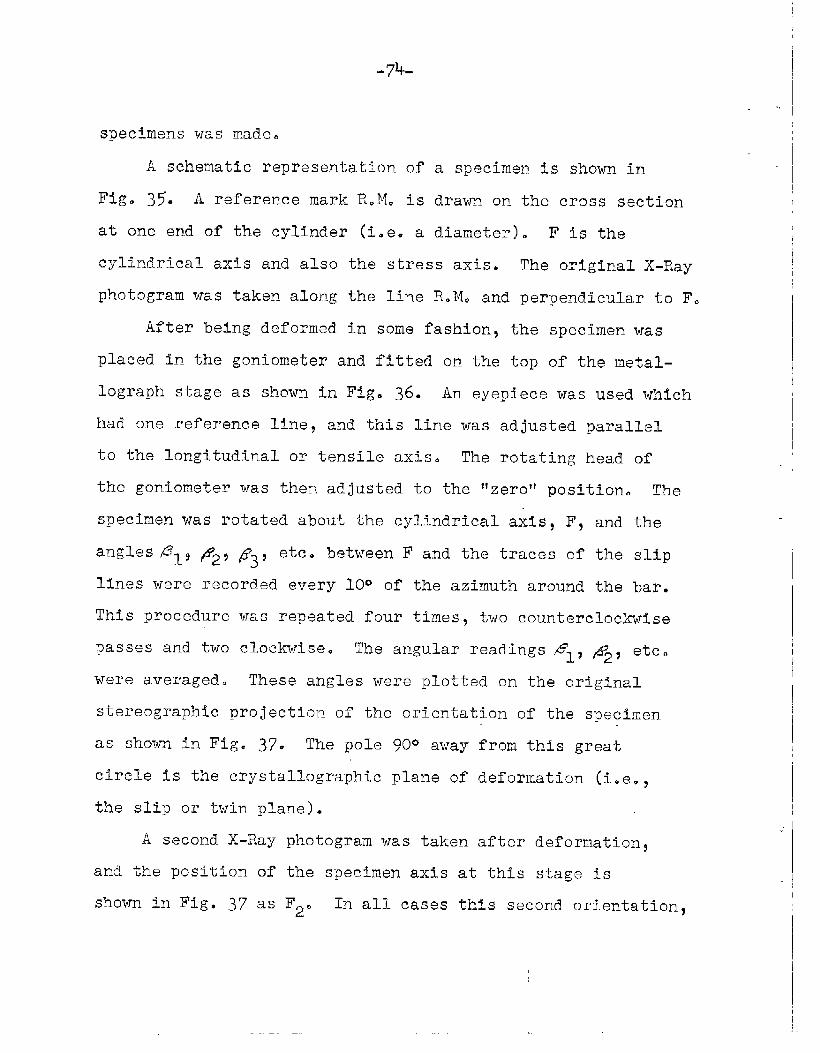
-7’4-1
., I
specimens was made.
A schematic representation of a specimen is shown in
Fig. 35. A reference mark R.M. is drawn on the cross section
at one end of the cylinder (i.e. a diameter). F is the
cylindrical axis and also ‘thestress axis. The original X-Ray
photogram was taken along the line R.M. and perpendicular to F.
After being deformed in some fashion, the specimen was
placed in the goniometer and fitted on the top of the rnetal-
Iograph stage as shown in Fig. 36. An.eyepiece was used which
had one reference line, and this line was adjusted parallel
to the longitudinal or tensile axis. The rotatin~ head of
the goniometer was then,adjusted to the ~fzero’~position. The
specimen was rotated about the cylindrical axis, F, and the
angles~lt @9 /53? etc. between F and the traces of the slip
lines were recorded ev~ry 10~ of the azimuth around the bar.
This procedure was repeated four timesa two counterclockwise
passes and two cloclrwise. The angular readings AP1~&2a etc.
were averaged. These angles were plotted on the original
stereographic projection of the orientation of the specimen
as shown in Fig. 37. The pole 90° away from this great
circle is the crystallographic plane of deformation (i.e.~
the slip or twin plane).
A second X-Ray photogram was taken after deformation
and the positton of the specimen axis
shown in.Fig. 37 as F .2 In all cases
at this stage is
this second orientation,
..
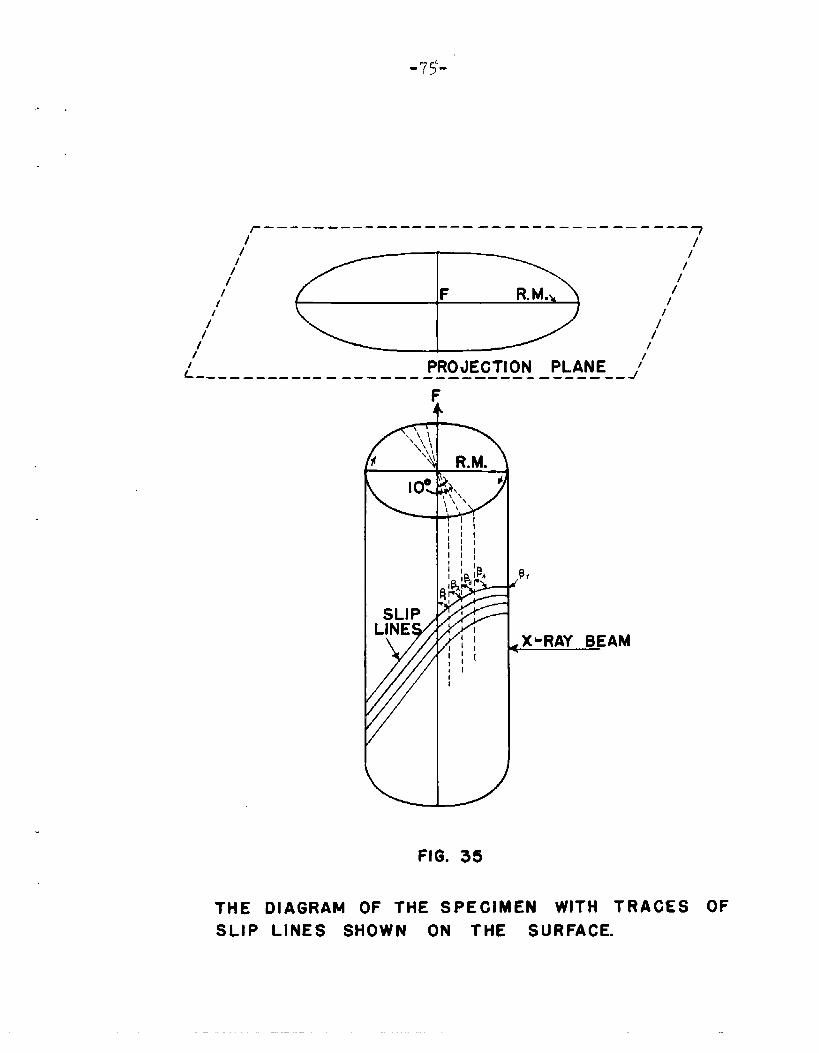
,.
r -—//
/’/’I
/’/
1
.—— - .—. —.--— ———— ---- --—— --—- --—7/
//
/1///’/
PROJECTION PLANE ‘L-_____, ____________ ________________J’
oc
SLIP
y
LINE
,%
~XkRAY BEAM
FIG. 35
THE DIAGRAM OF THE SPECIMEN WITH TRACES OFSLIP LINES SHOWN ON THE SURFACE.
—
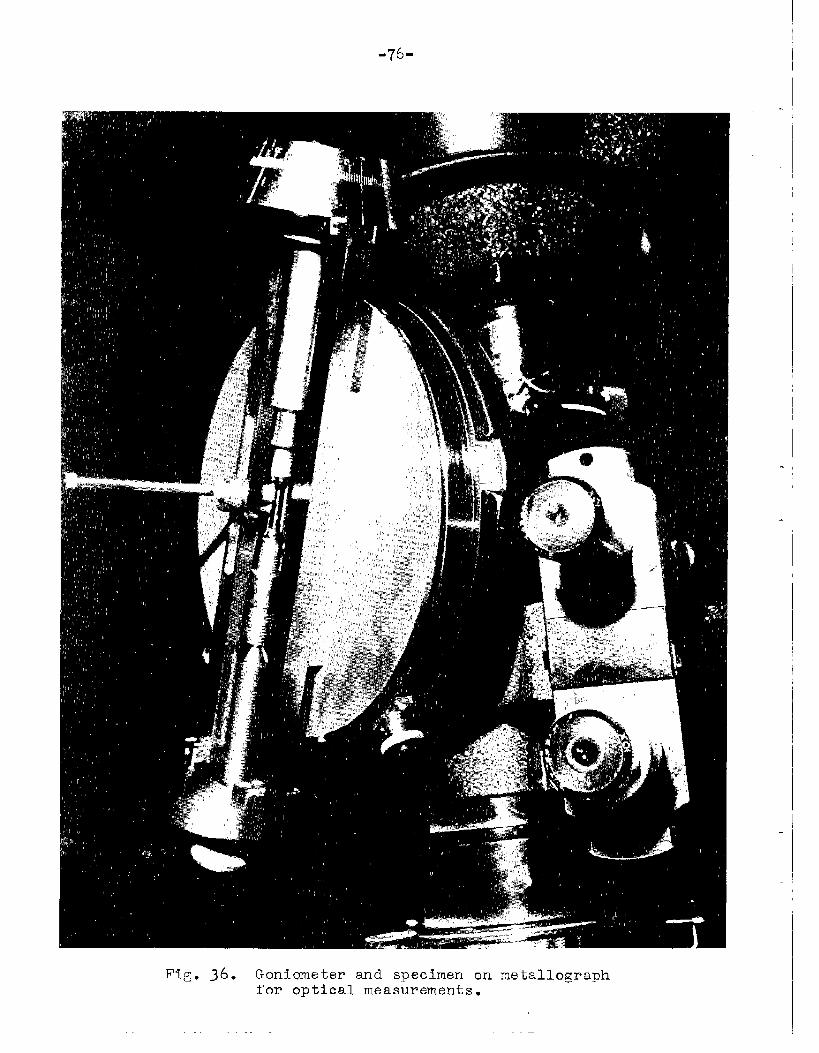
-76-
!I
I
Fig. 36. Goniometerand specimenon metallographfor opticalmeasurements.
.—
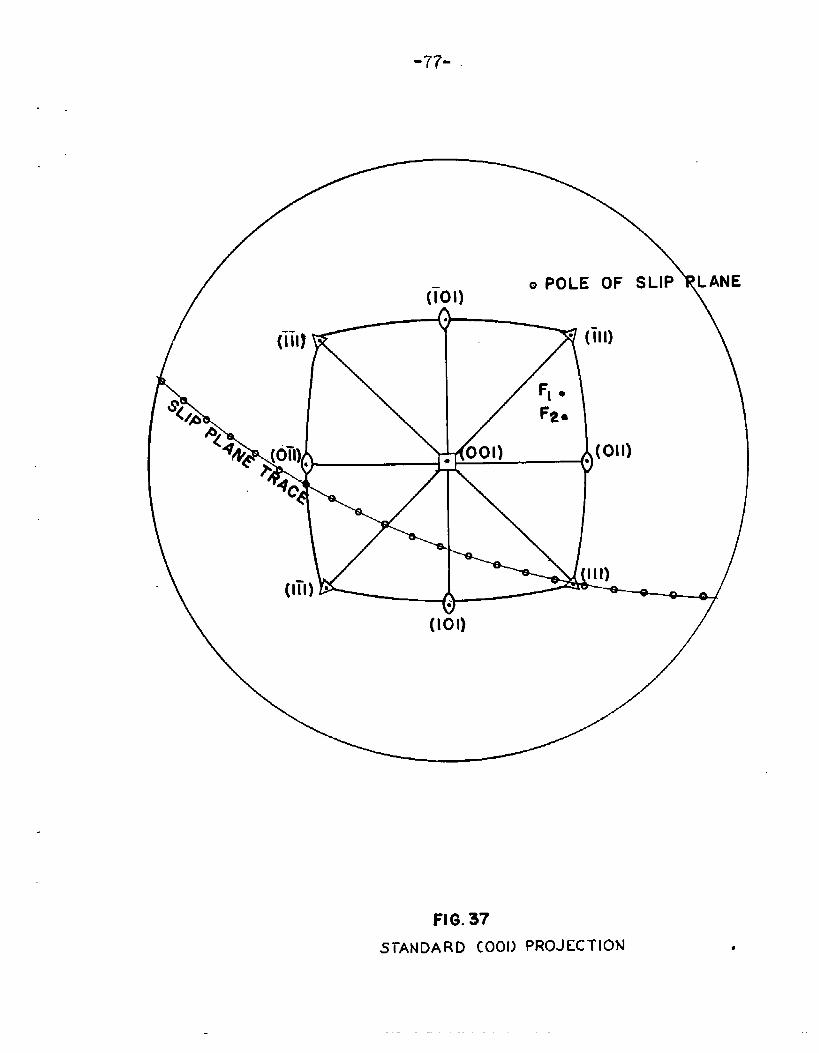
“77”
FIG. 37
STANDARD COOI) PROJECTION
-.
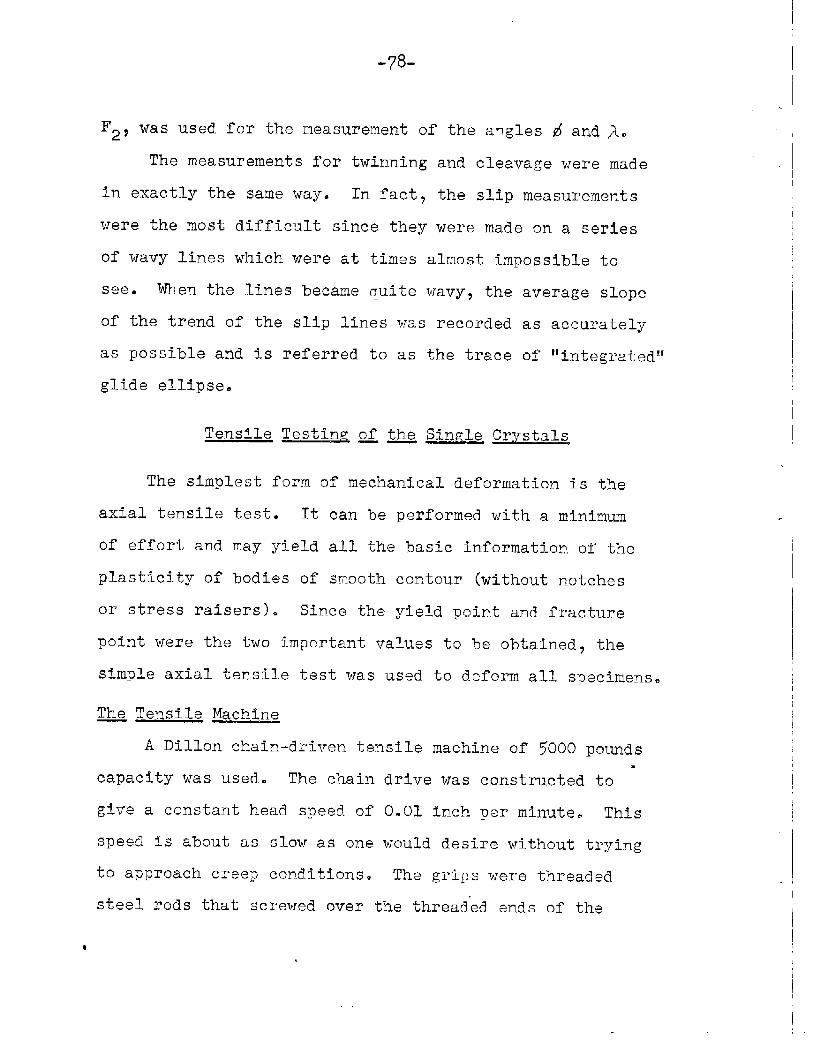
-78-
i
I
F2 $ was used for the measurement,of the angles A and ~.
The measurements for twinning and cleavage were made
in exactly the same way. In fact, the slip measurements
were the most difficult since they were made on a series
of wavy lines which were at times almost impossible to
see. When the lines became guite wavy, the average slope
of the trend of the slip lines was recorded as accurately
as possible and is referred to as the trace of “i.n.tegratedUt
glide ellipse.
Tensile Testin~ of the Sin~le Crystals——
The simplest form of mechanical deformation is the
axial tensile test. It can be performed with a minimum
of effort and may yield all the basic information.of the
plasticity of bodies of smooth contour (without notches
or stress raisers). Since the yield point and f~acture
point were the two important values to be obtalnedt the
simple axial tensile test was used to deform all specimens.
Tensile Machine
A Dillon chain-driven tensile machine of 5000 pounds
capacity was used. The chain drive was constructed to
give a constant head speed of 0.02 inch per minute. This
speed Is about as slow as one would desire without trying
to approach creep conditions. The grips were threaded
steel rods that screwed ove~ the thread”edends of the
*.
I
I
I
I
I
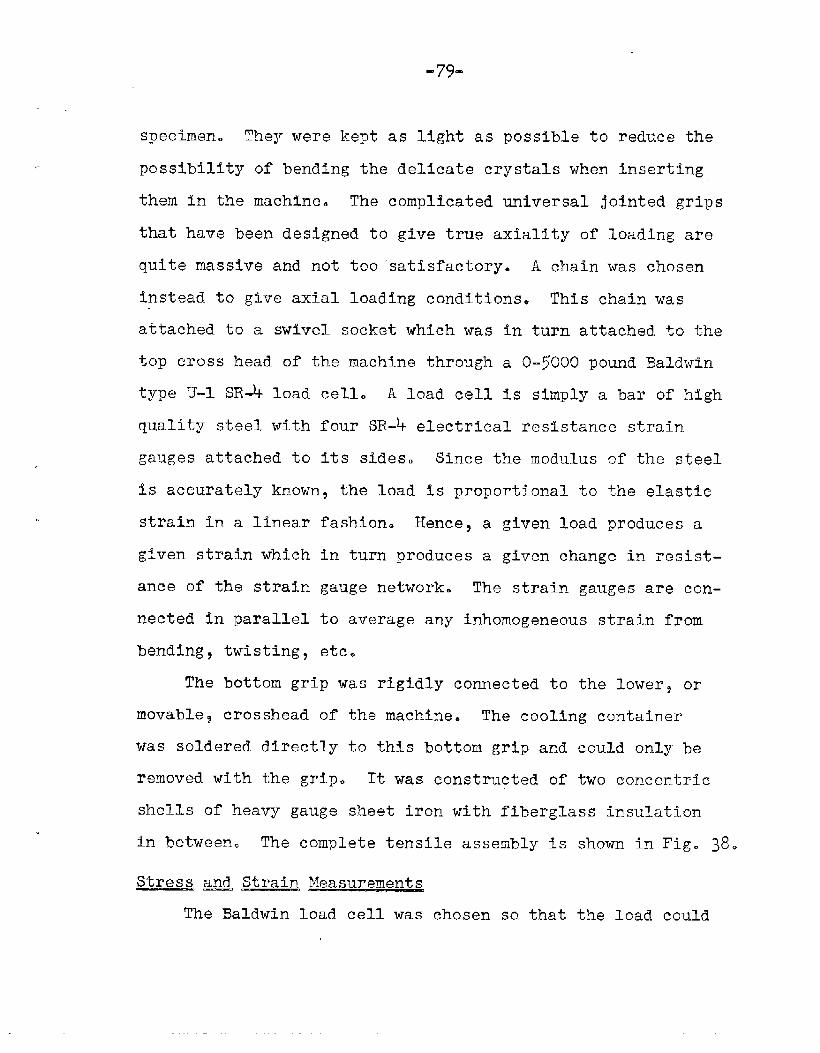
-79”
specimen. They were kept as light as possible to reduce the
possibility of bending the delicate crystals when inserting
them in the machine. The complicated universal jointed grips
that have been designed to give true axiality of loading are
quite massive and not too ’satisfactory. A chain was chosen
instead to give axial loading conditions. This chain was
attached to a swivel socket which was in turn attached,tc the
top cross head of the machine through a 0-5000 pound Baldwin
type u-1 Sfi-k load cell. A load ceil is simply a bar of high
quality steel with four SR-4 electrical resistance strain
gauges attached to its sides. Since the modulus of the steel
is accurately known9 the load is proportional to the elastic
strain in a linear
given strain which
ante of the strain
netted in parallel
bending? twisting,
fashion. Hence, a given load produces a
in turn produces a given change in resist-
gauge network- The strain gauges are con-
to average any inhomogeneous strain from
etc.
The bottom grip was rigidly connected to the lowert or
movable? crosshead of the machine. The cooling container
was soldered directly to this bottom grip and could only be
removed with the grip. It was constructed of two concentric
sheTls of heavy gauge sheet iron with fiberglass insulation
in between. The complete tensile assembly is shown in Fig. 380
Stress and Strain Measurements—— —
The Baldwin load cell was chosen so that the load could
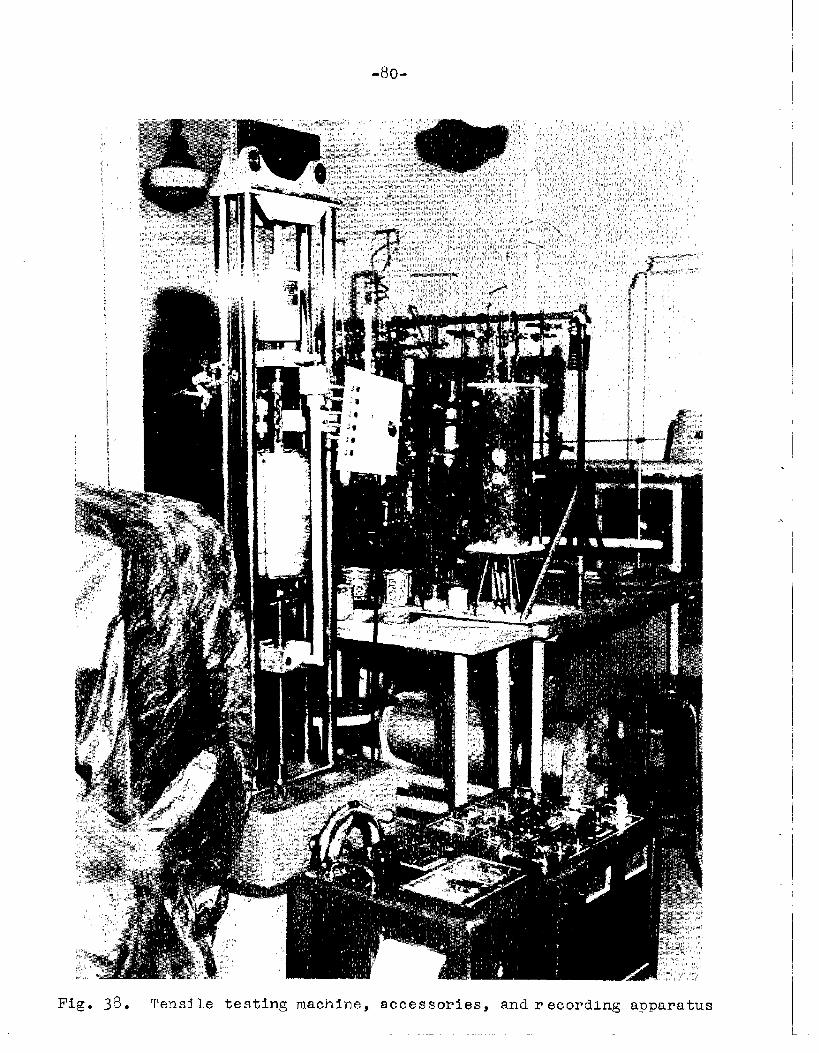
I
Fig. 38. Tensile testingmachine, accessories,and recording apparatus
-—
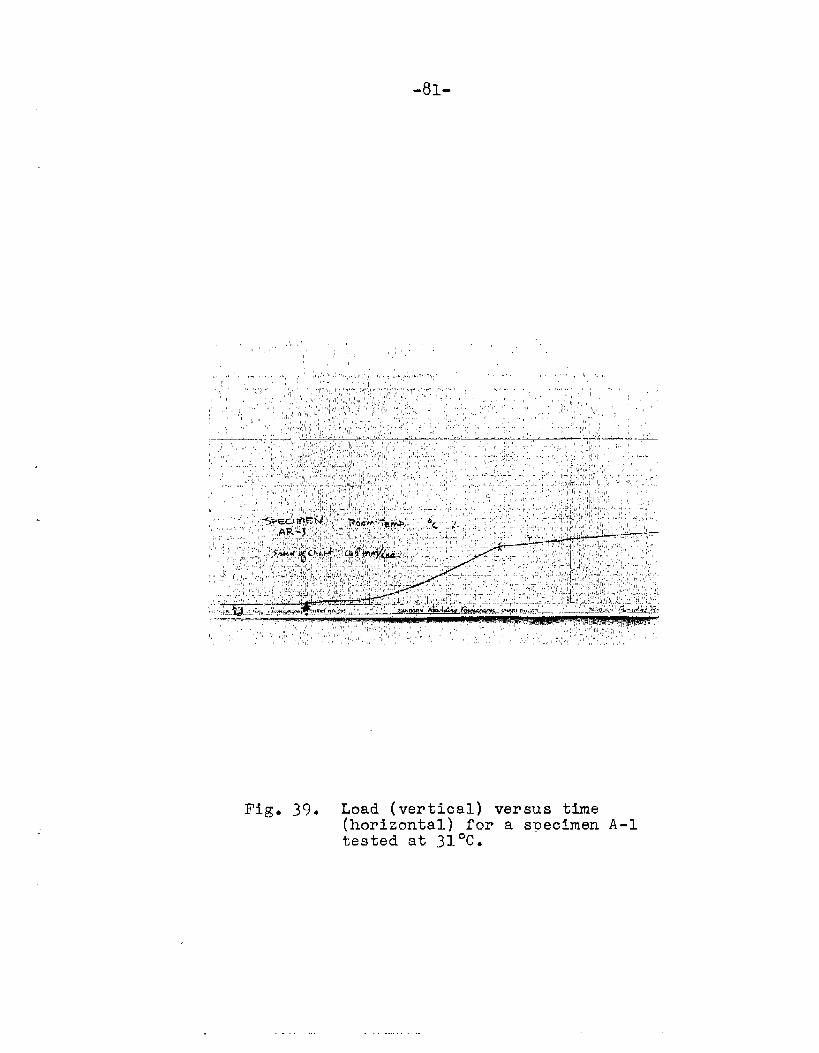
“,, ’,, !“ ,,” .1, ,, ,, ,”’
,,’ ,,
Fig. 39* Load (vertical) versus time(horizontal) for a specimen A-1tested at 31°C.
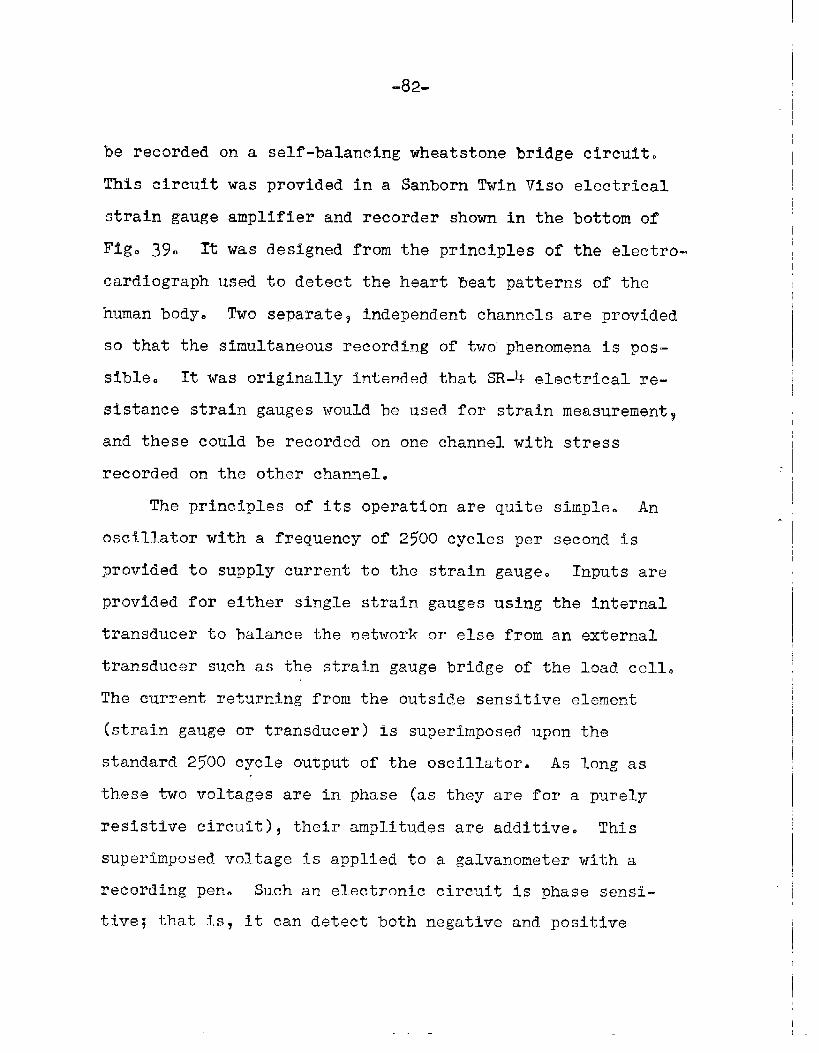
I
I-82-
be recorded on a self-balancingwhetstone bridge circuit.
This circuit
strain gauge
Fig. 390 It
was provided in a Sanborn Twin Vfso electrical
amplifier and recorder shown in the bottom of
was designed from the principles of the electro-
cardiograph used to detect the heart beat patterns of the
human body. Two separate~ independent channels are provided
so that the simultaneous recording of two”phenomena is pos-
sible. Tt was originally intended that SR-4 electrical re-
sistance strain gauges would be used for strain measurealent~
and these could be recorded on one channel with stress
recorded on the other channel.
The principles of its operation are quite simple. An
oscillator with a frequency of 2500 cycles per second is
provided to supply current to the strain gauge. Tnputs are
provided for either single strain gauges using the internal
transducer to balance the network or else from an external
transducer such as the strain gauge bridge of the load cell.
The current returning from the outside sensitive ~lement
(strain gauge or transducer) is sup~rimposed upon the
standard 2500 cycle output of the oscillator. As long as
these two voltages are in phase (as they are for a purely
resistive circuit), their amplitudes are additive, This
superimposed voltage is applied to a galvanometerswith a
recording pen. Such an electronic circuit is phase sensi-
tive; that is, it can detect both negative and positive
I
I
!
I
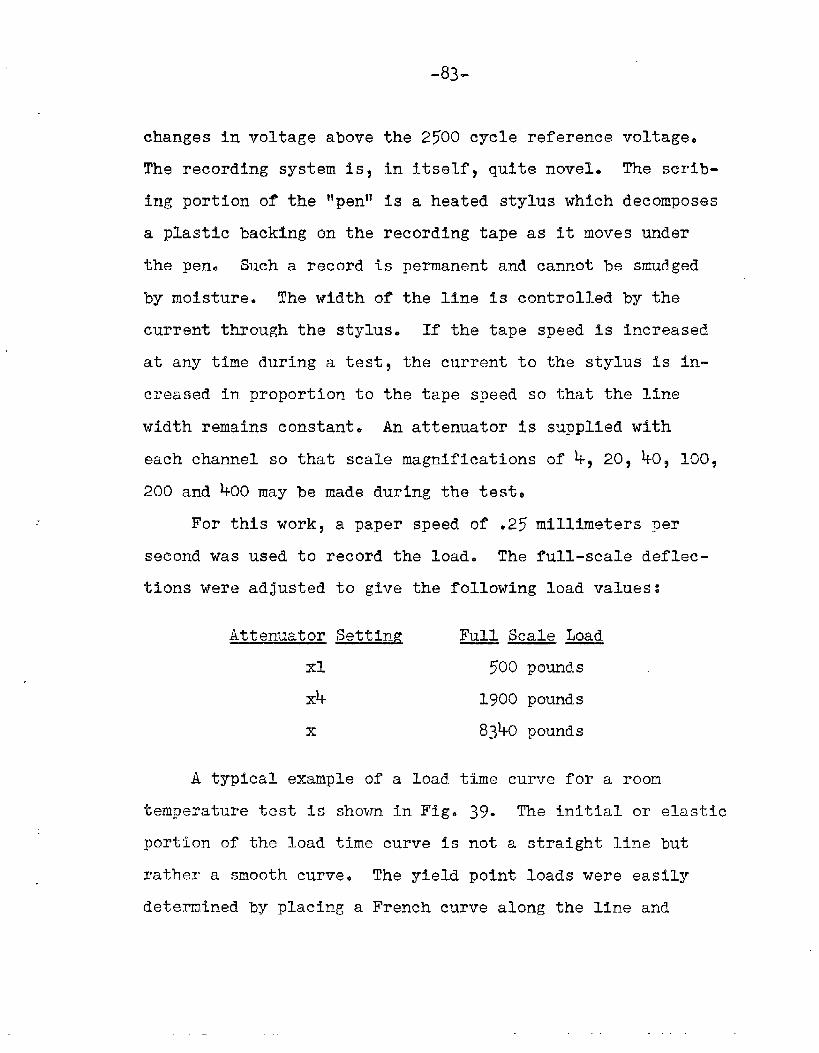
-83-
changes in voltage above the 2500 cycle reference voltage.
The recording system is, in itself, quite novel. The scrib-
ing portion of the ‘~pentlis a heated stylus which decomposes
a plastic backing on the recording tape as it moves under
the pen. Such a record is permanent and cannot be smudged
by moisture. The width of the llne fs controlled by the
current through the stylus. If the tape speed is Increased
at any time during a test, the current to the stylus is in-
creased in proportion to the tape speed so that the line
width remains constant. An attenuator is supplied with
each channel so that scale magnifications of k, 20, 40a 100$
200 and \OO may be made during the test.
For this work, a paper speed of’.25 millimeters per
second was used to record the load. The full-scale deflec-
tions were adjusted to give the following load values:
Attenuator Settln~ Full Scale Load—— —
xl 500 pounds
Xh 1900 pounds
x 83~1-opounds
A typical example of a load time curve for a room
~emperature test iS shown In Fig. 39. The initial or elastic
portion of the Toad time curve is not a straight line but
rather a smooth curve. The yield point loads were easily
determined by placing a French curve along the line and
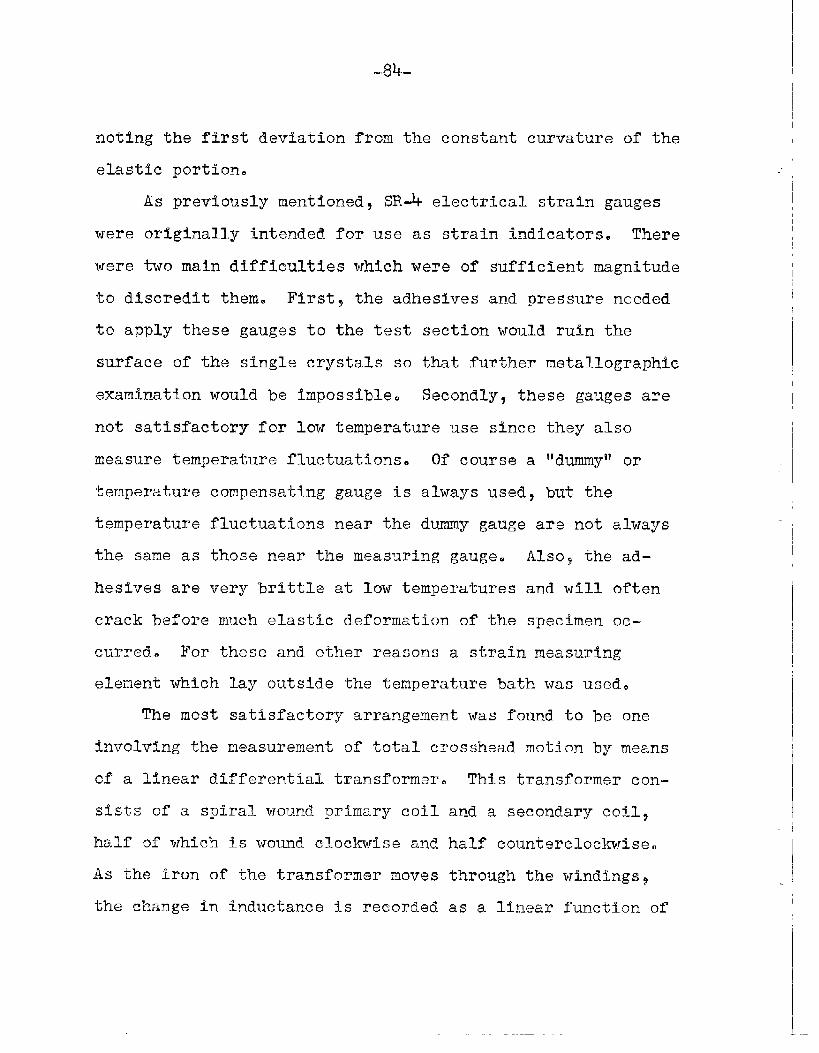
-84--
noting the first deviation from the constant curvature of the
elastic portion.
As previously mentioned~ SR-4 electrical strain gauges
were originally intended for use as strain indicators, There
were two main difficulties which were of sufftcfent magnitude
to discredit them. First$ the adhesives and pressure needed
to apply these gauges to the test section would ruin the
surface of the single crystals so that further metallographic
examination would be impossible. $econdly~ these gauges are
not satisfactory for low temperature use since they also
measure temperature fluctuations. Of course a ‘ldummy~lor
temperature compensating gauge is always used? but the
temperature fluctuations near the dummy gauge are not always
the same as those near the measuring gauge. Alsoj the ad-
hesives are very brittle at low temperatures and wfll often
crack before much elastic deformation of the specimen oc-
curred. For these and other reasons a strain measuring
element which lay outside the temperature bath was used.
The most satisfactory arrangement was found to be one
involving the measurement of total crosshead motion by means
of a linear differential transformer. This transformer con-
sists of a spiral wound primary coil and a secondary coil,
half of which is wound clockwise and half counterclockwise.
As the iron of the transformer moves through the windings$
the change in inductance is recorded as a linear function of
I
I
I
1. .-
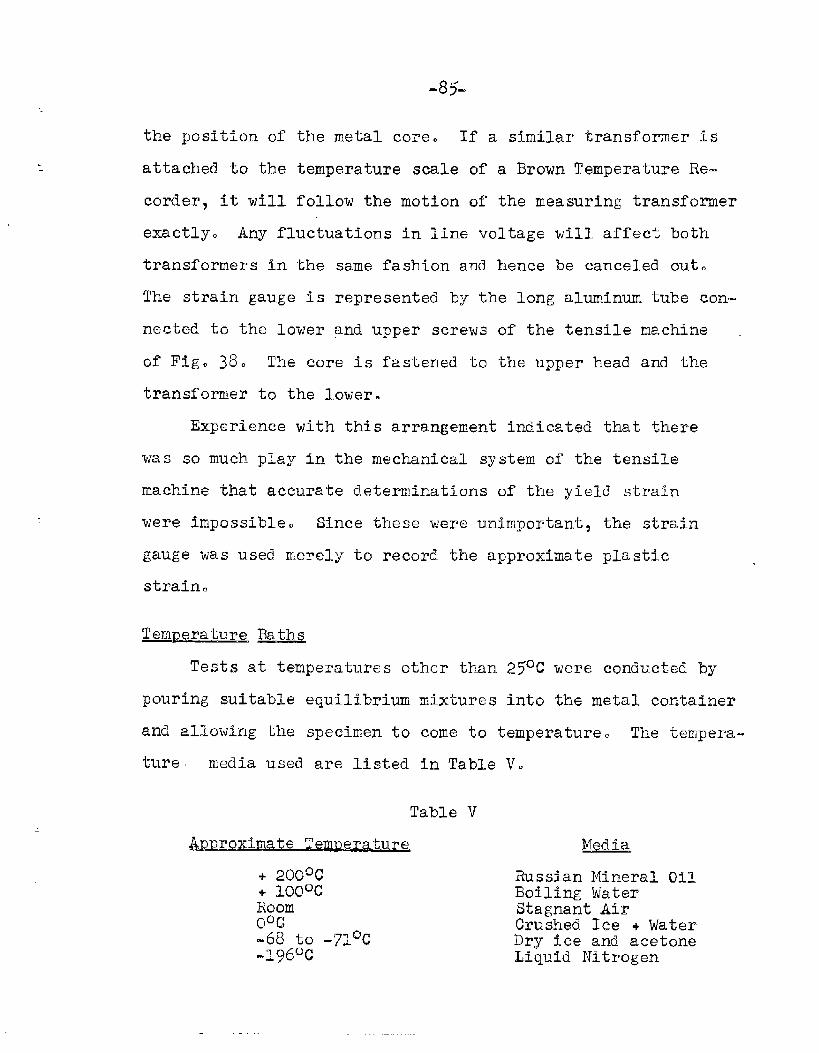
-85-
the position of the metal core. If a similar transformer is
attached to the temperature scale of a Brown Temperature Re-
corder, it will follow the motion of the measuring transformer
exactly. Any fluctuations in line voltage will affect both
transformers in the
The strain gauge is
netted to the lower
same fashion and hence be canceled out.
represented by the long aluminum tube con-
and upper screws of the tensile machine
of Fig. 33. The core is fastened to the upper head and the
transformer to the lower.
Experience with this arrangement Indicated that there
was so much play in the mechanical system of the tensile
machine that accurate determinations of the yield strain
were impossible. Since these were unimportant?
gauge was used merely to record the approximate
strain.
TemDeratL~reBaths
Tests at temperatures other than 25°C were
the strain
plastic
conducted by
pouring suitable equilibrium
and allowing the specimen to
ture media used are listed
mixtures into the metal container
come to temperature. The tempera-
in Table V.
Table V
A~~roximate Temperature
+ 2oow#+ m(pcRoomo~c-68 to -71QC-196°C
Media
Russian Mineral 011Boiling MaterStagnant AirCrushed Ice + WaterDry ice and acetoneLiquid Nitrogen
I
-86-
An air-driven stirrer was used tokeep good circulation
in the bath. Temperatures were measured with a glass thermom-
eter in all tests except those at -196QC where an iron-constantan
thermocouple was used. The two specimens pulled at -1300C and
-1700C were tested in a controlled cooling apparatus of the
Westinghouse Research Laboratories under the same rate of load-
ing as all other specimens.
EXPERIMENTAL
-r-
RESULTS AND DISCUSSION
‘1
I
In keeping with the division of the literature review
into three sections (sIipt twinning and cleavase)~ the
experimental results are so divided. At times it was found
necessary to include some observations from one part of the
study in the section devoted to another part in order that
a complete picture could be obtained.
It should be remembered that the original aim Of this
study was an investigation and measure~ientof the stresses
for Slip$ twinning and cleavage at various temperatures.
Howevsr, m,echanisticshave crept into several parts of this
work and necessarily S09 fo~ their importance may outwei~h$
and in many cases overshadow, the importance of quantitative
measurements of stresses. The data which enable me to dis-.
cuss mechanisms in this work are not completet yet the author
believes that they are of sufficient importance to be discussed
.—
in light of the support they may offer to various theories of
deformation in iron. For similar reasons$ many observations
d anomalous or ‘~st~an,gellbehavior of the crystals dcming
deformation are reported with little or no d.iseussionas to
their interpretation. Perhaps if some reader of this dis-
s~rtation should have opportunity to reflect$ then these
scattered kits of Information may serve a useful WWOS5.
izu.Q
The orientations of all specimens tssted for behavior
during slip appear In the stereographic unit triangle of
Fig. 4oa. The positions of the specimen axes in the r,nft
triangle are represented by dots (.): the usual manner of
presenting a series of orientations. It is quite evident
that the compIete gamut of orientations was not studied;
but? of courses since the specimens were tested as they
were manufactured no prediction as to the orientation of
future specimens was possible. Again it.should be stressed
that mechan.isticswere originally intended to be of secondary
importance.
Fig. 40b shows the orientations with respect to the
slip syst~ms of maximum resolved shear stress for the
orientations in ~uestion~ as calculated by Opinsky and
Smoluchowski. Although it was believed at the outset of the
work that the Opinsky theory was correct and study”would

R1,
-—
5
0
I
m0
.1
1..
-89-
proceed with it as a basis, the data indicated marked deviations
from predicted behavior. It was then decided to record the data
and to correlate it with whatever explanation seemed.most nearly
correct.
%havior of the Glide Ellivse Q Various—— — Tem~eratures
Fig. 4-1pictures the angular relationships among the inte-
grated glide ellipse, maximum shear stress plane and variov.s
low index crystallographic planes of the ~111] zone. The an-
gular distance along this zone is set out horizontally with
the (ToI) plane as the origtn. This type of drawing clearly
indicates the relative positions of the various planes and
summarizes the data for all the slip specimens. Glide el-
lipses are represented by crosses (x) and maximum shear planes
by dots (.).
The integrated glide ellipses do not usually coincide
wfth any of the three planes (TO1), (712), or (~11)$ although
in some cases they are very nearly coincident. It is believed
that these are not due to experimental error but are representa-
tive of a real effect. If error was the cause of the deviation
from ~’crystallographicity~!then the pole of the slip planes
should deviate anywhere around the crystallographic pole and
not just along the [1113 zone. For only one specimen (A-3) did
the pole of the glide ellipse fall more than one degre~ off the
LIII~ zone. This is in direct accord with the theory advanced
by Steljn and Erick where the glide ellipse was found to occupy
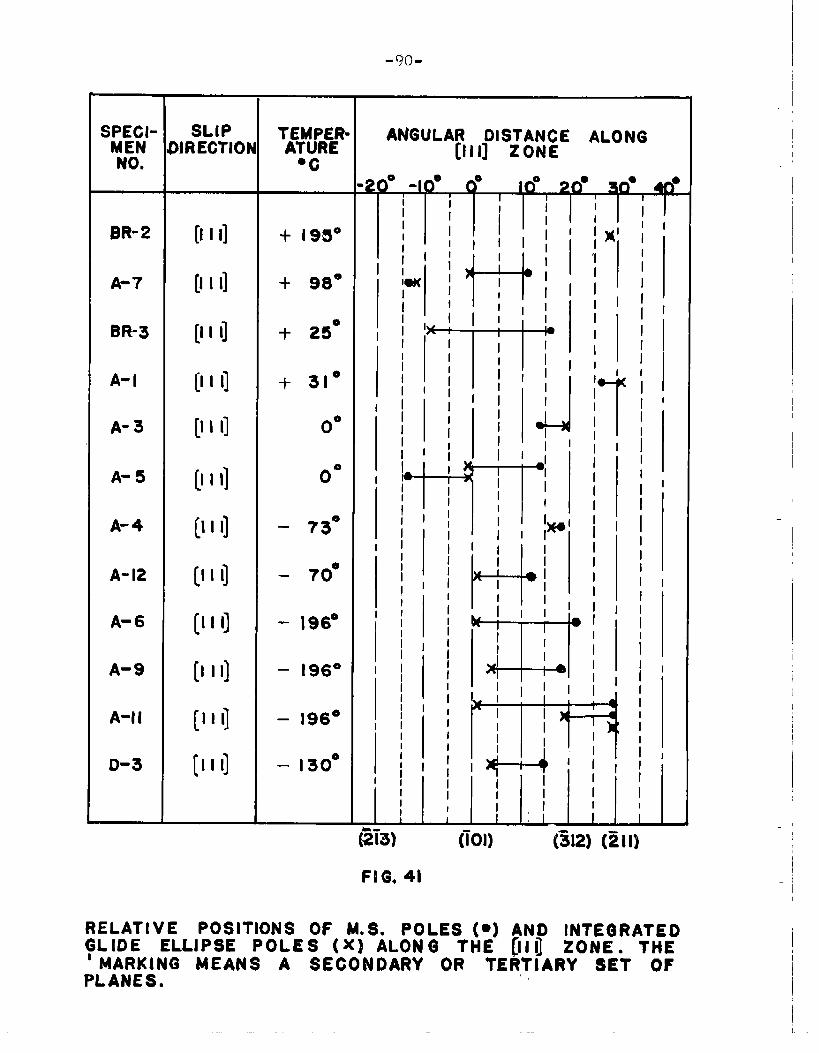
-wl-
BR-2
A-7
BR-3
A- I
A-3
A-5
A-4
A-12
A-6
A-9
A-l I
D-3
SLIPMRECTIOI
[1I 1]
[1I1]
[l Ill
[1I1]
[11 1]
[1I 1]
[1 I 1]
[Ill
[l Ill
[1 11]
[l Ill
[Ill]
+ I 9s0
+ 98°
+ 25°
+ 31°
0°
0“
– 73”
– 70°
- 196°
– 196°
– 196°
– 130°
ANGULAR DISTANCE ALONG[Ill] ZONE
FIG. 41
RELATIVE POSITIONS OF U.S. POLES (-) AND INTEGRATEDGLIDE ELUPSE POLES (~) ALONG THE [Ilij ZONE. THE‘ MARKING MEANS A SECONDARY OR TERTIARY SET OFPLANES,
I
I
I
I
--
-91-
any ~osftion h the Llll~ zone. To check the correlation more
closely the angles~an,dX were measured for specimens A-1 and
BR-3 tested at room temperature and superimposed on the ~fversus
z plot of Steijn for an alloy of similar composition (.023% C)b
(See Fig. 42). These data fall exactly on the curve drawn.
through the values obtained by Steijn. ‘Unfortunately,these
were the only specimens tested at a temperature comparable to
Steijn”so
-e in the Eehavlor ~ the Glide Ellipse w~ ~~mperature——
As the temperature was decreased below room temperature
the glide elllpse tended toward the (~o~) plane r~gard~ess Of
t’heposition of the maximum shear stress plane. At intermedia-
tely low temperatures (O@C and -~O@C) the glide ellipse did
fall near the (~11) when the max~m~ shear pole fell in that
position; however? at -196~ the deviation was always toward
[101). Specimen A-II was interesting in that three separate
sets of traces were present. One coincided with (~01)2 one
was very nearly (~21)~ and the third was coincident with
(~11). The maximum shear plane coincided with (~11). Such a
behavior is not to be expected on the basis of any theory
which predicts only pr~mary slip. However? if other factors
are considered then the behavior appears more logical.
If specimen A-11 was not homogeneous with respect to
included particlss or foreign atoms such as carbon or silicon~
the slip behavio~ couTd.vary along the gauge length of the
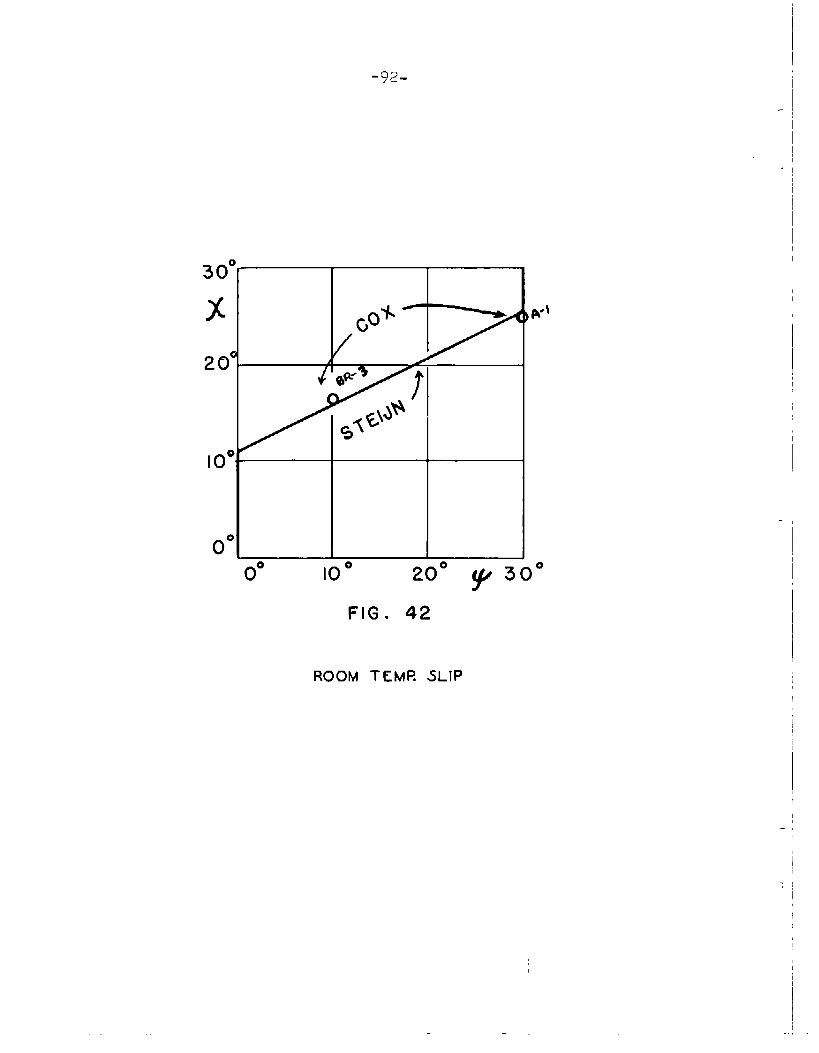
-92-
,.
30
x
20
10
o’0° 10° 200Y 300
FIG* 42
ROOM TEMI? 5LIP
-,
-93-
crystal. The theory of Steijn would predict a slip trace
near (~01) since the resistance to shear of this plane in
relation to the (211) is quite low at low tempe~atures.
However, if foreign matter hindered certain A type movements?
then.(~11) slip would predominate. As pointed out later~ the
variation in shear stress along the [III] zone is not signif-
icant at lower stresses but it may be of sufficient magnitude
at -1960C to affect the selection of the glide ellipse.
Anoth~r possible explanation is that the first slip may
have been (TO1) but that the occurrence of twinning, strain
hardening, and other such lattice distortions invalidate the
criterion of critical shear stress as originally intended,
Tn reality any of the theories of slip were only meant to
apply to the first slip and not that after severe plastic
flow had taken place.
At higher temperatures? room temperature and above, the
glide ellipses fall nearer to the maximum shear poles. This
indicates that the shearing strengths of the (511-)and (TO1)
planes are
shear pole
Iipse pole
and BR-2.)
approaching each other. In fact, if the maximum
is close to (~11), then the integrated glide el-
may tend toward this plane. (See specimens A-1
This means that the ratio of S~lSl10 decreases
toward unity with increasing temperature, which indicates a
weakening of planes in the vicinity of (~11). phenomenol-
.ogically, thenj me can say that theY’ ratiot S
112/s1107 1s
.9k-
the factor which determines the slip behavior for a given set
of test conditiflns,excluding of course, orientation. The
St~S110 curve for the room temperature tests in this work is
equivalent to Steijn~s for the .023Z C alloy. (See curve m
in Fig. ~).
The migration of the tensile axes of the specimens are,
In general, as predicted by Opin.skyand Smoluchowski in tlmiir
maximum shear stress theory. Of course? sSnce they had assumed
equal shearing strengths for all planes and this author has
chosen,to assume different ones? it may seem incon.grucusto
correlate these resnlts with theirs. However? the predictions
based on non-equal shearing strengths would be indeed most com-
plicated. Perha~s fox some of the specimen.sin which the
Opinsky predictions did not suffice to explain the observed
migrations, the differences in shearing strengths were suf-
ficiently important to complicate the matter. Specimens in
the region near the (001) vertex of the unit trian~le are the
ones for which axis migrations are most complex. These should
be strained in small Increments and X-rayed to determine the
incremental migration. Figu~es k3 to Jh are the complete
stereographic data for all specimens used in this part of the
research. All azimuthal slip trace data? axis mj.grations~etc.,
are clearly imlicated with.the following symbols:
.-
,,I
I
,
,.
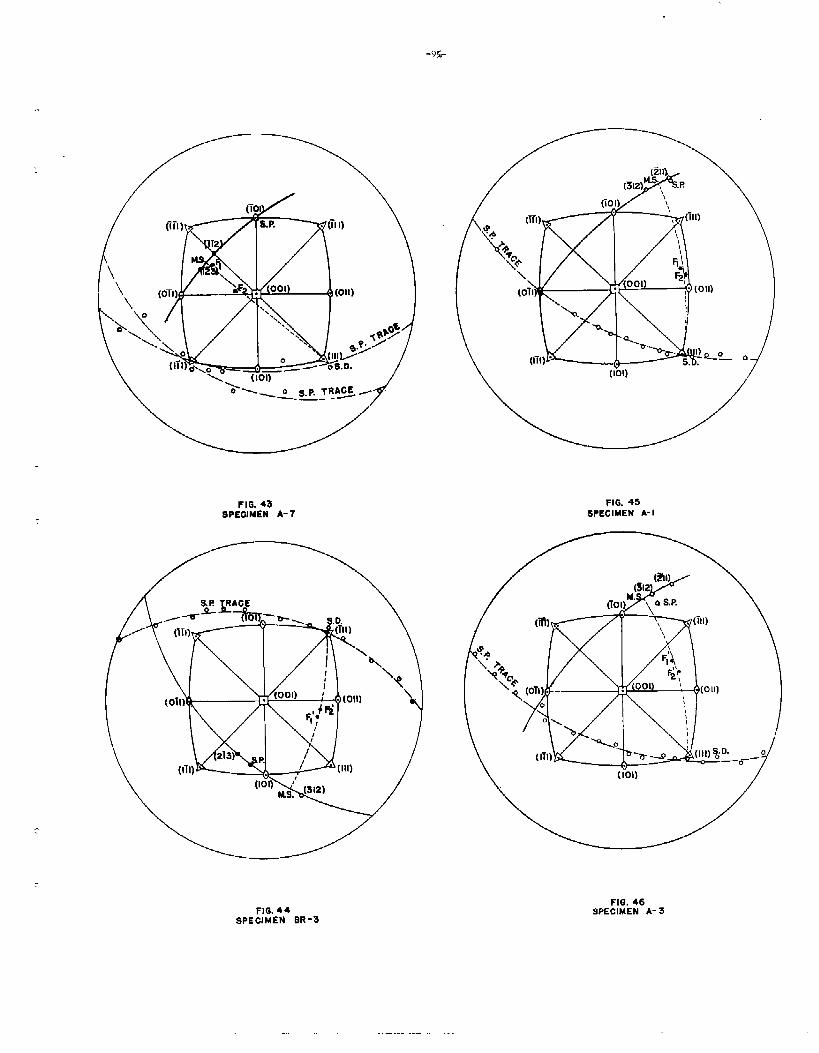
-9,$+
FIG. 43SPECIMEN A-7
\(OTI
FIG. 45SPECIMEN A- I
FIG. 44FIG. 46
SPECIMEN BR-3SPECIMEN A-3
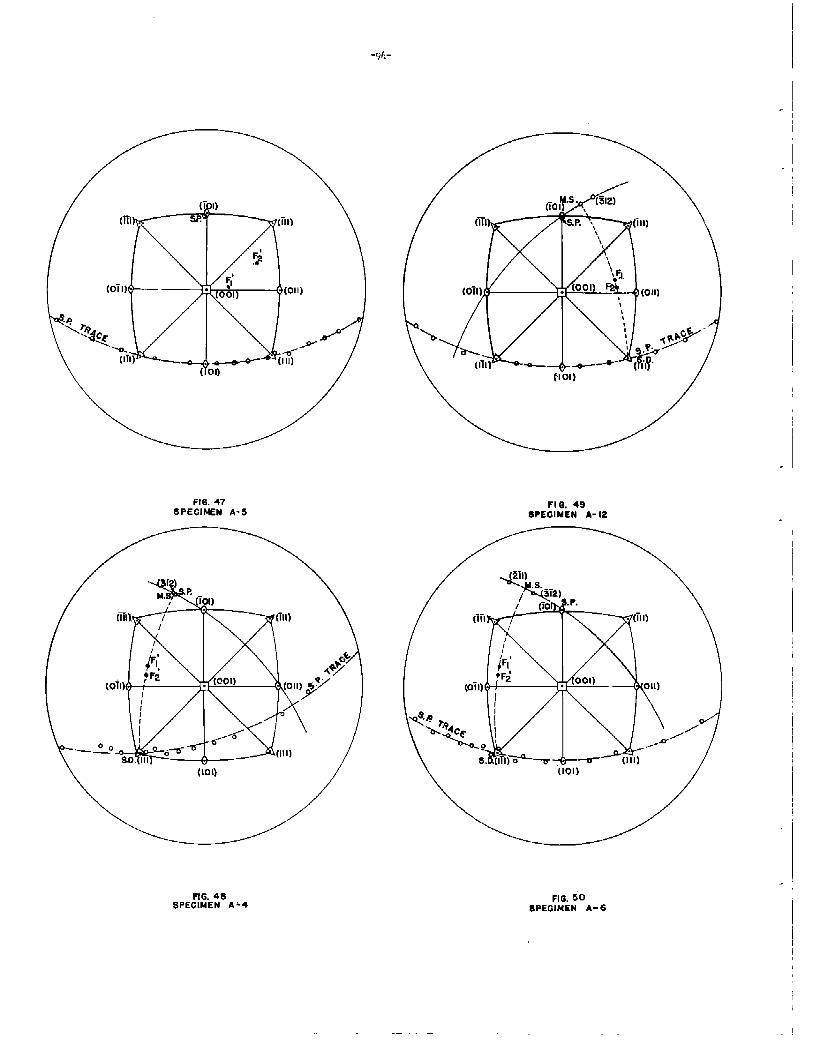
-1
(oil). )
I
I
FIG. 47 FIQ. 499PEGIMEN A-5 SPECIMEN A-12
FIG.48SPECIMEN A*4
FIG. 505PEGIMEN A-6
I
-’
—
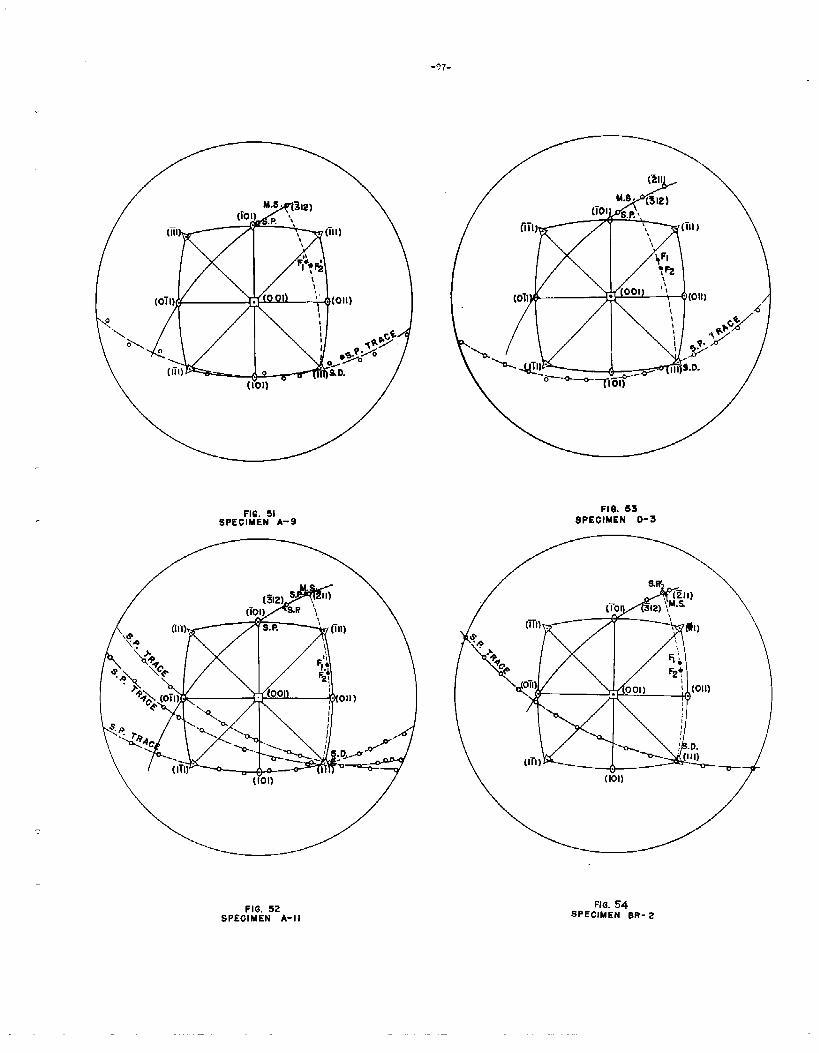
-?7-
(oTI) (OTI
FIG. 51SPECIMEN A-9
F16. 53SPECIMEN D-3
/“
FIG, 52SPECIMEN A-11
FIG. 54SPECIMEN BR- 2
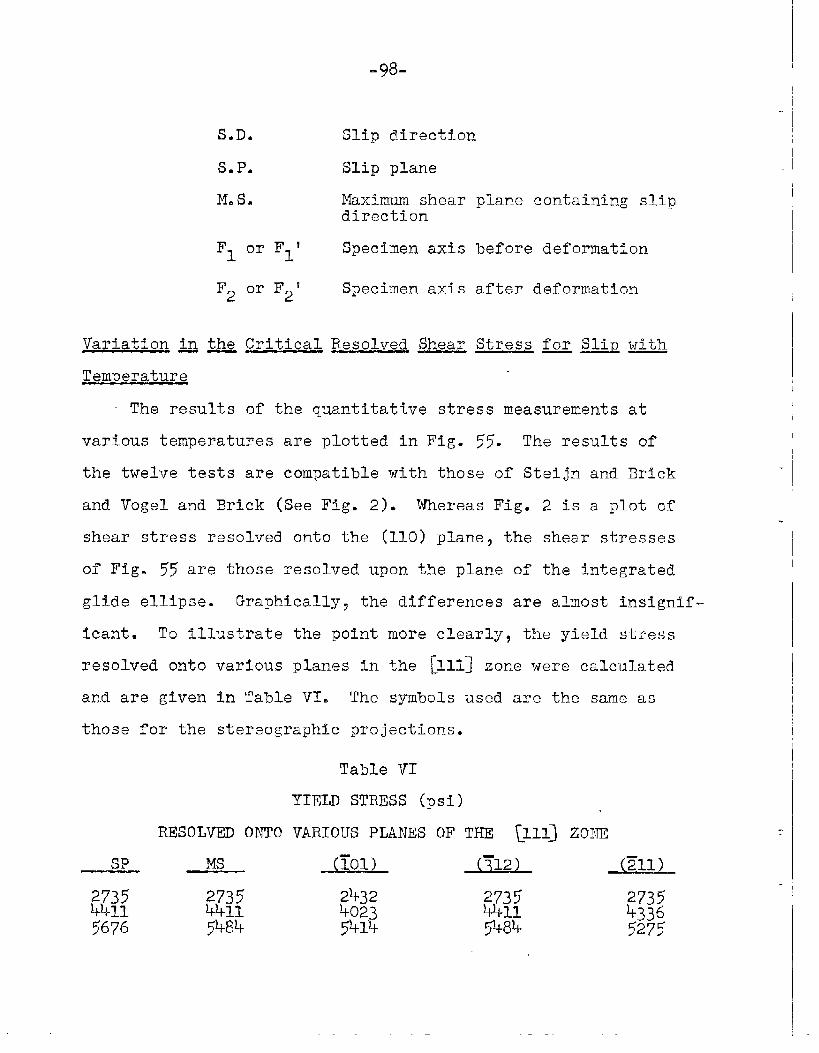
-98-
.
S*D* Slip directj.on
S.P. Slip plane
Hose Maximum shear plane containing slipdirection
F1 Or F1l Specimen axis before deformation
F2 01’ F2~ Specimen axis after deformation
Variation in the Critical Resolved Shear Stress for Slip with—— —— —
Temperature
The results of the quantitative stress measurements at
various temperatures are plotted in Fig. 55. The results of
the twelve tests are compatible with those of Steijn and Brick
and Vogel and Brick (See Fig. 2). Whereas Fig. 2 is a plot of
shear stress resolved onto the (110) plane~ the shear stresses
of Fig. 55 are those resolved upon the plane of the integrated
glide ellipse. Graphically, the differences are almost insignif-
icant. To illustrate the potnt mare clearly, the yield stress
resolved onto various planes in the [Ill] zone were calculated
and are given,in Table VI. The symbols used are the same as
those for the stereo~raphtc projections.
Table VI
YIELD STRESS (psi)
RESOLVED ONTO VARIOUS PLANES OF THE ~111] ZONE
F@ Ms m m m
2735 2735$:
2432 273S4411 4411
2735
$:24336
5484 5484 5275
I
I
I
I
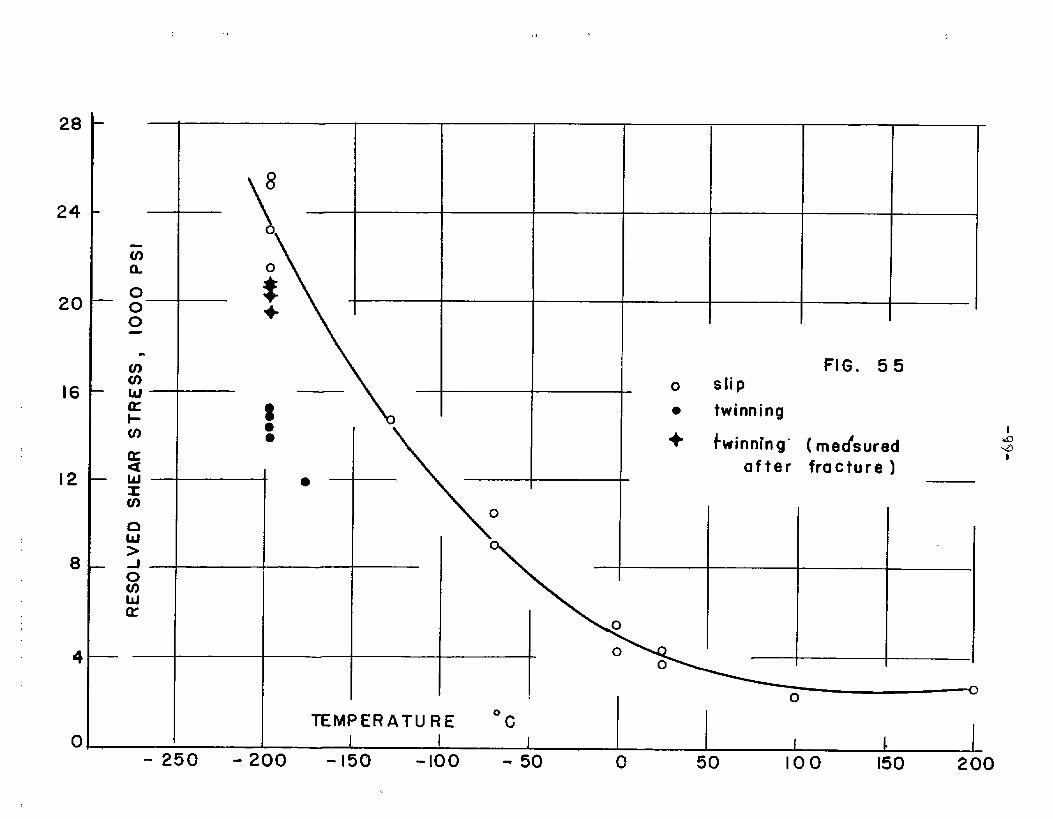
,,
28
24
20
16
12
a
4
0
—
8
!
\
o
TEMPERATURE ‘c
-+
o slip
● twinning
ofter
FIG. 55
00 I
I o 0
( rned’suredfracture )
I
r
I I I 1 i I-250 -200 -150 -1oo -50 0 50 100 150 200
t33
-1oo-
Table VI (Continued)
I
SP MS m J3QLIQ77’O 10570 10070 10570 10410
9000 9173 8825 9000 864-617270 18~30 17270 18530 1822021200 21690 20690 21690 2120023150 26150 2s150 25800 261502580026150
Tt can be seen that the values for any plane in the gone
do not vary more than a few per cent. In fact$ the variation
for any specfmen is less than the scatter between.two speci-
mens tested at the same tempe~ature. The values of critical
resolved shear stress at any temperature are found to be
slightly lower than those of Fig. 2 even though th~ decarburized
mild steel is much less pure than the vacuum melted.ferrft~s
used by Steijn. No explanation is advanced for this difference.
Tt should be brought to mind that the data at -196W were
not obtained rigorously. No marked yield point was observed
in these specimens, but rather the first deviation from elastic
behavior was a loud bang accompanied by a drop in load caused
by twin formation. When the specimens were examined rnetallo-
graphically, both slip lines and twins were present. No
methods were available to check whether sliP’or tw~nnfng had
occurred first7 or both simultaneously. P~rhaps twinning was
the initial processq and then the heat liberated by twinning
caused enough local tempe~ature rls.eto permit slip. Regard-
less of the order of these processes, the value of stress at
I
I
.-
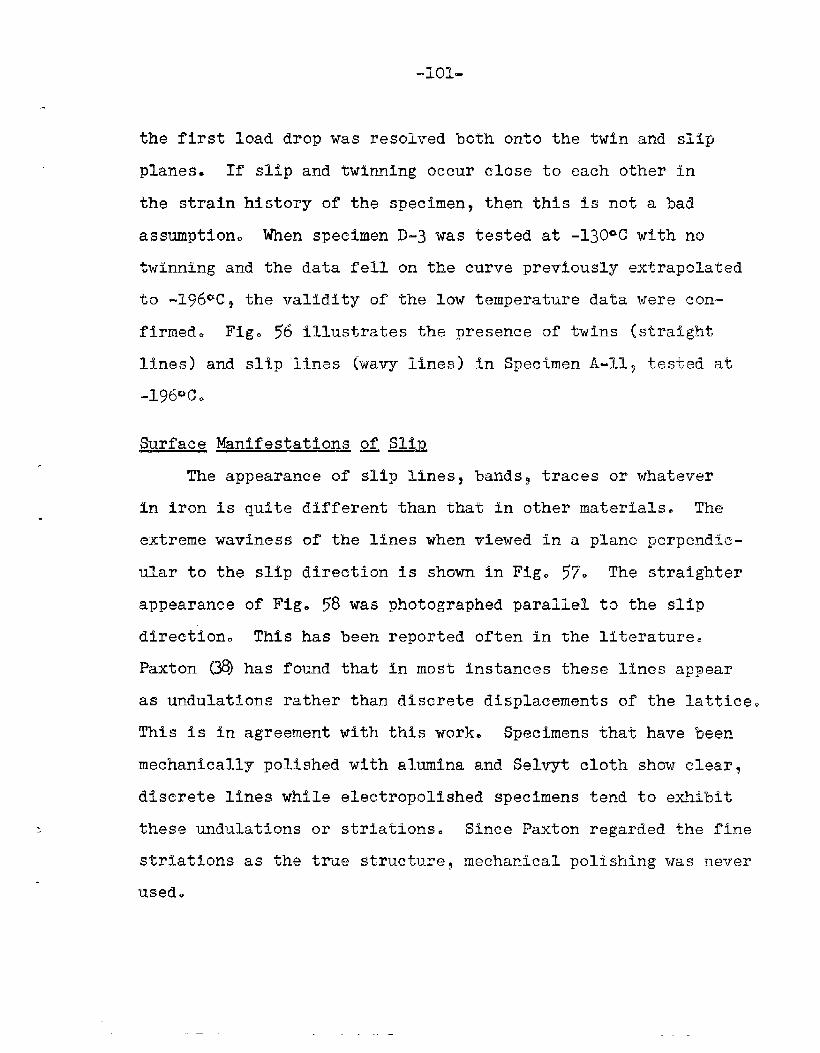
the first load drop was resolved both onto the twin and slip
planes. If slip and twinning occur close to each other in
the strain history of the speciment then this is not a bad
assumption. When specimen D-3 was tested at -130”C with no
twinning and the data fell on the curve previously extrapolated
to -196~C~ the valfdity of the low temperature data were con-
firmed. Fig. 56 illustrates the presence of twins (straight
lines) and slip lines (wavy lines) in Specimen A-llJ tested at
-196QC.
Surface Manifestations of SIQ——
The appearance of slip lines, bands? traces or whatever
in iron is quite different than that in other materials. The
extreme waviness of the lines when viewed in a plane perpendic-
ular to the slip direction is shown in Ftg. 57. The straighter
appearance of Fig. 58 was photographed parallel to the slip
direction. This has been reported often in the literature.
Paxton m has found that in most instances these lines appear
as undulations rather than discrete displacements of the lattice.
This is in agreement with this work. Specimens that have been
mechanically polished with alumina and Selvyt cloth show clear$
discrete lines while electropolished specimens tend to exhibit
these undulations or striations. Since Paxton regarded the fine
striations as the tme structure mechanical polfshing was never
used.
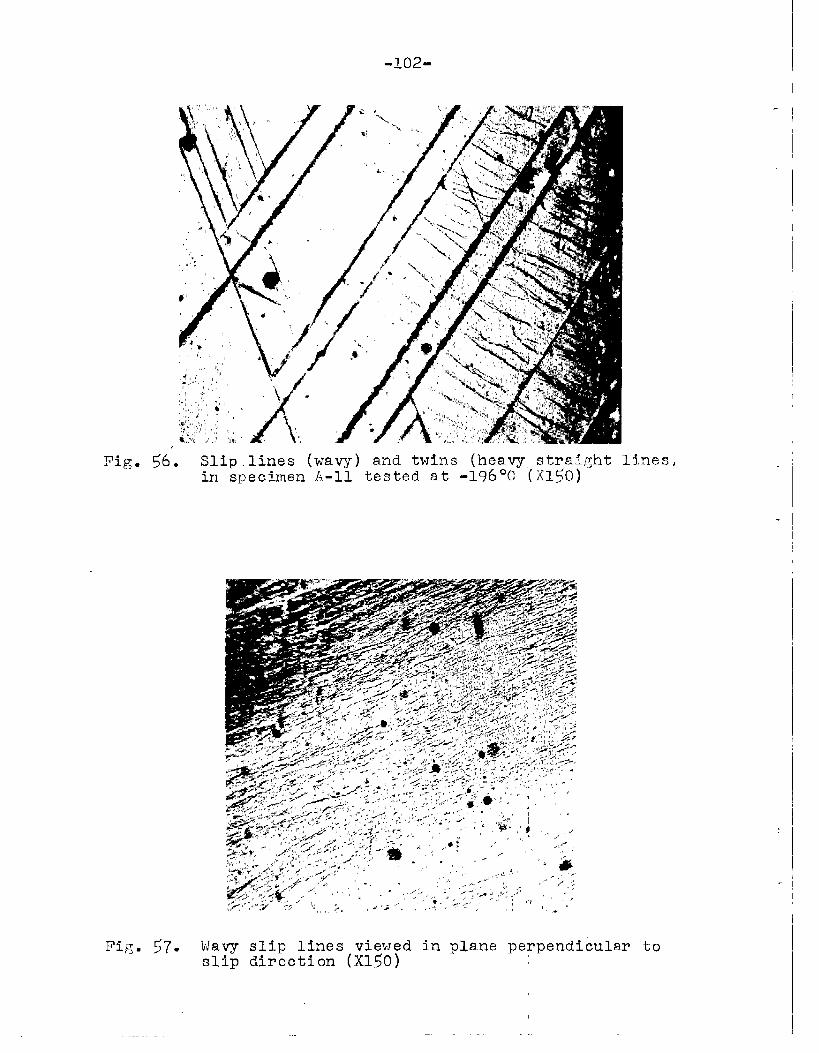
-1o2-
-!
Pig. 56. Slip,lines (wavy) and tmins (heavy strai~ht lines,in specimen },.11tested at -196°c (XISO)
I
I..
Fig. 57. lJavy slip lines viewed in plane perpendicular toslip direction (XISO)
—.
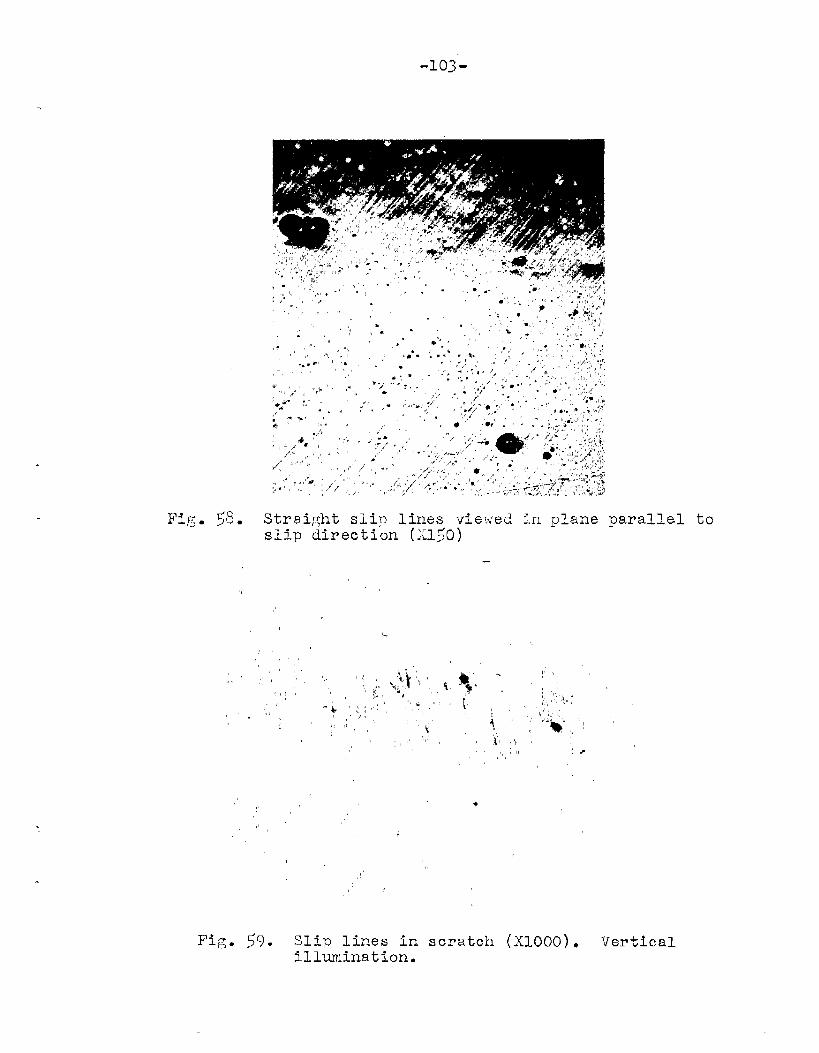
-1o3-
Strai}qhtslin lines vie’wedin plane..slip direction (X1510)
parallel to
,,
‘,”
Fig. 5’9.
*
Slip lines in scratch (X1OOO). Verticalillumination.
-m-
.1
A check experiment was performed on a single crystal
cylinder, containing a longitudinal scratch in the surface.
After being deformed in compression, this specimen was found
to exhibit heavy discrete slip lines across the width of the
scratch but nowhere else. Figures 59 and 60 show this speci-
men under light and dark field illumination respectively. The
structure is not an artifact since placing the light source at
different angles to the surface did not make the effect vanish.
There are two possible explanations for this. The first
is that certain residual stresses are introduced by the scratch
which tend to make the surface more susceptible to being ‘broken
up. The second is that strain hardening of the metal near the
scratch forces the dislocations to leave the metal surface at
specific places; e.g. the slip lines. Neither of these proposals
was verified since to differentiate between residual stresses
and strafn hardening would be most difficult.
Deformation in these specimens is not homogeneous. Fig. 61
Illustrates clearly the clustering of the slip lines along a
portion of the gauge length of Specimen D-3. This could be due
to inhomogeneities in chemical composition, inclusions? or many
other things. No attempts were made to measure the spacing of
these clusters or to correlate them with other test variables.
Asterism and Lattice Distortion During Deformation—.— —
Figures 62 and 63 are typical Laue back reflection photo-
graphs before and after testing. The spots of Fig. 62 are sharp
I
II
I
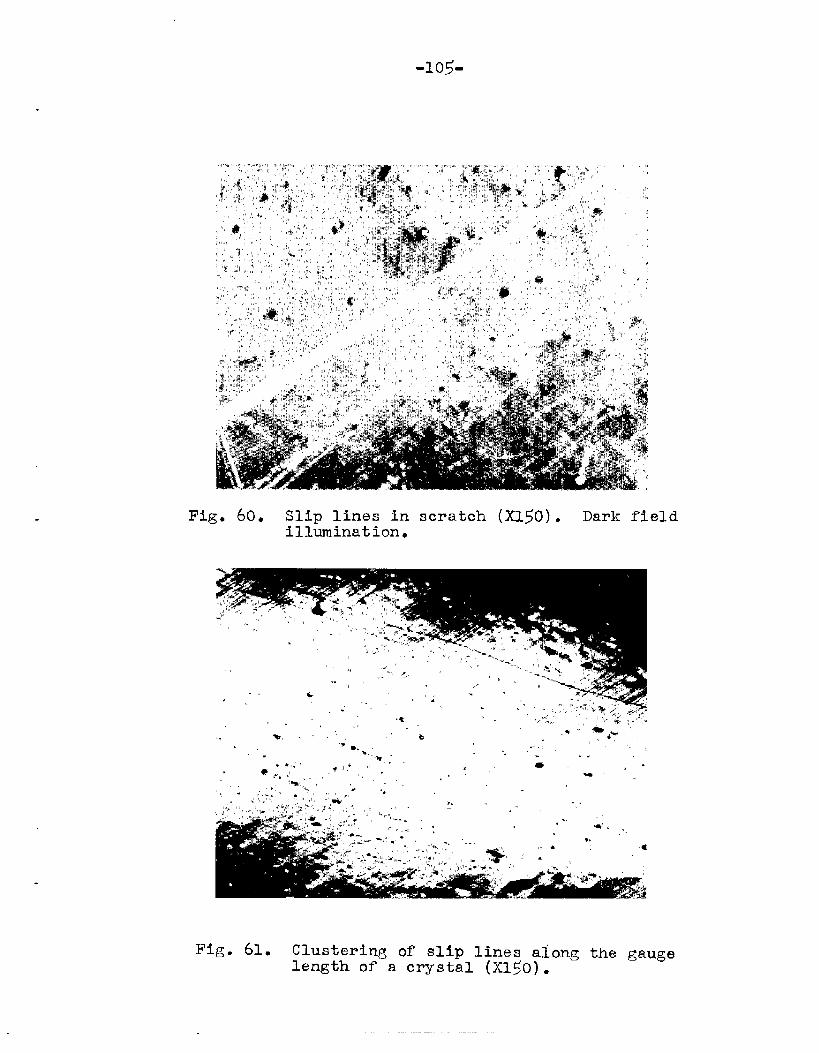
-10+
Figq 60. Slip lines in scratch (Xl~O). Dark fieldillumination.
Fig. 61. Clustering of slip lines along the gaugelength of a crystal (Xl~O).

Fig.62: Lauepho~ogr=mof’specimenA-l Fig. 63. Lauephotogramoftakenpriorto testing. s~ecimen~-l takenaf’ter
S percentelongation.Note splittingof spotsand rotationof crystalax~s.
,-..—. ——_..
“lo7-
and clear indicating an, undeformed surface. Fig. 63 illtistrates
the rotation of the crystal during extension by slip. The amount
of rotation depends upon the orientation of the specimen with re-
spect to easy slip systems. Most crystals were extended about
.08 inches or approximately 4 percent before being X-rayed. The
asterism was always quite
urements could be made as
wider, more diffuse X-ray
small, in fact so slight that no meas-
to the planes responsible for it. A
beam would give more arc length, but
it would appear that the measurement would be a function of the
X-ray rather than of the specimen—a very undesirable property,
Fig. 63 does have other interesting points. The individual
spots appear to be split into three or four smaller spots. This
is indicative of fragmentation of the crystal into smaller ones
of slightly different orientation. No annealing treatments were
used to determine whether this was akin to polygonization ~henom-
ena. Such behavior has not been previously reported for iron.
Twinning
The orientations of the specimens studied for twinning be-
havior are given in Fig. 64. Again a complete series of orienta-
tions was not investigated, but a fairly representative sample
from various parts of the unit triangle was examined. Three of
the samples, A-6, A-9 and A-11, were originally examined and
measured for slip behavior and then, later, twin data were ob-
tained from these crystals.
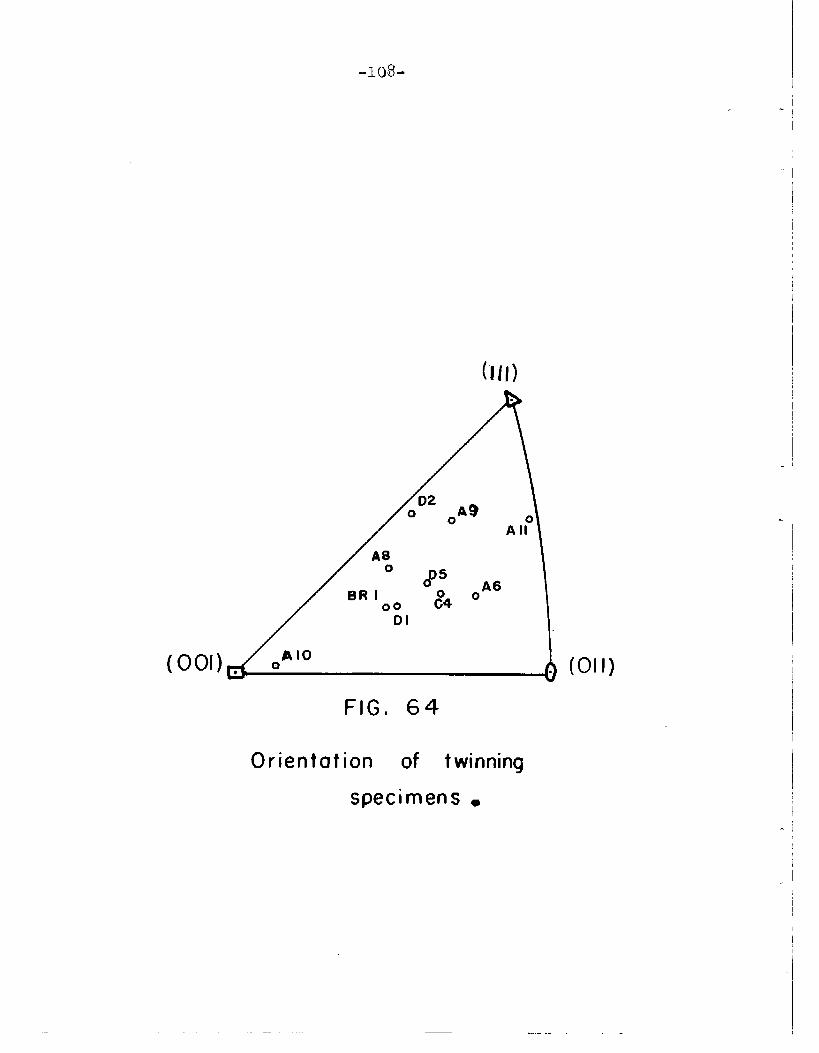
-loE!-
(111)
FIG. 64
orientation of twinning
specimens s
—. ...—.-.
-,
I
.,
.
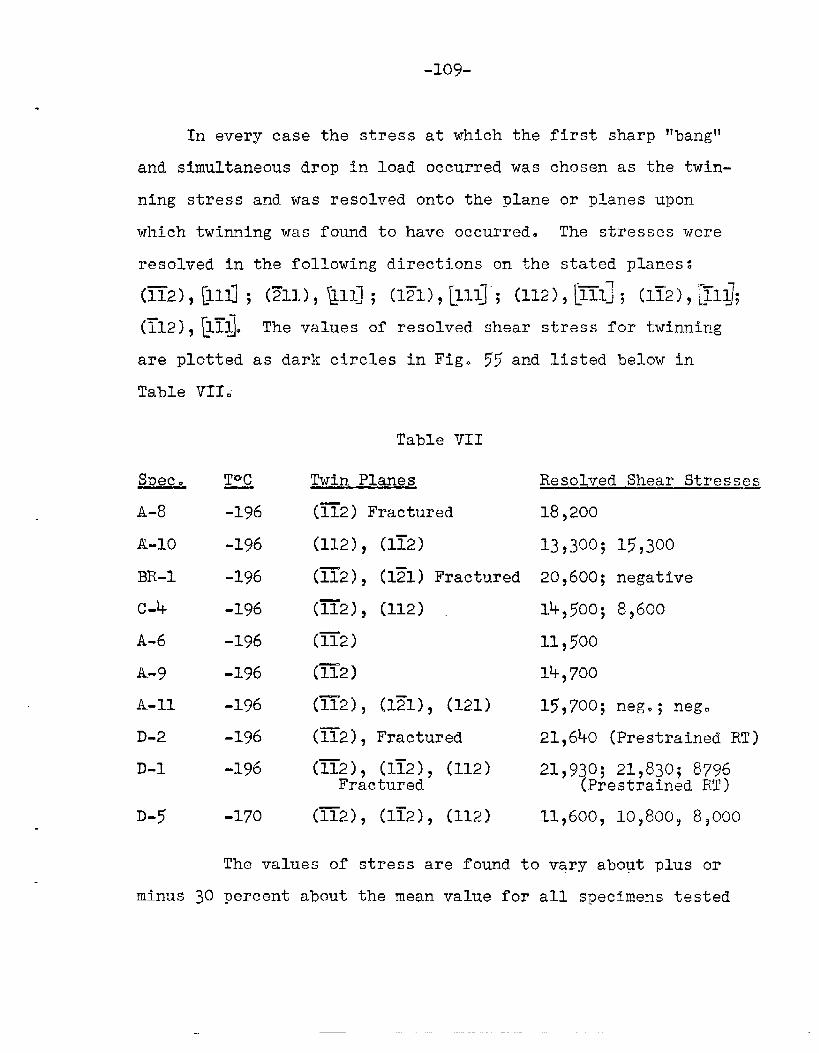
-1o9-
In every case the stress at which the first sharp llbangll
and simultaneous drop in load occurred was chosen as the tvin-
ning stress and was resolved onto the plane or planes upon
which twinning was found to have occurred. The stresses were
resolved in the following directions on the stated planes~
(ii2), [nil; (Z1), B1l’; (151)JMJ”; (112), [ii13; (lT’2)$’~@lj;
(~12 I, [liiJ.
are plotted
Table VII:
h
A-8
~.1~
13R-1
c-4
A-6
A-9
A-n
D-2
D-1
D-5
minus 30
The values of resolved
as dark circles in Fig.
Toc
-196
-196
-196
-196
-196
-196
-196
-196
-196
-170
Table VII
shear stress far twinning
55 and listed below in
Twin Planes
(fi2) Fractured
(112), (1i2)
(~2), (121) Fractured
(ii2), (112)
(H2 )
(m2 )
(=21, (121), (121)
(fi2), Fractured
Resolved Shear Stresses
18,200
133300; 15,300
20,600; negative
14,500; 8$600
11,500
lk,700
15,700; neg.; neg.
21,640 (Restrained RT)
(~2), (1T2), (112) 21,9s0; 21,830; 8796Fractured (Restrained RT)
(ii2), 0i2)t (112) 11,600, 109800Y 85000
The values of stress are found to vary about plus or
percent about the mean value for all specimens tested
-uo-
at -196~co The measurements of twinning in the specimens pulled
to fracture are not as accurate as those stopped after ~ or 5
percent elongation. If these fracture specimens are discarded
from the list then the variation is much less. In fact? the
variation is now onflyabout 14 p~rcent. This scatter is quite
large. If a critical resolved shear stress criterion were
responsible for the onset of twinning$ the scatter should be
much smaller. However, for slip at any temperature? the scatter
is of the same order. The most favorable evidence for a critical
resolved shear stress being the criterion for twinning is the
selection of the twinning plane. For most orientations of the
unit triangle the plane (211) is subject to the greatest re-
solved shear stre.ss~yet this plane was never found to be the
twinning plane. Howevera it can be shown that this plane can
twin only with a resulting shortening of the specimen; i.e., if
it is being deformed in compression. Therefore, it should never
be found to twin in a tensile test. In every case th~ twin
plane or planes were those of highest resolved shear stress that
could twin by extension of the crystal. Although the scatter
is somewhat greater than would be desired for a stringent con-
firmation of the critical shear stress hypothesis, it is cer-
tainly comparable to the data obtained by this author and others
for slipping stress where the critical shear hypothesis is
generally firmly accepted. Because of the discontinuous nature
of the twinning process? one would deduce that irregularities
!
I.!
I
-111-
in the crystal or slight maladjustments in the mechanics of the
test (temperature,axiality, etc.) would have a more prono~ced
effect on the measured twinning stress than on the stress for
slip. Then too, it has been found that slip can inhibit or
prevent mechanical twinning in alpha iron. With this in rnind~
one might propose that any small amount of slip could severely
alter the stress necessary to initiate and propagate the first
mechanical twins.
To investigate the possibility of an effect of normal
stresses on the selection of the twinning plane, the normal
stresses were calculated for most of the possible twin planes
and are listed! along with the corresponding shear stresses$
in Table VIII. The constancy is much worse than for a shear-
stress criterion. Various combinations of normal aridshear
stresses were proposed but none of these proved any more ap-
plicable than the straight shear stress theory. The symbc)l@
denotes the planes upon which twins were found. The planes
where twinning occurred with very low or perhaps negative shear
stresses are accommodation twins resulting from the relief of
localized stress concentrations. This has been reported re-
cently by Paxton (27). That shear plays at least an important
part is evidenced by Specimen D-5 tested at -170@C. The critical
shear stress for this specimen was 10J970t somewhat lower than
the mean value at -196~c. It is known from the slip investiga-
tion, that the resistance to shear of this material increases
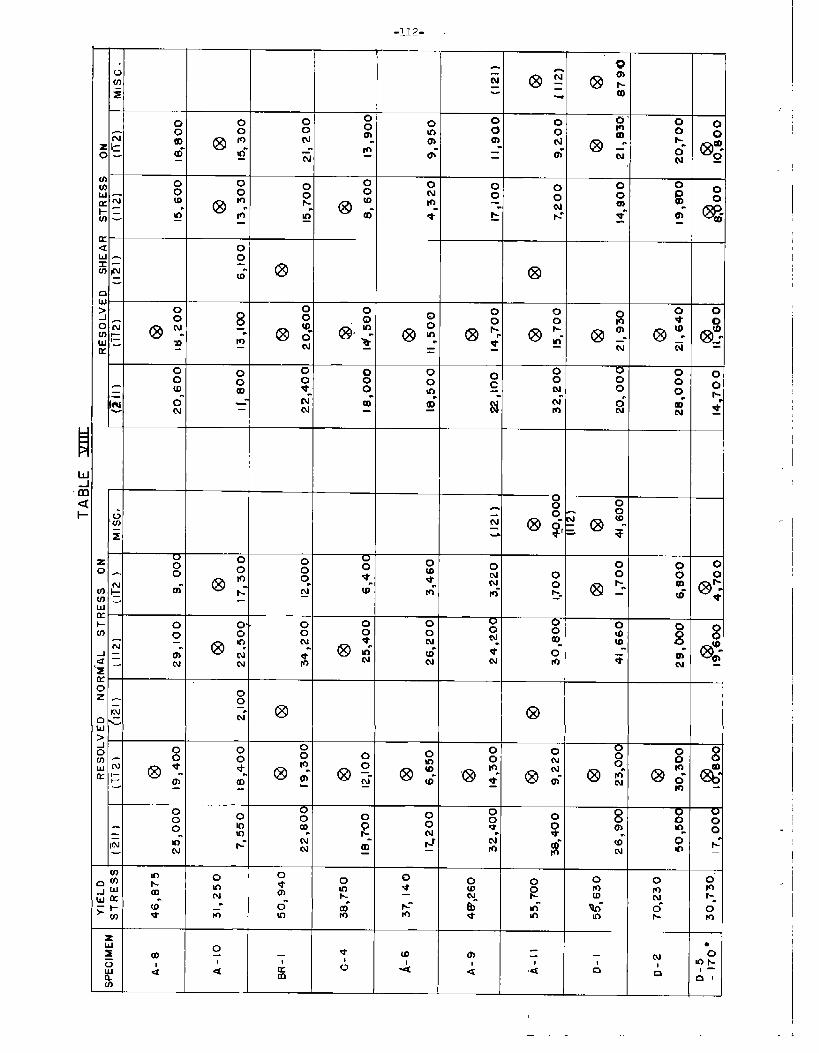
al 1 I I I
I I I !
1 1 I I
KmTm
0N 0 0
0m 0
-. cd*- ~ h’
I I@
mI I
TT=-m1 1
I I
100I
—
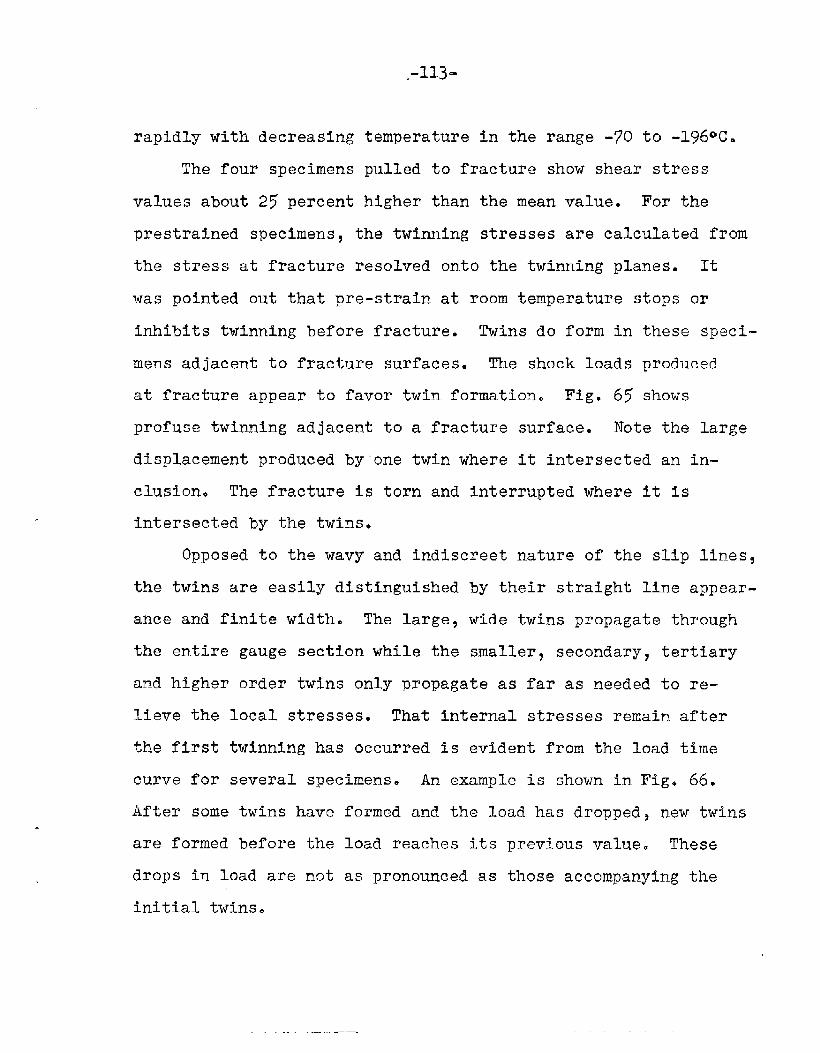
,-113-
rapidly with decreasing temperature in the range -70 to -1960G.
The four specimens pulled to fracture show shear stress
values about 25 percent higher than the mean value. For the
prestrained specimens, the twinning stresses are calculated from
the stress at fracture resolved onto the twinning planes. It
was pointed out that pre-strain at room temperature stops or
inhibits twinning before fracture. Twins do form in these speci-
mens adjacent to fracture surfaces. The shock loads produced
at fracture appear to favor twin formation. Fig. 65 shows
profuse twinning adjacent to a fracture surface. Note the large
displacement produced by’one twin where it intersected an in-
clusion. The fracture is torn and interrupted where it is
intersected by the twins.
Opposed to the wavy and indiscreet nature of the slip lines~
the twins are easily distinguished by their straight line appear-
ance and finite width. The large, wide twins propagate through
the entire gauge section while the smaller, secondary, tertiary
and higher order twins only propagate as far as needed to re-
lieve the local stresses. That Internal stresses remain after
the first twinning has occurred is evident from the load time
curve for several specimens. An example is shown in Fig. 66.
After some twins have formed and the load has droppedy new twins
are formed before the load reaches its previous value. These
drops In load are not as pronounced as those accompanying the
initial twins.
--.—.
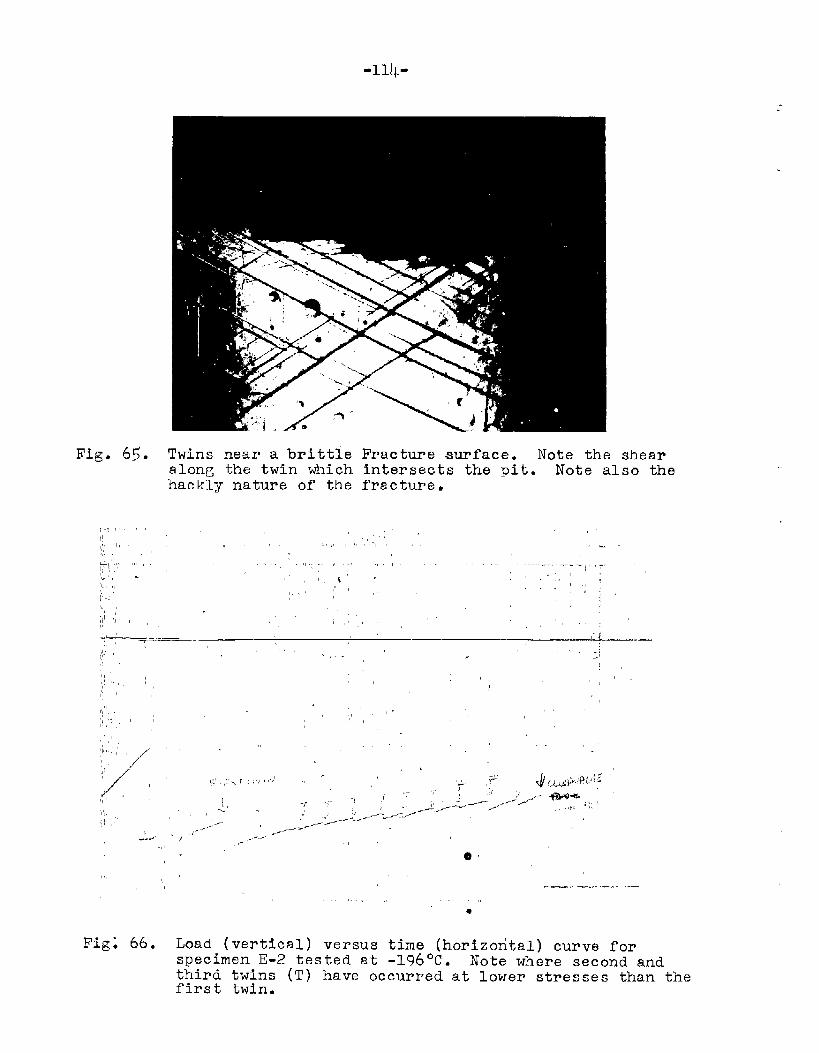
-114-
Fig. 65. Twins near a brittiealon~ the twin whichhackly nature of’the
.“ ,’1~’ !“1
,, .,1, ,,, .,,.,, ,,. ,,,
,, ‘, %’/,,’ ,’1,
Fracture surface. Note the shearintersectsthe pit. Note also thefracture.
,, ,,!/
,’, ),,. . .,
,, . ., , .,-—.“.,,........,,.,,,,~
,, ,,, ,,,:-r
,,:“ .’. ,, ,,:;.
II,! ,, : ,,,,
‘,
,,,’
,’ ,- .. —,, -.. ... .--,. “.-—-.,
,,,m
Fig; 66. Load (vertical)versus time (horizontal)curve f’orspecimenE-2 tested at -196*c. Note where second andthird twins (T) have occurred at lower stresses than thefirst twin.
At low magnifications the twins often appear to have one
feathery edge. An example is shown in Fig. 67. At high mag-
nifications, these separations are resolved into notches rep-
resentative of cube corners. (See Fig. 68.) No angular meas-
~~ements of the dihedrals of these notches were made. Perhaps
they are {112] type tracesp perhaps not.
Fracture
Introduction
The results of this final portion of the research are con-
tained in the section called ~~l?racture.~iOriginally, the term
cleavage was intended7 but the experimental observations have
proved this to be entirely too specific a word. The orienta-
tions of all the fracture specimens are given in Figures 695
70 and 71. Figures 69 and 70 are for the series of short gauge
length specimens while Fig. 71 pertains to the large crystals
such as those used for the slip and twinning studies. The term
“brittle fracture,“ as used here? is defined as a fracture whase
plane can be clearly indexed by optical trace methods in a speci-
men whose orientation can be uniquely determined by the inter-
pretation of a relatively undistorted Laue back reflection photo-
graph. Ductile fracture shall be defined as a chisel-edge frac-
ture occurring at the neck after
- s~
Eight large specimens which
severe deformation.
remained from the slip and
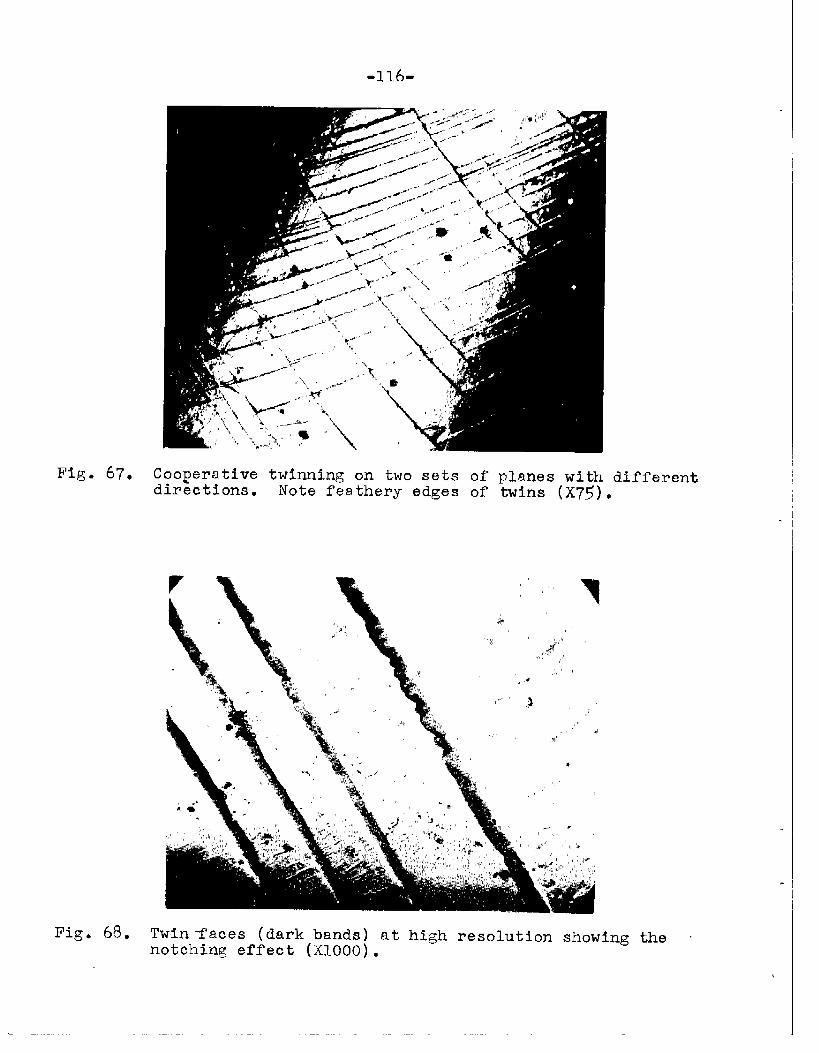
-116-
Fig. 67, Cooperative twinning on two sets of planes with differentdirections. Note feathery edges of twins (X75).
Fig. 68. Twin-faces (dark bands) at high resolution showing the ~notching effect (X1OOO).
..-
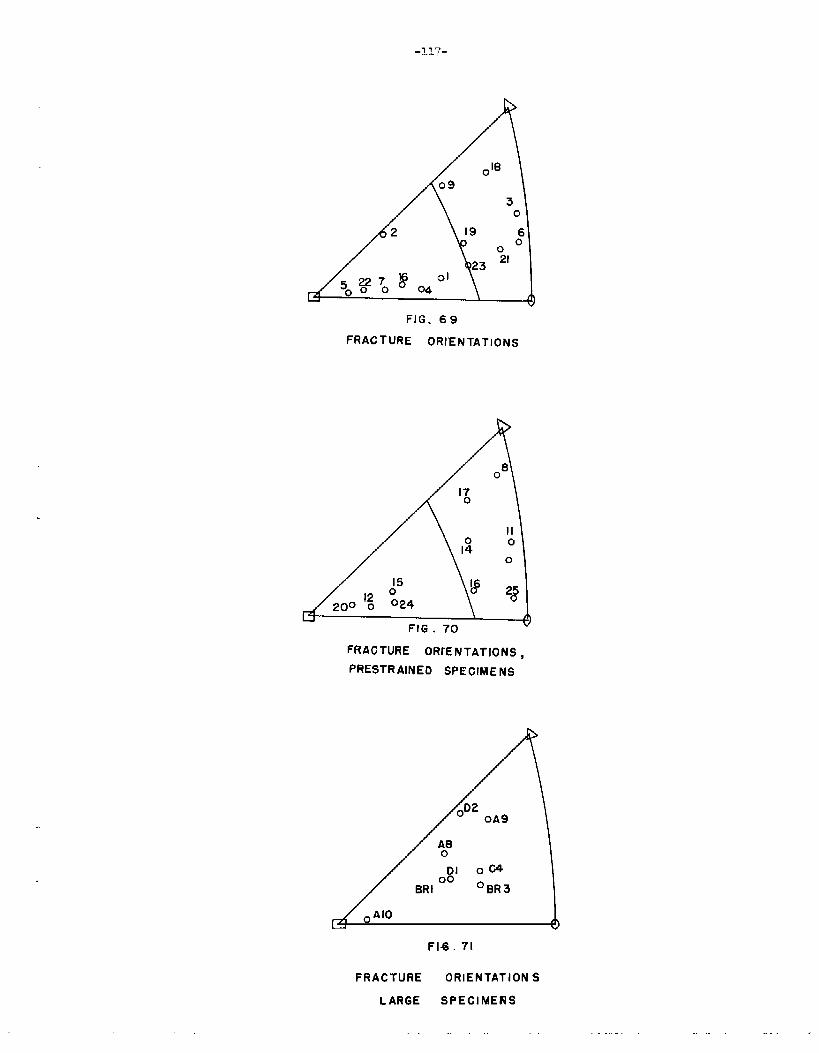
FIG. 69
FRACTURE ORIENTATIONS
FRACTURE ORIZNTATIONS ,
PRESTRAINED SPECIMENS
F16. 71
FRACTURE ORIENTATION S
LARGE SPEGIMEFJS
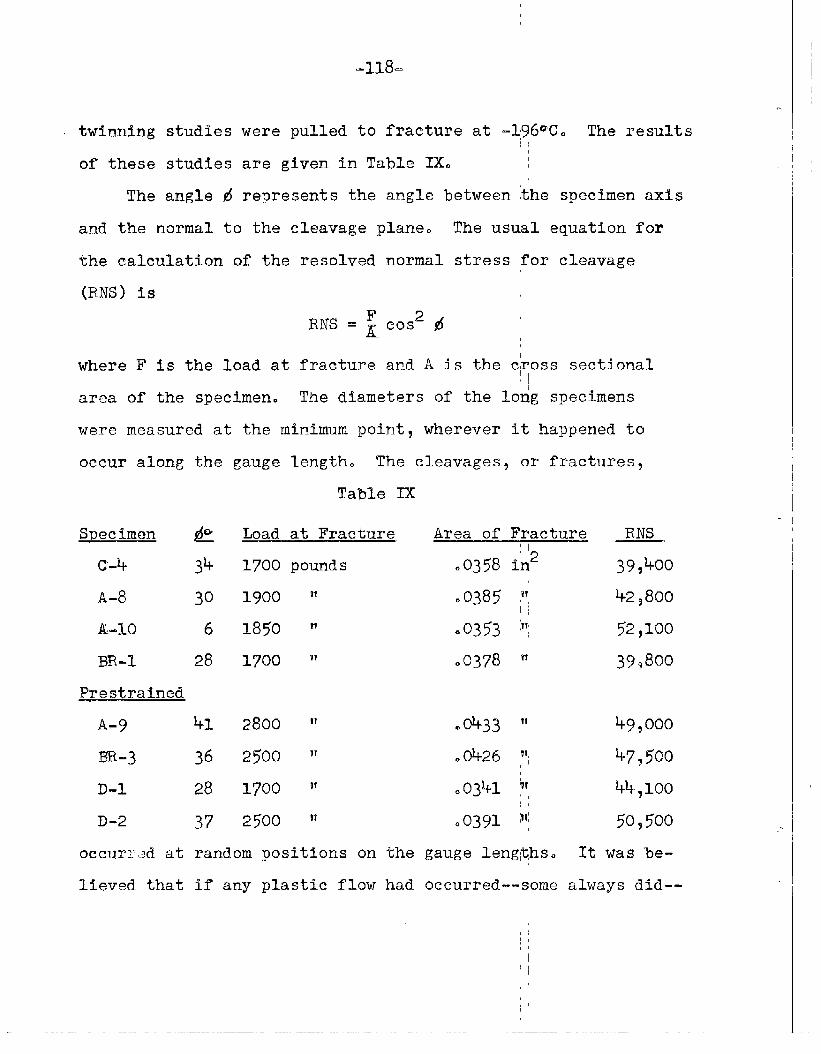
-138- I
.,twinning studies were pulled to fracture at -1960C. The results
of these studies are given in Table IX.
The angle d represents the angle between the specimen axis
and the normal to the cleavage plane. The usual equation for
the calculation of the resolved normal stress for cleavage
(RNS) iS
RNS = ~ c0S2 d
where F is the load at fracture and A is the c~rosssectional
area of the specimen. The diameters of the lo~g specimens
were measured at the minimum point, wherever it happened to
occur along
Specimen
c-b
A-8
A-’lo
m-l
Prestrained
A-q
E!R-3
D-1
D-2
occum:jd at
Ifeved that
the
&
34-
30
6
28
41
36
28
37
gauge length. The cleavages, or fractures,
Table IX
Load at Fracture
1700 pounds
1900 “
185o “
1700 “
2800 “
2500 ‘I
1700 “
2500 ~~
random positions on the
if any plastic flow had
.,
Area of Fracture RNS,1
.0358 in2
.0385 }1:1!
.0353 “
.0378 “
.0433 “
.0426 vi
.0341 !’,
.0391 “
gauge lengi$hs.
occurred--some
39,400
42~800
52,100
39,800
k9 ,000
%7,500
44,100
50,500
It was be-
always did--
.—
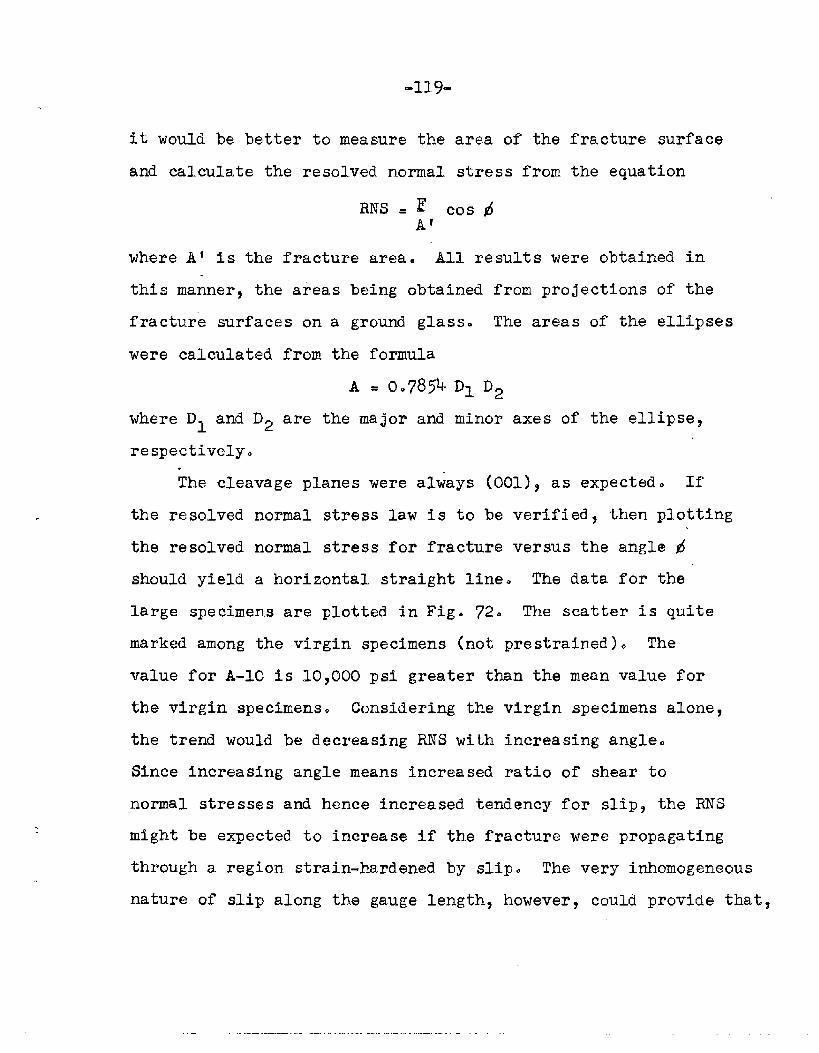
-119-
it would be better to measure the area of the fracture surface
and calculate the resolved normal stress from the equation
RNS = ~ Cos bAt
where A! is the fracture area. All results were obtained in
this manner, the areas being obtained from projections of the
fracture surfaces on a ground glass. The areas of the ellipses
were calculated from the formula
A . 0.785L
where Illand D2 are the major and
respectively..
Dl D2
minor axes of the ellipse7
The cleavage planes were always (001)9 as expected. If
the resolved normal stress law is to be verified, then plotting
the resolved normal stress for fracture versus the angle 6
should yield a horizontal straight line. The data for th~
large specimens me plotted in Fig. 72. The scatter is quite
marked among the virgin specimens (not prestrained). The
value for A-10 is 107000 psi greater than the mean value for
the virgin specimens. Considering the virgin specimens alone,
the trend would be decreasing RNS with increasing angle.
Since increasing angle means increased ratio of shear to
normal stresses and hence increased tendency for slip9 the RNS
might be expected to increase if the fracture were propagating
through a region strain-hardenedby slip. The very inhomogeneous
nature of slip along the gauge length, however, could provide that7
—
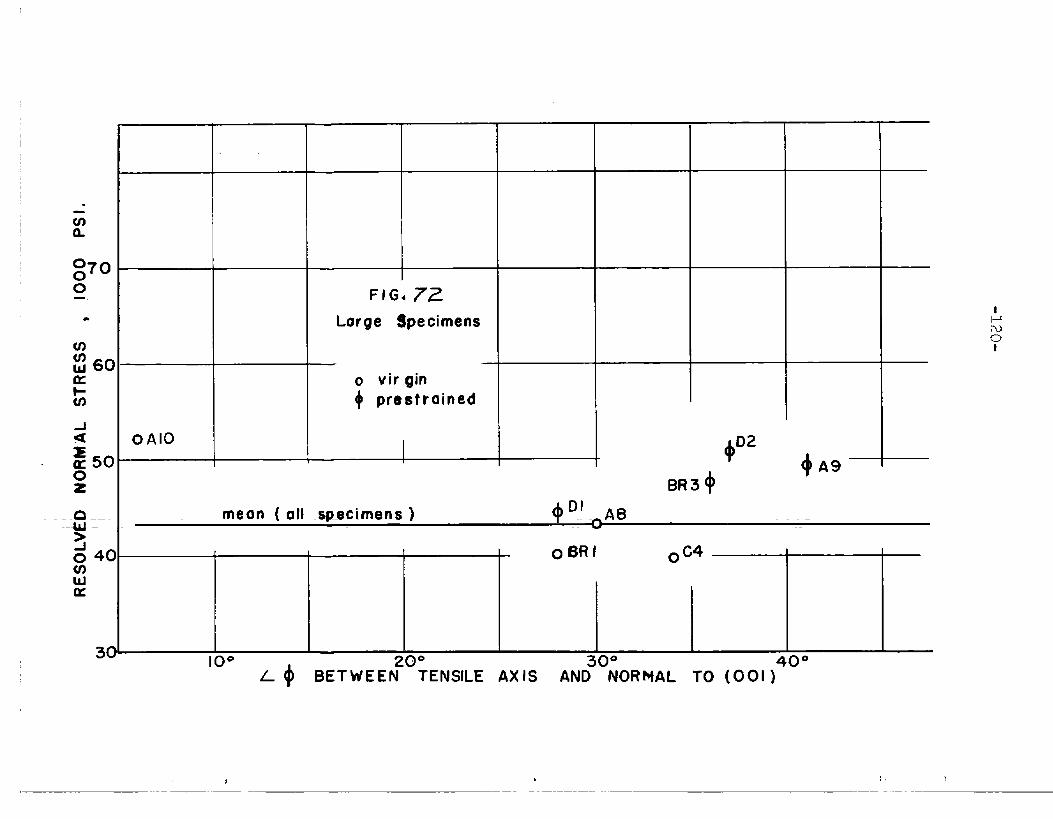
I
g?oo
6C
50
4C
3(
Lurge $pecimens
o virgin
~ pf@stroined
oAIO ,1
.BR3$
meon ( 011 .sp.ecimens ) + ‘-! -OA8
to” 30° 40°~ + BET WE E~20;E~SlLE AXIS AND NORMAL TO (001)
L-J
-121-
although large amounts of shear had Ocmrredl the fracture
could occur in a region where the slip was negligible.
The prestrained specimens again refute the argument
that a downward trend of the curve should obtain. These
prestrained specimens were pulled about 4Z elongation at room
temperature so that some slip should have occurred at all parts
of the gauge length regardless of the degree of inhomogeneity
of the deformation. When tested to fracture at -1960c, the
RNS values lie approximately ~000 to 6000 psi above the virgin
mean curve. Hence when the fracture is forced to occur in a
region where slip induced by prestrain has occurred? the RNS
at fracture is raised. The high RNS value of A-10 is then to
be regarded as scatter due to material variables.
Small SDecimens
The orientations of the small specimens are given in Figs.
69 and 70* Twenty-six specimens in this series were fractured
at -196@c0 The test methods for this group were modified by
the results of the studies on the large specimens. First, all
the specimens were plotted in one unit triangle for comparison.
They were then separated into pairs of the same or similar
orientation. One group (Fig. 70) was designated to be pre-
strained slightly past the yield point at room temperature and
then fractured at liquid nitrogen temperature. The other group
(Fig. 69) was to be tested directly at -196”C. The complete
-
-122-
series of results for these specimens is given in Table X.
The symbols are defined as follows:
Where broke at neck:: elsewhere
Type of Fracture - brittle: - ductileB&D - pronounced neck with cleavage
plane
13rittleFractures
Twelve specimens broke in what has been previously defined
as a brittle fracture, or cleavage. The resolved normal stresses
for these were calculated and are plotted in Fig. 73. Just as
for the large specimens, the scatter is quite large. These small
specimens were given a taper so that a reduced section existed
at the center whose diameter was .00~ to .005 inch less than the
rest of the specimen. This was done so that slip resulting from
prestrain or from ‘tat-temperatureltductility would be forced to
occur at a given point, and so that fracture would also OCCUT at
that same point. Thus the fracture would always be made to
propagate through a region that had undergone slip if such slip
Md taken place. The severity of the taper was not sufficient
to effect the predicted behavior as shown by the column of
“where broke~’in Table X. Again the brittle specimens tended
to break randomly throughout the gauge length.
The resolved normal stress for fracture of specimen 12 was
raised by prestrain, while two othersg 15 and 24, was lowered.
At first this seems incompatible. However, 12 broke at the neck
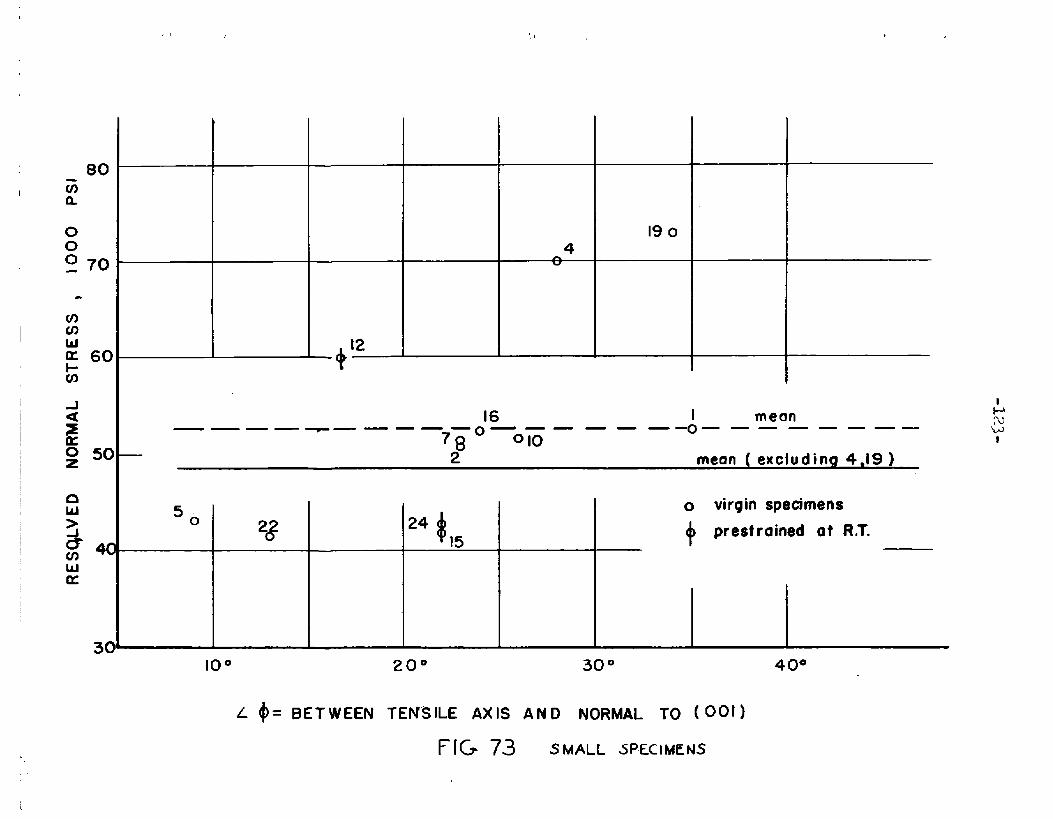
1
I
I
0 70
6C
5(
3(
\
+
12—
4190
I meon—— . . ~———— — ——— —
7Q 0 —o 10—–o——————— —
—2- meon ( excluding 4.19)
Lxl‘u!
50
10°
~ $=
24$ 15
20°
BETWEEN TENSILE AXIS
FIG 73
0 virgin specimens
+prestrained at RiT.
300 40”
AND NORMAL TO (Oot)
SMALL SPECIMENS
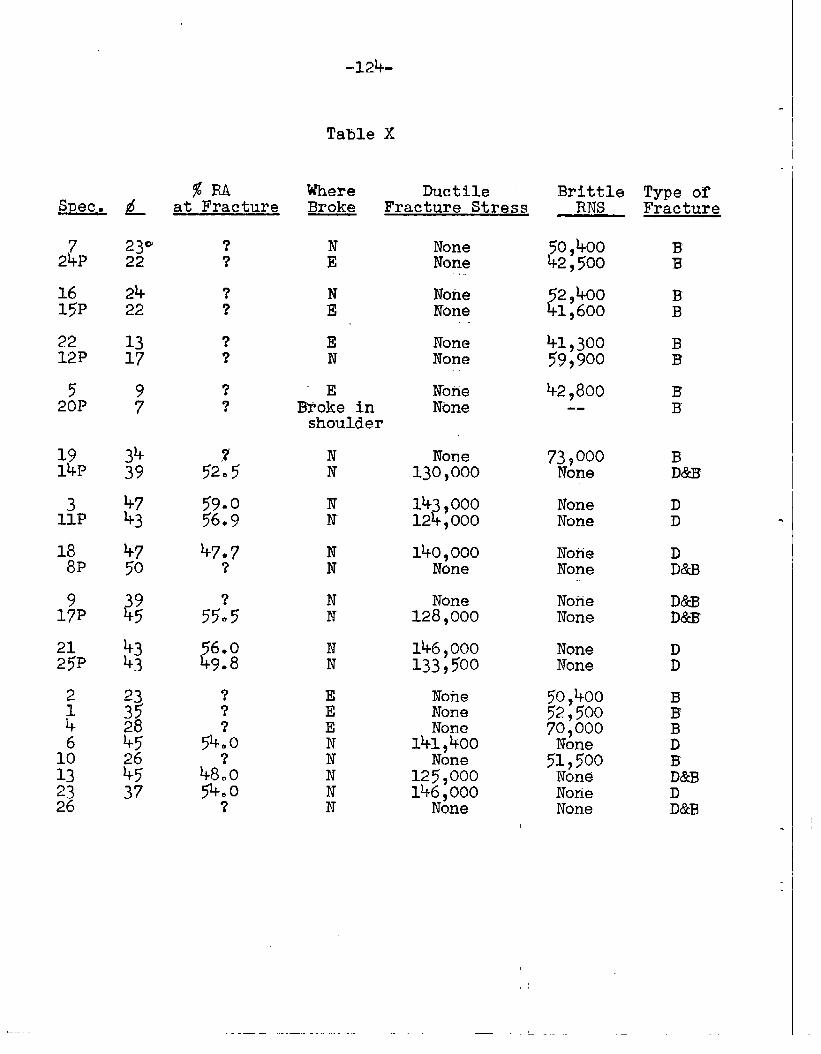
-l@t-
Table X
Where Ductile BrittleBroke Fracture Stress RNS
Type ofFracture
$RAat FractureSEE!&
72%P
1615P
2212?
520P
19lQP
311P
188P
917P
212JP
:b6
10132326
L
23022
2422
1317
97
3439
4743
4750
?95
4343
233528;~
4537
?7
??
??
??
:
:
EN
‘EBloke inshoulder
NN
NN
NN
NN
NN
EEENNNNN
NoneNone.,..
50,40042,500
BB
52,40041,600
Noi-ENone
BB
41,30059, 9~o
NoneNone
BB
42,8oo--
NoiieI’bne
BB.
?52.5
59.056.9
47*7?
55:5
56.049.8
??
54:0
480054.0
?
None130,000 L&E14 ,000
z12 ,000NoneNone
DD .
lko ,000None
NoneNone
None128,000
NoneNone
D&BD&B
146,000133,500
None DDNone
NoiIe 50 +too52,50070,000None5;:lo
NoneNone
NoneNone
141,400None
125~ooo146,000
None
-125-
while 24 and 15 broke away from the neck. The fracture of 12
had to propagate through strain hardened material while in
specimens 15 and 24 it did not necessarily, depending on the
uniformity of the prestrain.
The mean level of resolved normal stress for the small
specimens is about 5000 psi higher than for the large, thus
indicating a size effect in this material. Two specimens b
and 19, are seen to be several thousand psi above the others.
Rough measurements of ductility at the fracture show that
these two specimens have reductions in area at the fracture
in the range 10 to 13 percent while the others are roughly
O to 4 percent. Accurate values of reduction in area at the
fracture would be desirable since Steijn (14) found increas-
ing cleavage stress for increased ductility at the fracture.
Reductions in area at the neck were calculated, but they are
of little or no meaning and showed no correlation with the
resolved normal stress for fracture. Reductions in area at
the fracture were impossible to measure since the original
area of
Ductile
It
ductile
Figures
the specimens at the fracture point was not known.
Fractures
is seen from Table X that for specimens where A735~
fractures were obtained. The great circle through
69 and 70 is the 35 degree boundary region. Although
prestraining inhibited twinning prior to fracture in these
-126-
specimens, it did not prove to benefit the cause of brittle
fracture in a specimen for 6735°. In some cases, however,
prestraining did cause fracture to occur on a more or less
planar surface even though the ductility at the neck was on
the order of 35 to 50 percent R*A. No optical or X-ray
measurements could be obtained for these specimens. “Their
fractures were classed as D and E (ductile and brittle).
X-ray photograms of the ductile specimens yielded
complete diffraction rings indicating that the severe dis-
tortion at the neck had caused the specimens to fragment so
severely that they approached polycrystalline properties.
The curve of fracture stress versus reduction of area at
the fracture for the ductile specimens bears this out.
(See Fig. 74.) This plot is similar to those obtained for
polycrystalline metals. Conflicting data are reported on
the effect of prestrain on the fracture stress of ductile
materials. Some report prestraining increases the fracture
stress; others report a decrease. No explanations are given.
The downward trend of the curve for prestrained specimens
has no obvious significance. There is a possible explanation
for the lower values of the prestrained specimens. Since the
shear given a specimen at room temperature can be applied at
a low stress level if the criterion for ductile fracture is
a given amount of shear, then less shear is needed to complete
the fracture requirement at low temperatures.
.-
.
I
.
-.
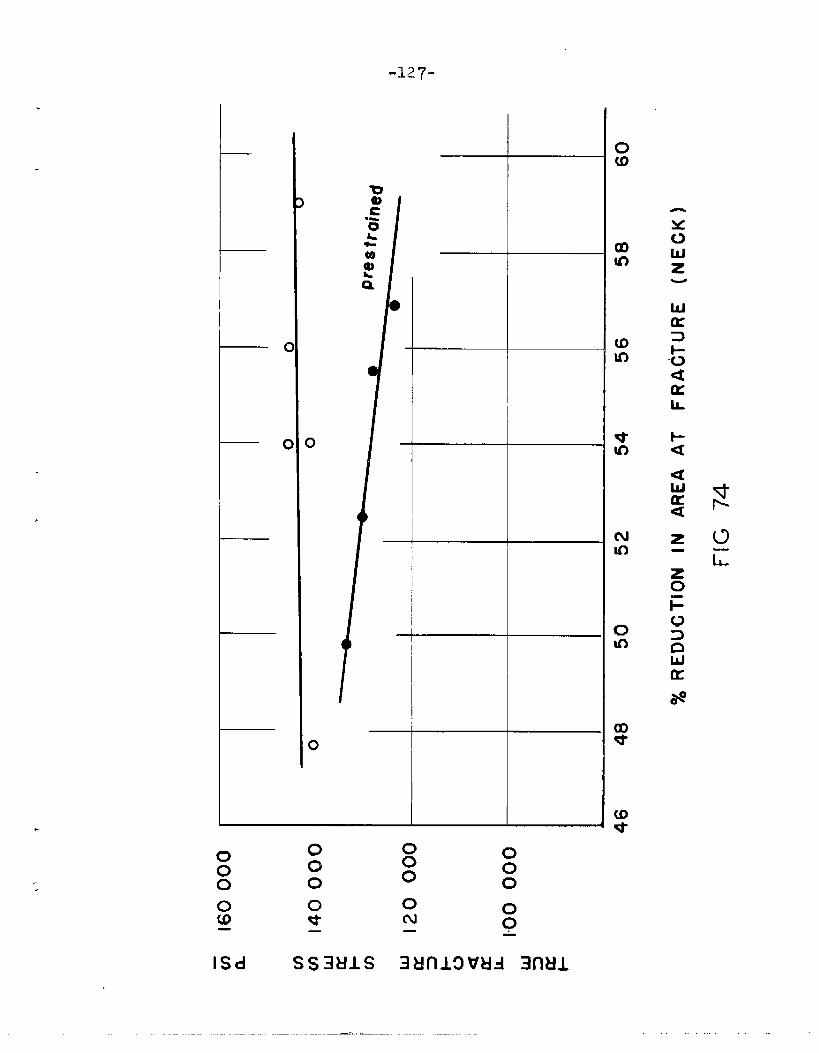
o
I
o
g o 0 0* N o— -
lSd Sslklls 3unL9v&ld mtll
zwz
4aIL
1-a
*
*
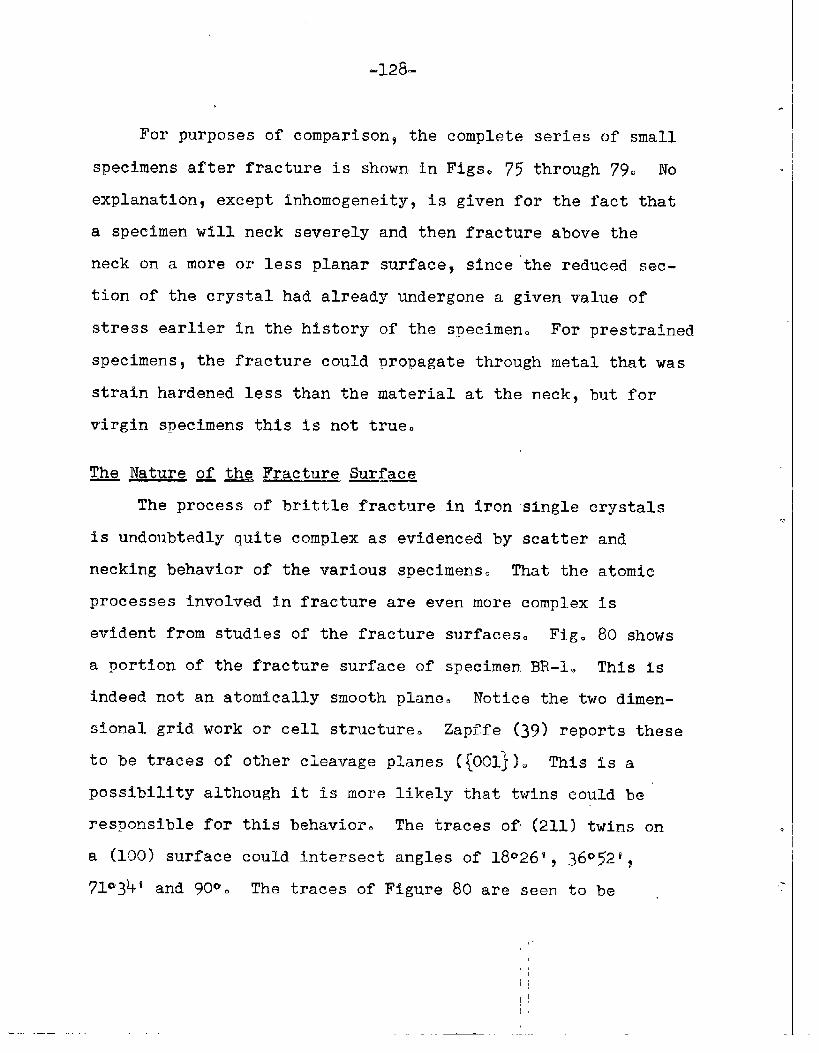
-128-1
For purposes of comparison~ the complet~ series of small
specimens after fracture is shown in Figs. 75 through 79. No
explanation, except inhomogeneity, is given for the fact that
a specimen will neck severely and then fracture above the
neck on a more or less planar surface, since the reduced sec.
tion of the crystal had already undergone a given value of
stress earlier in the history of the specimen. For prestrained
specimens? the fracture could propagate through metal that was
strain hardened less than the material at the neck, but for
virgin specimens this is not true.
The Nature of the Fracture Surface.— ——
The process of brittle fracture in iron single crystals
is undoubtedly quite complex as evidenced by scatter and
necking behavior of the various specimens. That the atomic
processes involved in fracture are even more complex is
evident from studies of the fracture surfaces. Fig. 80 shows
a portion of the fracture surface of specimen.BR-I. This iS
indeed not an atomically smooth plane. Notice the two dimen-
sional grid work or cell structure. Zapffe (39) reports these
to be traces of other cleavage planes ({001]). This is a
possibility although it is more likely that twins could be
responsible for this behavior. The traces of (211) twins on
a (100) surface could fntersect angles of 18026~, 36Q52~$
71°34~ and 90~0 The traces of Figure 80 are seen to be
.——
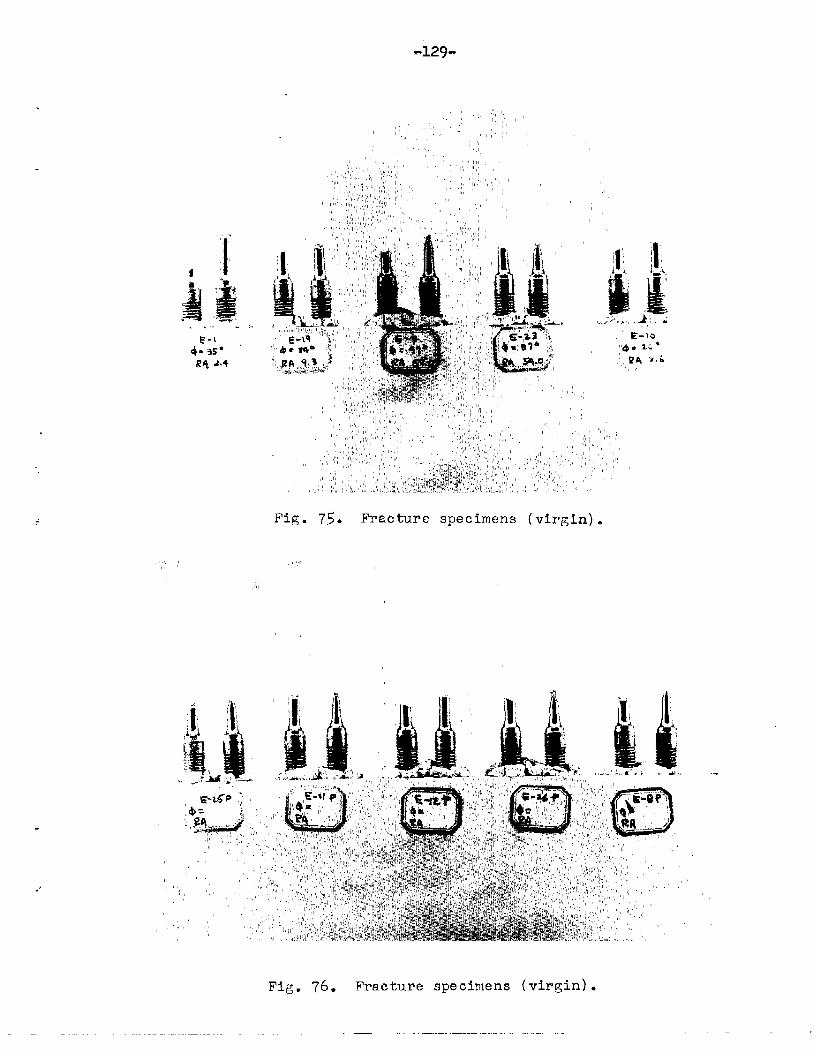
,,‘l’
,1!,
,“
,,
Fi~. 75. Fracturespecimens(virgin).
,,’,1,
Fig. 76. Fractxl?e specimens (virgin).
.-
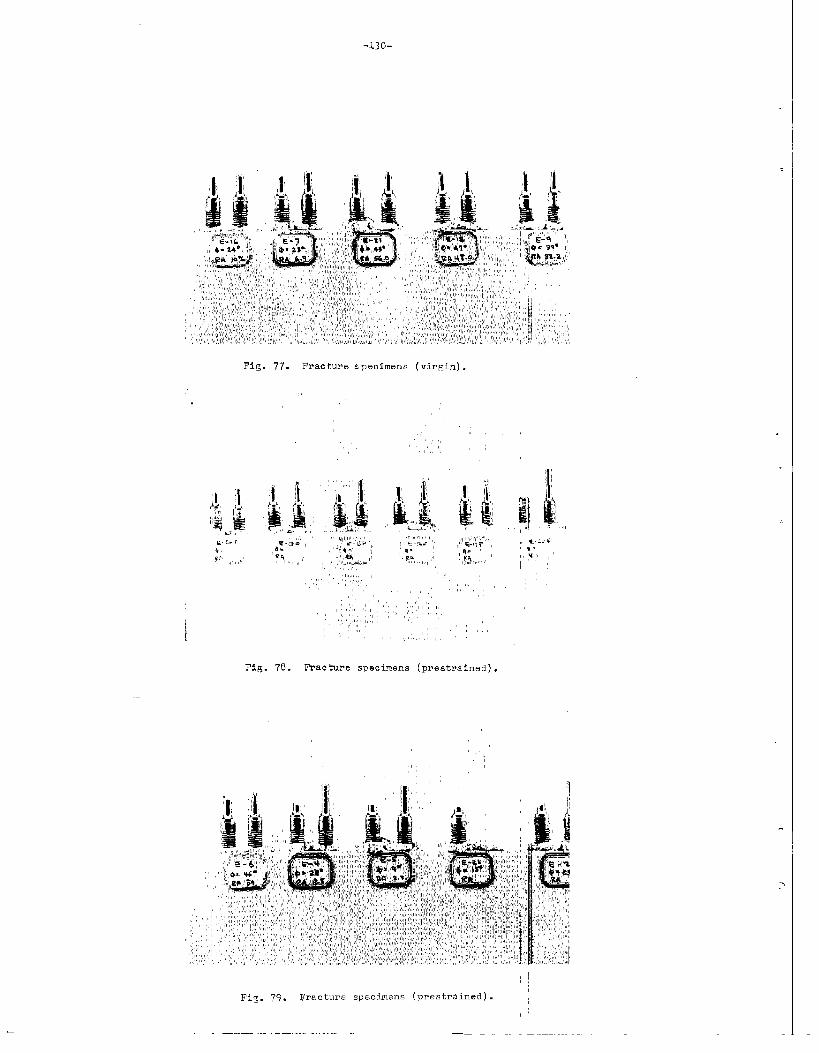
-130-
(virgin).
‘1
,,,,,
,,,
,,
Fig. 76. Fracture specimens (restrained) .
IJi~. 79. Fracture specimens
,,
.“,
(restrained). ~
,,
———— .
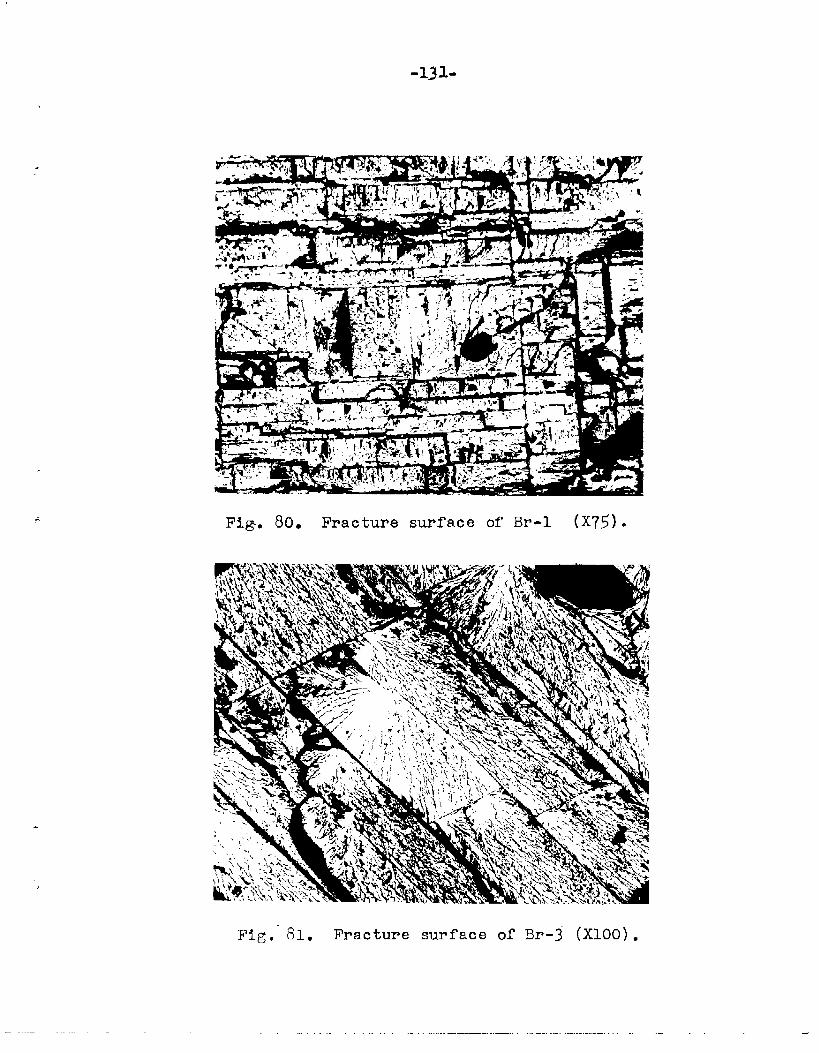
-131-
Fig+.80. Fracinme surface of Br-1 (x75) ●
Fig.-81. Fracture surface of Br-3 (X1OO).
.-. .+
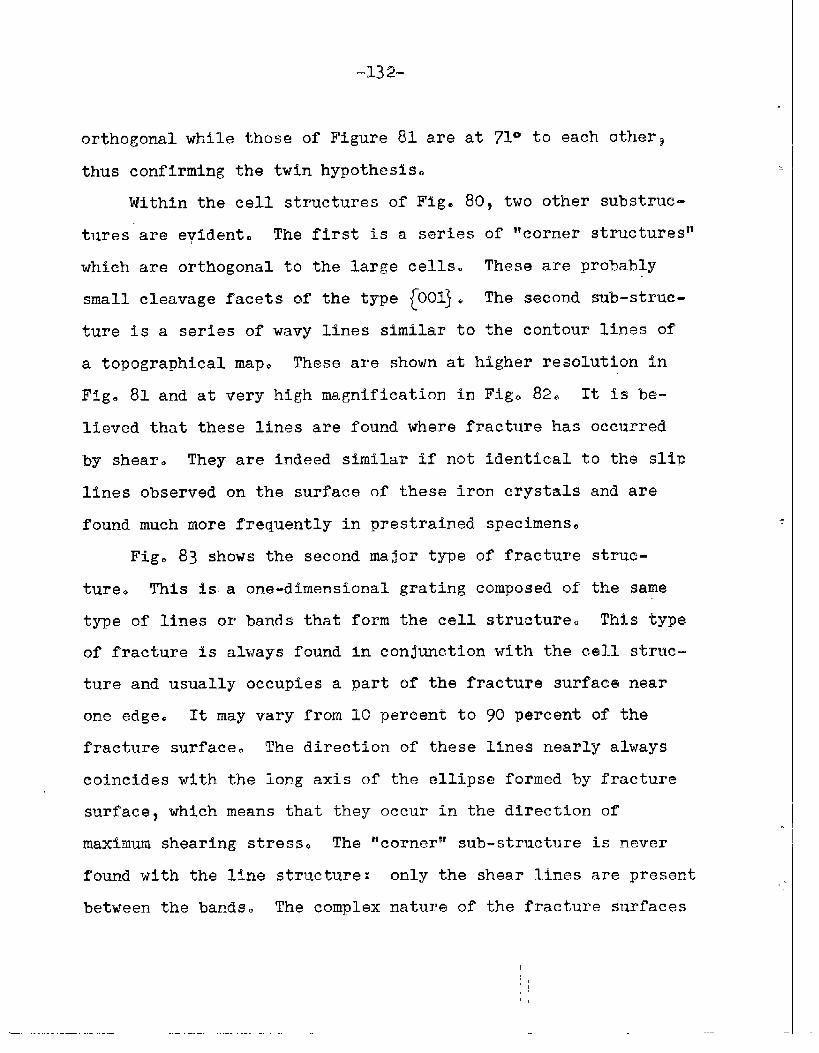
-132-
orthogonal while those of Figure 81 are at 71° to each other~
thus confirming the twin hypothesis.
Within the cell structures of Fig. 80, two other substruc-
tures are evident. The first is a series of “corner structures!’
which are orthogonal to the large cells. These are probably
small cleavage f’acetsof the type {001~. The second sub-struc-
ture is a series of wavy lines similar to the contour lines of
a topographical map. These are shown at higher resolution in
Fig. 81 and at very high magnification in Fig. 82. It is be-
Meved that these lines are found where fracture has occurred
by shear. They are indeed similar if not identical to the slip
lines observed on the surface of these iron crystals
found much more frequently in prestrained specimens.
Fig. 83 shows the second major type of fracture
ture. This is a one-dimensional grating composed of
type of lines or bands that form the cell structure.
and are
struc-
the same
This type
of fracture is always found in conjunction with the cell struc-
ture and usually occupies a part of” the fraetwe surface near
one edge. It may vary from 10 percent to 90 percent of the
fracture surface. The direction of these lines nearly always
coincides with the long axis of the ellipse formed by fracture
surface$ which means that they occur in the direction of
maximum shearing stress. The “corner$’sub-structure is never
found with the line
between the bands.
structure: only the shear lines are present
The complex nature of the fracture surfaces
,.
——. -.
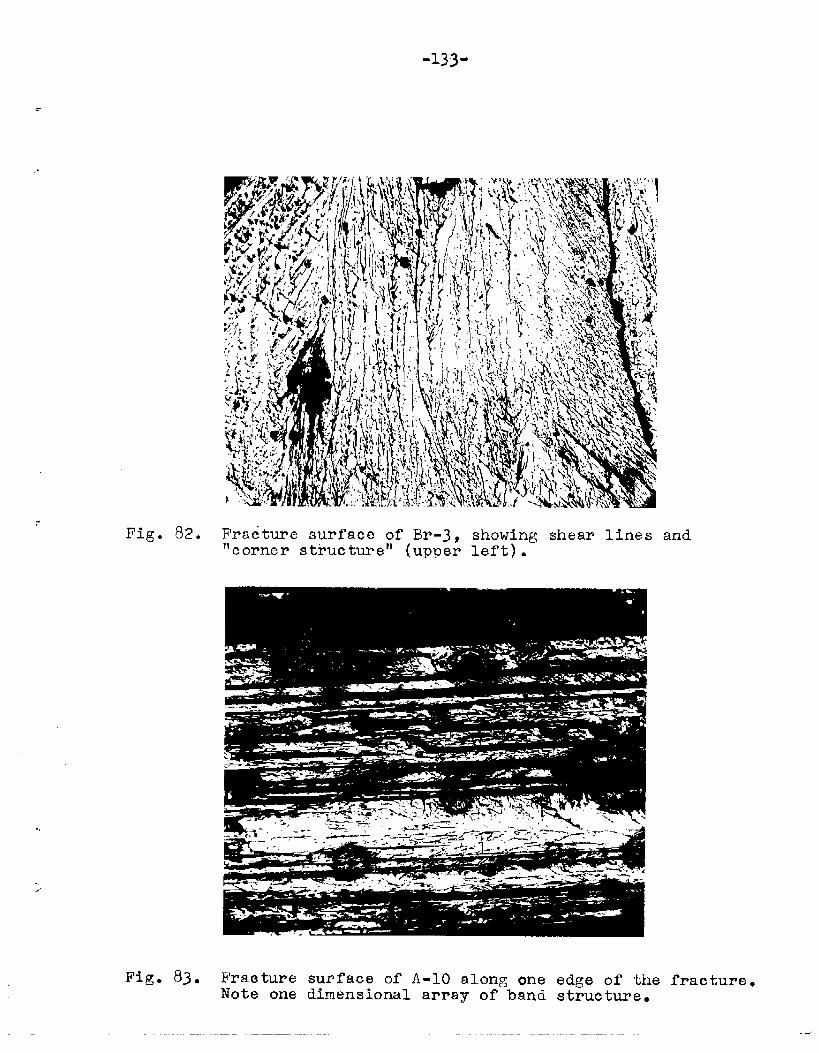
-133-
Fig. 82. Fracture surface of BP-3. showing shear lines and“corner structure” (uppe+ left).-
.
.,.
Fig. 83. Fraoture surface of A-10 along one edge of theNote one dimensional array of band structure.
fracture.
-134-
confirms the observation that the mechanism of brittle fracture
in iron is not due to a single stress criterion and hence the
scatter in the RNS data is to be somewhat expected. The ductility
of this material appears to be very high at -196°C; however~ it
should be remembered that this is a very slow strain rate, 0.01
inch per minute. Increasing the strain rate by a factor of
seven such as done by Steijn (14) could cpnsMerably lessen the
effect of a shear stress, thereby reducing the scatter in the
resolved normal stress law and perhaps changing the appearance
of the fracture surfaces. Had the very ductile nature of this
material at this strain rate and low temperature been anticipated
one or the other would certainly have been changed. It would be
most desirable
strain rate.
One would
to lower the temperature but easier to raise the
expect increased strain rates to increase the
tendency for brittle fracture~ perhaps so much that every orien-
tation in the unit triangle would fracture brittlely with even
zero ductility at the fracture. Lower strain rates should
decrease the brittleness but reduce the scatter. It appears
that the combination of materialj strain rate and tempera-
ture was unfortunate in that it caused the behavior to
fall in
be very
yielded
ductile
a transition region where scatter is knbwn to
high. Increased or decreased strain rate would have
more precise information on either the brittle or
behavior of these crystals yet it would not have yielded
-..
,..
.- —
-135-
1
so
1.
2.
3.
many interesting and intriguing results.
●
CONCLUSIONS
The integrated glide ellipse can occupy any position in the
<Ul)zone. Deviations from the three low index planes~~110}3
[112], and ~123} are real and cannot be accounted for by
experimental error.
The selection of the glide ellipse is determined by the
relative shearing strengths along the (111> zone and the
position of the maximm shear stress
slip.direction. The distribution of
along the <111> is markedly affected
temperatures increasing the shearing.-
plane containing the
shearing strengths
by temperature; lower
strengths near {112]
more than those near ~110~ , thus low temperatures favor
{110} slip regardless of the distribution of the applied
stress.
The critical resolved shear stress law isa valid criterion
for slip in iron on a experimental basis. The measurements
are too coarse to detect the effect of a normal stress.
This critical shear stress is found to vary only slightly
with temperature in the range O to 200 degrees Centigrade
but to increase rapidly from 00 to liquid nitrogen tempera-
tures.
.— .,
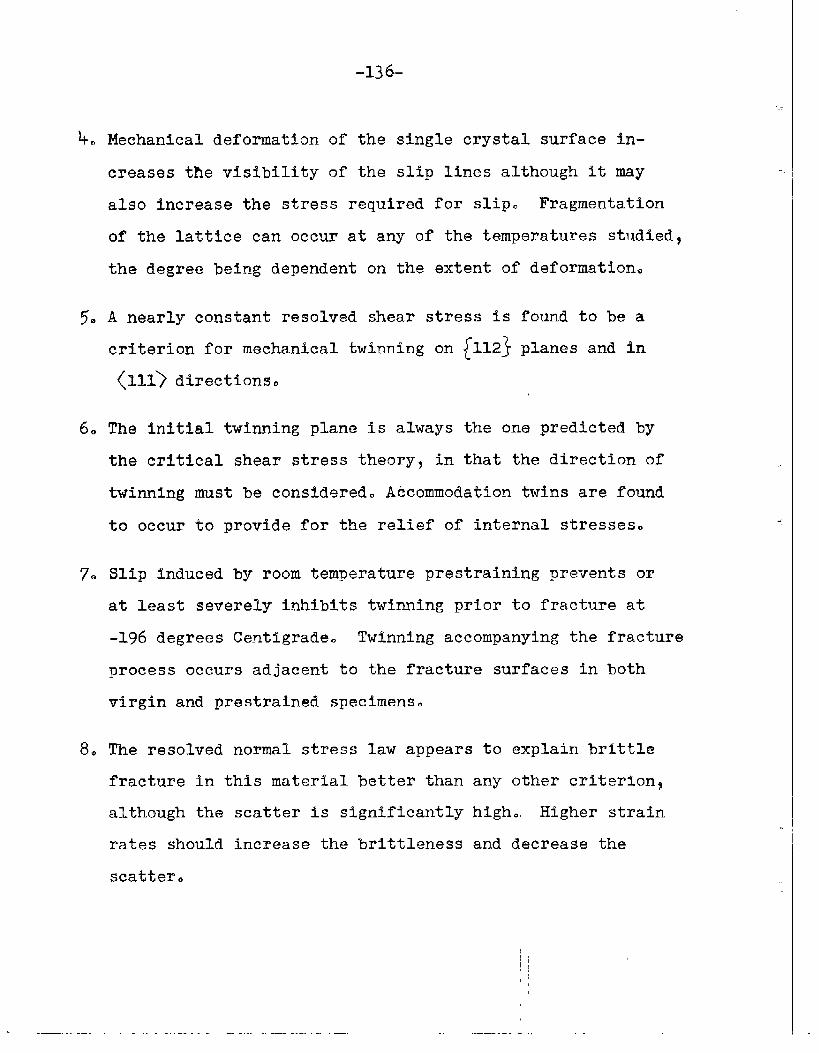
-136-
4. Mechanical deformation of the single crystal surface in-
creases the visibility of the slip lines although it may
also increase the stress required for slip. Fragmentation
of the lattice can occur at any of the temperatures studied?
the degree being dependent on the extent of deformation.
5. A nearly constant resolved shear stress is found to be a
criterion for mechanical twinning on [112} planes and in
(111> directions.
6. The initial twinning plane is always the one predicted by
the critical shear stress theory, in that the direction of
twinning must be considered. Accommodation twins are found
to occur to provide for the relief of internal stresses.
7. Slip induced by room temperature prestraining prevents or
at least severely inhibits twinning prior to fracture at
-196 degrees Centigrade. Twinning accompanying the fracture
process occurs adjacent to the fracture surfaces in both
virgin and prestrained specimens.
8. The resolved normal stress law appears to explain brittle
fracture in this material better than any other criterions
although the scatter is significantly high. Higher strain
rates should increase the brittleness and decrease the
scatter.
.-
.,
,1
I
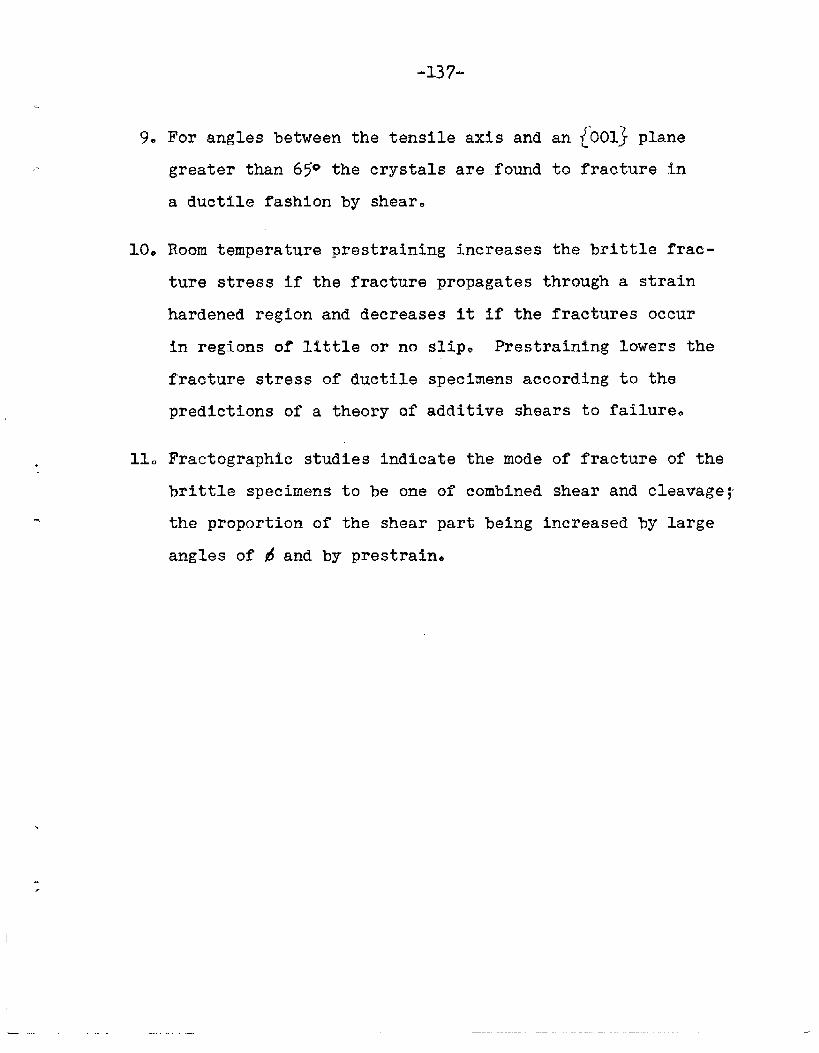
-137”
9. For angles between the tensile axis and an {001~ plane
greater than 65@ the crystals are found to fracture in
a ductile fashion by shear.
10. Room temperature prestraining increases the brittle frac-
ture stress if the fracture propagates through a strain
hardened region and decreases it if the fractures occur
in regions of little or no slip. Prestrainfng lowers the
fracture stress of ductile specimens according to the
predictions of a theory af additive shears to failure.
11. Fractographic studies indicate the mode of fracture of the
brittle specimens to be one of combined shear and cleavage;
the proportion of the shear part being increased by large
angles of $ and by prestrain.
—
-138-
ACKNOWLEDGMENT
The author wishes to express his sincere thanks to his
advisors, Dr. R~ F. Mehl and Dr. G. T. Home, paedago~i; for
their invaluable technical assistance and moral support.
To Mrs. C. S. Yang and Mr. Y. T. Chou for their ~ommand
performance of the X-Ray and metallographic work and for thei~
willingness to comply with the authors every whimsy--deepest
gratitude.
To Admiral J. W. Ludewig for his guidance in matters of
administration and protocol, and to the several members of the
Metals Research Laboratory whose cooperative efforts contrib-
uted to the completion of this endeavor--many thanks.
Finally, to Drs. 0. T. Marzke, J. R. Low? W. Hibbard
and Finn Jonassen, members of the project advisory committee$
for their help, patience and understanding the author wishes
to express his appreciation.
This research was made possible by contract NObs-50230
SR-108 Bureau of Ships, Department of the Navy.
L. —
-+“.
-139-
BTB%IOGRAPHY
,-,-
10 Bkrrett, C. So% The Structure of l=letals~2nd. EditionaMcGraw-Hilla New York (1953).
2. Taylora Go 1. and Elama C. F.:- Proceedings of the RoyalSociety of London A112 (1928) p. 337.
3. Taylor, G. I.% Proceedings of the Royal Society of LondonA118 (1928) P I.
k. Fahrenhorst, N. and Schmid E. % Zeitschrift f~r Physik ~(1932) p 383.
50 Barrett, C. S., Ansel, G., and Mehl, R. F.: Transactionsof the American society for Metals ~ (1937) p 7020
6* Chen~ N. K. and Maddin R.: Transactions AIME ~ (1951)p 9370
7. Opinsky, A. and Smoluchowski3 R. : Plastic Deformation ofCrystalline Solids, Mellon Institute Symposium (1950).
8. Opinskya A. and Smoluchowski5 R.: Journal of Applied Physics& (1951) p 1488.
9. Vogal~ F. L. and BYickr R, M.% Technical Report #2 (NCRRm)Flight Research Laboratory, W-P Air Force Base, ContractAF33(038)-15889.
10. Seitz F. and Readg T. A.s Journal of Applied Physics XII~~941~ p 538.
11. Taylora G. 1.: Proceedings of the Royal $ociety of kndonCXLV (1934) p 362*
120 Cottrell, A. H.: Progress Tn Metal Physicsa Vol. T Inter-science publishers~ New York (1949).
130 Chalmers~ B. and Martius, U. Mm% Proceedings of the RoyalSociety of London A213 (1952) P 176.
14. Steijn5 R. and IWick, R. M.,: Technical Report #2 (NCRRL)Flight Research Laboratory, W-P Air Force Easez ContractAF33(038)-15889.
15. Evansa J. N.: Proceedings of the Royal Society of EdinburghQ (1912) P416.
16.
17*
18.
19 e
200
210
220
230
2k .
25.
26.
27.
28 e
29.
30.
31.
32.
33 Q
34.
-140”
Prestona G. D.: Naturea Londonz ~ (1927) p 176.
Mathewsona C. H. and Edmunds, G. H.: Transactions AIME (1928). “
Clark, R. and Craig~ G. B.: Twinninga Progress in MetalPhysics, Interscience, London (1952).
Barrett, C. S.: Cold Working of Metals Symposium3 ASM (1948)O
Schmid, E. and Boas? R.: Plasticity of Crystals, London(translation from the German) (1950).
Gough, H. J. and Cox H. L.: Proceedings of the Royal Societyof London ~ (1929~.
Gough, H. J. and Cox H. L.: Proceedings of the Royal Societyof London A127 (1930!0
Yakovleva and Yakutovitch* Experimental and TheoreticalPhysics, USSRQ (1930].
King, R.: Nature~ London~ (1952) p fi3.
Chalmersa B: Proceedings of the Royal Society of London ~(19351 p 7330
Low? Jr.~ J. R.: Acts Metallurgic ~ (1953).
Paxtona H.s Acts Metallurgic ~ (1953] p 141.
Ludwik, P.: Elemente der Technologischen Mechanik, SpringeraBerlin (1909).
Holloman$ J. H.: Fracture of Metals Symposium, AmericanWelding Society~ New York (1946).
Holloman. J. H. and Jaffe. L. D.: Ferrous Metall.ur~icalDesign, ~.
Zener, C.:
Sachs, G.:symposium?
Zener. Co:
Wiley & Sons~ fiewYork (19%7).
Revue of Modern Physics U (~%j].
Effect of Strain on Fracture, Fracture of MetalsASM (1947)0
11’heMicrornechanismof Fracture~ Fracture ofMetal; Symposium, ASM (194-7).
#
Low? Jr., J. R.: Private Communication. -.
.—-...
-141-
35. Jacquet9: Voluminous References to Electropolishing~Comptes Rendus.
36. Greninger, A. B.,% Transactions ATME~ (1935) P 610
37. Opinsky, A. J.a$ Doctorate Thesisy Carnegie Institute ofTechnology (1950).
38. Paxton~ H.~ Private Communication.
39. Zapffeq C. A.~: Voluminous References on Fractographyof Metals.
.