critical reviews in environmental science and technology phosphorous cycling...
TRANSCRIPT

PLEASE SCROLL DOWN FOR ARTICLE
This article was downloaded by:On: 3 March 2011Access details: Access Details: Free AccessPublisher Taylor & FrancisInforma Ltd Registered in England and Wales Registered Number: 1072954 Registered office: Mortimer House, 37-41 Mortimer Street, London W1T 3JH, UK
Critical Reviews in Environmental Science and TechnologyPublication details, including instructions for authors and subscription information:http://www.informaworld.com/smpp/title~content=t713606375
Phosphorous Cycling in the Greater Everglades Ecosystem: LegacyPhosphorous Implications for Management and RestorationK. R. Reddya; S. Newmanb; T. Z. Osbornea; J. R. Whitec; H. C. Fitzad
a Wetland Biogeochemistry Laboratory, Soil and Water Science Department, University of Florida,Gainesville, FL, USA b Marsh Ecology Research Group, Everglades Division, South Florida WaterManagement District, West Palm Beach, FL, USA c Wetland and Aquatic Biogeochemistry Laboratory,Department of Oceanography and Coastal Sciences, Louisiana State University, Baton Rouge, LA, USAd Soil and Water Science Department, Ft. Lauderdale Research and Education Center, University ofFlorida, Ft. Lauderdale, FL, USA
Online publication date: 19 February 2011
To cite this Article Reddy, K. R. , Newman, S. , Osborne, T. Z. , White, J. R. and Fitz, H. C.(2011) 'Phosphorous Cycling inthe Greater Everglades Ecosystem: Legacy Phosphorous Implications for Management and Restoration', Critical Reviewsin Environmental Science and Technology, 41: 6, 149 — 186To link to this Article: DOI: 10.1080/10643389.2010.530932URL: http://dx.doi.org/10.1080/10643389.2010.530932
Full terms and conditions of use: http://www.informaworld.com/terms-and-conditions-of-access.pdf
This article may be used for research, teaching and private study purposes. Any substantial orsystematic reproduction, re-distribution, re-selling, loan or sub-licensing, systematic supply ordistribution in any form to anyone is expressly forbidden.
The publisher does not give any warranty express or implied or make any representation that the contentswill be complete or accurate or up to date. The accuracy of any instructions, formulae and drug dosesshould be independently verified with primary sources. The publisher shall not be liable for any loss,actions, claims, proceedings, demand or costs or damages whatsoever or howsoever caused arising directlyor indirectly in connection with or arising out of the use of this material.

Critical Reviews in Environmental Science and Technology, 41(S1):149–186, 2011Copyright © Taylor & Francis Group, LLCISSN: 1064-3389 print / 1547-6537 onlineDOI: 10.1080/10643389.2010.530932
Phosphorous Cycling in the Greater EvergladesEcosystem: Legacy Phosphorous Implications
for Management and Restoration
K. R. REDDY,1 S. NEWMAN,2 T. Z. OSBORNE,1 J. R. WHITE,3
and H. C. FITZ1,4
1Wetland Biogeochemistry Laboratory, Soil and Water Science Department,University of Florida, Gainesville, FL, USA
2Marsh Ecology Research Group, Everglades Division, South Florida Water ManagementDistrict, West Palm Beach, FL, USA
3Wetland and Aquatic Biogeochemistry Laboratory, Department of Oceanographyand Coastal Sciences, Louisiana State University, Baton Rouge, LA, USA
4Soil and Water Science Department, Ft. Lauderdale Research and Education Center,University of Florida, Ft. Lauderdale, FL, USA
Phosphorus (P) retention in wetlands is an important function ofwatershed nutrient cycling, particularly in drainage basins withsignificant nonpoint nutrient contributions from agriculture andurban sources. Phosphorus storage involves complex interrelatedphysical, chemical, and biological processes that ultimately retainP in organic and inorganic forms. Both short-term storage of P me-diated by assimilation into vegetation, translocation within above-and below-ground plant tissues, microorganisms, periphyton, anddetritus, and long-term storage (retention by inorganic and organicsoil particles and net accretion of organic matter) need to be con-sidered. Here, we review and synthesize recent studies on P cyclingand storage in soils and sediments throughout the Greater Ever-glades Ecosystem and the influence of biotic and abiotic regulationof P reactivity and mobility as related to restoration activities insouth Florida. Total P storage in the floc/detrital layer and surfacesoils (0–10 cm) is estimated to be 400,000 metric tons (mt) withinthe entire Greater Everglades Ecosystem, of which 40% is presentin the Lake Okeechobee Basin (LOB), 11% in sediments of UpperChain of Lakes, Lake Istokpoga, and Lake Okeechobee, 30% in the
Address correspondence to K. R. Reddy, University of Florida, PO Box 110510,Gainesville, FL 32611-0510. E-mail: [email protected]
149
Downloaded At: 17:06 3 March 2011
150 K. R. Reddy et al.
Everglades Agricultural Area (EAA), and 19% in the StormwaterTreatment Areas (STAs) and the Everglades. Approximately, 35%of the P stored is in chemically nonreactive (not extractable aftersequential extraction with acid or alkali) pool and is assumed to bestable. Phosphorus leakage rates from LOB and EAA are approxi-mately 500 and 170 mt P per year, respectively, based on long-termP discharges into adjacent ecosystems. The estimated reactive P inthe LOB soils is 65% of the total P, of which only 10 –25% is assumedto leak out of the system. Under this scenario, legacy P in LOB wouldmaintain P loads of 500 mt per year to the lake for the next 20–50 years. Similarly, surface soils of the EAA are estimated to releaseapproximately 170 mt P per year for the next 50–120 years. Therole of the STAs in reducing loads to downstream regions is criticaland requires effective management of P forms to ensure the P is sta-bilized in these systems by the addition of chemical amendments orby dredging of accumulated soils. Also, additional efforts to mini-mize leakage of the legacy P from the northern regions should alsobe evaluated to reduce external P loading loads to the STAs.
KEYWORDS: inorganic phosphorus, internal load, organic phos-phorus, phosphorus loads, phosphorus memory, soils and sedi-ments
1 INTRODUCTION
The management of agricultural, forest, range, and urban lands play an inte-gral part in influencing soil and water quality within a watershed, especiallythe distribution of nutrients and contaminant loads. Wetlands are often therecipient of these nutrient and contaminant loads because of their positionin the landscape. Nutrient retention in wetlands is an important function inwatershed nutrient cycling, particularly in drainage basins with significantnonpoint nutrient contributions from agriculture and urban sources.
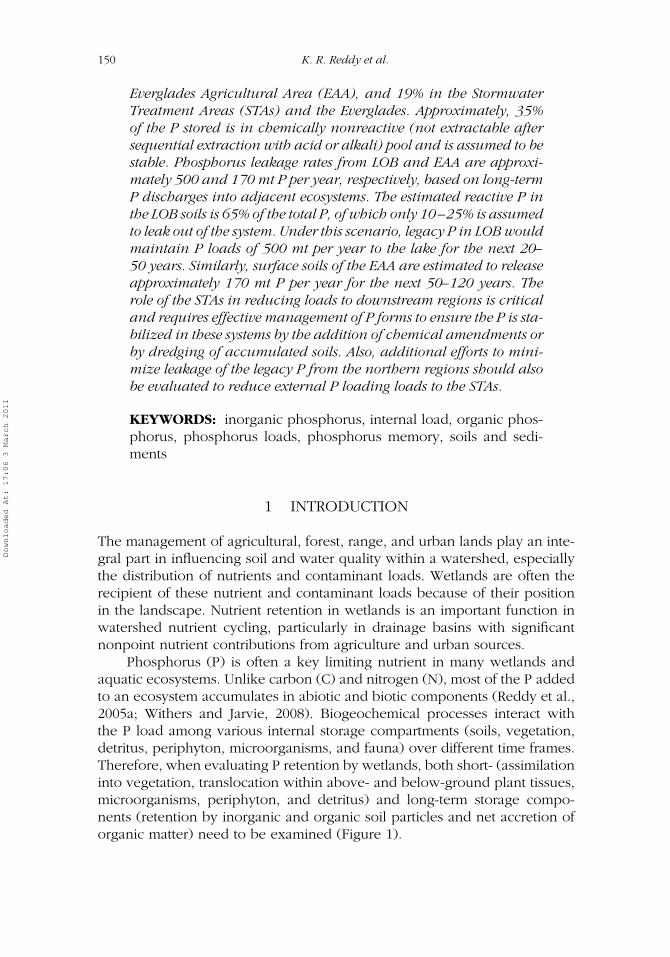
Phosphorus (P) is often a key limiting nutrient in many wetlands andaquatic ecosystems. Unlike carbon (C) and nitrogen (N), most of the P addedto an ecosystem accumulates in abiotic and biotic components (Reddy et al.,2005a; Withers and Jarvie, 2008). Biogeochemical processes interact withthe P load among various internal storage compartments (soils, vegetation,detritus, periphyton, microorganisms, and fauna) over different time frames.Therefore, when evaluating P retention by wetlands, both short- (assimilationinto vegetation, translocation within above- and below-ground plant tissues,microorganisms, periphyton, and detritus) and long-term storage compo-nents (retention by inorganic and organic soil particles and net accretion oforganic matter) need to be examined (Figure 1).
Downloaded At: 17:06 3 March 2011

Phosphorous Legacy 151
FIGURE 1. Schematic showing phosphorus cycle in wetlands. POP = particulate organicP; PIP = particulate inorganic P; DIP = dissolved inorganic P; DOP = dissolved organic P(Reddy and Delaune, 2008). (This figure is available in color online).
The Greater Everglades Ecosystem can be grouped into two distinct hy-drologic units: the Northern Everglades Ecosystem (NEE) and the SouthernEverglades Ecosystem (SEE; Figure 2), based on relative locations within thewatershed and different restoration goals. The NEE includes the: Upper Chainof Lakes Basin, Lower Kissimmee River Basin, Northern Lake OkeechobeeBasin, Lake Okeechobee, and basins associated with the Caloosahatchee andSt. Lucie Rivers. The SEE includes the Everglades Agricultural Area (EAA),Stormwater Treatment areas (STAs), Water Conservation Areas (WCAs), Ev-erglades National Park (ENP), Big Cypress National Preserve (BCNP), andFlorida Bay.
Historically, the major source of nutrients to the Greater EvergladesEcosystem was from atmospheric deposition, with minimum secondary nu-trient inputs through infrequent sheet flow across the northern Evergladeswetlands from Lake Okeechobee. Presently, approximately two thirds of theP load from Lake Okeechobee is discharged to the east and west to theSt. Lucie and Caloosahatchee estuaries, respectively. Agricultural and urbanintensification in the Greater Everglades Ecosystem have led to excessivenutrient loads to natural systems contained within the region. For example,over the past three decades, total P loads to Lake Okeechobee were in ex-cess of 500 mt per year, with the exception of four dry years (McCormicket al., 2010). These loads are approximately 3.6 times the annualized TotalMaximum Daily Load (TMDL) of 140 mt per year. Approximately one thirdof the P load from Lake Okeechobee enters the EAA and other small basins,
Downloaded At: 17:06 3 March 2011

152 K. R. Reddy et al.
FIGURE 2. Map showing various hydrologic units that were sampled in the Northern Ev-erglades Ecosystem (NEE) and Southern Everglades Ecosystem (SEE). In the NEE, the LakeOkeechobee Basin (LOB) is the sum of the Upper Chain of Lakes Basin, Lake IstokpogaBasin, and the Northern Lake Okeechobee Basin. The larger Northern Lake OkeechobeeBasin (Table 1) includes the Lower Kissimmee, Indian Prairie/Harney Pond, Fisheating Creek,Taylor Creek/Nubbin Slough, and Okeechobee misc. Basins. In the SEE, the mangrove regionand Florida Bay were not included in the sampling. EAA = Everglades Agricultural Area;STAs = Stormwater Treatment Areas; WCAs = Water Conservation Areas; BCNP & other =Big Cypress National Preserve, including a northern sub-area outside of the Preserve; ENP =Everglades National Park freshwater wetland area.
Downloaded At: 17:06 3 March 2011

Phosphorous Legacy 153
which contribute P loads downstream to the WCAs. The P load from theEAA basin to the WCAs during the past three decades was estimated as 170mt per year (Van Horn and Wade, 2010).
Autochthonous nutrient inputs into the WCAs have resulted in signif-icant alterations to the indigenous system with large expansions of cattail(Typha domingensis) replacing the predominant plant communities (Craftand Richardson, 1997; Daoust and Childers, 2004; Davis, 1991; Davis, 1994;Noe et al., 2001; Newman et al., 1998; Richardson et al., 2008; Sklar et al.,2005). Extensive documentation of the temporal and spatial distribution ofsoil nutrients across the northern marshes of the Everglades has delineatedareas with highly P-enriched conditions near the source and P-limiting con-ditions further from these inputs (Bruland et al., 2007; Childers et al., 2003;Corstanje et al., 2006; Craft and Richardson, 1993a, 1993b; DeBusk et al.,1994, 2001; Marchant et al., 2009; Newman et al., 1997; Reddy et al.,1993;Rivero et al., 2007; Scheidt and Kalla, 2007). Between these two extremesthere exists a gradient in quality and quantity of organic matter, nutrientaccumulation, microbial communities and biogeochemical cycles, resultingin diverse algal/ microbial/plant communities with distinct biogeochemicalprocesses (Noe et al., 2002; Penton and Newman, 2007; Reddy et al., 1999;White and Reddy, 1999, 2001; Richardson, 2008). These biogeochemical gra-dients and hot spots are frequently observed in the detrital layer, and in thesoil and water columns of various hydrologic units of the Everglades.
Soils and sediments serve as long-term sinks for P and store the majorityof P in the ecosystem. Storage of P in vegetation and other biotic commu-nities of wetlands and in phytoplankton of lakes tend to be small and shortterm. Thus, our discussion primarily focuses on P storage in soils and sed-iments and floc/detrital layer. Floc refers to recently accreted material ofpartially decomposed detrital matter originating from microbes, periphyton,and macrophytes, and particulate inorganic material. In wetlands, during dryperiods, dried floc material can become an integral part of surface soils. Thegenesis of this new material is relatively slow (accretion rates range from0.1 to 1 cm per year), but can affect the nutrient retention characteristicsof wetlands and shallow lakes. Productive wetland systems accrete organicmatter over time (ultimately forming peat) that has different physical and bi-ological characteristics than the underlying soil (Craft and Richardson, 1993a,1993b; Reddy et al., 1993). Eutrophic lakes and nutrient enriched wetlandstypically exhibit high rates of floc accumulation. Floc can act as a sink orsource of nutrients to the overlying water column and serves as an indicatorof the nutrient retention characteristics of a wetland. Floc is often the mostbiologically active soil fraction and is usually of highest quality with respectto degradability (DeBusk and Reddy, 1998).
Effective P control strategies can only be implemented if the storage,fate, and transport of P in uplands, ditches, canals, wetlands, and streams ofthe Greater Everglades Ecosystem are understood. Herein, we review and
Downloaded At: 17:06 3 March 2011

154 K. R. Reddy et al.
synthesize the results of recent studies conducted in the Greater EvergladesEcosystem on (a) the storage of P in soils and sediments throughout theNorthern and Southern Everglades Ecosystems, (b) the effect of land useon P storage, (c) the influence of chemical form in the regulation of Preactivity and mobility, and (d) how the biogeochemical processes influencerestoration activities in South Florida.
2 PHOSPHORUS STORAGE IN SOILS AND SEDIMENTS
Extensive spatial sampling and field experimentation has provided a reason-ably comprehensive understanding of the P storages and fluxes within thenatural areas of the Everglades wetlands (Cohen et al., 2009; Osborne et al.,2010; Reddy et al., 2005b). With the exception of Lake Okeechobee, similarspatial data sets are not available for the NEE, thus making it somewhat diffi-cult to evaluate the total P storage in the system. Nevertheless, sufficient dataexist to provide a generalized, regional landscape synthesis of P storages andfluxes in much of south Florida.
Phosphorus stored in surficial (floc and 0–10 cm) wetland soils and lakesediments of various hydrologic units of the Greater Everglades Ecosystemshows distinct north–south gradients, with higher storage in the NEE ascompared to the SEE (Figure 3). Areal storage values take into consideration
FIGURE 3. Total phosphorus storage in soils/sediments (0–10 cm) of select hydrologic unitsof the Northern Everglades Ecosystem (NEE). LOB = Lake Okeechobee Basin wetlands;Isolated wetlands includes in various land uses: OK-D = dairy; OK-IP = improved pasture;and OK-UP = unimproved pasture; Lake Okeechobee sediments: LO-M = mud; LO-S = sand;LO-L = littoral; and LO-P = peat.
Downloaded At: 17:06 3 March 2011

Phosphorous Legacy 155
differences in bulk densities of soils and sediments. On average, P storageper unit area of wetlands of the Everglades wetlands is less than otherhydrologic units. High-P storage values were noted in areas of intensive landuse, including dairies and other agricultural activities of the NEE. Similarly,the EAA and STAs stored more P in surface soils than the WCAs and otherEverglades wetlands. Phosphorus enrichment in surface soils of EAA is due toa combination of peat oxidation (soil subsidence) and long-term P fertilizerapplication. Estimated P storage values for floc (where present) and surface0–10 cm soils or sediments are presented in Table 1.
TABLE 1. Phosphorus storage (mt = metric tons) in soils/sediments (for the LOB)
Soil P Soil P % of total PArea storage storage stored in
Hydrologic units (km2) (mt/km2) (mt) ecosystem
Northern Everglades EcosystemUpper Chain of Lakes Basina 4,160 11 46,910 21.8Lake Istokpoga Basina 1,580 13 20,870 9.4Northern Lake Okeechobee Basina 4,840 21 102,050 47.5Upper Chain of Lakes–lake sedimentsb 371 16 5,900 2.7Lake Istokpoga–lake sedimentsb 112 22 2,460 1.1Lake Okeechobee sediments–Totalc 1,741 21 36,440 17.0Lake Okeechobee sediments–Mudc 766 28 21,390 10.0Lake Okeechobee sediments–Sandc 296 29 8,620 4.0Lake Okeechobee sediments–Littoralc 296 16 4,610 2.1Lake Okeechobee sediments–Peatc 383 5 1,820 0.8Total 12,804 19 214,630
Southern Everglades EcosystemEverglades Agricultural Area (EAA)d 2,095 59 123,210 60.6Stormwater Treatment Areas (STAs)e 182 20 3,550 1.7Water Conservation Area 1 (WCA-1)f 566 4 2,380 1.2Water Conservation Area 2 (WCA-2)F 537 9 4,830 2.4Water Conservation Area 3 (WCA-3)F 2,393 7 16,510 8.1Holey Land Wildlife Management AreaF 140 14 1,950 1.0Rotenberger Wildlife Management AreaF 96 8 730 0.4Everglades National Park (ENP)f 5,560 6 32,250 15.9Big Cypress National Preserve (BCNP)F 2,280 8 18,010 8.9Total 13,849 15 203,420 100Greater Everglades Ecosystem 26,183 17 418,050
Note. The basin surface area values for the Upper Chain of Lakes and Istokpoga Basins do not include thearea of the associated lake sediments. P storage includes A, E, and Bh horizons for uplands; soil depthof up to 30 cm for wetlands; 0–10 cm depth for lake sediments and SEE soils, of various hydrologic unitsof the Everglades ecosystem. ∗ = Phosphorus storage in floc + 10 cm soil. Floc P represents 30% of totalP storage. Data sources:aSWET, 2008.bBelmont et al., 2009.cFisher et al., 2001.dWright, 2009; WBL, 1998.eWBL, 2009.fReddy et al., 2005b.
Downloaded At: 17:06 3 March 2011

156 K. R. Reddy et al.
TABLE 2. Selected physicochemical properties of surface and subsurface soils of wetlands asinfluenced by select land use activities in Lake Okeechobee Basin in the Northern EvergladesEcosystem (Dunne et al., 2010)
Soil SoilParameter Units (0–10 cm depth) (10–30 cm depth)
DairyBulk density g cm−3 1.00 ± 0.1 1.25 ± 0.1TIP mg kg−1 717 ± 181 245 ± 80TP mg kg−1 1253 ± 230 394 ± 67TN g kg−1 12.4 ± 2 8.0 ± 2TC g kg−1 190 ± 29 149 ± 36
Improved pastureBulk density g cm−3 1.01 1.35TIP mg kg−1 44 ± 4 18 ± 2TP mg kg−1 354 ± 34 147 ± 18TN g kg−1 7.3 ± 1 3.3 ± 1TC g kg−1 106 ± 11 56 ± 9
Unimproved pastureBulk density g cm−3 0.78 ± 0.1 1.32 ± 0.1TIP mg kg−1 37 ± 4 10 ± 2TP mg kg−1 315 ± 33 107 ± 23TN g kg−1 8.8 ± 1 2.8 ± 1TC g kg−1 151 ± 22 56 ± 17
Note. TIP = total inorganic P; TP = total phosphorus. TN = total nitrogen; TC = total carbon.
2.1 Northern Everglades Ecosystem
Estimated P storage values (Table 1) are based on average total P concen-tration and bulk density values for each hydrologic unit (Tables 2 and 3).Average TP concentrations for each hydrologic unit can vary with samplesize and distribution of sampling locations. Sampling size was relatively smallin the Northern LOB and the Upper Chain of Lakes Basin given the total areaof these hydrologic units. Nevertheless, these estimates provide a first ap-proximation of P storage. Total P storage in the NEE (including uplands andwetlands in the basins of LOB, Upper Chain of Lakes, Lake Istokpoga, andLake Okeechobee) is estimated at 215,000 metric tons (Table 1).
TABLE 3. Selected physicochemical properties of surface soils of wetlands in the NorthernLake Okeechobee Basin (Reddy et al., 1995)
Parameter Units S-154 S65-D TC/NS IPB FCB
Bulk density g cm−3 0.46 0.52 0.57 0.78 0.90TP mg kg−1 615 702 1079 338 304TC g kg−1 110 151 101 105 85
Note. TIP = total inorganic P; TP = total phosphorus; TC = total carbon. TC/NS = Taylor Creek/NubbinSlough; IPB = Indian Prairie Basin; and FCB = Fisheating Creek Basin.
Downloaded At: 17:06 3 March 2011

Phosphorous Legacy 157
2.1.1 WETLAND AND UPLAND SOILS
Approximately 80% of the P imported into the NEE remains in upland soils,while 10% is retained in wetlands and the remaining 10% is transferredthrough the wetlands downstream into Lake Okeechobee (Reddy et al., 1996;Soil and Water Engineering Technology [SWET], 2008). Isolated wetlands inagriculturally intensive land use areas (e.g., dairy) have accumulated highlevels of P compared to improved and unimproved pasture areas (Table 2;Dunne et al., 2010). Wetlands in the Taylor Creek and Nubbin Sloughs haveaccumulated more P than wetlands in other areas of the drainage basin(Table 3; Reddy et al., 1996; SWET, 2008). Overall, the Northern LOB, Up-per Chain of Lakes Basin, and Lake Istokpoga Basin contain approximately170,000 metric tons of P in surface soils, representing ∼79% of total P stor-age in the NEE (Table 1). Phosphorus storage estimates in upland soils werebased on the whole soil profile, whereas P storage in wetland soils wasrestricted to the surface 0–10 cm soils (SWET, 2008). In an earlier study,Reddy et al. (1996) estimated a total storage of 190,000 metric tons of Pin upland soils (A, E, and Bh horizons) and 33,000 metric tons in wetlandsoils (0–30 cm depth), suggesting a reduction in P storage. However, thiscomparison is based on limited data sets during both sampling periods andapproximates P storage in the NEE.
2.1.2 SHALLOW LAKES
Total P storage in surface sediments of lakes was estimated to range from440 to 36,000 mt of P. High values represent P storage in Lake Okeechobeeand low values for storage in Lake Hatchineha, reflecting the relative sizes ofthe lakes. Accumulation of P in surface sediments represents approximately30–60 years of P loading to the lakes (Belmont et al., 2009). Phosphorusloading from the LOB to Lake Okeechobee is approximately 500 mt peryear (5–year moving average 1981–2009). Except during drought years, Ploadings from the drainage basin to the lake have remained consistentlyhigh. During the past 30 years (1981–2009), the total P load from the LOBto the lake is estimated to be 14,000 mt P. The external P load representsapproximately 40% of the P in the surface sediments of the whole lake and67% of the P accumulated in the surface 0–10 cm sediments of the mudzone. Lake Okeechobee sediments contains approximately 36,000 mt of Pin the surface 10 cm sediments, with approximately 59, 24, 13, and 4% oftotal storage present in mud, sand, littoral, and peat sediments, respectively(Table 1). Phosphorus budgets for Lake Okeechobee over the last 10 yearssuggest that P had accumulated in the sediments at the rate 300 mt P peryear, representing a net increase of 10 percent in total P mass of surfacesediments (Fisher et al., 2001).
Downloaded At: 17:06 3 March 2011
158 K. R. Reddy et al.
2.2 Southern Everglades Ecosystem
Approximately two thirds of the P load from Lake Okeechobee is dischargedto the St. Lucie and Caloosahatchee estuaries, respectively. The remainingone third of the P load enters the EAA and other small basins. The EAAis subsequently the primary source of P loads to the downstream STAs andWCAs. Total P storage in surface soils and floc in the entire SEE was estimatedto be 200,000 mt (Table 1),
2.2.1 EVERGLADES AGRICULTURAL AREA
While only 15% of the land area of the SEE, the estimated legacy total P insurface soils of the EAA is 123,000 mt, representing approximately 61% of Pstored in the SEE (Table 1). Aggregated to basin-wide values, the mass of Pper unit area in the EAA is almost 3 times greater than any of the other NEEor SEE basins reflecting a hot spot of P just upgradient from the Everglades(Table 1). The best management practices (BMPs) presently in place in theEAA have effectively reduced P discharges from the basin (Daroub et al.,2011). The average P load discharged from the EAA (1980–2009) to WCAsand now to STAs is 170 ± 85 mt P, whereas the WY (water year) 2009load was 129 mt P (Van Horn and Wade, 2010). The BMPs included verylittle or no P application, suggesting internal P turnover, not P fertilizationas the major source of P in the EAA. Consequently, decomposition of soilorganic matter and discharge of water from the EAA into STAs and WCAswill continue to dominate the present P loads.
2.2.2 STORMWATER TREATMENT AREAS
STAs, large surface water treatment marshes established on former agriculturelands, were strategically established in SEE to capture the P load from the EAAbefore water enters the WCAs. Thus far, the STAs have been very effectivein removing inflow P, with approximately 60–80% of the added P retainedin these treatment wetlands (Pietro et al., 2010). Since initial operation, STAshave accumulated 1200 mt P in the floc and surface soils. Total P storagein surface soils and floc sampled in 2007 was estimated to be 3550 mt(Table 1), therefore, P added to STAs accounts for approximately 34% ofP stored, while the remaining storage is from native soils and subsurface Pmined by vegetation and deposited back into floc as detrital matter (Whiteet al., 2004, 2006).
2.2.3 FRESHWATER WETLANDS
Wetlands outside of the EAA and STAs include the WCAs, Holey Land andRotenberger Wildlife Management Areas, Big Cypress National Preserve, andEverglades National Park. Combined, the ecosystem contain approximately77,000 mt P in surface floc and 0–10 cm soil (Table 1). These wetlandareas represent 84% of the total area of the SEE, and contain 38% of the
Downloaded At: 17:06 3 March 2011

Phosphorous Legacy 159
stored P. In WCA-1 and WCA-2, sample sites were denser in P enrichedareas than P-unenriched areas, because the intent of the sampling was tocapture the zone of enrichment. Thus, aggregating the sample point data toa WCA-wide average may slightly overestimate the values calculated for totalP concentrations and P storage. However, the differences caused by thesefactors may be masked by the spatial variability within each unit. Spatialpatterns of soil P in WCAs and ENP were recently documented (see Osborneet al., 2011). Total P concentrations in soils and sediments show a distinctgradient from the northern to southern regions of the Everglades wetlands,with low values in soils of the ENP. WCAs have been very effective inaccumulating P in floc and soils (Bruland et al., 2006; Corstanje et al., 2006;DeBusk et al., 1994, 2001; Fisher et al., 2001; Newman et al., 1997).
Typically, P accumulation is greater in areas closer to surface waterinflow points and decreases exponentially as a function distance from in-flow (Reddy et al., 1993). For example, P accumulation rates of 0.11–1.14 g P m−2 yr−1 have been reported for the WCA-2A of the Everglades(Craft and Richardson, 1993a, 1993b; Reddy et al., 1993). The distinct gra-dients with distance are noted in areas adjacent to canals and inflow struc-tures, highlighting the connection between hydrologic and nutrient loading.In contrast, in overdrained areas of the system, oxidation of organic matter,resulting from microbial decomposition processes or fire, increases soil in-organic P levels, as observed for the WCA-3A, Holey Land and RotenbergerWildlife Management Areas (Smith et al., 2001), and EAA soils. Much of thenutrient-loading effects are confined to the shallow soil layers.
Wetlands in the ENP, the final link in the freshwater hydrologic chainfrom the NEE through the SEE to the estuaries and sea, is not subject tothe same high loads as the WCAs. However, the ENP is still experiencingeutrophication via P loading from water conveyance structures. Recent soilmonitoring in ENPs Taylor Slough and upper Shark River Slough suggestsignificant soil P impact (Reddy et al., 2008), as described further in a latersection. Approximately, 32,250 mt of P is stored in surface soils of the ENPfreshwater wetlands, which accounts for 16% of the P storage in the SEE(Table 1). The freshwater wetlands of the ENP represent 40% of the totalarea of SEE.
2.3 Greater Everglades Ecosystem—Regional Patterns
When aggregating P storage mass per unit area within each of the largebasins considered here (Table 1), it is suggested that the NEE basins contain15–20 mt P per km2. The STAs and Holey Land Wildlife Management Areaof the SEE have similar landscape P concentrations (14–20 mt per km2).Downstream of all of these basins, the Everglades wetlands generally exhibita P mass per unit area that is less than half of those values from the morenorthern regional basins. Of significant importance to restoration objectives,
Downloaded At: 17:06 3 March 2011
160 K. R. Reddy et al.
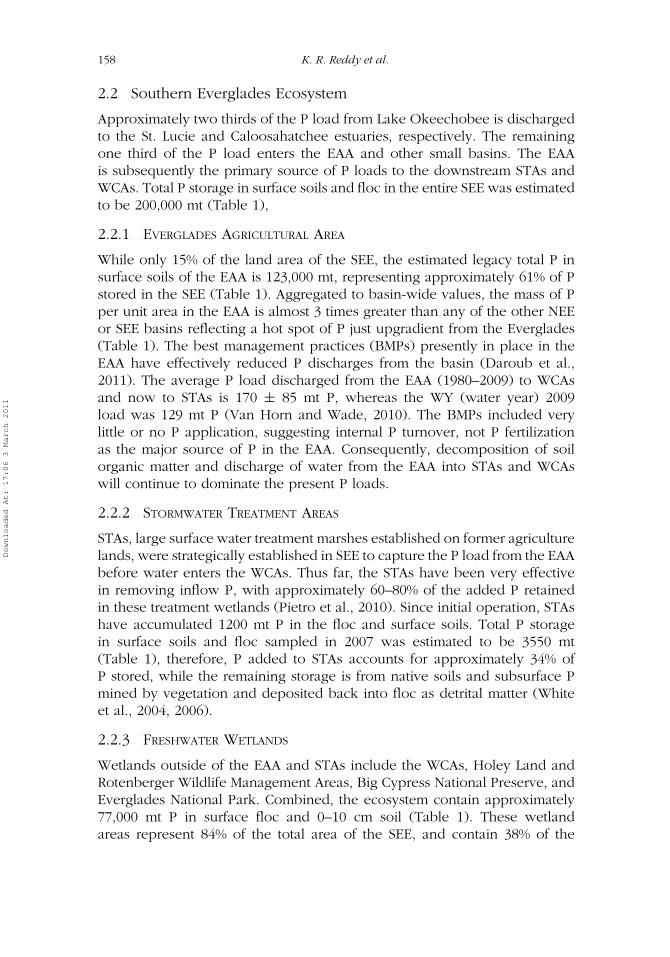
TABLE 4. Selected physicochemical properties of surface sediments of Lake Istokpoga andUpper Chain of Lakes in the Northern Everglades Ecosystem (Belmont et al., 2009)
Parameter Units Cypress Hatchineha Istokpoga Kissimmee Tohopekaliga
Bulk density g cm−3 0.21 ± 0.22 0.21 ± 0.26 0.49 ± 0.52 0.18 ± 0.23 0.70 ± 0.34TP mg kg−1 955 ± 753 797 ± 511 449 ± 493 919 ± 722 188 ± 146TC g kg−1 120 ± 89 116 ± 74 91 ± 77 154 ± 118 23 ± 22
Note. TIP = total inorganic P; TP = total phosphorus; TC = total carbon.
the EAA, situated between the Lake Okeechobee and Everglades wetlandnatural systems, has more than triple (approximately 60 mt P per km2) themass per area storage of any other Greater Everglades Ecosystem basins. Thepossibility that internal P loading and redistribution of this legacy P couldobviate restoration goals for long periods is a disturbing realization, but onethat must be addressed for realistic implementation of Everglades restorationprojects. The relative scale of the effects of legacy P depends on land use,which in turn influences the forms of P are stored in or exported from thesystem.
3 LAND USE EFFECTS ON SOIL PHOSPHORUS
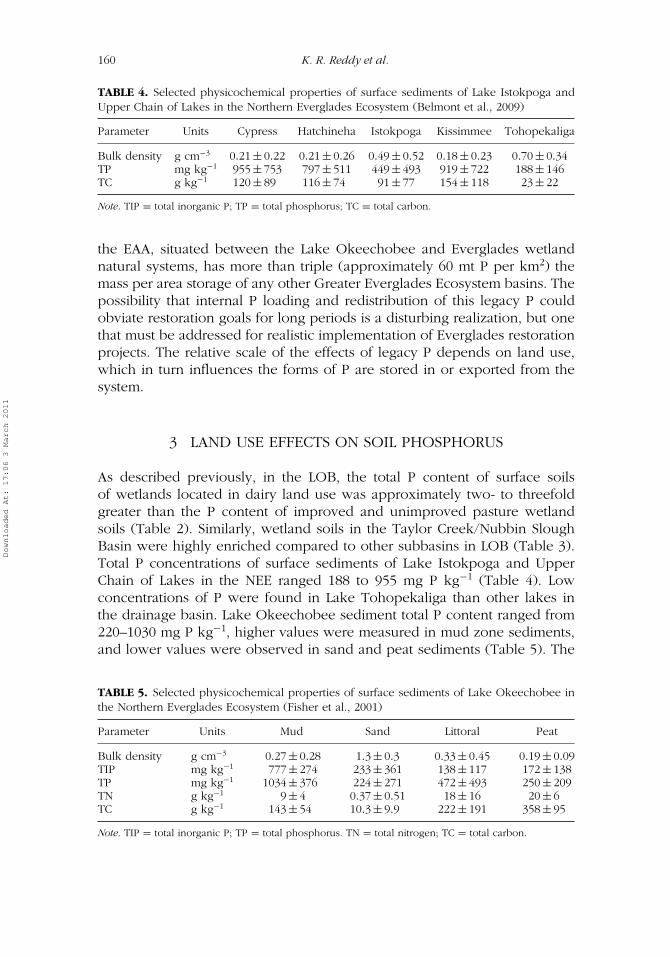
As described previously, in the LOB, the total P content of surface soilsof wetlands located in dairy land use was approximately two- to threefoldgreater than the P content of improved and unimproved pasture wetlandsoils (Table 2). Similarly, wetland soils in the Taylor Creek/Nubbin SloughBasin were highly enriched compared to other subbasins in LOB (Table 3).Total P concentrations of surface sediments of Lake Istokpoga and UpperChain of Lakes in the NEE ranged 188 to 955 mg P kg−1 (Table 4). Lowconcentrations of P were found in Lake Tohopekaliga than other lakes inthe drainage basin. Lake Okeechobee sediment total P content ranged from220–1030 mg P kg−1, higher values were measured in mud zone sediments,and lower values were observed in sand and peat sediments (Table 5). The
TABLE 5. Selected physicochemical properties of surface sediments of Lake Okeechobee inthe Northern Everglades Ecosystem (Fisher et al., 2001)
Parameter Units Mud Sand Littoral Peat
Bulk density g cm−3 0.27 ± 0.28 1.3 ± 0.3 0.33 ± 0.45 0.19 ± 0.09TIP mg kg−1 777 ± 274 233 ± 361 138 ± 117 172 ± 138TP mg kg−1 1034 ± 376 224 ± 271 472 ± 493 250 ± 209TN g kg−1 9 ± 4 0.37 ± 0.51 18 ± 16 20 ± 6TC g kg−1 143 ± 54 10.3 ± 9.9 222 ± 191 358 ± 95
Note. TIP = total inorganic P; TP = total phosphorus. TN = total nitrogen; TC = total carbon.
Downloaded At: 17:06 3 March 2011

Phosphorous Legacy 161
large differences in total P contents amongst various units in the same basinunderscore the effect of land use on soil P enrichment.
In the SEE basin, land use can be compared for agricultural systems(EAA), treatment wetlands (STAs) and natural systems. As expected, the totalP content of EAA surface soils were highly enriched, not only due to long-term application of P fertilizers, but also because of oxidation of these highlyorganic soils. Managing peat soils for crops traditionally grown in this region,vegetables and sugarcane, is accomplished by keeping the soils drained. Thishas, in turn, resulted in a loss at a rate of 2–3 cm of soil per year and hasadded to the mineral matter including P enrichment of remnant soil layersthrough loss of carbon (Wright, 2009).
The runoff from the EAA is passed through STAs, to remove P, beforebeing discharged into the Everglades. Presently six STAs are in full operationand have been in service for variable time periods. During their tenure astreatment systems, STAs have accumulated significant amounts of looselyconsolidated floc material on top of the surface soils. Both floc and soil haveshown significant P enrichment. The floc layer accounts for approximately30% of the total P storage in floc + surface 0–10 cm soil, and 100% of watercolumn P retained within the STA (WBL, 2009). Total P contents in the flocranged from 640 to 1200 mg kg−1, with low values observed in youngest STAand high values recorded the longest running STA (Table 6). Total P contentsof STA soils (0–10 cm) ranged from 160 to 600 mg kg−1, reflecting charac-teristics similar to those of native soils. Low total P values were recordedin STA-1E, which included primarily mineral soils. However, in surface soilsof STA-1W, approximately 70% of P was derived from recently accretedmaterial, while the remaining 30% represented native soils. Phosphorus ac-cumulation by STAs varied temporally and among the STAs. Several factors
TABLE 6. Selected physicochemical properties of floc and surface soils of the StormwaterTreatment Areas of the Southern Everglades Ecosystem (data from SFWMD, summarized byWBL, 2009)
Parameter Units STA-1E STA-1W STA-2 STA-3/4 STA-5 STA-6
Period of record Years 3 13 8 4 9 8Floc
Bulk density g cm−3 0.26 ± 0 0.1 ± 0.03 0.15 ± 0.04 0.11 ± 0.04 0.11 ± 0.03 0.04 ± 0.03TP mg kg−1 644 ± 0∗ 1192 ± 261 870 ± 167 1072 ± 130 1187 ± 485 1028 ± 520TN g kg−1 15 ± 0∗ 23 ± 2 14 ± 3 18 ± 2 28 ± 2 —TC g kg−1 n/a 274 ± 13 242 ± 32 275 ± 22 375 ± 28 —
0–10 cm soilBulk density g cm−3 1.01 ± 0.37 0.26 ± 0.09 0.25 ± 0.08 0.27 ± 0.09 0.42 ± 0.13 0.58 ± 0.24TP mg kg−1 160 ± 135 598 ± 316 511 ± 186 599 ± 175 615 ± 396 455 ± 236TN g kg−1 5.6 ± 4.8 26 ± 7 28 ± 2 25 ± 5 21 ± 6 21 ± 6TC g kg−1 82 ± 71 398 ± 69 452 ± 38 381 ± 79 297 ± 94 266 ± 79
Note. Soil samples were collected in 2007 for STA-1E, STA1W, STA2, STA3/4, and STA5, and in 2004 forSTA6.
Downloaded At: 17:06 3 March 2011

162 K. R. Reddy et al.
influence P removal efficiency of STAs, including antecedent land use, nutri-ent and hydraulic loading, vegetation composition and condition, soil type,cell topography, cell size and shape, extreme weather conditions, modifica-tion activities to improve performance (enhancement activities), and regionaloperations (Pietro et al., 2010).
In the natural areas, land use P effects are not spatially distributedthroughout the entire region, but with the exception of areas that expe-rienced fires and overdrainage, are generally directional, with high valuescloser to the canals and inflow structures and reaching background levelsin the interior (Table 7; DeBusk et al., 1994, 2001; Newman et al., 1997). InWCA-1, total P ranged from 110 to 1050 mg kg−1 (0–10 cm) with a meanof 405 mg kg−1, while total P contents in the floc were higher, in the rangeof 230–1460 mg kg−1 with a mean of 630 mg kg−1 (Corstanje et al., 2006).In WCA-2, TP ranged from 150 to 1700 mg kg−1 (0–10 cm) with a meanof 551 mg kg−1, while TP concentrations in the floc were in the range of194–1865 mg kg−1 (0–10 cm) with a mean of 551 mg kg−1 (Rivero et al., 2007;White and Reddy, 2000). DeBusk et al. (2001) observed 48 and 73% of theWCA-2 area was enriched with surface TP values >500 mg kg−1,the valueabove which is considered to indicate P enrichment. In contrast, in 2003,Rivero et al. (2007) estimated that 65% of the floc and 26% surface soilsexceeded a value of 500 mg kg−1, suggesting a decrease in P enrichment.However, some of these differences may be due to different soil-samplingmethodologies and spatial analysis of the data used during sampling periodof 1992, 1998, and 2003. In addition, it is reasonable to speculate that theestablishment of STAs has significantly decreased P loads to WCA-2. From1992 to 2007, approximately 21–30%% of WCA-3 area had total P concentra-tions of >500 mg kg−1 in the 0–10 cm layer indicating P enrichment abovehistoric concentrations levels (Bruland et al., 2006, 2007).
Average total P concentrations in ENP were 140 and 310 mg P kg−1 forfloc and surface (0–10 cm) soils, respectively (Osborne et al., 2010; Reddyet al., 2005b; Table 7). The relatively low soil total P concentrations foundin ENP suggest that this hydrologic unit remains the most pristine of theEverglades system in terms of P enrichment. Most freshwater floc and soilP were observed in the peat accreting areas of ENP, Shark River Slough(mean total P 330 mg kg−1) and to a lesser extent, Taylor Slough (TS; meantotal P 190 mg kg−1). These two prominent drainage features within thelandscape have extended hydroperiods when compared to the surroundingmarl prairies to the east and west (Davis et al., 2005).
A finding of particular interest concerning soil total P, was the lack of anenrichment signature in TS by landscape scale investigations (Osborne et al.,2010; Reddy et al., 2005b). Data from TS showed no samples exceeded thethreshold for P impact of 500 mg P kg−1. This observation is supported byChilders et al. (2003) who established soil transects in TS in 1999 and reported
Downloaded At: 17:06 3 March 2011

Phosphorous Legacy 163
TABLE 7. Selected physicochemical properties of surface floc (detrital matter and benthicperiphyton) and soils (0–10 cm depth) in the Southern Everglades Ecosystem
SoilParameter Units Floc (0–10 cm depth)
EAA n = 29Bulk density g cm−3 — 0.42TIP mg kg−1 — 334 ± 335TP mg kg−1 — 1, 021 ± 499WCA-1 n = 124 n = 131Bulk density g cm−3 0.022 ± 0.02 0.073 ± 0.035TIP mg kg−1 159 ± 93 80 ± 50TP mg kg−1 634 ± 268 405 ± 156TN g kg−1 33 ± 5.5 33 ± 4.8TC g kg−1 447 ± 29 473 ± 32WCA-2 n = 131 n = 131Bulk density g cm−3 0.046 ± 0.032 0.116 ± 0.05TIP mg kg−1 232 ± 141 133 ± 140TP mg kg−1 776 ± 383 531 ± 311TN g kg−1 27 ± 5.3 26 ± 6.2TC g kg−1 402 ± 46 420 ± 51WCA-3 n = 149 n = 389Bulk density g cm−3 0.031 ± 0.025 0.16 ± 0.15TIP mg kg−1 165 ± 135 97 ± 90TP mg kg−1 544 ± 267 417 ± 171TN g kg−1 31 ± 8.7 28 ± 8.2TC g kg−1 401 ± 76 391 ± 108Holeyland n = 15 n = 54Bulk density g cm−3 0.055 ± 0.022 0.198 ± 0.069TIP mg kg−1 307 ± 124 258 ± 311TP mg kg−1 905 ± 228 610 ± 281TN g kg−1 25 ± 2.3 23 ± 6.7TC g kg−1 417 ± 27 368 ± 101Rotenberger n = 43 n = 93Bulk density g cm−3 0.11 ± 0.05 0.29 ± 0.15TIP mg kg−1 71 ± 79 81 ± 81TP mg kg−1 266 ± 313 315 ± 192TN g kg−1 14 ± 7.2 17 ± 11TC g kg−1 258 ± 29 278 ± 125ENP n = 142 n = 310Bulk density g cm−3 0.12 ± 0.09 0.25 ± 0.16TIP mg kg−1 40 ± 37 70 ± 51TP mg kg−1 143 ± 115 312 ± 182TN g kg−1 14 ± 6.6 19 ± 11TC g kg−1 230 ± 56 273 ± 119Big Cypress n = 178 n = 209Bulk density g cm−3 0.15 ± 0.09 0.64 ± 0.31TIP mg kg−1 47 ± 34 45 ± 63TP mg kg−1 204 ± 129 198 ± 133TN g kg−1 14 ± 5.6 8.0 ± 5.7TC g kg−1 208 ± 53 112 ± 73
Note. TIP = total inorganic; TP = total phosphorus (Reddy et al., 2005b).
Downloaded At: 17:06 3 March 2011

164 K. R. Reddy et al.
soil total P ranged from 150 to 250 mg kg−1. However, more recent investi-gations of TS soils (Reddy et al., 2008) revealed significant P enrichment inthe upper reaches of TS, ranging from 450–1200 mg kg−1 and an enrichmentfront extending 7 km downstream of the inflow from the S-332 control struc-ture. Reddy et al. (2008) also reported extensive enrichment along transectsfrom Tamiami Trail southward up to 7 km into SRS. These data suggest thatsome landscape scale sampling is too coarse to identify localized P enrich-ment gradients in ENP at this time. Presently, in the ENP, the total P dataindicate only 2.3% of floc and 12.5% of surface soils (including mangroveinterface regions in southern ENP where marine influence is significant) ex-ceed the enrichment threshold. However, existence of enrichment zones inthe northern portion of the ENP, similar to those in the northern Evergladesmarshes, clearly indicate the potential for future P enrichment of ENP.
4 PHOSPHORUS FORMS
Phosphorus is stored both in organic and inorganic forms in soils. The rela-tive proportion of each of the forms depends on soil types in the landscape(mineral vs. organic) and source and forms of P added to the system. Mostinorganic P compounds in soils fall into one of two groups: those containingcalcium and those containing iron and aluminum. The availability of P in al-kaline soils is determined largely by the solubility of the calcium compoundsin which the P is associated. In acid soils, iron and aluminum minerals reg-ulate the solubility of inorganic P. Organic P commonly dominates the totalP in wetlands and usually comprises more than half of the soil P (Reddyet al., 2005b). Organic P forms extracted from wetland soils include: inositolphosphates, phospholipids, and nucleic acids (Turner et al., 2006). As muchas one third of the inositol P can be complexed with humic and fulvic acids,thereby reducing bioavailability of this organic P.
4.1 Inorganic P Forms
Soils in the NEE are dominated by mineral matter in contrast to the highlyorganic soils in the SEE. This difference is reflected in a larger proportion oftotal P in the inorganic pool in soils and sediments in NEE than soils in SEE(Tables 2–7). In LOB, wetlands are dominated by mineral soils (Spodosols)however, surface soils in these systems have a relatively high organic mat-ter content compared to upland soils. Iron and Al-bound P in these soilsaccounted for 17–43% of total P in wetland soils and 20–70% of total P instream sediments (Reddy et al., 1995). Organic P accounted for more that 50%of total P, reflecting the high organic matter content of wetland soils. Surfacewetland soils located within dairy land use areas contained a larger pro-portion of P as Fe/Al-bound P, whereas wetland soils within improved and
Downloaded At: 17:06 3 March 2011
Phosphorous Legacy 165
unimproved pasture areas contain a larger proportion of P in organic pools(Dunne et al., 2010). Soils in LOB basin generally have high concentrationsof oxalate Fe and Al, and inorganic P retention is governed by these metals.
In Lake Okeechobee, mud, sand, and littoral sediments are dominatedby mineral matter, while sediments south of the lake are dominated by peatdeposits (Fisher et al., 2001). The mud sediments (occupy 40% of the lake)are dominated by Ca and Mg-bound P (65% of total P) followed by resid-ual P (28% of total P), with low exchangeable (2% of total P) and Fe andAl-bound P (5% of total P; Olila et al., 1995). The peat and littoral sedimentsof Lake Okeechobee, however, have higher exchangeable P (9–10% of totalP) and Fe and Al-bound P (6–18% of total P). Two mechanisms that controlexchangeable P have been suggested for Lake Okeechobee mud sedimentsunder different redox conditions. Under oxic conditions, Fe appears to con-trol the amount of exchangeable P, while under anoxic conditions, Ca and Mgseem to control exchangeable P (Moore and Reddy, 1994; Olila et al., 1995).
Similarly, with the exception of WCA1, the predominantly anaerobicsoils in the SEE are dominated by Ca and Mg-bound P (Reddy et al., 1998a).In surficial soils, Ca and Mg-bound P accounted for 14–68% of total P, withthe highest values observed in the Holeyland Wildlife Management Area soilsand lowest values in WCA-1 soils. The inorganic P content in SEE soils ishighly variable and ranged from less than 10% to up to 80% of total P. Highvalues were noted in soils subjected to excessive drainage and fire, suchas those found in northern part of WCA-3 and Holeyland and RotenbergerWildlife Management Areas (Smith et al., 2001). Inorganic P concentrationsacross the Everglades landscape are higher in surface soils and decreasewith depth. Iron and Al-bound P accounted for 1–24% of total P, with thehighest values measured in EAA soils (Reddy et al., 1998a). Iron and Al-bound P is typically extracted with NaOH, which also extracts humic andfulvic acids from organic soils resulting in dark colored solutions. Analyzingthese solutions for P may result in overestimation of inorganic P due tocolormetric interference.
In Florida Bay sediments, at the bay–mangrove ecotone, Ca-bound Paccounted for approximately 56% of total P and 96% of inorganic P. Calcium-bound P was in the range (34–151 mg P kg−1) reported for coarse-grainedlow organic sediments, while the organic P associated with this fractionwas slightly (∼10%) higher than those reported for other carbonate systems(Koch et al., 2001).
4.2 Organic P Forms
A large proportion of the P in wetland soils, especially in peats, occurs inorganic forms, suggesting the importance of organic P sequestration in thelong-term stabilization of P in wetlands. The range of organic P forms found
Downloaded At: 17:06 3 March 2011

166 K. R. Reddy et al.
in soils include: phospholipids, nucleic acids, inositol phosphates, glucose-6-phosphates, glycerophosphate, phosphoproteins and polymeric organic Pof high molecular weight compounds (Stewart and Tiessen, 1987). OrganicP forms can be generally grouped into (a) easily decomposable organic P(nucleic acids, phospholipids and sugar phosphates) and (b) slowly decom-posable organic P (inositol phosphates or phytin).
Organic P is typically measured only as part of sequential fractionationschemes (e.g., Ivanoff et al., 1998). This is partly due to the analytical diffi-culties in speciating the multitude of phosphorus compounds present in en-vironmental samples. Recent advances in nuclear magnetic resonance (NMR)techniques, specifically solution 31P-NMR, allow identification of specific or-ganic compounds (Cheesman, 2010; Turner and Newman, 2005; Turner et al.,2006). An example of NMR spectra identifying various organic pools in WCA-2A soils is presented in Figure 4 (Turner et al., 2006).
In LOB isolated wetlands, approximately 73% of the extracted P wasorganic, with phosphomonoesters constituting the major fraction, rangingfrom 50 mg P kg−1 in the uplands to 130 mg P kg−1 in the deep marsh. Theremaining organic P forms included phosphodiesters (11–13% total soil P),dominated by identifiable DNA, with the remainder representing various al-kali stable phospholipids (Cheesman, 2010). Orthophosphate was the majorP compound in sediments of Lake Okeechobee (67–100% of extracted phos-phorus). The remaining compounds in the surface layers of the Okeechobeesediment profile were phosphate monoesters (24–27%), and DNA (7–9%),with a trace of pyrophosphate (Torres, 2008).
Floc
Soil
Chemical shift (ppm)-4-202468-4-202468
Enriched (Typha) Unenriched (Cladium)
monoesters
DNA
monoesters
DNA
monoesters
DNA
monoesters
DNA
FIGURE 4. Soil organic phosphorus forms in the Water Conservation Area 2A as determinedby the 31P-Nuclear Magnetic Resonance Spectroscopy (Turner and Newman, 2005).
Downloaded At: 17:06 3 March 2011

Phosphorous Legacy 167
Organic P represented up to 70–90% of the total P in deep peat layersin the Florida Everglades, especially in STAs and WCAs, but surface layerscontained relative less organic P (Qualls and Richardson, 1995; Reddy et al.,1998a). In recently accreted organic matter in the STAs, the sequesteredorganic P primarily consisted of phosphate diesters and their degradationproducts (Turner et al., 2006). These compounds are considered relativelyunstable in soils and raises concern about the long-term stability of organicphosphorus sequestered in treatment wetlands (Turner et al., 2006).
Microbial biomass P accounts for approximately 5–30% of the total Pof wetland soils. For example, in P-enriched areas of WCAs, approximately5–10% of total P may be present as microbial biomass P, as compared to10–20% of total P in soils from P-limited areas (oligotrophic wetlands; Chua,2000). In P-limited areas, a larger proportion of P is assimilated in the mi-crobial biomass, indicating greater assimilation efficiency of remineralizedP.
4.3 Nonreactive Phosphorus
Operationally defined chemical fractionation schemes have been routinelyused to identify labile and nonlabile pools (Hieltjes and Lijklema, 1980; Reddyet al., 1998a; Reynolds and Davis, 2001; Ruttenberg, 1992; van Eck, 1982).Key chemical extractants used in identification of organic and inorganicpools are 0.1–0.5 M NaOH and 0.5 to 1 M HCl. Soil P not extracted byeither acid or alkali is considered as residual P or operationally definednonreactive P, while the remaining P is defined as reactive P. For all practicalpurposes, nonreactive P is considered essentially unavailable for biotic orabiotic transformations. Approximately 30–40% of soil total P was present inthe nonreactive P pool of soils of LOB (Dunne et al., 2010), and 14–48% oftotal P was in Lake Okeechobee sediments (Olila et al., 1995; Torres, 2008).Similarly, soils in SEE contained 20 to 40% of total P in the nonreactive pool(Reddy et al., 1998a; Wright, 2009). Typically, the P-enriched soil subregionsof WCA-1, WCA-2, and WCA-3 contained less total P in the nonreactivepool than in unenriched soils of those basins. In WCA soils, nonreactive Pincreased with soil depth, with approximately 60–70% of total P containedin subsurface soils (Fisher, 2007; Reddy et al., 1998a).
The relationship between nonreactive P and total P is shown in Figure 5and represents most hydrologic units of the Greater Everglades Ecosystem.The data suggest that approximately 35% of total P is nonreactive, whereas65% of total P is biologically available over a range of time scales. Availabilitydepends on a range of environmental factors including hydrology, tempera-ture, nutrient loading, and vegetation (Reddy et al., 2005b). Consideration ofP bioavailabilty is critical to understanding the long-term restoration of theoligotrophic nutrient status of ecosystems in the Greater Everglades Ecosys-tem.
Downloaded At: 17:06 3 March 2011

168 K. R. Reddy et al.
FIGURE 5. Nonreactive phosphorus as a fraction of total phosphorus in surface 0–10 cmsoil/sediment of select hydrologic units of the Greater Everglades Ecosystem. Nonreactivephosphorus is defined as soil phosphorus not extracted with alkali and acid.
5 PHOSPHORUS TRANSFORMATIONS
5.1 Biotic Transformations
The cycling of organic P in wetland soils and lake sediments is largelymediated by microbial metabolism. Microbial metabolic activities influencemineralization of organic P in two ways: (a) direct biochemical mobiliza-tion by extracellular or periplasmic enzymes, particularly from mono- anddiesters; and (b) metabolism of microbes attached to senescent particulatedetritus.
Bacteria and algae growing on soil particles are able to utilize exogenousorganic P compounds through enzymatic hydrolysis of terminal phosphategroups. Sharma et al. (2005) used a fluorescent-labeled enzyme substrate toexamine the location of in situ phosphatase activity in a periphyton mat andexplored the potential associations of phosphatase-producing organisms andcyanobacteria within these mats. Phosphatase-producing organisms are con-centrated in the lower section of the periphyton mat, and the phosphataseactivity appears to be associated with heterotrophic organisms in close prox-imity to chlorophyll-containing cyanobacteria (Sharma et al., 2005).
Within the SEE, phosphatase activity was found to be higher in the flocand benthic periphyton layer, as compared to the 0–10 cm section of soil,and lowest APA was found in subsurface soils (10–30 cm depth; Wright andReddy, 2001). There was also a distinct relationship with local P contents.Detrital plant tissue and soil samples collected along the P gradient in WCA-2A was at background levels for samples collected up to 5 km from theinflow, and then increased exponentially between 5 and 10 km, indicating
Downloaded At: 17:06 3 March 2011

Phosphorous Legacy 169
P limitation in the interior marsh (Wright and Reddy, 2001). These resultssuggest that APA can be used as an indicator of P enrichment or P limitationsin an ecosystem. This was confirmed in a field study in which phosphataseactivity in periphyton mats significantly decreased following the initiationof phosphorus loading to unenriched Everglades marsh (Newman et al.,2003).
Phosphomonoesters are by far the most frequently studied enzyme in-fluencing P-cycling in the greater Everglades, but, phosphodiesters can bea significant contributor to the organic P pool. The ratio of monoesters todiesters was close to 1 in the nutrient enriched areas of WCA1 compared to2 to 4 in the unenriched interior (Turner and Newman, 2005). Relatively highdiester contents in the unimpacted sites suggest that a significant source oforganic P in the floc is of microbial origin.
Organic P mineralization is governed by microbial metabolic activitiesfunctioning in the soil profile, which include aerobic, facultative anaerobicand obligate anaerobic activities. Accordingly, the rate of microbial break-down of organic P not only depends on substrate characteristics but also onsoil redox conditions and availability of electron acceptors. Mineralization oforganic P was approximately 3-fold greater under aerobic conditions, thanunder nitrate, sulfate, and bicarbonate reducing conditions (McLatchey andReddy, 1998). Phosphatase activity is directly influenced by redox poten-tial, with higher activities found under aerobic conditions than anaerobicconditions (Newman and Reddy, 1993). Under anaerobic conditions, lowmicrobial activity and greater availability of soluble inorganic P results inlower phosphatase activity. Organic P mineralization is directly related tothe phosphatase activity in soils.
Labile organic P hydrolysis was measured by adding a substrate(glucose-6-phosphate) to soils collected along the nutrient gradient in north-ern Everglades wetland soils (Chua, 2000). Phosphorus released as resultof hydrolysis of the ester bond can potentially be assimilated by microbialcommunities as a nutrient source; however, this process is energy intensiveand therefore regulated by P availability. Mineralization rates of glucose-6-phosphate decreased as dissolved inorganic P increased (Chua, 2000), in-dicating organic P turnover was no longer necessary to meet microbial Pmetabolic requirements. Cheesman (2010) reported that leaf litter decom-position at a P-enriched site in WCA-2A resulted in net sequestration of Pin microbial biomass (i.e., phosphodiesters and inorganic polyphosphate),while at low-P concentrations at the unenriched site there was little or nonet sequestration of P, as a result of P limitation to microbial communities.
5.2 Abiotic Transformations
Both biotic and abiotic processes regulate the retention of inorganic P addedto soils and sediments. Adsorption refers to accumulation of soluble inorganic
Downloaded At: 17:06 3 March 2011

170 K. R. Reddy et al.
P from soil pore water at soil mineral surfaces, and typically increases withsoil clay content. Desorption refers to release of adsorbed inorganic P fromthe mineral surfaces into soil/sediment pore water. Depletion of P fromsoil/sediment pore water encourages the release of P from mineral surfacesuntil a new equilibrium is reached. The balance between P adsorption anddesorption represents an equilibrium between solid phase and P in soil porewater. Several approaches have been used to assess P retention or releasepotential of soils and sediments. Many of these studies include addition ofknown amount of P to soil/sediment slurries maintained either under aerobicor anaerobic conditions, followed by measuring the quantity of P removedfrom solution after a set time (Reddy et al., 2005b). Three key P retention pa-rameters often reported are EPC0 (equilibrium P concentration in pore waterswhere net sorption equals zero, Smax (P sorption maxima, which provides anestimate of maximum P retention capacity), and Kd (P sorption coefficientor partition coefficient, which is the ratio between P sorbed to P in solution).
Phosphorus sorption maximum and Kd values measured in various wet-land soils and stream sediments in the LOB were highly correlated withamorphous and poorly crystalline forms of Fe and Al, and organic mattercontent (Reddy et al., 1998b). Soils in the LOB basin are sandy loams withlow P sorption capacity. Approximately 78% of the Smax variability in theLOB soils was explained by Fe and Al with a P/[Fe + Al] mole ratio of 0.17(Reddy et al., 1998b).
Sediments from the Upper Chain of Lakes in the Kissimmee River Basinand Lake Istokpoga showed strong correlations between P sorption andtotal C, total P, Ca, Mg, Fe, and Al (Belmont et al., 2009). Equilibrium Pconcentration values ranged between 0.001 and 0.192 mg L−1 under aero-bic conditions. Results suggest that although these sediments have high Psorption capacities, P is released into the water column by desorption underaerobic conditions when water-column P concentrations are low enough(<0.036 mg L−1 for Lake Tohopekaliga and <0.003–0.027 mg L−1 for theother four lakes; Belmont et al., 2009).
In Lake Okeechobee sediments, equilibrium P concentration valuesmeasured under anaerobic conditions ranged between 0.009 and 0.025 mgL−1 for mud sediments and from 0.028 to 0.084 mg L−1 for peat sediments(Olila and Reddy, 1994). Phosphorus sorption by Lake Okeechobee sed-iments was strongly correlated with Fe, Al, and Ca concentrations (Olilaand Reddy, 1994). Pore water P concentrations in mud zone sediments ofLake Okeechobee increased over a 10-year period (1988–1998), suggestinga decrease in P sorption capacity of these sediments (Fisher et al., 2001).
5.3 Biotic and Abiotic Interactions
The mobility of P across the soil/sediment water interface is regulated bymechanisms associated with mineral-water equilibria, sorption processes
Downloaded At: 17:06 3 March 2011
Phosphorous Legacy 171
(particularly ion exchange), oxygen and alternate electron acceptor-dependent redox interactions, metabolic activities of microbes, bioturbationby benthic invertebrates, and advective and diffusive flux. Lake Okeechobeepore water P showed increases in all sediment regions, possibly indicatingthat the surface sediments are limited in their ability to buffer soluble P atlower solution concentrations. This is of concern because it indicates thatmore soluble P could become available to the water column and increasethe eutrophication of Lake Okeechobee (Fisher et al., 2001). Phosphorusflux measured in the mud zone of Lake Okeechobee was 0.4 mg P m−2
day−1 (Reddy et al., 2007). In studies conducted 10 years ago, maximumP fluxes measured for mud sediments ranged from 0.14 to 1.9 mg P m−2
day−1 (Fisher et al., 2005; Moore et al., 1998). The data suggests that overthe last 10 years the internal P load from sediments has not changed appre-ciably. Internal dissolved P fluxes, measured in 1988 in Lake Okeechobee,were equivalent to external loads (Moore et al., 1998; Fisher et al., 2005).Similarly, the significance of internal P loads in regulating eutrophicationhas been demonstrated in other shallow lakes (Anderson and Ring, 1999;Graneli, 1999; Sondergaard et al., 1999; Steinman et al., 2004). Therefore,internal P fluxes from benthic sediments to the water column can offsetany water column responses to external P load reductions (Malecki et al.,2004).
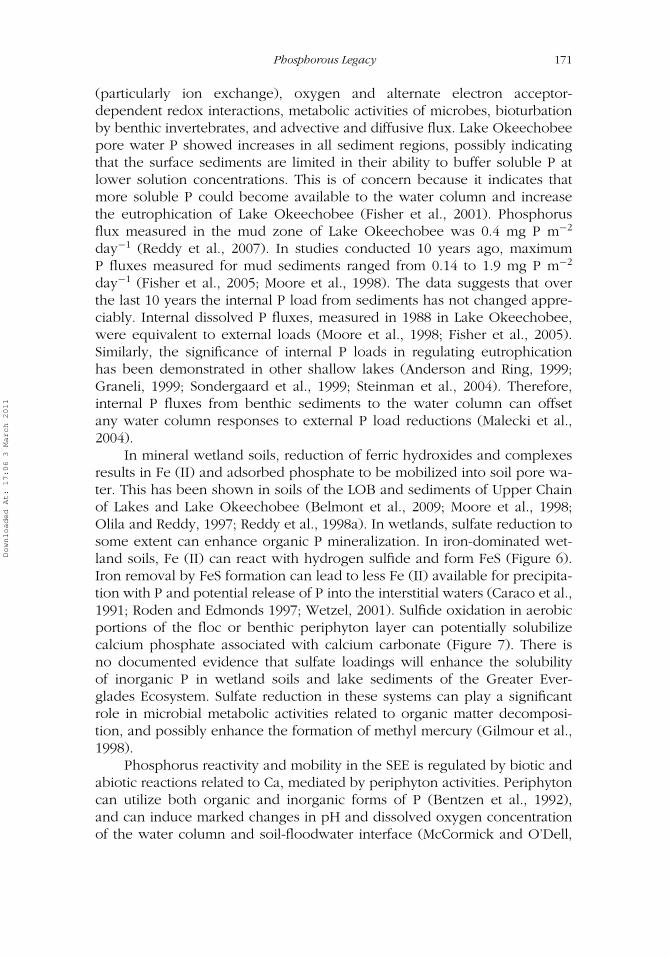
In mineral wetland soils, reduction of ferric hydroxides and complexesresults in Fe (II) and adsorbed phosphate to be mobilized into soil pore wa-ter. This has been shown in soils of the LOB and sediments of Upper Chainof Lakes and Lake Okeechobee (Belmont et al., 2009; Moore et al., 1998;Olila and Reddy, 1997; Reddy et al., 1998a). In wetlands, sulfate reduction tosome extent can enhance organic P mineralization. In iron-dominated wet-land soils, Fe (II) can react with hydrogen sulfide and form FeS (Figure 6).Iron removal by FeS formation can lead to less Fe (II) available for precipita-tion with P and potential release of P into the interstitial waters (Caraco et al.,1991; Roden and Edmonds 1997; Wetzel, 2001). Sulfide oxidation in aerobicportions of the floc or benthic periphyton layer can potentially solubilizecalcium phosphate associated with calcium carbonate (Figure 7). There isno documented evidence that sulfate loadings will enhance the solubilityof inorganic P in wetland soils and lake sediments of the Greater Ever-glades Ecosystem. Sulfate reduction in these systems can play a significantrole in microbial metabolic activities related to organic matter decomposi-tion, and possibly enhance the formation of methyl mercury (Gilmour et al.,1998).
Phosphorus reactivity and mobility in the SEE is regulated by biotic andabiotic reactions related to Ca, mediated by periphyton activities. Periphytoncan utilize both organic and inorganic forms of P (Bentzen et al., 1992),and can induce marked changes in pH and dissolved oxygen concentrationof the water column and soil-floodwater interface (McCormick and O’Dell,
Downloaded At: 17:06 3 March 2011

172 K. R. Reddy et al.
FIGURE 6. Schematic showing the role of ferric iron and sulfate reduction on solubility ofinorganic phosphorus in wetland soils. (Reddy and Delaune, 2008) (This figure is available incolor online).
1996; McCormick et al., 2002). In the uniquely low mineral content waters ofWCA-1 interior oligotrophic sites, periphyton assemblages consist of greenalgae and diatoms adapted to the extremely low mineral content of the sur-face waters (McCormick et al., 2002). In contrast, mineral-rich waters, suchas those found in WCA-2, WCA-3, and ENP, support a periphyton mat as-semblage dominated by a few species of Ca-precipitating cyanobacteria anddiatoms (McCormick et al., 2001), that appears to be favored by waters thatare both low in P and at or near saturation with respect to CaCO3 (Gleason,
FIGURE 7. Schematic showing oxidation reduction of sulfur on solubility of calcium phos-phorus in wetland soils. (Reddy and Delaune, 2008) (This figure is available in color online).
Downloaded At: 17:06 3 March 2011

Phosphorous Legacy 173
1972). Photosynthesis and respiration can initiate significant changes in wa-ter column pH on a diurnal basis. These processes can increase pH to ashigh as 10, depending upon the buffering capacity of the water column, andcan result in the coprecipitation of P with CaCO3 (Otsuki and Wetzel, 1972;Scinto and Reddy, 2003). Chemical analysis of periphyton obtained fromthe Florida Everglades indicated that <20% of the total P in periphyton waspresent as P associated with Ca and Mg, whereas the remaining P was in or-ganic forms (Scinto and Reddy, 2003). Tracer studies using 32P showed rapiduptake by periphyton mats in the water column (Noe et al., 2002; Scintoand Reddy, 2003). The biotic compartment contained >83% of the incorpo-rated P after 12 hour incubations, suggesting that biological demand exceedsabiotic adsorption in this P-limited system, but adsorption mechanisms areresponsible for a portion (<15%) of water-column P removal (Scinto andReddy, 2003). It was hypothesized that P added to the water column dom-inated by calcareous periphyton is initially adsorbed or coprecipiated onthe CaCO3, followed by diffusion into biotic component. This mechanismis possibly mediated by a decrease in pH at the interface as a result ofrespiration by periphyton, followed by solubilization of P and subsequentuptake by biotic component (Scinto and Reddy, 2003). The surface watersin the Everglades (with the exception of WCA-1), are typically characterizedby high alkalinity, which may buffer the pH around 8.5. However, Diazet al. (1994) noted that about 75–90% of the precipitated P was solubilizedwhen pH levels decreased to <8 as a result of an increase in carbon dioxidelevels.
Mechanisms regulating abiotic P retention in the Everglades soils areclearly not well understood, especially with respect to microgradients thatexist within the periphyton mats and organic matter. However, the domi-nance of Ca in the Everglades system suggests that it may be one of themain regulators of P dynamics and can influence long-term retention of P.In recent years, decreased Ca loading to Lake Okeechobee and the STAshas been speculated to be one of the reasons for higher levels of P in thewater column. Decreased Ca loading to STAs was shown to decrease P re-moval efficiency, underscoring the importance of Ca in P retention (WBL,2009). The STAs were designed based, in part, on the P retention observedalong the P enrichment gradient in WCA-2A. Long-term Ca accumulation inWCA-2A is significantly related to Ca accumulation in soils (Reddy et al.,1993).
However, the role of Fe and Al in inorganic P retention should not beruled out, as these metals can play a significant role in soils of some of thehydrologic units (i.e., in the NEE). As noted previously, in Lake Okeechobeesediments, short-term P retention is regulated by redox reactions of iron,while long-term retention in anaerobic sediments is regulated calcium and Pinteractions (Moore and Reddy, 1994).
Downloaded At: 17:06 3 March 2011

174 K. R. Reddy et al.
6 CARBON–PHOSPHORUS RATIOS
Plant detritus, periphyton, and soil organic matter components function asthe major storage pools of organic P. Phosphorus storage is mediated inseveral ways: (a) direct assimilation of P by microbes and algae coloniz-ing detrital plant tissues in the water column, (b) assimilation of P by plantcommunities and enriched detritus on the soil surface, and (c) abiotic reten-tion of P on soil components. Microbes are dependent on organic substratesprovided by macrophytes, while macrophytes are dependent on microbesto transform organic forms of nutrients into more bioavailable forms. Netrelease of nutrients is regulated by the microbial nutrient requirement andC/P and N/P ratios of the substrate undergoing decomposition. The mutualdependency between microbes and macrophytes is one of the key regulatorsof biogeochemical processes in wetlands.
The C/P ratio of water and soils indicates P enrichment and potentiallimitation of P to biotic communities. Cleveland and Liptzin (2007) estimatedthat an average C/P ratio of 186 was considered an indicator of P limitationin mineral soils. Soil C and N concentrations are tightly coupled, since boththese elements are linked to organic matter accumulation. In contrast, soilP contents are not always linked to organic matter accumulation, and areincreasingly decoupled from C. This is due to the fact that as P is added toan ecosystem, it accumulates in both in organic and inorganic forms.
Molar C/P ratios of soils showed distinct gradients with lower values inthe LOB wetland soils and lake sediments and greater values in hydrologicunits of the SEE (Figure 8). Carbon to P ratios of wetland soils in LOB rangedfrom 240 to 1200, with low values recorded in Taylor Creek/Nubbin Slough
FIGURE 8. Molar C:P distribution in the surface 0–10 cm soil/sediment of select hydrologicunits of the Greater Everglades Ecosystem.
Downloaded At: 17:06 3 March 2011

Phosphorous Legacy 175
FIGURE 9. Relationship between long-term phosphorus accretion and organic carbon accre-tion in soils of Water Conservation Area 2A (Reddy et al., 1993).
and high values in wetlands located in unimproved pasture areas. Low C/Pratios reflect high P accumulation in soils. For LOB, wetlands located inunimproved pasture areas are probably the least impacted and high C/Pratios suggest P limitation. In sediments of the Upper Chain of Lakes, theC/P ratios were in the range of 30–520, while in Lake Okeechobee sedimentsC/P ratios ranged from 120 to 3700. Peat sediments in Lake Okeechobee hadthe greatest C/P ratios, whereas lower C/P ratios were recorded in sand andmud sediments. The C/P ratios of wetland soils and lake sediments of NEEwere lower than soils in WCAs and ENP, reflecting the large amounts of Paccumulation per unit of C in the northern basins.
Phosphorus accumulation is coupled tightly to organic matter accumula-tion in wetland soils and lake sediments rich in organic C. In WCA-2A, long-term organic C accumulation is directly linked to P accumulation (Figure 9).However, P in mineral soils and sediments is decoupled from organic C,since P accumulation in these systems is primarily regulated by inorganic(mineral) P retention mechanism.
7 IMPLICATIONS FOR THE EVERGLADES RESTORATION
Wetlands and aquatic systems in the Greater Everglades Ecosystem are oftenthe final recipients of nutrients discharged from adjacent agricultural andurban ecosystems. Water flows through the multiple hydrologic basins in theGreater Everglades Ecosystem and are presently managed by an extensiveinfrastructure of canals, levees, and water control structures. Associated withlocal runoff and interbasin flows are the P loads that are a consequence of the
Downloaded At: 17:06 3 March 2011

176 K. R. Reddy et al.
variety of land uses distributed throughout this large region. Thus, landscapeposition and local/regional water and nutrient management practices areimportant drivers of P transport and fate in the Greater Everglades Ecosystem.Management practices in the LOB directly affect the eutrophication status ofLake Okeechobee; lake water and nutrient outflows that not only affectthe receiving estuaries to the east and west of the lake, but also directlyaffect the P-removal capabilities of the recipient EAA STAs. Restoration ofthe downstream Everglades wetlands, and other components of the GreaterEverglades Ecosystem, requires the integrated management of water andnutrients throughout this interconnected system.
Understanding the hydrologic interactions within and among the man-aged basins, and understanding associated ecosystem responses to alterednutrient flows, is a complex problem. A variety of computer simulation mod-els of hydrology, water quality, and other ecological dynamics have beenapplied to aid in understanding ecosystem dynamics and as part of theplanning process for Everglades restoration. For example, the South FloridaWater Management Model (2005) has been a useful planning tool in de-veloping alternative water management plans for the south Florida region.Using managed flow data from that hydrologic model, Fitz et al. (2010)used a Multi-Criteria Decision Analysis tool to evaluate scenarios of alteredhydrologic flows and wetland P accumulation in the central Everglades, assimulated by a landscape model of integrated ecosystem dynamics. Informedby such simulation experiments, scenario analyses using simple nutrient bud-gets (such as those described subsequently), and other planning methods,water managers can better understand and refine future plans for restoringthe Greater Everglades Ecosystem.
The significant heterogeneity in legacy P distribution (and P bioavail-ability) is an important factor to consider in ecosystem restoration in southFlorida. The NEE contains subbasins of high P concentrations, but the EAAcontains the highest (mass per area) concentration of legacy P among thelarge hydrologic units within the Greater Everglades Ecosystem and is locateddownstream of Lake Okeechobee and upstream of the Everglades wetlands.Effective surface water and nutrient management in the EAA and LOB, aswell as in source areas further upstream in the NEE, is critical in helping toachieve the Everglades restoration goals.
Improved land use management practices in uplands can reduce overallP load to receiving water bodies. While the external P loading from uplands iscurtailed through the implementation of BMPs and other improved practices,will the P impacted wetlands and lakes respond to overall P load reduction?The key questions are (a) Will wetlands and aquatic systems respond to Pload reduction? (b) If so, how long will it take for the systems to recover andreach background conditions? and (c) What are the economically feasiblemanagement options to hasten the recovery process?
Downloaded At: 17:06 3 March 2011

Phosphorous Legacy 177
Characterizing the P release potential (P memory) from the reactive Ppool in soils and sediments of the Greater Everglades Ecosystem requiresconsideration of both biotic and abiotic processes. Biotic processes in theEverglades wetlands include assimilation by vegetation, periphyton and mi-croorganisms; abiotic processes include sedimentation, adsorption by soils,precipitation, and exchange processes between soil and the overlying wa-ter column. This P memory can extend the time required for restorationand recovery to a lower nutrient status that historically supported the na-tive Everglades vegetation with associated biogeochemical processes thatdominated under more oligotrophic conditions. This lag time for recoveryshould be considered in developing restoration and management strategiesfor reducing P loads (Figure 10).
We used the P storage in surface soils to estimate the potential lagtime to recovery resulting from the legacy P presently stored throughout thedrainage basin. Based on the chemical fractionation of soil P, we estimateapproximately 35% of total P in soils is nonreactive and is not biologicallyavailable. The remaining 65% may be available for release at different timescales. Three scenarios are presented that represent the potential ramifica-tions of the mobility of the legacy P in LOB, Lake Okeechobee, and the EAA(Figures 11 and 12). Using present P release rates from each hydrologic unit,and assuming either 10 or 25% of reactive soil P is released, we estimatemultidecadal lag times in restoration towards background nutrient status ofthe recipient hydrologic unit.
In the first scenario (Figure 11), present P release rates from the LOB toLake Okeechobee are estimated as ∼500 mt P per year (based on 30 year
FIGURE 10. Schematic showing the relationship between water column phosphorus andinternal memory resulting from legacy phosphorus (Reddy and Delaune, 2008). (This figureis available in color online).
Downloaded At: 17:06 3 March 2011

178 K. R. Reddy et al.
FIGURE 11. Role of legacy phosphorus in the Lake Okeechobee Basin and Lake Okeechobeein determining the lag time for recovery. (This figure is available in color online).
P loading average). A 22-year lag time results if 10% of the reactive P isassumed to be available for release to the downstream receiving basin. Thelag time is on the order of 55 years if 25% of the reactive P pool available forrelease (Figure 11). In other words, legacy P in the LOB would support thepresent 500 mt P per year load to the lake for the next 22–55 years even if allother sources of P were curtailed. At the same time, the mud zone sedimentsin Lake Okeechobee support an estimated internal load of approximately112 mt P per year. Based on the present legacy P in mud sediments and theassumed reactive P (10–25) percentage available, the internal loading supplywould continue to provide P over the next 12–31 years.
Similarly, the legacy P in the EAA can be expected to have significantlong-term impacts on the nutrient status of the STAs and WCAs. The long-term P load (29-year average) from the EAA was estimated to be 170 mt Pper year. Present P loads (WY2009) from the EAA (129 mt P per year; VanHorn and Wade, 2010) are lower than the long-term average load of 170mt P per year. However, the estimated P load to STAs during the WY2009was 218 mt P (Pietro et al., 2010), suggesting that the STAs are receivingsignificant P loads from other sources. STAs removed approximately 82% ofthis load or 1.4 g P m−2 year−1 (Pietro et al., 2010). Assuming that 10–25%of reactive P is available for release, it is suggested that legacy P in surface
Downloaded At: 17:06 3 March 2011

Phosphorous Legacy 179
FIGURE 12. Role of legacy phosphorus in the Everglades Agricultural Area in determininglag time for recovery. (This figure is available in color online).
soils of the EAA would support the 170 mt P per year load to the STAs andWCAs for the next 47–118 years (Figure 12).
Even very conservative estimates (i.e., ≤ 25% of reactive P available fordownstream release) suggest that the legacy P can sustain P loads for manydecades in critical habitats targeted for restoration. For the LOB, effectiveP control strategies are needed to reduce P loads due to the legacy soil P.The BMPs alone will likely be insufficient to reduce P loads to the necessarylevels. Additional P control strategies including the addition of chemicalamendments (Malecki-Brown and White, 2009; Malecki-Brown et al., 2007)and intensively managed STAs should be considered in the LOB to reduceP loads to Lake Okeechobee. External P load reduction should be a highpriority for environmental managers, because very little can be done toreduce the internal load. Dredging and removing sediment P from a lake thesize of Lake Okeechobee would costs billions of dollars and have associatedspoil disposal problems and ecological impacts within the lake. In the EAA,decomposition of soil organic matter will continue to release P at steadyrate and maintain present P loads to STAs and Everglades wetlands. Thusany management strategies that maintain these organic soils are essential toreduce continual P enrichment of the Florida Everglades.
Downloaded At: 17:06 3 March 2011

180 K. R. Reddy et al.
Clearly, reduction of P loading to the Everglades wetlands depends onthe successful management of the EAAs, STAs, and the LOB, given the man-aged interactions between the NEE and SEE. Without effective management,the STAs are unlikely to maintain sustained performance over the long-termand to provide safeguard in preventing P loading to the Florida Everglades.Further consideration and evaluation of P control strategies in the LOB, EAAand STAs are needed to maintain sustained P load reduction for restorationobjectives over the long-term.
ACKNOWLEDGMENTS
The authors thank Dr. George O’Connor at the University of Florida forcritical review and useful comments which helped to improve the quality ofthe manuscript and Yu Wang from the Wetland Biogeochemistry Laboratoryat the University of Florida for assistance in data analysis. Additional reviewsby Drs. R. Delaune (Louisiana State University), G. Redfield (SFWMD), andE. Dunne (SJRWMD) are greatly appreciated. This paper was developed inpart with the financial support from the Florida Department of Agricultureand Consumer Services.
REFERENCES
Anderson, F. O., and Ring, P. (1999). Comparison of phosphorus release from lit-toral and profundal sediments in a shallow, eutrophic lake. Hydrobiologia, 409,175–183.
Belmont, M. A., White, J. R., and Reddy, K. R. (2009). Phosphorus sorption charac-teristics of sediments in Lake Istokpoga and the upper chair of lakes. Journalof Environmental Quality, 38, 987–996.
Bentzen, E., Taylor, W. D. and Millard, E. S. (1992). The importance of dissolvedorganic phosphorus to phosphorus uptake by limnetic plankton. Limnology andOceanography, 37, 217–231.
Bruland, G. L., Grunwald, S., Osborne, T. Z., Reddy, K. R., and Newman, S. (2006).Spatial distribution of soil properties in Water Conservation Area 3 of the Ever-glades. Soil Sci. Soc. Am J., 70, 1662–1676.
Bruland, G. L., Osborne, T. Z., Reddy, K. R., Grunwald, S., Newman, S., and DeBusk,W. F. (2007). Recent changes in soil total phosphorus in the Everglades: WaterConservation Area 3. Environ Monit. Assess., 129, 379–395
Caraco, N., Cole, J. J., and Likens, G. E. (1991). A cross-system study of phospho-rus release from lake sediments. In J. Cole, G. Lovett, and S. Findlay (Eds.),Comparative analyses of ecosystems: Patterns, mechanisms and theories (pp.241–258). Springer-Verlag, New York.
Cheesman, A. (2010). Biogeneic phosphorus in wetlands: Sources and stabilization.Doctoral dissertation, University of Florida, Gainesville, Florida.
Downloaded At: 17:06 3 March 2011

Phosphorous Legacy 181
Childers, D. L., Doren, R. F., Jones, R., Noe, G. B., Rugge, M., and Scinto, L. J.(2003). Decadal change in vegetation and soil phosphorus pattern across theEverglades landscape. J. Environ. Qual., 32, 344–362.
Chua, T. (2000). Mineralization of organic phosphorus in a subtropical freshwaterwetland. Doctoral dissertation, University of Florida, Gainesville, FL.
Cleveland, C. C., and Liptzin, D. (2007). C:N:P stoichiometry in soil: Is there a“Redfield ratio” for the microbial biomass? Biogeochemsitry, 85, 235–252.
Corstanje, R., Grunwald, S., Reddy, K. R., Osborne, T. Z., and Newman, S. (2006).Assessment of the spatial distribution of soil properties in a northern evergladesmarsh. J. Environ. Qual., 35, 938–949.
Craft, C. B., and Richardson, C. J. (1993a). Peat accretion and nutrient accumulation innutrient enriched and unenriched Everglades peatlands. Ecol. Appl., 3, 446–458.
Craft, C. B., and Richardson, C. J. (1993b). Peat accretion, nutrient accumulation andphosphorus storage efficiency along an eutrophication gradient in the northernEverglades. Biogeochemistry, 22, 133–156.
Craft, C. B., and Richardson, C. J. (1997). Relationships between soil nutrientsand plant species composition in Everglades peatlands. J. Environ. Qual., 26,224–232.
Daoust, R. J., and Childers, D. L. (2004). Ecological effects of low level phospho-rus additions on two plant communities in a neotropical freshwater wetland.Oecologia, 141, 672–686.
Daroub, S. H., Van Horn, S., Lang, T. A., and Diaz, O. A. (2011). Best ManagementPractices and Long-Term Water Quality Trends in the Everglades AgriculturalArea. Critical Reviews in Environ. Sci. Technol. 41(S1), 608–632.
Davis, S. M. (1991). Growth, decomposition and nutrient retention of Cladium ja-maicense Cranz. and Typha domingensis Pers. in the Florida Everglades. Aquat.Bot., 40, 203–224.
Davis, S. M. (1994). Phosphorus inputs and vegetation sensitivity in the Everglades. InS. M. Davis and J. C. Ogden (Eds.), Everglades: The ecosystem and its restoration.St. Lucie Press, Delray Beach, FL.
Davis, S. M., Gaiser, E. E., Loftus, W. F., and Huffman, A. E. (2005). Southern marlprairies conceptual ecological model. Wetlands, 25, 821–831
DeBusk, W. F., Newman, S., and Reddy, K. R. (2001). Spatio-temporal patterns of soilphosphorus enrichment in Everglades Water Conservation Area 2A. J. Environ.Qual., 30, 1438–1446.
DeBusk, W. F., and Reddy, K. R. (1998). Turnover of detrital organic carbon in anutrient-impacted Everglades marsh. Soil Sci. Soc. Am. J., 62, 1460–1468.
DeBusk, W. F., Reddy, K. R., Koch, M. S., and Wang, Y. (1994). Spatial patterns ofsoil phosphorus in Everglades Water Conservation Area 2A. Soil Sci. Soc. Am.J., 58, 543–552.
Diaz, O. A., Reddy, K. R., and Moore, P. A. (1994). Solubility of inorganic phosphorusin stream water as influenced by pH and calcium-concentration. Water Research,28, 1755–1763.
Dunne, E. J., Clark, M. W., Corstanje, R., and Reddy, K. R. (2010). The legacy phos-phorus loading in isolated wetland soils of dairy, improved, and unimprovedgrazed pastures. Manuscript submitted for publication.
Downloaded At: 17:06 3 March 2011

182 K. R. Reddy et al.
Fisher, M. M. (2007). Biogeochemical transformations of phosphorus in wetland soils.Doctoral dissertation, University of Florida, Gainesville, FL.
Fisher, M. M., Reddy, K. R., and James, R. T. (2001). Long-term changes in thesediment chemistry of a large shallow subtropical lake. Lake and ReservoirManagement, 17, 217–232.
Fisher, M. M., Reddy, K. R., and James, R. T. (2005). Internal nutrient loads fromsediments in a shallow, subtropical lake. Lake and Reservoir Management, 21,338–349
Fitz, H. C., Kiker, G. A., and Kim, J. B. (2011). Integrated ecological modeling anddecision analysis within the Everglades landscape. Critical Reviews in Environ-mental Science and Technology, 517–547.
Gilmour, C. C., Riedel, G. S., Ederington, M. C., Bell, J. T., Benoit, J. M., Gill, G.A., and Stordal, M. C. (1998). Methylmercury concentrations and productionrates across a trophic gradient in the northern Everglades. Biogeochemistry, 40,327–345.
Gleason, P. (1972). The origin, sedimentation, and stratigraphy of a calcitic mud lo-cated In the southern freshwater Everglades. Doctoral dissertation, PennsylvaniaState University, University Park, PA.
Graneli, W. (1999). Internal phosphorus loading in Lake Ringsjon. Hydrobiologia,404, 19–26.
Hieltjes, H. M., and Lijklema, L. (1980). Fractionation of inorganic phosphates incalcareous sediments. J. Environ. Qual. 9, 405–407.
Ivanoff, D. B., Reddy, K. R., and Robinson, S. (1998). Chemical fractionation oforganic P in histosols. Soil Sci., 163, 36–45.
Koch, M. S., Benz, R. E., and Rudnick, D. T. (2001). Solid-phase phosphorus poolsin highly organic carbonate sediments of Northeastern Florida Bay. Estuarine,Coastal and Shelf Science, 52, 279–291.
Malecki-Brown, L. M., and White, J. R. (2009). Phosphorus sequestration in aluminumamended soils from a municipal wastewater treatment wetland. Soil ScienceSociety of America Journal, 73, 852–861.
Malecki-Brown, L. M, White, J. R., and Reddy, K. R. (2007). Soil biogeochemical char-acteristics influenced by alum application in a municipal wastewater treatmentwetland. Journal of Environmental Quality, 36, 1904–1913.
Marchant, B. P., Newman, S., Corstanje, R., Reddy, K. R., Osborne, T. Z., and Lark,R. M. (2009). Spatial monitoring of a nonstationary soil property: Phosphorusin a Florida water conservation area. Eur. J. Soil Science, 60, 757–769.
McCormick, P., James, R. T., and Zhang, J. (2010). Lake Okeechobee protection pro-gram: State of the lake and the watershed. South Florida Environmental Report.South Florida Water Management District, West Palm Beach, FL.
McCormick, P. V., and M. B. O’Dell. (1996). Quantifying periphyton responses tophosphorus enrichment in the Florida Everglades: A synoptic-experimental ap-proach. J. North Am. Bentholog. Soc., 15, 450–468.
McCormick, P. V., O’Dell, M. B., Shuford, R. B. E., Backus, J. G., and Kennedy,W. C. (2001). Periphyton responses to experimental phosphorus enrichment ina subtropical wetland. Aquatic Botany, 71, 119–139.
McCormick, P. V., Newman, S., Miao, S., Gawlik, D. E., Marley, D., Reddy, K. R.,and Fontaine, T. D. (2002). Effects of anthropogenic phosphorus inputs on the
Downloaded At: 17:06 3 March 2011
Phosphorous Legacy 183
Everglades. In J. W. Porter and K. G. Porter (Eds.), The Everglades, Florida Bay,and coral reefs of the Florida Keys: An ecosystem sourcebook (pp. 83–126). CRCPress, Boca Raton, FL.
McLatchey G. P., and Reddy K. R. (1998). Regulation of organic matter decompositionand nutrient release in a wetland soil. J. Environ. Qual., 27, 1268–1274.
Moore, P. A., and Reddy, K. R. (1994). Role of Eh and pH on phosphorus geochem-istry in sediments of Lake Okeechobee, Florida. J. Environ. Qual., 23, 955–964.
Moore, P. A., Reddy, K. R., and Fisher, M. M. (1998). Phosphorus flux between sed-iment and overlying water in Lake Okeechobee, Florida: Spatial and temporalvariations. J. Environ. Qual., 27, 1428–1439.
Newman, S., McCornick, P. V., and Backus, J. G. (2003). Phosphatase activity asan early warming indicator of wetland eutrophication: problems and prospects.Journal of Applied Phycology, 15, 45–59.
Newman, S., Reddy, K. R., DeBusk, W. F., and Wang, Y. (1997). Spatial distributionof soil nutrients in a northern Everglades marsh: Water Conservation Area 1.Soil Sci. Soc. Am. J., 61, 1275–1283
Newman, S., and Reddy, K. R. (1993). Alkaline phosphatase activity in the sediment-water column of a hypereutrophic lake. J. Env. Qual., 22, 832–838.
Newman, S., Schuette, J., Grace, J. B., Rutchey, K., Fontaine, T., Reddy, K. R.,and Pietrucha, M. (1998). Factors influencing cattail abundance in the northernEverglades. Aquat. Bot., 60, 265–280.
Noe, G. B., Childers, D. L., Edwards, A. L., Gaiser, E., Jayachandran, K., Lee, D.,Meeder, J., Richards, J., Scinto, L. J., Trexler, J. C., and Jones, R. D. (2002).Short term changes in phosphorus storage in an oligotrophic Everglades wet-land ecosystem receiving experimental nutrient enrichment. Biogeochemistry,59, 239–267.
Noe, G. B., Childers, D. L., and Jones, R. D. (2001). Phosphorus biogeochemistryand the impact of phosphorus enrichment: Why is the Everglades so unique?Ecosystems, 4, 603–624.
Osborne , S. Newman, D. J. Scheldt3, P. Kalla, G. L. Bruland, M. J. Cohen, L. J.Scinto7, and L. R. Ellis. 2011. Landscape patterns of significant soil nutrients andcontaminants in the Greater Everglades Ecosystem: Past, present, and future.Critical Reviews in Environ. Sci. Technol. (in this issue).
Olila, O. G., and Reddy, K. R. (1994). Phosphorus sorption characteristics of sed-iments in shallow eutrophic lakes of Florida. Archiv. Fur Hydrobiologie, 129,45–65.
Olila, O. G., and Reddy, K. R. (1997). Influence of Redox potential on phosphorusuptake by sediments in two sub-tropical eutrophic lakes. Hydrobiologia, 345,45–57.
Olila, O. G., Reddy, K. R., and Harris, W. G., Jr. (1995). Forms and distribution ofinorganic phosphorus in sediments of two shallow eutrophic lakes in Florida.Hydrobiologia, 129, 45–65.
Osborne, T. Z., Bruland, G. L., Newman, S., Reddy, K. R., and Grunwald, S. (2010).Spatial distributions and eco-partitioning of soil biogeochemical properties inthe Everglades National Park. Manuscript submitted for publication.
Downloaded At: 17:06 3 March 2011

184 K. R. Reddy et al.
Osborne, T. Z., Newman, S., Scheidt, D. J., Kalla, P., Bruland, G. L., Cohen, M.J., Scinto, L. J., and Ellis, L. R. (2011). Landscape patterns of significant Soilnutrients and contaminants in the Greater Everglades Ecosystem: Past, Present,and Future. Critical Reviews in Environmental Science and Technology, 41(S1),121–148.
Otsuki, A., and Wetzel, R. G. (1972). Coprecipitation of phosphate with carbonatesin a marl lake. Limnology and Oceanography, 17, 763–767.
Penton, C. R., and Newman, S. (2007). Enzyme activity responses to nutrient loadingin subtropical wetlands. Biogeochemistry, 84, 83–98.
Pietro, K., Germain, G., Bearzotti, R., and Iricanin, N. (2010). Performance andoptimization of the Everglades stormwater treatment areas. In South FloridaEnvironmental Report (pp. 155–158). South Florida Water Management District,West Palm Beach, FL.
Qualls, R. G., and C. J Richardson. (1995). Forms of soil-phosphorus along a nutrientgradient in the northern everglades. Soil Science, 160, 183–198.
Reddy, K. R., and Delaune, R. D. (2008). Biogeochemistry of Wetlands: Science andApplications. CRC Press., Boca Raton, Florida, pp. 774.
Reddy, K. R., DeLaune, R. D., DeBusk, W. F., and Koch, M. (1993). Long-termnutrient accumulation rates in the Everglades wetlands. Soil Sci. Soc. Am. J. 57,1145–1155.
Reddy, K. R., Diaz, O. A., Scinto, L. J., and Agami, M. (1995). Phosphorus dynamicsin selected wetlands and streams of the Lake Okeechobee Basin. Ecol. Eng., 5,183–208.
Reddy, K. R., Fisher, M. M., Wang, Y., White, J. R., and James, R. T. (2007). Potentialeffects of sediment dredging on internal phosphorus loading in a shallow,subtropical lake. Lake and Reserv. Manage., 23, 27–38.
Reddy, K. R., Flaig, E. G., and Graetz, D. A. (1996). Phosphorus storage capacityof uplands, wetlands and streams of the Lake Okeechobee Watershed, Florida.Agriculture, Environment and Ecosystems., 59, 203–216.
Reddy, K. R., Newman, S., Grunwald, S., Osborne, T. Z., Corstanje, R., Bruland,G., and Rivero, R. (2005b). Spatial distribution of soil nutrients in the GreaterEverglades Ecosystem. Final Report. South Florida Water Management District,West Palm Beach, FL.
Reddy, K. R., O’Connor, G. A., and Gale, P. M. (1998b). Phosphorus sorption ca-pacities of wetland soils and streams sediments impacted by dairy effluent.J. Environ. Qual., 27, 438–447.
Reddy, K. R., Osborne, T. Z., and Zimmerman, M. S. (2008). Long-term changes inphosphorus storage in selected hydrologic units of the Everglades. USDOI NPS,J5297070080. UPN 07071350.
Reddy, K. R., Wang, Y., Debusk, W. F., Fisher, M. M., and Newman, S. (1998a). Formsof soil phosphorus in selected hydrologic units of the Florida Everglades. SoilSci. Soc. Am. J., 62, 1134–1147.
Reddy, K. R., Wetzel, R. G., and Kadlec, R. (2005a). Biogeochemistry of phosphorusin wetlands. In J. T. Sims and A. N. Sharpley (Eds.), Phosphorus: Agricultureand the environment (pp. 263–316). Soil Science Society of America, Madison,WI.
Downloaded At: 17:06 3 March 2011
Phosphorous Legacy 185
Reddy, K. R., White, J. R., Wright, A., and Chua, T. (1999). Influence of phosphorusloading on microbial processes in soil and water column of wetlands. Phospho-rus in Florida’s ecosystems: Analysis of present Issues. In K. R. Reddy, G. A.O’Connor, and C. L. Schelske (Eds.), Phosphorus biogeochemistry in subtropicalecosystems: Florida as a case example (pp. 249–273). CRC Press/Lewis, BocaRaton, FL.
Reynolds, C. S., and Davis, P. S. (2001). Sources and bioavailability of phosphorusfractions in freshwaters: a British perspective. Biol. Rev., 76, 27–64.
Richardson, C. J. (2008). The Everglades experiments: Lessons from ecosystem restora-tion. Springer, New York.
Richardson, C. J., King, R. S., Vymazal, J., Romanowicz, E. A., and Pahl, J. W. (2008).Macrophyte community responses in the Everglades with an emphasis on cattail(Typha domingensis) and sawgrass (Cladium jamaicense) interactions along agradient of long-term nutrient additions, altered hydroperiod, and fire. In C. J.Richardson (Ed.), The Everglades experiments: Lessons from ecosystem restoration(pp. 215–260). Springer, New York.
Rivero, R. G., Grunwald, S., Osborne, T. Z., Reddy, K. R., and Newman, S. (2007).Characterization of the spatial distribution of soil properties in Water Conserva-tion Area 2A, Everglades, Florida. Soil Sci., 172, 149–166.
Roden, E. E., and Edmonds, J. W. (1997). Phosphate mobilization in iron-rich anaer-obic sediments: Microbial Fe(III) oxide reduction versus iron-sulfide formation.Archiv. Fur Hydrobiologie, 139, 347–378.
Ruttenberg, K. C. (1992). Development of sequential extraction method for differentforms of phosphorus in marine sediments. Limnol. Oceanogr., 37, 1460–1482.
Scinto, L. J., and Reddy, K. R. (2003). Biotic and abiotic uptake of phosphorus byperiphyton in a subtropical freshwater wetland. Aquatic Botany, 77, 203–222.
Scheidt, D. J., and Kalla, P. I. (2007). Everglades ecosystem assessment: Water man-agement and quality, eutrophication, mercury contamination, soils and habitat:Monitoring for adaptive management: A R-EMAP status report. USEPA Region4, Athens, GA. EPA 904-R-07–001.
Sharma, K., Inglett, P. W., Reddy, K. R., and Ogram, A. V. (2005). Microscopic exami-nation of photoautotrophic and phosphatase-producing bacteria in phosphorus-limited Everglades periphyton mats. Limnol. Oceanogr., 50, 2057–2062.
Sklar, F. H., Chimney, M. J., Newman, S., McCormick, P., Gawlik, D., Miao, S.,McVoy, C., Said, W., Newman, J., Coronado, C., Cozier, G., Korvela, M., andRutchey, K. (2005). The ecological-societal underpinnings of Everglades restora-tion. Frontiers Ecol. Environ., 3, 161–169.
Smith, S. M., Newman, S., Garrett, P. B., and Leeds, J. A. (2001). Differential effects ofsurface and peat fire on soil constituents in a degraded wetland of the northernFlorida Everglades. J. Env. Qual., 30, 1998–2005.
Soil and Water Engineering Technology. (2008). Technical assistance in review andanalysis of existing data for evaluation of legacy phosphorus in the Lake Okee-chobee watershed. South Florida Water Management District, West Palm Beach,FL.
Sondergaard, M., Jensen, J. P., and Jeppesen, E. (1999). Internal phosphorus loadingin shallow Danish lakes. Hydrobiologia, 408/409, 145–152.
Downloaded At: 17:06 3 March 2011
186 K. R. Reddy et al.
South Florida Water Management District. (2005). Documentation of the SouthFlorida Water Management Model: Version 5.5. South Florida Water Manage-ment District, West Palm Beach, FL.
Steinman, A., Rediske, R., Reddy, K. R. (2004). The importance of internal phospho-rus loading in Spring Lake, Michigan. J. Environ. Qual., 33, 2040–2048.
Stewart, J. W. B., and Tiessen, H. (1987). Dynamics of soil organic phosphorus.Biogeochemistry, 4, 41–60.
Torres, I. (2008). Linkages between biogeochemical properties and microbial activitiesin lake sediments: Biotic control of organic phosphorus dynamics. Doctoraldissertation, University of Florida, Gainesville, Florida.
Turner, B. L., and Newman, S. (2005). Phosphorus cycling in wetland soils: theimportance of phosphate diesters. J. Environ. Qual., 34, 1921–1929.
Turner, B. L., Newman, S., and Newman, J. M. (2006). Organic phosphorus seques-tration in sub-tropical treatment wetlands. Environ. Sci. Technol., 40, 727–733.
van Eck, G. T. M. (1982). Forms of phosphorus in particulate matter from the Hol-land’s Diep/Haringvliet, the Netherlands. Hydrobiologia, 92, 665–681.
Van Horn, S., and Wade, P. (2010). South Florida Environmental Report. SouthFlorida Water Management District, West Palm Beach, FL.
WBL. 2009. Comprehensive Analysis and Evaluation of Historical Data and Infor-mation for the Stormwater Treatment Areas (STAs). Wetland BiogeochemistryLaboratory Final Report submitted to South Florida Water Management District,West Palm Beach, Florida. Pp.362.
Wetzel, R. G. (2001). Limnology: Lake and river ecosystems (3rd ed.). Academic Press,San Diego, CA.
White, J. R., and Reddy, K. R. (1999). The influence of nitrate and phosphorusloading on denitrifying enzyme activity in Everglades wetland soils. Soil Sci.Soc. Am. J., 63, 1945–1954.
White, J. R., and Reddy, K. R. (2000). The effects of phosphorus loading on organicnitrogen mineralization of soils and detritus along a nutrient gradient in thenorthern Everglades, Florida. Soil Sci. Soc. Am. J., 64, 1525–1534.
White, J. R., and Reddy, K. R. (2001). Effect of select inorganic electron acceptors onorganic nitrogen mineralization in northern Everglades soils. Soil Sci. Soc. Am.J., 65, 941–948.
White, J. R., Reddy, K. R., and Moustafa, M. Z. (2004). Influence of hydrologyand vegetation on phosphorus retention in Everglades stormwater treatmentwetlands. Hydrological Processes, 18, 343–355.
Withers, P. J. A., and Jarvie, H. P. (2008). Delivery and cycling of phosphorus inrivers: A review. Science of Total Environment, 400, 379–395.
White, J. R., Reddy, K. R., and Newman, J. M. (2006). Hydrology and vegetationeffects on water quality in subtropical constructed wetlands. Soil Sci. Soc. Am.J., 70, 1242–1251.
Wright, A. L. (2009). Soil phosphorus stocks and distribution in chemical fractionsfor long-term sugarcane, pasture, turfgrass, and forest systems in Florida. Nutr.Cycl/Agroecosyst., 83, 223–231
Wright, A. L., and Reddy, K. R. (2001). Phosphorus loading effects on extracellularenzyme activity in Everglades wetland soil. Soil Sci. Soc. Am. J., 65, 588–595.
Downloaded At: 17:06 3 March 2011