critical links: population, health, and the environment
TRANSCRIPT

The scope, magnitude, and complexity of humanimpacts on the environmenttoday are unprecedented.
Emerging knowledge helps us understand how environmental changes affect human well-being.
To protect human and environmental well-being, policy and perception need to match reality.
Critical Links: Population, Health, and the Environmentby Roger-Mark De Souza, John S. Williams, and Frederick A.B. Meyerson
BULLETIN A publication of the Population Reference Bureau
Population
Vol. 58, No. 3
September 2003

Population Reference Bureau (PRB)Founded in 1929, the Population Reference Bureau is the leader in providing timely andobjective information on U.S. and international population trends and their implications.PRB informs policymakers, educators, the media, and concerned citizens working in the public interest around the world through a broad range of activities, including publications,information services, seminars and workshops, and technical support. Our efforts are sup-ported by government contracts, foundation grants, individual and corporate contributions,and the sale of publications. PRB is governed by a Board of Trustees representing diversecommunity and professional interests.
OfficersMichael P. Bentzen, Chairman of the Board,
Partner, Hughes and Bentzen, PLLC, Washington, D.C.Patricia Gober, Vice Chairwoman of the Board,
Professor of Geography, Arizona State University, TempeJames E. Scott, Acting President,
Population Reference Bureau, Washington, D.C.Jodie T. Allen, Secretary of the Board,
Managing Editor, U.S. News & World Report, Washington, D.C.Richard F. Hokenson, Treasurer of the Board,
Director, Hokenson and Company, Lawrenceville, New Jersey
TrusteesPatty Perkins Andringa, Consultant and Facilitator, Bethesda, MarylandSuzanne M. Bianchi, Professor of Sociology and Director of the Population Research Center, University of
Maryland, College ParkBert T. Edwards, Executive Director, Office of Historical Trust Accounting, Office of the Secretary, U.S.
Department of the Interior, Washington, D.C. James H. Johnson Jr., William Rand Kenan Jr. Distinguished Professor and Director, Urban Investment
Strategies Center, University of North Carolina, Chapel HillTerry D. Peigh, Executive Vice President and Director of Corporate Operations, Foote, Cone & Belding,
Chicago, Illinois Francis L. Price, Chairman and CEO, Q3 Industries and Interact Performance Systems, Columbus, OhioDouglas Richardson, Executive Director, Association of American Geographers, Washington, D.C.Gary B. Schermerhorn, Managing Director of Technology, Goldman, Sachs & Company, New York Barbara Boyle Torrey, Independent Writer and Consultant, Washington, D.C.Leela Visaria, Professor, Gujarat Institute of Development Research, Ahmedabad, IndiaMontague Yudelman, Senior Fellow, World Wildlife Fund, Washington, D.C.
Mildred Marcy, Chairwoman Emerita
Editor: Mary Mederios KentProduction/Design: Tara Hall
The Population Bulletin is published four times a year and distributed to members of the Popula-tion Reference Bureau. Population Bulletins are also available for $7 (discounts for bulk orders).To become a PRB member or to order PRB materials, contact PRB, 1875 Connecticut Ave.,NW, Suite 520, Washington, DC 20009-5728; Tel.: 800-877-9881; Fax: 202-328-3937; E-mail: [email protected]; Website: www.prb.org.
The suggested citation, if you quote from this publication, is: Roger-Mark De Souza, John S.Williams, and Frederick A.B. Meyerson, “Critical Links: Population, Health, and the Environment,”Population Bulletin 58, no. 3 (Washington, DC: Population Reference Bureau, 2003). For permissionto reproduce portions from the Population Bulletin, write to PRB, Attn: Permissions.
© 2003 by the Population Reference BureauISSN 0032-468X
Printed on recycled paper
1
BULLETIN A publication of the Population Reference Bureau
Population
Vol. 58, No. 3
September 2003
Critical Links: Population, Health,and the EnvironmentIntroduction . . . . . . . . . . . . . . . . . . . . . . . . . . . . . . . . . . . . . . . . . . . . . . . . . . . . . . 3
The Population-Environment Relationship. . . . . . . . . . . . . . . . . . . . . . . . . . 4Box 1. What Do We Mean by Population, Health, and the Environment? . . . 5Figure 1. Population in Major World Regions, 2000 and
Projections for 2050 . . . . . . . . . . . . . . . . . . . . . . . . . . . . . . . . . . . . . . . . . . . . 6Figure 2. Growth of Urban and Rural Populations, 1950–2030 . . . . . . . . . . . . 7Box 2. Local Area Perspective: Why Migration Matters. . . . . . . . . . . . . . . . . . . 8Figure 3. The Population, Health, and Environment Cycle . . . . . . . . . . . . . . 12Figure 4. Factors Affecting the Population and Environment
Relationship. . . . . . . . . . . . . . . . . . . . . . . . . . . . . . . . . . . . . . . . . . . . . . . . . . 14
Far-Reaching Consequences . . . . . . . . . . . . . . . . . . . . . . . . . . . . . . . . . . . . . 17Figure 5. Increase in Motor Vehicles, 1960 to 2020 . . . . . . . . . . . . . . . . . . . . . 18Figure 6. Projected Loss of Agricultural Labor Force Because of
HIV/AIDS, Selected African Countries, 1985–2020 . . . . . . . . . . . . . . . . . 19Figure 7. World Production of Fossil-Fuel Energy by Type, 1950–1999 . . . . . 22Figure 8. Energy Consumption per Capita, World Regions, 1999 . . . . . . . . . 23Figure 9. Per Capita Carbon Dioxide (CO2) Emissions, 1950–1999 . . . . . . . . 24Figure 10. World Marine Catch, 1970–2000 . . . . . . . . . . . . . . . . . . . . . . . . . . . 27Table 1. Economic Losses From Red Tides, 1970s to 1990s . . . . . . . . . . . . . . 28
Looking to the Future . . . . . . . . . . . . . . . . . . . . . . . . . . . . . . . . . . . . . . . . . . . . 30Box 3. Enhancing Expertise in Population, Health, and the Environment . . . 31Box 4. Missed Connections: International Environmental and
Population Conferences . . . . . . . . . . . . . . . . . . . . . . . . . . . . . . . . . . . . . . . . 34
Conclusion . . . . . . . . . . . . . . . . . . . . . . . . . . . . . . . . . . . . . . . . . . . . . . . . . . . . . . 37
References . . . . . . . . . . . . . . . . . . . . . . . . . . . . . . . . . . . . . . . . . . . . . . . . . . . . . . 39
Suggested Resources . . . . . . . . . . . . . . . . . . . . . . . . . . . . . . . . . . . . . . . . . . . . 43

2
About the Authors
Roger-Mark De Souza is the technical director of the population, health, and environment pro-gram at the Population Reference Bureau. His responsibilities include designing, managingand implementing policy research, capacity building, technical assistance, and media projectsin developing countries. De Souza holds graduate degrees from the George Washington Univer-sity and the University of the West Indies.
John S. Williams, a demographer at the Population Reference Bureau, specializes in popula-tion, environment, and community programs. Williams, who holds a doctoral degree fromPrinceton University, is an active member of the World Conservation Union’s Species SurvivalCommission and has supported integrated conservation and development research and projectsin Asia and Africa.
Frederick A.B. Meyerson is an ecologist and demographer who specializes in populationpolicy and the interactions between population and the environment, particularly climatechange and biodiversity. He has a doctoral degree from Yale University and a law degree fromColumbia University. Meyerson has taught at Yale and Brown universities, and was an Amer-ican Association for the Advancement of Science Fellow at the National Science Foundationand the U.S. Environmental Protection Agency from 2001 to 2003. He is currently a publicpolicy scholar at the Woodrow Wilson International Center for Scholars, writing a book onU.S. population policy.
The authors would like to acknowledge the many people who contributed to this PopulationBulletin, with special thanks to Richard Bilsborrow, Marc Cohen, Alex de Sherbinin, RobertEngleman, Clare Ginger, Mai Hijazi, Mary Kent, Robert Livernash, Zuali Malsawma, AllisonTarmann, Barbara Boyle Torrey, and Frank Zinn. The writing and production of this publica-tion were supported by USAID. Portions of this publication were adapted from a 1998 Popula-tion Bulletin, “Population Change, Resources, and the Environment,” by Robert Livernashand Eric Rodenburg.
© 2003 by the Population Reference Bureau

3
The impact of the world’s 6.3 billion people on the envi-ronment is unprecedented.
Humans had a negligible effect onthe environment 3,000 years agowhen fewer than 100 million peoplelived on Earth, but by the early 21stcentury, we have altered more thanone-third of Earth’s ice-free surfaceand threatened the existence of manyplant and animal species. Thesechanges also pose threats to our well-being. The burning of gas, coal, andoil, for example, is increasing concen-trations of carbon dioxide in theatmosphere, altering the global cli-mate and affecting human health.
The number of people is just one factor driving environmentalchange. Other demographic factorsalso cause change. Where people liveand the rate of population growthincrease the demand for naturalresources such as water and fossilfuels, adding pressure on environ-mental systems such as watershedsand rainforests. The relative propor-tions of children, persons of workingage, and elderly within a populationhave repercussions for future popula-tion growth, health risks, and use ofservices such as public transportation.
Other forces, such as public poli-cies, technological developments, andculture, can ease or worsen the pres-sures that these demographic factorsplace on society and the environment.One example is the growth of citiesthroughout the world. This urban
growth brings changes in lifestyles,consumption patterns, infrastructuredevelopment, and waste production.
This Population Bulletin highlightsthe results of research, communityprojects, and public policies to exam-ine three critical questions aboutpopulation, health, and environmentrelationships. First, what is the natureof these relationships? Second, how dothese relationships affect human well-being and the environment? Andfinally, what can researchers, localcommunities, and policymakers do toaddress these impacts?
Addressing these questions meansdelving into the complexity of popula-
Critical Links: Population, Health, and the Environmentby Roger-Mark De Souza, John S. Williams, and Frederick A.B. Meyerson
The well-being of people and the natural environment areclosely connected. Ensuring that well-being means meetinghuman needs without destroying the resources and naturalservices that sustain life on Earth.
Photo removed forcopyright reasons.

4
tion, health, and environment rela-tionships and reaching out to expertsfrom diverse fields. Natural and socialscientists who study demographictrends, political structure, land use,agriculture, climate change, biodiver-sity loss, and an array of other special-ties can all contribute to a greaterunderstanding of population, health,and environment relationships.
But the synthesis of these contribu-tions has been stymied by the verydiversity of the scientific disciplinesinvolved. Each field has its own termi-nology, methodology, and priorities.Fortunately, there is a growing aware-ness that closer cooperation amongscientists from different disciplines willhelp head off current and impendingthreats to human and environmentalwell-being.
Translating increased knowledgeinto policies and action that will pro-tect the well-being of people and theenvironment may be the greatest chal-lenge of all. Researchers need to edu-cate policymakers and the publicabout why they need to take actionand what they can do. Researchers alsomust be able to justify the social, politi-cal, and economic costs of laws andpolicies that sometimes conflict withculture and tradition, such as expand-ing women’s rights, regulating landuse, and requiring cleaner industrialtechnology. Efforts to address popula-tion, health, and environment issuesextend from the global level, whichrequires international cooperation, tothe household level, which involvesindividual choices and behavior.
These challenges are daunting, but there are a number of success stories to guide us. The policies thatslow population growth by loweringfertility are well known, for example.Effective policies involve improvingeducation, primary health care, andemployment opportunities and rais-ing the status of women. Laws to regu-late pollution have been responsiblefor cleaner air and water in manycountries. More efficient technologyand new materials promise to reducetoxic wastes and ease the demand onnatural resources.
At the community level, conserva-tion and health organizations havecooperated on successful projects tointegrate environmental protectionand public health. And individualshave demonstrated a willingness tochange behavior when they believe it is necessary, illustrated by a widespreadcompliance with recycling policies insome countries, for example. As theknowledge base, community experi-ence, and political expertise expand,there will be many more lessons toguide the efforts to promote humanand environmental well-being.
The Population-Environment RelationshipEarth’s natural resources and systemsand its human population are inher-ently connected. The fundamentalrelationships are fairly easy to grasp:People rely on food, air, and water forlife. Earth provides energy and rawmaterials for human activities, andthose activities, in turn, affect theresources and ecosystems. Pollutionand damage to those environmentalgoods adversely affect people’s healthand well-being.
Assessing the interactions amongpopulation, health, and the environ-ment is not that simple, however.1It encompasses the study of humanpopulation growth, consumption, and resource use as well as the studyof the natural world, its climatology,genetics, biochemistry, and popula-tion biology. Cooperation betweennatural and social scientists has beencomplicated by major differences inparadigms, assumptions, and defini-tions (see Box 1). At the same time,many environmentalists and scientistsconcerned with protection of plantand animal species are acknowledgingthat protecting nature also involvesimproving the circumstances of people.
These challenges are evident inthe study of effects of population
Earth’s naturalresources and
its human population are
inherently connected.

growth on land use. First, much ofthe existing research focuses on casestudies of specific areas or communi-ties, and the results of such studiesgenerally are not applicable to largerareas.2 In addition, demographic andecological data generally are not col-lected in comparable geographicareas. Demographic surveys are usu-ally conducted within a politicalregion, such as a district or country;land use data are more often col-lected for a particular ecosystem orlandscape, which can cross politicalboundaries. Finally, much of theresearch conducted on populationgrowth and environmental changehas focused on documenting assoc-
iations between environmentalchanges and demographic variablesrather than identifying the specificcauses of change.
It is difficult to evaluate suchchanges with regard to specificissues—such as land use—partlybecause of the poor quality of avail-able data and problems determiningwhat factors drive change. For exam-ple, does climate change or humanactivity have the greater effect onland use?3 Careful research examin-ing population and environmentrelationships has provided a betterunderstanding of the importance of these connections to human andecological well-being.
5
Box 1What Do We Mean by Population, Health, and the Environment?
Increasing numbers of people and organizations areinvolved with issues related to population, health,and the environment. While many groups are work-ing toward similar goals, communication amongthese groups is sometimes stymied by the lack ofcommon definitions for basic terms. Population,health, and environment mean one thing to a con-servation group, for example, and another thing toa family planning service coordinator or researchdemographer.
To demographers, the study of populationinvolves the three variables that cause populationchange—births, deaths, and migration—and suchpopulation characteristics as age, sex, race, place ofresidence, income, and education.
When managers of family planning programs saythey work in “population,” they are likely to meanthat their activities involve reproductive health andpossibly gender issues, but they are not likely toconsider migration or age structure to be part ofthe definition.1
People involved in community projects and stud-ies may attribute yet another meaning to the term.Population work to them means encouraging publicparticipation in meetings and involving communi-ties in project design and management.
The term “health” may also carry different mean-ings to groups involved in the emerging field ofpopulation, health, and environment. Health mayrefer to public health or environmental health. Pub-lic health refers to the general well-being of a groupof people and the factors that ensure that well-being. The term environmental health is used in avariety of ways, but it usually applies to the well-
being of people and the natural environment.Groups that work in environmental health may limitthat meaning to either people or the environment,or may include both.2 Most groups working in thisarea tend to focus on the effects of environmentalchanges (such as air pollution) on human health(asthma, for example); the general quality of theair, water, forests, and other natural resources; andthe health of global life-support systems.
When conservationists say they work on environ-mental issues, they often mean protecting naturalareas and biodiversity, whereas a town planner mayapply the term “the environment” in the context ofland-use planning.
Research into population, health, and environ-ment interactions may combine elements of all ofthese definitions. Once demographers, conserva-tionists, and public health groups agree what theterms mean in a specific context, they might launcha study to examine, for example, how householdtransportation decisions affect urban air pollutionand, subsequently, how that air pollution affectshuman health.
References1. Justine Sass, “Women, Men, and Environmental
Change: The Gender Dimensions of EnvironmentalPolicies and Programs” (Washington, DC: PopulationReference Bureau, 2002).
2. Gurinder S. Shahi et al., “The Environment-Develop-ment-Health Interface,” in International Perspectives onEnvironment, Development, and Health: Toward A Sustain-able World, ed. Gurinder S. Shahi et al. (New York:Springer Publishing Company, 1997).

Demographic OutlookSeveral demographic trends stronglyaffect the way humans change thenatural world. The regional distribu-tion of population is shifting asgrowth continues in some regions,especially in Africa and western and southern Asia, and declines inothers, such as Europe. Withinregions and countries, the popula-tion is shifting from rural to urbanareas and concentrating in coastalregions. In addition, the number of households is increasing morerapidly than the population. House-holds are getting smaller as coupleshave fewer children and are lesslikely to share their homes withextended family members. Smallerhouseholds consume as much as or more than larger households.4Even those countries with stable ordeclining populations have increas-ing numbers of households andassociated sprawl.
World population in 2050 is pro-jected to range between 7.4 billionand 10.6 billion. The total willdepend primarily on future fertilityrates, but also on mortality rates,which have become less predictablein light of HIV/AIDS, agriculturaland economic crises, and warfarearound the world.5 Ninety-nine per-
cent of world population growth is occurring in less developed countries.
Among the larger developedcountries, only the United Statesshows robust growth, because of itsrelatively high birth rate and steadyimmigration. In contrast, Europe’spopulation is expected to declinefrom 728 million to 632 millionbetween 2000 and 2050, because oflow birth rates and an aging popula-tion (see Figure 1). Europe’s fertilityrates have been low for quite sometime. As a result, Europe’s popula-tion has been growing older;Europe’s “youth dearth” is now tak-ing on a more significant rolebecause of impending populationdecline in much of the region.
Globally, there will be more than 1 billion people ages 60 and older by 2025, and nearly 2 billion by 2050.As world fertility rates decline andlife expectancy rises, the populationwill age faster in the next 50 years.The age structure of the populationalso affects the environment. A rapidexpansion of the working-age popu-lation, which many less developedcountries are experiencing today,often drives economic expansion,migration to new areas, and construc-tion of new homes and supportinginfrastructure.6 An older population is more vulnerable to health threatsbrought by environmental changes,including respiratory diseases associ-ated with air pollution and thespread of infectious diseases associ-ated with climate change, deforesta-tion, and water pollution.
While life expectancy is rising inmost countries, the rapid spread ofHIV/AIDS in recent decades hasdepressed life expectancy in themost affected countries; the diseaseis now the fourth most-commoncause of death worldwide. Morethan 60 million people have beeninfected with HIV since the 1970s,and 20 million have died. Of the 40million people living with HIV/AIDSworldwide, 70 percent are in sub-Saharan Africa, where is it the lead-ing cause of death.7
6
Population in millions
796
1,803
3,680
5,222
728 632 520768
316 448
2000 2050
Africa Asia Europe Latin America/Caribbean
North America
Figure 1Population in Major World Regions, 2000 and Projections for 2050
Source: United Nations, World Population Prospects: The 2002 Revision (2003): mediumprojection series.

7
Even with fertility declines andincreased mortality from HIV/AIDS,world population will probably con-tinue to grow rapidly for severaldecades because of the momentumcreated by the large proportion ofchildren. There have never been somany young people in the world.Today, children under age 15 makeup one-third of the population in lessdeveloped countries and an evengreater proportion in some regions.In contrast, less than one-sixth of thepopulation in more developed coun-tries is under age 15.8
Many of these young people are onthe move. International migration isat an all-time high. At least 160 mil-lion people were living outside theircountry of birth or citizenship in2000, up from an estimated 120 mil-lion in 1990.9 Despite these high num-bers of international migrants, most ofthe world’s 6.3 billion people nevercross a national border.
Over the next 30 years, urbanpopulations are expected to expand,while rural populations hold steady ordecline worldwide (see Figure 2). Thepercentage of people living in urbanareas is projected to increase from 47percent to 60 percent worldwidebetween 2000 and 2030, according tothe United Nations.10 Rural popula-tions are projected to decline in mostmore developed countries and someless developed countries (such asBrazil, China, and Mexico) between2000 and 2030, although the worldtotal is expected to rise from 2.9 billion to 3.1 billion, led by largeincreases in rural areas of India,Bangladesh, and Afghanistan, amongother countries. Although the percent-age of people living in rural areas hasbeen declining throughout the world,the number of rural dwellers in lessdeveloped countries rose by almost 1billion between 1960 and 2000.
Environmental ImpactsHumans influence the natural en-vironment in many ways. Someimpacts are direct. Humans hunt andgather wild plant and animal species;
clear forests for timber, agriculture,or infrastructure; and withdrawgroundwater. Other impacts are indi-rect. Burning fossil fuel releases car-bon into the atmosphere, increasinggreenhouse gases that affect climate.Ships plying the oceans sometimescarry plant and animal species intonew areas, crowding out or harmingthe native species. Insecticides usedto protect harvests reduce insectpopulations, which are then unableto pollinate wild plants.
Population growth does not neces-sarily lead to a serious deteriorationof the natural environment. Humaninventiveness has resulted in techno-logical advances that enable morefood to be grown in smaller areas,wastewaters cleaned, and significantareas of biodiversity protected. InIndia, for example, a new concept—People’s Protected Area (PPA)—aimsto conserve biodiversity by facilitat-ing poor people’s access to theresources provided by protected natural areas. The network of PPAsfocuses mainly on biodiversity-richbuffer zones, fringe areas, and corri-dors of natural parks and wildlifesanctuaries. It aims to convert
0
2
4
6
8Billions
Urban More developed countries
Urban Less developed countries
Rural More developed countries
Rural Less developed countries
1950 1960 1970 1980 1990 2000 2010 2020 2030
Figure 2Growth of Urban and Rural Populations, 1950–2030
Source: United Nations, World Urbanization Prospects: The 2001 Revision (2002): tablesA.3 and A.4.

open-access natural resources intocommunity-controlled resources,thereby increasing the incomesearned by local people from forestproducts and protecting the area’sbiodiversity.11
Role of MigrationBecause migration flows are sovolatile, they are the most difficultdemographic variable to forecast. Yetmigration can play an important partin the future size and characteristicsof local, country, and regional popula-tions. In the early 1990s, environmen-tal scientist Norman Myers estimatedthere were at least 25 million environ-mental refugees—people driven tomigrate by environmental factors suchas degraded agricultural land, defor-estation, or drought. More than half
were thought to be in sub-SaharanAfrica.12 Myers predicted that thenumber of environmental refugeeswas likely to double by 2010, and itcould swell to 200 million by 2025because of climate change and othersources of environmental degradation.
Most environmental migrationoccurs within national boundaries anddoes not affect national populationsize, but migration is important topopulation growth and characteristicsat local levels (see Box 2). While theflow from rural to urban areas hasbeen a dominant trend, especially inLatin America, people also move fromone rural area to another, especiallywhen drought, famine, or politicalevents push agricultural workers offtheir land. Rural migrants sometimesmove into forests or ecologically frag-
8
Box 2Local Area Perspective: Why Migration Matters
Population and conservation programs working incommunities where population growth is pressuringnatural resources frequently focus on providingreproductive health services. People living nearremote protected areas or fragile coastlines oftenhave the characteristics associated with high fertility:low education and incomes and limited access tofamily planning. They often have high fertility and ayoung population profile that drive future popula-tion growth. Expanding access to reproductivehealth services for these populations can help lowerfertility and improve maternal and child health—which can benefit public and environmental health.
Community projects rarely consider the demo-graphic effect of migration on population growth andcomposition and the additional stress it can bring tolocal ecosystems. A 2 percent annual net in-migrationrate would cause a community of 6,000 persons inWest Bengal, India, to more than double in 25 years,even if birth rates fell quickly to low levels (see fig-ure). With no net migration, the same communitywould grow by about one-third through naturalincrease (births minus deaths). Net out-migration—which is common in many rural areas of less devel-oped countries—would hold population steady,although the characteristics of the community wouldlikely change.
Because people are most likely to move when theyare in their young adult years, migration sometimesalters the age profile of the migrant-sending and
migrant-receiving communities. In the exampleabove, the working-age population would increase by137 percent over 25 years, assuming 2 percentannual net in-migration. With zero net migration,the working-age population would rise 56 percent.With net out-migration of 2 percent annually, theworking-age population would still rise 19 percent in25 years, although the number of children under age15 would decline by 42 percent (not shown above).
If fertility declines rapidly, the size of households islikely to decline. But the number of households willincrease much more rapidly than the community’stotal population because of the increase in the work-
104%
137%
33%
56%
1%19%
Total population (from 6,000 in 2000)Working-age population (from 3,573 in 2000)
Percent increase in:
Effects of Migration on PopulationGrowth, 2000 to 2025: Three Scenariosfor a Community in West Bengal, India
Note: Total fertility rate assumed to fall from 3.75 to 2.10 children per womanbetween 2000 and 2010 and remain stable until 2025.
Source: Prepared by John S. Williams, Population Reference Bureau.
9
ile areas to farm or harvest wildspecies, which can cause considerabledamage to local ecosystems if theylack the knowledge or resources toprotect the natural environment.
Growing rural populations requireadditional land not only for food andincome, but also for housing, roads,and other infrastructure. New ruralresidents will also require naturalresources to meet food, fuel, water,and raw material needs. Most rural res-idents—including new immigrants—rely on agriculture for their livelihood.
Effects of Population GrowthIs population growth good or bad forthe environment and human well-being? The answer to this question isneither straightforward nor simple.Consider the case of urbanization. A
population shift toward urban areasmeans that a larger share of people willhave access to health care, education,and other services; living standards arelikely to improve. Greater populationdensities will enable more communi-ties to capitalize on economies of scale,for example, by investing in more effi-cient and cost-effective water manage-ment. And concentrating populationwithin an urban area can preserve adjacent natural habitat, assuming that urban sprawl is contained.
At the same time, dense urbanpopulations may produce more wastethan the environment can absorb,leading to significant air and waterpollution and a greater incidence ofinfectious and parasitic diseases. Citiesoften develop near fragile coastalareas or rivers or adjacent to fertile
ing-age population. An increase in households canhave a greater impact on the environment than anincrease in total population. Each new householdrequires electrical appliances, produces waste, andcan involve constructing new buildings and infra-structure. Additional natural areas may be convertedfor human use.1
Most people move to improve their economicopportunities or escape from difficult political orenvironmental situations.2 Government attempts toregulate migration have been largely unsuccessful.Policies can encourage or discourage migration—but sometimes as an unintended consequence.Efforts to conserve resources or spur economicgrowth in some communities adjacent to nationalparks have stimulated so much in-migration that theadded population threatens the resources of the pro-tected area.3 Anecdotal evidence suggests that bring-ing electricity to an area can stimulate out-migrationof young people because they are exposed to televi-sion and other influences from the outside world.4
Explicit policies to prevent or encourage migra-tion are rarely successful. Migration from Bangla-desh into India’s West Bengal province is illegal,but Bengalis continue to flow into communitiesadjacent to the region’s Jaldapara Sanctuary.5 Simi-larly, large numbers of people are moving illegallyfrom the hills to the lower valleys of Nepal.
Economic development in the migrant-sendingareas can sometimes ease the push factors that
stimulate migration, but these have not been verysuccessful at controlling migration flows. Judiciousland-use planning and zoning may encourage settle-ment patterns less disruptive to the natural environ-ment and avoid development that stimulates furtherin-migration. In the Waza Logone community onthe boundary of Waza National Park in northernCameroon, the government has attempted to dis-courage in-migration by granting newcomers fewerrights than the original inhabitants.6
References1. Jianguo Liu et al., “Effects of Household Dynamics on
Resource Consumption and Biodiversity,” Nature 421(Jan. 30, 2003): 530-33.
2. Richard E. Bilsborrow, “Migration, Population Change,and the Rural Environment,” Environmental Change andSecurity Project Report 8(2002).
3. Katrina E. Brandon and Michael Wells, “Planning forPeople and Parks: Design Dilemmas,” World Development20, no. 4 (1992): 557-70.
4. John S. Williams, “Incorporating Community Popula-tion Appraisal in Endangered Species Workshops”, inExperiments in Consilience: Social and Scientific Challenges toBiodiversity Conservation, ed. Frances Westley and PhilipMiller (Washington, DC: Island Press, 2003).
5. Williams,“Incorporating Community Population Appraisal.”6. Paul Scholte, “Immigration: A Potential Time Bomb
Under the Integration of Conservation and Develop-ment,” Ambio 32, no. 1 (2003): 58-64.

10
agricultural land. Rapid urban growthoften takes over farmland, destroyswildlife habitats, and threatens sensi-tive ecosystems and inshore fisheries.Urban populations generally use morewater for domestic and industrial pur-poses than rural populations. In Jor-dan, for example, the rapid growth of Amman and Zarqa has led to thegradual depletion of a major under-ground water reserve, reducing wateravailability for farmers and desiccatingan internationally important wet-land.13 This balance between the ben-efits and potential threats posed bycurrent population trends harkensback to historic concerns about thelimits to population size.
Limits to Population SizeWriting at the end of the 18th century,English economist Thomas Malthusobserved that population was growingfaster than agricultural production inEngland. In his famous Essay on thePrinciple of Population, Malthus statedthat population grows geometrically(from 2 to 4 to 8, 16, and 32), whilethe food supply can only increasearithmetically (from 1 to 2, 3, 4, and5).14 Population growth, he theorized,would ultimately be constrained bythe amount of land available for foodproduction. He described a feedbackprocess in the population-environ-ment relationship in which overpopu-lation would produce widespreadfamine, illness, and death, and ulti-mately reduce population size.
Malthus’ concern about the limits to population size has been shared bynumerous philosophers and scientiststhroughout human history. The ancientGreeks and Egyptians voiced appre-hension about overpopulation and theneed to limit population growth and, in prosperous times, the need for cou-ples to have more children.15
The unprecedented populationgrowth of the last century heightenedanxieties about possible catastrophiccollapse brought about by exceedingthe population size Earth could sup-port. In 1995, for example, demogra-pher Joel Cohen noted that “the
possibility must be considered seriouslythat the number of people on theEarth has reached, or will reach withinhalf a century, the maximum numberthe Earth can support in modes of lifethat we and our children and theirchildren will choose to want.”16
The idea of an ultimate limit topopulation size was rooted in thenotion of carrying capacity, whichrefers to the maximum number ofanimals of one or more species thatcan be supported by a particular habi-tat during the least favorable time ofyear—for example, a cold winter or a dry season. Human carrying capac-ity is often used to define the numberof people that can be supported byEarth or a specific ecosystem. Simplemodels of population growth thatassume a limit to population size give rise to a growth pattern whereinpopulation size increases quickly at first and then more slowly as itapproaches its ultimate limit. Esti-mates of carrying capacity assumethat a growing population will eventu-ally trigger an increase in death ratesas it pushes up against the limits ofresources necessary to support life.
More recently, the concept of carry-ing capacity has given way to a relatednotion: sustainable development. Sus-tainable development has been usedto describe the level of human activitythat can “meet the needs of the pre-sent without compromising the abilityof future generations to meet theirown needs.”17 Sustainable develop-ment does not imply absolute limitson human activities or on the numberof people but, like carrying capacity,the limits are “imposed by the presentstate of technology and social organi-zation on environmental resourcesand by the ability of the biosphere toabsorb the effects of human activities.”
The real question, however, as sug-gested by Cohen, is not how manypeople Earth can support, but howmany people can Earth support withwhat quality of life? Answering thisquestion involves addressing a host ofvalue-laden questions about humansociety as well as the natural environ-ment. What levels of material well-
How many people can
Earth supportwith what
quality of life?

11
being and technology do we expect to have, and for what share of theglobal population? What forms of gov-ernments and economic structuresare acceptable? How much naturalforest and rangeland do we expect tohave? How clean do we expect the airand water to be? How many childrendo couples want to have? How longare we expected to live?
Conceptual ApproachesScientists have used a number ofapproaches to seek answers to thesequestions. Cohen’s line of inquiryputs people first. A natural scientistmight pose the question as: Howmany people, with what consumptionpatterns, can coexist with a healthyglobal environment? To answer thisquestion we need to address otherquestions, such as: How much forestand other land area is needed tomaintain reasonable stocks of biologi-cal diversity? What maximum level ofglobal carbon dioxide emissionswould maintain a reasonably stableglobal climate? How many fish can weharvest from the oceans and still havehealthy stocks of global fish species?
Using Earth’s ecosystems ratherthan humans as a frame of referencemight yield different, probably lower,estimates of optimum global popula-tion size. Several natural scientistswriting after 1970 have suggested thatwe have already exceeded the popula-tion size that can be sustained overthe long term.18 Scientists with thisgenerally pessimistic viewpoint oftenfocus on rapid world populationgrowth, the growing concentration ofcarbon dioxide in the atmosphere,the declining health of the oceans,reduced biodiversity, persistent dis-eases, and degraded land.
Scientists with a more optimisticperspective often examine how wecan best unleash human creative abili-ties, not on limits to human popula-tion growth or resources. Theseoptimists believe that people have thecreative capacity to overcome poten-tial environmental harm brought by agrowing population and intense eco-nomic activity. They point to the gen-
eral improvements in human healthand life expectancy, rising per capitaincomes, remarkable advances in foodproduction, and technological innova-tions that can reduce environmentalpollution and improve the efficiencyof economic activity.19
Reconciling these different andsometimes contradictory conceptualapproaches has been complicated byresearch, analytical, and statisticalmethodologies reflecting differentdisciplines and by the sometimesconflicting interests of individuals,communities, organizations, andgovernments.
Modeling InteractionsOver the past several decades, scien-tists have developed a number ofmodels to study the interactionsamong population, health, and theenvironment. These models cannotfully predict whether or when popula-tion growth and human activities willbe constrained by shortages in food,water, and other resources, but theyhave helped scientists explore therole of population in environmentaldegradation, and have contributed todiscussions of carrying capacity andsustainable development.
Limits to GrowthIn 1972, Donella Meadows and hercolleagues at the Massachusetts Insti-tute of Technology published The Lim-its to Growth, which used a globalsystems model to describe how humanpopulations might interact with theenvironment and economy.20 Themodel used five variables: population,food, industrialization, nonrenewableresources, and pollution. In all thescenarios of future population andeconomic growth, population andindustrialization surged upward andthen fell sharply, a pattern the authorsdescribed as “overshoot and collapse.”
The Limits to Growth model pro-voked a storm of criticism.21 Criticsargued that human innovation andresourcefulness would improve thetechnology of food production,resource recycling, fertility reduc-

12
tion, and pollution control enoughto avoid “overshoot and collapse” andproduce steady sustainable growth inpopulation, food, and industrial out-put per person.22
The “overshoot and collapse”notion has been largely replaced, atleast at the global level, by forecasts ofmore gradual environmental deterio-ration over a longer period of time;the most severe degradation would belimited to specific regions.
Affluence and TechnologyThe most widely known model of the1970s, developed by Paul Ehrlich andJ.P. Holdren, defined the population-environment relationship in a formula:I = PAT, where I is the environmentalimpact (such as pollution), P is popu-lation size, A is affluence (usuallyexpressed as average gross domesticproduct per capita), and T is technol-ogy (a measure of efficiency, for exam-ple, of energy use).23
The I = PAT formula created auseful way to study the relationshipsamong the primary variables govern-ing some environmental factors.Researchers William Moomaw andMark Tullis, for example, used theformula to evaluate the relative con-tributions of population, affluence,and efficiency of carbon use (thetechnology factor) on carbon diox-ide emissions in 12 countries
between 1950 and 1990. They foundthat the relative importance of the P,A, and T variables fluctuated substan-tially among countries and over time.Population growth was the mostimportant force increasing carbondioxide (CO2) emissions in Mexico,except for a brief period in the early1990s when Mexicans’ rising afflu-ence was the major factor. Popula-tion was also the primary factorincreasing CO2 emissions in Ghana,where affluence actually declinedbetween 1950 and 1990. Increasingaffluence was the primary factor inCO2 emissions in Poland over theperiod and in China after 1981.24
The I = PAT formula has been criti-cized for a number of reasons. Somecritics point out that different factorscontribute to different environmentalimpacts. Factors contributing to thedepletion of the ozone layer, forexample, are not the same as the fac-tors contributing to deforestation orbiodiversity loss. The I = PAT equationsuggests that the three variables (P, A,and T) operate independently, yetthese factors may interact with oneanother.25 And by reducing these rela-tionships to a simple one-way negativerelationship, the model ignores someimportant features such as the role ofinstitutions, culture, or social systemsin mediating human impact on theenvironment. In addition, the P in theframework typically stands for thenumber of persons in a population.But households are also significantunits of consumption; the number,size, and composition of householdsare important considerations in look-ing at consumption levels.26 Othercritics suggest that the I = PATapproach focuses on how humanbeings and their characteristics func-tion as agents of environmentalchange but does not examine howhumans are affected by those changes.
Health ImpactsIn the 1990s, researchers at the Bat-telle Seattle Research Center pre-sented a model that recognized thedual nature of population and envi-ronment interactions and, by exten-
HumansEnvironmental
health
Figure 3The Population, Health, andEnvironment Cycle
Source: Adapted from C.E. Orians and M. Skumanich, The Population Environment Connection:What Does It Mean for Environmental Policy? (1995):45.

13
sion, the health implications. Thismodel recognized that human beingsserve as a driving force of environ-mental change and that, in turn, peo-ple are also affected by the outcomesand consequences of these changes.27
While recognizing the dynamicinterplay between population variablesand the environment, the Battellemodel broke the relationship into twoparts, as shown in Figure 3. The firstpart focuses on how people are driversof environmental change (the lowerarrow) and the second part focuses onhow people are affected by or arereceptors of environmental change(the upper arrow). More recently,researchers have used this concept torefer to population and environmentanalysis as a “chair with four legs”:population dynamics, environmentaldynamics, and the influences of eachon the other.28 To date, the over-whelming majority of studies havefocused primarily on the impact ofchanges in the human population onthe environment, but that is slowlychanging as the field evolves.
Population DynamicsIn the last decade, the InternationalInstitute for Applied Systems Analysis(IIASA), based in Austria, has devel-oped two series of models that takeinto account a range of populationdynamics beyond growth. These mod-els incorporate other variables such aseducational levels and policies thataffect population and environmentrelationships.
The first series of models focusedon population-development-environ-ment interactions in Botswana, CapeVerde, Mauritius, Mozambique,Namibia, and the Yucatán Peninsula.These studies examined traditionalpopulation characteristics, includingage, sex, and education levels, as wellas other variables appropriate to thelocal context: Labor force participa-tion in Mauritius, or HIV status inBotswana, Mozambique, and Namibiaare examples.29
By including these ranges of vari-ables and by producing variousfuture scenarios, these studies helped
policymakers understand that invest-ment in human resources such aseducation, health, and voluntary fam-ily planning, combined with strongerpolitical empowerment and account-ability, were requirements for envi-ronmental management andsustainable development.
More recently, IIASA has collabo-rated with the UN Economic Com-mission for Africa to develop aninteractive simulation model demon-strating the medium- to long-termimpacts of alternative policies (in-cluding policies on HIV/AIDS) onthe food security status of the popula-tion. This model, called population,environment, development, and agriculture (PEDA), focuses on theinteractions between changes inpopulation size and distribution, nat-ural resource degradation, agricul-tural production, and food security.
Ecosystem ApproachesOther models have focused on specific ecosystems. One such model,SAVANNA, was developed jointly byColorado State University and theInternational Livestock Research Insti-tute to help land-use planners createlong-term plans for savannas, aridgrassland ecosystems where wildlife,humans, and domestic livestock coex-ist. The model forecasts wildlife popu-lations, the health of ecosystems, andhuman conditions five to 100 yearsafter human and natural activity havechanged the landscape. It takes intoaccount the constant change of thenatural world across large regions, atthe same time forecasting the future ofan area as small as a 50-meter-widewatering hole.30 While many modelsare static, capturing a single point intime, SAVANNA shows the interactionof different processes over time.
The SAVANNA model is now beingused by conservationists, developmentplanners, and local people for land-use planning in the Maasai MaraNational Reserve and AmboseliNational Park in Kenya, and theNgorongoro Conservation Area inTanzania, which are part of theGreater Serengeti Ecosystem.31
Humans are adriving force of environmentalchange. Peopleare also affectedby the outcomesof these changes.
14
Species ExtinctionAnother series of models have beenexamining threats to species linkedto human activity. Population viabil-ity analysis (PVA) models have beendeveloped to look at extinction risksof threatened species. The SpeciesSurvival Commission of the WorldConservation Union (IUCN) hasused the VORTEX model to predictthe extinction of species, includingthe black panther and orangutan.VORTEX attempted to integratewildlife population models withmodels of human demographics,economics, and land use.32 Themodel can simulate the effects of threats associated with human population change, such as huntingpractices, road construction, defor-estation, and pollution. Such PVAmodels help determine processes to identify and manage threats towildlife populations and habitats,and are useful for conservation planning.
Questions of ScaleAll these models operate on differentscales, particularly regarding timeand space. Generally there are threelevels of spatial scale: the global level,the national or regional level, andthe local level.33
Individual and community-levelbehaviors can have national and
even global impacts; correspondingly,a change such as global warmingaffects communities and individuals.At the national level, policies andactions also play a key role in howpopulation, health, and environmen-tal issues are managed because this isthe level at which many of the institu-tional, economic, and political mech-anisms operate.
The problem of scale for popula-tion-environment interactions is illus-trated by the case of coral reefs.Human activity and the fragmenta-tion of coral reef habitat on a localscale have made many of the world’scoral reefs much more susceptible toglobal trends, including threats fromclimate change.34
Recent research points to directlinks between increased greenhousegases, climate change, and bleachingof corals. (Bleaching, or loss of colorand essential nutrients, occurs whenthe coral’s algae die from excessivewater temperature or disease.)Episodes of coral bleaching and dis-eases linked to global conditions andwarming have been more frequentand widespread over the past 30years. Most coral reefs can recoverfrom bleaching if the temperatureanomalies persist for less than amonth, but sustained high tempera-tures can cause irreversible damage.There have been six major bleachingevents worldwide since 1979. The
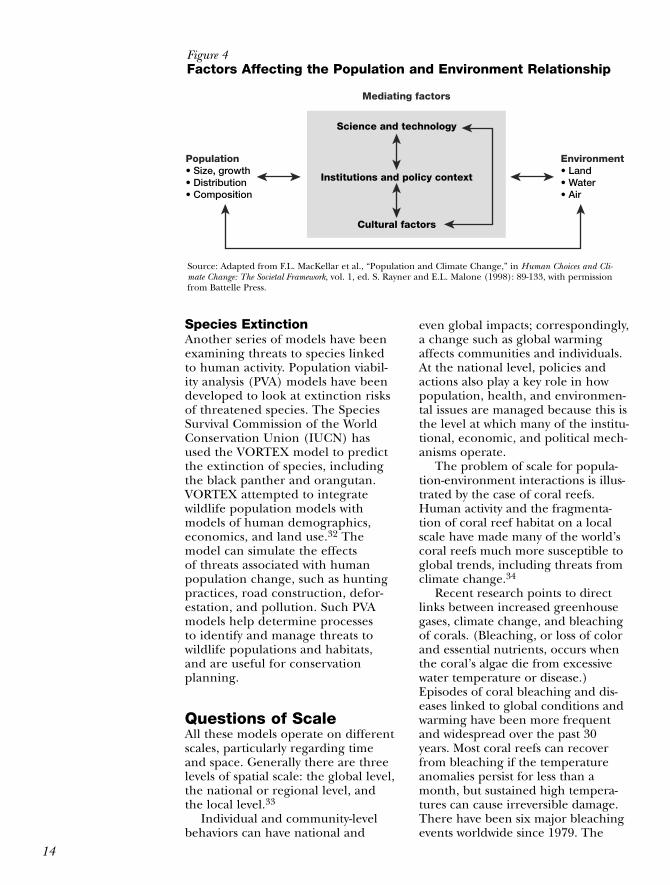
Science and technology
Population• Size, growth• Distribution• Composition
Environment• Land• Water• Air
Mediating factors
Institutions and policy context
Cultural factors
Figure 4Factors Affecting the Population and Environment Relationship
Source: Adapted from F.L. MacKellar et al., “Population and Climate Change,” in Human Choices and Cli-mate Change: The Societal Framework, vol. 1, ed. S. Rayner and E.L. Malone (1998): 89-133, with permissionfrom Battelle Press.

15
most severe bleaching episode, in1998, destroyed an estimated 16 per-cent of the world’s coral reefs, withheaviest damage to reefs in theIndian Ocean, Southeast Asia, andthe far western Pacific.35
The intensity and effects of popu-lation, health, and environment inter-actions are greatly affected by time.The evidence of change often cannotbe discerned for years or decades.Global climate change may affecthealth, for example, through com-plex disturbances of natural systemsover several decades. Toxic environ-mental pollutants in a local areamight produce more immediatehealth effects. Generally, epidemiolo-gists find it harder to quantify theadverse health effects of global envi-ronmental changes.36 Researchershave found it difficult to reconcilevarying time and spatial scales withinthe same study or to analyze studiesconducted at different scales. Policies,institutions, and culture related topopulation and environment dynam-ics create additional challenges forscientists seeking ways to protecthuman and environmental health.
Mediating FactorsIn addition to the role of science andtechnology recognized in the I = PATframework, public policies, politicalinstitutions, and cultural factors areimportant mediating factors in popu-lation, health, and environment inter-actions (see Figure 4).
PoliciesIn many cases, public policies, guidedby cultural norms and attitudes about the environment and civicresponsibility, can lessen environmen-tal problems. Emissions standards forchlorofluorocarbons (CFCs) enactedthrough the 1987 Montreal Protocol,for example, slowed the deteriorationof the ozone layer. The ozone layershields humans from potential eyedamage and skin cancers caused bythe sun’s high-energy ultraviolet radi-ation. The primary cause of ozonedepletion is most likely human activ-
ity—especially the production of synthetic organic compounds likeCFCs, which are used in refrigeration,solvents, and propellants. Changesprompted by the Montreal Protocoldramatically reduced the emissions of manufactured ozone-depleting substances.37
Population, health, and environ-ment relationships were also a con-sideration in advancing nationalpopulation policies. After the 1950s,policies in many countries focused onrestraining population growth becauseof concern that the unprecedentedpace and volume of growth was a seri-ous threat to economic development,public health, and the environment.
A turning point in internationaldiscussions on population was the1994 International Conference onPopulation and Development held inCairo. The Cairo conference widenedthe scope of earlier population poli-cies. Governments agreed that popula-tion policies should address socialdevelopment beyond family planning,especially the advancement of women,and that family planning should beprovided in the context of reproduc-tive health care. By focusing on indi-vidual rights, the Cairo consensusenhanced individual health andrights, which was expected to eventu-ally lower fertility and slow population
In Bangkok, public policies and local community action are helping con-vince industries and individuals to adopt technologies and lifestyles thatreduce air pollution, and the city’s air is getting cleaner.
Photo removed forcopyright reasons.

16
growth by increasing women’s statusand education.38
But policies can also worsen envi-ronmental conditions. Irrigation poli-cies of the former Soviet Union,instituted to boost agricultural pro-duction, resulted in a 40 percentreduction in the size of the Aral Sea inCentral Asia.39 In the Philippines, tim-ber policies encouraged the surge inupland migration in the 1980s, result-ing in a heavy loss of forest cover andsubstantial increases in soil erosion.40
Subsidies are example of a policyintervention that can have positive ornegative effects on human and envi-ronmental well-being. Subsidies canhelp farmers support their families,grow their businesses, minimize envi-ronmental degradation, and helpachieve equity. In Bangladesh, generalfood price subsidies were replacedwith a program to provide food topoor rural families who send theirchildren to school. The new subsidiesincreased school enrollments, particu-larly for girls, and improved foodsecurity for poor rural households.41
Subsidies may also have unin-tended negative consequences,including wasteful resource use,excessive environmental damage, andgrowing financial strains on govern-ments. Subsidies interfere with mar-ket forces by artificially lowering theprices of agricultural inputs such asfertilizer, water, and machinery.
InstitutionsDuring the past 60 years, much of theworld has relied on the institutions ofthe state, or groups of states, as mecha-nisms for common action. In recentdecades, civil society has gained impor-tance, as evidenced in spectacularevents such as the fall of the Berlin wall,and more modest phenomena such asa heightened concern with environ-mental health within some corpora-tions, stronger policies to protect forestsin Latin America, and greater impact of nongovernmental organizations(NGOs) in international conventions.Around the world there is an increasingtrend of devolution from centralizedpower to more local management.
The international environmentalconference in Rio de Janeiro in 1992helped establish the role of NGOs inthe international arena, with 17,000NGO representatives participating in aparallel forum outside the official con-ference and 1,400 directly involved inthe intergovernmental negotiations.NGOs helped make the conference asuccess, claimed an important place in the conference declaration, andplayed a key role in developing post-conference institutions such as theCommission on Sustainable Develop-ment. Three years later, in September1995, the Fourth World Conferenceon Women attracted an astonishing35,000 NGO representatives to Beijingto a parallel forum and 2,600 to theofficial conference.42
Although NGOs have few formalpowers in international decisionmak-ing, they have successfully promotednew environmental agreements andgreatly strengthened women’s rights,among other accomplishments. NGOwork on the environment led to theadoption of the 1987 Montreal Proto-col on Substances That Deplete theOzone Layer.
CultureTogether with policies and institu-tions, cultural factors—beliefs, values,norms, and traditions—influencepublic support for public policies andthe ways that human interact withtheir environment. Women’s socialstatus, especially in less developedcountries, limits their access to land.In many countries, a woman’s prop-erty rights are linked to her maritalstatus; she may lose these rights if sheis divorced or widowed. Even incountries where the law guaranteeswomen and men equal access toland, customs may exclude womenfrom exercising their rights.
Many demographers draw a linkbetween fertility, women’s status, edu-cation, and access to family planningmethods. Women in many countrieshave little power over their reproduc-tive lives, just as they have little sayabout how household resources areused. Women with little or no educa-

tion and women in rural areas tend to have less say in their marriages andhouseholds, and they tend to havemore children than other women.Alternatively, increasing educationallevels encourages girls to wait longerbefore marrying and starting a familyand to have fewer children.43
Culture also supports changes thatmay be beneficial for the environment.In the United States, for example, public support helped spur technologyand innovation to curb environmentaldegradation. Between 1970 and 2001,the U.S. population rose more thanone-third, from 203 million to 281 million people, while gross domesticproduct more than doubled, from $3.6 trillion to $9.3 trillion (in 1996dollars), and per capita disposableincome nearly doubled, from $12,823to $23,687 (also in 1996 dollars).
These population and economicpressures have degraded environmen-tal quality. Carbon dioxide emissions,for example, increased about as fastas population. Yet, by some measures,U.S. environmental quality improved:Between 1970 and 1998, total emis-sions of sulfur dioxide decreased by 37 percent; emissions of particu-lates decreased by 71 percent; andemissions of lead declined by 98 percent.44
Culture can also inhibit efforts toimprove the environment. In manycountries, policies to promote environ-mental conservation are perceived asdetrimental to business interests andindividual advancement. In Bangkok,for example, a growing culture of indi-vidualism and consumerism in the1990s inhibited community action toaddress problems caused by the city’scongestion and air pollution.45
Far-ReachingConsequencesPopulation, health, and environmentinteractions have far-reaching conse-quences for human and environmen-tal well-being. Some of the mostimportant interactions and trends are
associated with poverty and wealth;demand and supply of food, water, andenergy; and emerging health risks.
PovertyPoverty may promote environmentaldegradation in a variety of ways. Poorrural families are more likely to supportthemselves with subsistence slash-and-burn agriculture; use forest products asfuel, fodder, and building materials;and live in ecologically fragile zones. In poor rural communities, the contin-uing need for family labor supportshigh fertility and rapid populationgrowth, which some analysts believeplaces additional strain on forests.
An estimated 70 percent of theworld’s poor rely on the land forincome and subsistence, althoughmany do not own or control theseresources.46 In Burkina Faso, Côted’Ivoire, and Senegal, extremely highrates of deforestation are associatedwith the expansion of cash crops(groundnuts, cotton, coffee, andcocoa) by large companies for export.This expansion directly displacesforests and reduces the availability ofarable land for subsistence farmers,driving them to encroach on forestedland. Abject poverty can also pushmany of these rural residents todestroy the very resources they rely on for their livelihoods.
The World Bank estimates that thenumber of people living in absolutepoverty (less than US$1 a day) hasfallen since the mid-1980s, from 1.3billion in 1990 to 1.2 billion in 1999.Today, however, poverty is conceptual-ized in much broader terms than justincome. It includes access to opportu-nity, security, and empowerment.47
With this broader definition, ethnicminorities, rural residents, and womenare much more likely than their coun-terparts to be poor. These same groupsoften are disproportionately affectedby environmental degradation. Therelative situation of ethnic or religiousminorities varies tremendously aroundthe world, but even in more developedcountries like the United States, disad-vantaged minorities are more likely to
17
Seventy percentof the world’spoor rely on theland for incomeand subsistence.

18
live in areas that are heavily pollutedand that have substandard sanitationand health services.48
These disadvantaged groups alsoface challenges in meeting basichuman needs when the prices of envi-ronmental goods such as water, land,or marine life increase. According toU.S. and Malaysian agricultural econo-mists, prices for salmon and otherhigh-value fish could rise by 15 per-cent by 2020, while prices for less valu-able fish such as milkfish and carpcould increase by 6 percent.49
The lifestyles of these vulnerablepopulation groups may also be at risk.Indigenous communities with lives intimately adapted to local climate, vegetation, and wildlife may be parti-cularly threatened by environmentalchange. The native peoples of theMackenzie Basin in Northwest Canadahunt, fish, and trap wildlife for theirfood, income, and traditional clothing.Changes in the ecosystem and resourcebase—melted permafrost, increasingnumbers of landslides and forest fires,and declining groundwater levels—jeopardize their traditional lifestyles.50
WealthAt the other end of the spectrum,wealth brings greater environmentalmanagement opportunities and chal-lenges. As societies grow wealthier,
some human-induced environmentalproblems—such as access to water andsanitation—are expected to improve,while others—such as the generationof solid waste and greenhouse gases—get worse.
Wealthy nations have higher percapita consumption of petroleum,cement, metals, wood, and other com-modities that deplete world resources,generate a large volume of waste, and emit higher levels of pollutants.Between 1960 and 2000, the municipalsolid waste generated in the UnitedStates increased from 88 million to 232million tons. On average, each Ameri-can produced 4.5 pounds of garbageeach day in 2000, up from 2.7 poundsper day in 1960.51 Most of this waste iseither burned, emitting pollutants intothe air, or deposited in landfills, takingup increasing land near urban areasand introducing toxic substances togroundwater and soil.
Wealth and economic developmentalso bring a greater reliance on motorvehicles, with major environmentaleffects. In 2000, about 70 percent ofthe world’s automobiles were in moredeveloped countries (see Figure 5).The United States and a handful ofother wealthy countries have morethan 400 cars per 1,000 people, accord-ing to the World Bank. In contrast, lessdeveloped countries like Bangladesh,India, and Sierra Leone had fewer than5 cars per 1,000 people in 2000.52
The increase in motor vehicles isassociated with pollution and land-useproblems. A recent assessment of thehealth impact of air pollution in Aus-tria, France, and Switzerland revealedthat car-related pollution kills morepeople than car accidents in thesethree countries.53 Pollution frommotor vehicle emissions is increasingas the numbers of vehicles increasesthroughout the world.
More affordable two- and three-wheeled motor vehicles are gainingpopularity in the less developed world.The World Bank reports that owner-ship of two-wheeled motor vehicles inCambodia, for example, rose from 9per 1,000 people to 134 per 1,000 peo-ple between 1990 and 2000. In India,
400
Less developed countriesMore developed countries
1960 1980 2000 2020 Projection
82%
18%
87%
13%127 71%
29%
55%
45%754
1,116Millions of vehicles
Figure 5Increase in Motor Vehicles, 1960 to 2020
Source: M. Pemberton, Managing the Future—World Vehicle Forecasts and Strategies to 2020,Vol. 1: Changing Patterns of Demand (2000).

19
the ratio rose from 15 to 29 duringthe 1990s. Production and use ofhybrid (gas-electric) vehicles is alsoincreasing in many countries.
Increasing wealth is also associ-ated with greater environmentaldemands from food production. Astheir incomes increase, people tendto add more animal fats to theirdiets. Raising livestock requires moreland, produces more waste, and con-sumes more grain per food caloriethan growing grains such as wheat orrice for direct consumption. Whileenergy use appears to have no nat-ural maximum, there is a limit to theamount of animal fat per capita thatpeople consume, and many coun-tries appear to have reached thatlimit already. The demand for food is expected to slow between 2000and 2030, but continued populationgrowth and a shift to high-fat diets in less developed countries meanthat agricultural production willneed to grow at least 2 percent an-nually in less developed countriesuntil 2030.54
Land, Food, and AgricultureFrom 1985 to 1995, populationgrowth outdistanced food productionin many parts of the world, particu-larly in Africa. In 64 of 105 develop-ing countries studied in this period,food production lagged behind popu-lation growth.55 And there were 2.2billion more people to feed in 2002than there were in 1972.
Traditionally, the major means forincreasing the food supply for a grow-ing population has been convertingmore land to agricultural production.Most of the best agricultural land,however, is already in production.Each year, prime agricultural land islost through conversion to urban usesor degraded through imprudent agri-cultural methods, overgrazing, orother activities. Erosion, salinization,leaching of nutrients, and increasedtoxicity from use of chemical fertiliz-ers and pesticides may all contributeto degradation.
The imbalance between food sup-ply and demand often reflects politi-cal and social inequities. Faminesgenerally occur because food is notavailable where people need it, ratherthan from an overall shortage in sup-ply. These localized imbalances couldbecome more extreme because popu-lation is growing fastest in the regionswith the least-efficient food produc-tion and distribution systems.
Agricultural production and foodsecurity is also threatened by AIDS-related deaths among farm workers,most notably in southern and easternAfrica. In 25 African countries withhigh rates of HIV prevalence, theFood and Agriculture Organization(FAO) estimates that 7 million agri-cultural workers have died of AIDSsince 1985. FAO projects that 16 mil-lion more agricultural workers inthese countries will die because ofAIDS between 2000 and 2020. Popula-tion losses in the agricultural laborforce between 1985 and 2020 in theworst-affected countries will rangefrom 13 percent in Tanzania to 26percent in Namibia (see Figure 6).
In eastern Africa, AIDS-relatedlabor shortages have led to lower cropyields, smaller amounts of land beingcultivated, and a move from cash crops
26
23
23
20
20
17
14
14
13
Namibia
Botswana
Zimbabwe
Mozambique
South Africa
Kenya
Malawi
Uganda
Tanzania
Percent of labor force lost
Figure 6Projected Loss of Agricultural Labor Force Becauseof HIV/AIDS, Selected African Countries, 1985–2020
Source: Food and Agriculture Organization (FAO), “AIDS—A Threat to Rural Africa:Fact Sheet” (www.fao.org/Focus/E/aids6-e.htm, accessed July 12, 2002).
20
to subsistence crops.56 In Zimbabwe,the Farmers Union found that the lossof a breadwinner to AIDS decreasedcrop output by as much as 61 percentin small-scale farming areas.57
Many less developed countries havethe potential to increase their foodproduction substantially, yet only asmall fraction of the increase is likelyto come from expanding the amountof land under production. There areways to increase yield and maintainthe soil quality. One is to alternateplanting legumes such as mung beansor soybeans with rice crops to helpreplenish nitrogen in the soil. Currentplant-breeding programs could pro-vide additional yield increases byimproving plant stocks. Biotechnologymay become a principal source of fur-ther productivity gains as scientistsbioengineer genes for insect and dis-ease resistance.
Genetic improvements throughcrop and livestock breeding haveplayed a major role in increasing pro-duction. A newly developed set oftools, generally referred to as genetic
engineering, now enables specifictraits to be directly inserted into thegenetic material of a crop or animal. A plant may be genetically altered byinserting a single gene from the samespecies or an entirely different organ-ism that contains desired characteris-tics, such as herbicide resistance or anantibacterial compound. Frost resis-tance in tomatoes has been enhancedusing fish genes. Bioengineering mayincrease the yield of some crops by re-engineering the photosynthesisprocess, reducing the need for pesti-cides or water, or increasing the toler-ance of saline soils.
But scientists and the public haveeconomic, social, health, and ethicalconcerns about genetically modified(GM) crops, and some governmentsrefuse to allow GM foods into theircountries even when they face foodshortages. In 2002, a number of sub-Saharan countries suffered massiveagricultural losses primarily because ofa severe drought; the internationalcommunity responded by offering tonsof grain and other food. But the gov-ernment of Zambia rejected thousandsof tons of corn donated by the UnitedStates because it was likely to containGM kernels. Swaziland acceptedunprocessed U.S. corn, whereasLesotho, Malawi, Mozambique, andZimbabwe accepted it on the condi-tion that the kernels first be milledinto flour to prevent farmers fromusing them to grow GM crops.58
Public and scientific concernsabout GM foods fall into two main cat-egories: risks to human health andrisks to ecological integrity. Risks tohuman health appear to be minimal.Furthermore, chemical techniquesused in food testing screen out possi-bly toxic or allergenic foods. Less isknown about environmental risks andthe benefits. One concern has beenthe potential for genes to migratefrom domesticated GM crops into wildplants, just as genes already migratefrom conventionally bred crops towild relatives.59
More effective agricultural policiesoffer great potential for boosting food production in less developed
Crop yields have increased through the use offertilizers and pesticides, but these chemicalscan contaminate soil and water, harm ani-mals, and produce pesticide-resistant insects.
Photo removed forcopyright reasons.
21
countries over the next few decades.Giving farmers better access to credit,improving extension and training pro-grams, improving rural infrastructure,and encouraging more competitiveprivate markets are among the manyreforms that could strengthen incen-tives for food production. Reducingwaste in the system could also increasepotential food supply. In high-incomecountries, for example, the amount oflost or wasted food is equivalent toanywhere from 30 percent to 70 per-cent of the food actually consumed.
Future increases in food productionare likely to come from more intensiveuse of current farms rather than fromexpanding farmland and from suchtechnological innovations as improvedseeds and the use of chemical fertiliz-ers, insecticides, and herbicides.
But chemicals used to boost yieldalso carry health risks. People canbecome ill if they come into contactwith the pesticides applied to crops orconsume food with pesticide residues.Pesticides can also seep into theground and contaminate drinkingwater. Although pesticides are usedworldwide, some regions are particu-larly affected. Central America, forexample, uses 1.5 kilograms of pesti-cides per person each year, more thanany other world region.60
Chemicals and heavy metals foundin industrial effluents and pesticiderunoff also damage human andmarine health. The most serious con-cerns worldwide involve persistentorganic pollutants (POPs)—particu-larly dichlorodiphenyltrichloroethane(DDT) and polychlorinated biphenyls(PCBs)—that can be transported inthe atmosphere and have becomecommon in the oceans. POPs tend tolinger in living tissue and becomemore concentrated as they move upthe food chain, so they are sometimesfound even in people who live inremote, undeveloped regions.
Evidence links long-term, low-levelexposure to certain POPs with repro-ductive, immunological, neurological,and other problems in marine organ-isms and humans. These toxins cankill or contaminate marine life; peo-
ple who eat seafood from pollutedareas or who swim in contaminatedwaters are vulnerable to gastric andother infections. In order to managesuch threats, the Stockholm Conven-tion on Persistent Organic Pollutants,adopted in May 2001, sets out controlmeasures covering pesticides, indus-trial chemicals, and unintendedbyproducts.61
DeforestationThe environment performs two basicfunctions. “Source” or productionfunctions support the livelihood ofmillions who depend upon environ-mental resources. “Sink” or pollutionabsorption and cleansing functionshelp support human health and well-being by naturally purifying air andwater. Forests provide a number ofthese functions, including bufferingsoil erosion and land degradation,protecting the biological diversity indelicate and fragile ecosystems, andregulating climatic variability. Thesefunctions are disrupted when forestsare destroyed or fragmented.
During the 1990s, human activitiesresulted in the deforestation of 146million hectares (563,709 squaremiles)—roughly the combined areasof Colombia and Ecuador. During thatsame time period, 52 million hectareswere regained due to reforestationefforts and natural regrowth. SouthAmerica and Africa experienced thegreatest total deforestation; the sub-stantial deforestation in Asia was offsetby reforestation. In general, the 1990ssaw forest cover expand in temperateless developed countries, decline intropical less developed countries, andremain relatively stable in more devel-oped countries.
The direct causes of deforestationare themselves symptoms of underly-ing demographic, social, and eco-nomic connections. More developedcountries such as Japan and theUnited States can drive deforestationin less developed countries by import-ing tropical hardwoods. Rising paperconsumption has also encouragedovercutting of forests.

22
Some less developed countries alsoexploit their own forest resources topay down debts or import goods foreconomic development. Less devel-oped countries can also drive defor-estation beyond their own borders.China declared a moratorium onnational deforestation, which causedChinese loggers to cross into Myan-mar and Russia and cause widespreaddeforestation.62
Deforestation can have a range ofconsequences for both people and theenvironment, including degradation ofsurrounding ecosystems, reduced cropyields, and the loss of aesthetic valueand natural beauty. Two consequencesare particularly troubling: the loss ofbiodiversity and the exacerbation ofclimatic irregularities.
As forests are destroyed, degraded,or fragmented, many plant and ani-mal species are threatened or elimi-nated. The loss of forests in recentdecades had been partially offset bynew plantations. But the substitutionof planted forests for natural forests isa net loss for Earth’s biodiversity.Replanted forests often consist of fewtree species, making forests more vul-nerable to disease, drought, and other
natural stresses. And less-diverse treeplantations cannot support as manyspecies of other plants and animals.
A large number of species are nowthreatened with extinction. Nearlyone-quarter of all mammals and one-eighth of all birds are threatened,under criteria established by the WorldConservation Union (IUCN).63 Less isknown about the extinction rate ofplants or marine life. Only about 2,000of an estimated 25,000 fish specieshave been assessed of which 30 per-cent were considered threatened. Only about 11,000 plants have beenassessed, although the total number ofplant species may range from 265,000to 422,000. About 40 percent of theassessed plant species may be in dan-ger of extinction.64
Many geographic areas rich in bio-diversity also have a high populationdensity. More than 1.1 billion peoplelive within the 25 global biodiversityhotspots that ecologists describe as the most threatened species-richregions on Earth. About 75 millionlive in the three major tropical wilder-ness areas—the Upper Amazonia andGuyana Shield, the Congo River Basin,and the New Guinea-Melanesia com-plex of islands—which together coverabout 6 percent of Earth’s surface.65
The overlap of protected areas with agricultural lands (defined asmore than 30 percent of land coverunder crops or planted pastures) is alsonotable. Nearly 29 percent of globallyprotected areas are in agricultural areas.In Central America, for example, manyprotected areas are interspersed withagricultural lands, and increasingpopulation density is closely associatedwith deforestation.66 Yet Java—one ofthe most densely populated areas ofthe world—has more than 20 nationalparks and nature reserves coveringnearly 650,000 hectares and demonstrat-ing that people can conserve wild habi-tats even in densely populated areas.67
Energy UseGlobal energy production and con-sumption have risen steadily for sev-eral decades, and this has the greatest
Figure 7World Production of Fossil-Fuel Energy by Type,1950–1999
Note: One exajoule of energy is equivalent to about 363 million barrels of oil.
Source: United Nations, Energy Statistics Yearbook (1997 and 1999 editions): table 3.

23
potential impact on climate. In 2001,commercial global energy productiontotaled 9.3 billion metric tons of oil-equivalent. More than 1 billion metrictons of oil-equivalent energy were pro-duced by burning traditional fuelssuch as wood, charcoal, and biomass(animal and vegetal wastes).68
The vast majority of the world’senergy comes from the burning of fos-sil fuels, in liquid (petroleum), solid(coal or lignite), or gas (natural gas)form (see Figure 7). The extractionand processing of these fuels also con-stitutes one of the major flows of nat-ural materials in industrial economies.
Petroleum accounts for about 39percent of global commercial energyproduction. Solid fuels—primarily coaland lignite—are relatively abundantand account for about 24 percent ofglobal commercial energy production.Natural gas, the least environmentallydamaging greenhouse gas, providedabout 23 percent of global commercialenergy in 2000. However, natural gasproduction in the United States, by farthe largest fossil fuel consumer, is veryunlikely to meet future demand.
Traditional fuels such as firewoodand biomass fill the energy needs ofmillions of people in less developedcountries. These fuels often are col-lected from common or publiclyshared resources such as open landand woodlands. The collection andburning of these fuels create their ownenvironmental problems, includingsoil erosion, loss of watershed areas,and emission of particulates and otherpollutants. But as countries industrial-ize, they tend to replace traditionalfuels with fossil fuels and other com-mercially produced energy sources.69
Average energy use per person isstill more than nine times greater indeveloped than in less developedregions. North Americans consumefar more energy than any otherregion. In 1999, per capita energy useamong Americans was nearly twicethat of Europeans, nearly eight timesthat of Asians, and 15 times that ofAfricans (see Figure 8).
Per capita energy consumption hasincreased modestly in less developed
countries in the last two decades. Yettotal consumption increased by 274percent in Africa and by 187 percent in Asia between 1977 and 1997.70 Totalemissions in the United States haveincreased every decade since the 1950s;they rose from 1.2 billion metric tonsof carbon in 1970 to 1.5 billion metrictons in 1999, the most recent year forwhich data are available.71
Demand far outweighs supplythroughout much of the less devel-oped world; energy brownouts andblackouts are common in many coun-tries. The demand for energy will con-tinue to grow, propelled primarily bypopulation and economic growth andtempered by technological advancesin efficiency.
The International Energy Outlookfrom the U.S. Energy InformationAdministration projects global energyuse will grow by 1.7 percent annuallybetween 2001 and 2025, slightly fasterthan the rate of population growth.Energy consumption in less developedcountries is expected to increase by2.8 percent per year. Total consump-tion would increase by 58 percent in these scenarios. The projectedincrease in energy use in Asia accountsfor approximately 40 percent of thetotal increase in world consumptionand for 69 percent of the increase inconsumption among developing coun-
Gigajoules per capita
230
179
119
36
30
15
57
North America
Oceania
Europe
Latin America
Asia
Africa
World
Figure 8Energy Consumption per Capita, World Regions, 1999
Note: Excludes traditional fuels such as firewood and biomass. One gigajoule is equivalent to about0.4 barrels of oil.
Source: United Nations, Energy Statistics Yearbook 1999 (2002): table 3.

24
tries. Almost all of this growth willinvolve fossil fuels.
Demand for liquid fuels, coupledwith the cost of producing them fromalternative sources (such as heavy oils,bitumen, oil sands, oil shales, and coal)will almost certainly drive up theirprices. These high-priced replacementswill limit economic growth in industri-alized countries and, more critically, inthe less developed countries wheremost of the world’s population lives.
Climate ChangeCarbon dioxide and other gases natu-rally trap heat as it is radiated fromEarth’s surface back to the atmosphere.This “natural” greenhouse effect keepsEarth’s temperature about 33 degreesCentigrade (nearly 60 degrees Fahren-heit) warmer than it would otherwisebe. Carbon dioxide, primarily from theburning of fossil fuels, adds to the nat-ural greenhouse effect.
Since the preindustrial era, atmos-pheric concentrations of carbon dioxide have increased by nearly 30percent. Other greenhouse gases such as methane and nitrous oxide have
risen about 15 percent. Now estimatedat 373 parts per million by volume(ppmv), scientists estimate that atmos-pheric concentrations of carbon diox-ide are growing by about 1.5 percentannually and could reach 700 ppmvby the year 2100.72
Global emissions of carbon dioxidefrom fossil-fuel combustion grew from8 million to 6,518 million metric tonsbetween 1800 and 1999. Over thesame period, global per capita fossil-fuel emissions surged from less than0.01 metric tons (mt) in 1800 to 1.13mt in 1999. Carbon dioxide emissionscan vary greatly from year to year, inpart because climate variations andweather cycles such as El Niño affectthe frequency of natural and human-induced fires. In recent decades, percapita consumption has stabilized (seeFigure 9), suggesting that slowingpopulation growth would hold downthe increases in the total emissions ofgreenhouse gases.73
The extraction, processing, trans-port, and use of fossil fuels affectshabitat, landscapes, ecosystem health,water and air quality, and the globalclimate system. Human activity adds 3million tons of oil per year to theoceans through extraction, process-ing, and transport, and 50 milliontons of sulfur dioxide per year to theatmosphere from burning fossil fuels.These numbers could increase aseconomies industrialize.74
While the mechanisms by whichatmospheric changes affect climate arenot clearly understood, agreement isemerging among scientists that Earth’ssurface temperature is warming signifi-cantly, that the warming is likely dueto human activity, and that it will harmhumans and other species.
In 1997, the nations of the worldmet in Kyoto, Japan, to frame aresponse to the problem and developa protocol for reducing emissions.However, the United States, thelargest producer of greenhouse gases,rejected the agreement in 2001, andno global consensus of action hasemerged. Only a handful of the coun-tries still committed to the Kyoto Protocol are on track to meet the
1950 1955 1960 1965 1970 1975 1980 1985 1990 1995 19990.0
0.5
1.0
1.5
2.0
2.5
3.0
3.5
4.0
Metric tons of carbon per capita
More developed countries
World
Less developed countries
Figure 9Per Capita Carbon Dioxide (CO2) Emissions,1950–1999
Source: Updated and adapted from F.A.B. Meyerson, “Population, Carbon Emissions,and Global Warming: The Forgotten Relationships at Kyoto,” Population and Develop-ment Review 24, no. 1 (1998): 115-30.

25
obligations to reduce global warmingemissions developed at the confer-ence.75 Even if fully enacted, theKyoto Protocol would not significantlyalter the upward trend in global emis-sions and atmospheric greenhouse gasconcentrations, and the agreementwill expire in 2012. There is no globalconsensus on how to proceed afterKyoto. At the most recent round ofglobal climate talks in New Delhi inOctober 2002, the emphasis shiftedfrom preventing climate change toways to adapt to it.
Climate change from the buildupof gases is thought to lead to more fre-quent extreme weather events such asdroughts, violent storms, and flood-ing. Heat waves can be deadly. In sum-mer 2003, several thousand peopledied in France because of record hightemperatures. Global warming couldmelt polar ice caps, raising sea levelsby several feet and threatening low-lying countries. If the sea level were torise by 150 centimeters, Bangladeshcould lose up to 16 percent of its landarea, displacing 34 million people.
Extreme weather also affectshuman health, particularly in lessdeveloped countries. Intense precipita-tion and flooding can spawn outbreaksof cholera, malaria, dengue fever, andother diseases. Severe drought oftentriggers migration of people and ani-mals, which can facilitate the spread of infectious diseases.
While there is no certainty aboutthe health effects of climate changefrom global warming, research sug-gests that it can increase the location,spread, and intensity of insect- andwater-borne diseases. Epidemics candevelop when disease-carrying insectsor animals reproduce rapidly or moveto new locations where people havenot developed immunities. Higherrainfall, for example, could triggermosquito-borne disease outbreaks,increase flooding (spreading parasiticdiseases), increase contamination of water supplies with human or ani-mal wastes, and increase exposure torunoff of pesticides and other chemi-cals. Increased ultraviolet radiationexposure and acid rain are two
increasingly prevalent factors thatcan harm human health. Many other health effects of environmentalchange may not become evident fordecades.76
Water AvailabilityAbout one-third of the world’s popula-tion lives in countries suffering frommoderate to high water stress—wherewater consumption is more than 10percent of renewable freshwaterresources. Lack of access to safe watersupply and sanitation also results inhundreds of millions of cases of water-related diseases and more than 5 mil-lion deaths every year.77
Water is one of the most plentifulnatural resources, yet it is a finiteresource that is unevenly distributedthroughout the globe. Only 3 percentof all water is salt-free. Moreover, 70percent of fresh water is locked inglaciers or icebergs. Water supplies arealtered seasonally by cyclical droughtsor floods, so that the amount reliablyavailable for human use may be influ-enced more by periodic droughts thanby average annual rainfall.
Humans alter freshwater systems bybuilding dams and flood control sys-tems, draining wetlands, clearingforests, and modifying land withinwatersheds. Since 1950, large damshave increased sevenfold in numberand now impound 14 percent of theworld’s runoff. Sixty percent of theworld’s major watersheds are frag-mented by dams. Dams create reser-voirs that provide drinking water,support agriculture, and generateelectricity needed for human healthand activity, but dams and reservoirscan limit biodiversity within majorriver watersheds by altering migratoryroutes and causing habitat changes.
Irrigation of crops has been key tothe rapid increase in food productionover the last half-century and mayaccount for about 80 percent ofhuman consumption of water. Butpopulation growth is increasingdemand for water for industrial andhousehold use; water allocated to irri-gation in most regions is expected to
Agreement isemerging thatEarth’s surfacetemperature is warming significantly.

decline. As more water is diverted tohuman activities, it is becoming moredifficult to maintain water levels inthe rivers and wetlands that areimportant habitats for many species.
Groundwater provides a backup torivers, lakes, and reservoirs for localwater needs. Groundwater is replen-ished from the surface at a very slowrate, and it is often pumped out fasterthan the rate of natural recharge.Overuse of groundwater lowers watertables, decreases water quality, andallows salt water into aquifers incoastal areas. More than 1 billionpeople in Asia depend on groundwa-ter for household use, yet in manyareas water reserves are threatened bydepletion and contamination, espe-cially from intensive agriculture.
Contaminated water and inade-quate sanitation cause a range of diseases, many of which are life-threatening. The most deadly arediarrheal diseases, 80 percent to 90percent of which result from environ-mental factors. In 2001, diarrhealinfections caused nearly 2 million
deaths in children under age 5, pri-marily from dehydration; many morechildren suffer from nonfatal diar-rhea that leaves them underweight,physically stunted, vulnerable to dis-ease, and drained of energy. Poor san-itation conditions and inadequatepersonal, household, and communityhygiene are responsible for most diar-rheal infections.78
Despite significant investments inimproving water supplies and sanita-tion over the last 20 years, about 18percent of the world’s population stilllacks access to safe drinking water,and nearly 40 percent has no accessto sanitation. At present, people inrural areas are the most affected,although continual urbanizationmeans that increasing numbers ofpeople live in densely populatedcities, where they face shortages ofpotable water supplies and sanitationsystems, as well as growing pollution.More than 1 billion people, mostly inAfrica, Asia, and Latin America, cur-rently live in slums or as squatters.
In general, those areas with thegreatest water scarcity are those thatare most rapidly depleting theiraquifers. This is particularly true inthe Middle East and North Africa,where rapid population growth hasexacerbated water scarcity. Twelve ofthe world’s 15 water-scarce countriesare in the Middle East and NorthAfrica. The region’s population morethan doubled between 1970 and 2001,rising from 173 million people to 385million people, thereby reducing theamount of fresh water available percapita by more than half.79 By 2030,about half the world’s population isprojected to live in water-stressed areas.
Coastal and Marine LifeToday, more than 3 billion people—over half of the world’s population—live along a coastline or within 200kilometers (125 miles) of one. By2025, the coastal population may dou-ble to 6 billion. This concentration ofpeople in coastal regions has manyeconomic benefits: more transporta-tion links, industrial and urban devel-
26
Overfishing has diminished the wild stock ofmany fish and shellfish, and the current fishcatch is probably close to the sustainable limit.
Photo removed forcopyright reasons.
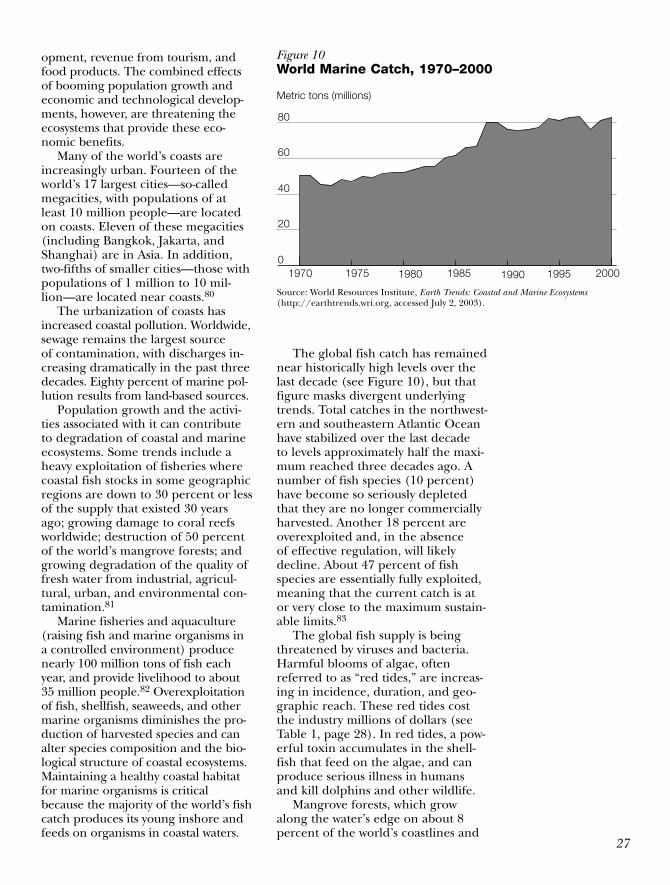
27
opment, revenue from tourism, andfood products. The combined effectsof booming population growth andeconomic and technological develop-ments, however, are threatening theecosystems that provide these eco-nomic benefits.
Many of the world’s coasts areincreasingly urban. Fourteen of theworld’s 17 largest cities—so-calledmegacities, with populations of atleast 10 million people—are locatedon coasts. Eleven of these megacities(including Bangkok, Jakarta, andShanghai) are in Asia. In addition,two-fifths of smaller cities—those withpopulations of 1 million to 10 mil-lion—are located near coasts.80
The urbanization of coasts hasincreased coastal pollution. Worldwide,sewage remains the largest source of contamination, with discharges in-creasing dramatically in the past threedecades. Eighty percent of marine pol-lution results from land-based sources.
Population growth and the activi-ties associated with it can contributeto degradation of coastal and marineecosystems. Some trends include aheavy exploitation of fisheries wherecoastal fish stocks in some geographicregions are down to 30 percent or lessof the supply that existed 30 yearsago; growing damage to coral reefsworldwide; destruction of 50 percentof the world’s mangrove forests; andgrowing degradation of the quality offresh water from industrial, agricul-tural, urban, and environmental con-tamination.81
Marine fisheries and aquaculture(raising fish and marine organisms ina controlled environment) producenearly 100 million tons of fish eachyear, and provide livelihood to about35 million people.82 Overexploitationof fish, shellfish, seaweeds, and othermarine organisms diminishes the pro-duction of harvested species and canalter species composition and the bio-logical structure of coastal ecosystems.Maintaining a healthy coastal habitatfor marine organisms is criticalbecause the majority of the world’s fishcatch produces its young inshore andfeeds on organisms in coastal waters.
The global fish catch has remainednear historically high levels over thelast decade (see Figure 10), but thatfigure masks divergent underlyingtrends. Total catches in the northwest-ern and southeastern Atlantic Oceanhave stabilized over the last decade to levels approximately half the maxi-mum reached three decades ago. Anumber of fish species (10 percent)have become so seriously depletedthat they are no longer commerciallyharvested. Another 18 percent areoverexploited and, in the absence of effective regulation, will likelydecline. About 47 percent of fishspecies are essentially fully exploited,meaning that the current catch is ator very close to the maximum sustain-able limits.83
The global fish supply is beingthreatened by viruses and bacteria.Harmful blooms of algae, oftenreferred to as “red tides,” are increas-ing in incidence, duration, and geo-graphic reach. These red tides costthe industry millions of dollars (seeTable 1, page 28). In red tides, a pow-erful toxin accumulates in the shell-fish that feed on the algae, and canproduce serious illness in humansand kill dolphins and other wildlife.
Mangrove forests, which growalong the water’s edge on about 8percent of the world’s coastlines and
Metric tons (millions)
1970 1975 1980 1985 1990 1995 2000
80
60
40
20
0
Figure 10World Marine Catch, 1970–2000
Source: World Resources Institute, Earth Trends: Coastal and Marine Ecosystems(http://earthtrends.wri.org, accessed July 2, 2003).

28
25 percent of the world’s tropicalcoastlines, absorb the impact ofstorms and offer nutrients for most of the world’s marine life.84 Man-grove forests have been cleared forcommercial and development pur-poses, including fish and shrimpponds, logging activities, human set-tlements, and agricultural and indus-trial developments. Kenya, Liberia,the Philippines, and Puerto Rico havelost over 70 percent of their man-groves. Aquaculture, which grewabout 10 percent annually in the1990s, can destroy mangrove forestsand cause irreversible damage toestuarine and offshore fisheries.
By 2020, marine harvests are pro-jected to be at or below current levels,which means less seafood availableper capita because the population iscontinuing to grow. Although expertsexpect some gains in harvests frombetter handling of the marine catchby some industries and exploitation ofthe few underused fishing areas, thesegains will be offset by losses frompoorly managed fishing areas,increased protection of areas andspecies from fishing, and continueddegradation of marine environments.
Consequences for HealthEnvironmental conditions affect thespread of communicable diseases,which account for about one-fifth ofannual deaths worldwide. An esti-mated 60 percent of the global bur-den of disease from acute respiratoryinfections, 90 percent from diarrhealdisease, 50 percent from chronic res-piratory conditions, and 90 percentfrom malaria could be avoided by sim-ple environmental interventions.85
More than 60 percent of the dis-eases associated with respiratory infec-tions are linked to air pollution. Airpollution is defined as abnormallyhigh concentrations of suspendedparticulate matter, gases, and vaporsin the atmosphere. Outdoor pollu-tants such as sulfur dioxide, ozone,nitrogen oxide, carbon monoxide,and volatile organic compounds comemainly from motor vehicle exhaust,power plant emissions, open burningof solid waste, and construction andrelated activities.
Most air pollution comes fromburning fossil fuels, but the distribu-tion and concentration of pollutantsdepends on which fuels are used, thechemical composition of those fuels,the available technologies, local atmos-pheric conditions, and other factors.Increases in efficiency and energy con-servation, regulations such as thoseused to prevent the sale of leadedgasoline, and technological advancesthat limit emissions may, in combina-tion, serve to improve air quality.
Outdoor air pollution has stabilizedor declined in Western Europe andNorth America since 1970, accordingto the World Health Organization’s(WHO) air quality standards, while it has continued to increase in the less developed countries.86 Despiteimprovements, urban areas in indus-trialized countries continue to sufferfrom poor air quality. A recent assess-ment by the European EnvironmentAgency found about half of the Euro-pean urban population was exposedto elevated particulate concentrations,and more than 95 percent to excessconcentrations of ozone. However, lev-els of lead, nitrogen oxides, and sulfur
Table 1Economic Losses From Red Tides, 1970s to 1990s
Estimated lossDate Location Species (US$ million)
1972 Japan yellowtail $471977 Japan yellowtail 201978 Republic of Korea oyster 51979 United States (Maine) (many) 31980 United States (New England) (many) 71981 Republic of Korea oyster >601985 United States (Long Island) scallops 21986 Chile red salmon 211987 Japan yellowtail 151988 Norway and Sweden salmon 51989 Norway salmon, rainbow trout 51989–90 United States (Puget Sound) salmon 51991 United States (Washington) oyster 15–201991–92 Republic of Korea farmed fish 1331996 United States (Texas) oyster 241998 Hong Kong farmed fish 32
Source: Worldwatch Institute, State of the World 1999 (1999): chap. 5.

29
dioxide have declined to acceptablelevels in Europe.87
Air pollution is most severe in thelarge cities in less developed coun-tries, including Delhi, Jakarta, andMexico City. In some of China’s cities,particulate levels are as much as sixtimes higher than WHO guidelines.88
The health consequences of highlevels of pollution are considerable. An assessment for the Air Manage-ment Information System of the WHOrecently projected that the total annualexcess mortality due to suspended par-ticulate matter is currently about460,000, with an additional 370,000deaths attributable to sulfur dioxide,which, along with nitrogen oxides, isthe major source of acid rain. The ill-ness and disability caused by air pollu-tion is far greater than the mortality. AWHO study concluded that air pollu-tion in cities in less developed coun-tries is responsible for some 50 millioncases per year of chronic coughing inchildren under age 14.89 Mental retar-dation, respiratory disorders, cardio-vascular problems, and cancer havealso been linked to air pollution.
Overall, children are at greater riskfrom environmental health problemsthan adults. Children under age 5breathe more air, drink more water,and eat more food per unit of bodyweight than adults do, so they mayexperience higher rates of exposure to pathogens and pollutants. Typicalchildhood behaviors, such as crawlingand putting objects in the mouth, canincrease exposure to environmentalpollution. Exposure to lead remains aprincipal environmental problem foryoung children in less developedcountries. Lead exposure can alsocause anemia, kidney disease, hearingdamage, and impaired fertility; at highlevels, it can result in coma or death.Leaded gasoline accounts for most air-borne lead pollution in many cities.
Indoor air pollution also posesserious health risks. Half of theworld’s households use biomass fuels,such as wood, animal dung, or cropresidues that produce particulates,carbon monoxide, and other indoorpollutants. The WHO has determined
that as many as 1 billion people,mostly women and children, are regu-larly exposed to levels of indoor airpollution up to 100 times aboveacceptable maximums.
Studies in less developed countrieshave linked indoor air pollution tolung cancer, stillbirths, low birthweight, heart ailments, and chronicrespiratory diseases, includingasthma. Asthma affects between 100million and 150 million people world-wide, and asthma rates have risen by50 percent every 10 years since 1980.The disease causes the deaths ofmore than 180,000 people every year,including 25,000 children.
In addition to well-known threatsfrom outdoor and indoor air pollu-tion, new threats have been posed by industrialization. Since 1900, mod-ern industry has introduced almost100,000 previously unknown chemi-cals into the environment. Many havefound their way into the air, water,soil, food—and people. Many of thesechemicals cause cancer, reproductivedisorders, and a growing list of otherailments.90 Heavy metals released intothe environment by metal smeltersand other industrial activities, theunsafe disposal of industrial wastes,and the use of lead in water pipesand gasoline have contributed tohealth problems.
The most dangerous metals, whenconcentrated above naturally occur-ring levels, include lead, mercury,cadmium, arsenic, copper, zinc, andchromium. These metals have diverseeffects relating to cancers (arsenicand cadmium), genetic damage (mer-cury), and brain and bone damage(copper, lead, and mercury). Peopleexposed to radiation from the 1986accident at the Chernobyl nuclearfacility in Ukraine have elevated ratesof thyroid and other cancers. Thenuclear wastes from Chernobyl’s reac-tor polluted water, contaminated soil, and killed trees in the surround-ing area.91
Emerging Infectious DiseasesHuman population growth andmigration has also facilitated the

30
emergence of a number of infectiousdiseases by increasing populationdensity, especially in urban areas(where dengue and cholera arebecoming more common) and byencroaching into wildlife habitats(leading to, for example, Ross Rivervirus—an infection spread by mosqui-toes that can cause long-term jointpain and fatigue). Increased contactwith wildlife and associated diseases,combined with international trade inlivestock, has led to outbreaks of dis-eases such as rinderpest in Africa andfoot-and-mouth disease in Europe.
Clearing forests for agricultural orpasture use can also spread diseaseto humans. Farmers in Venezuela’sPortuguesa state converted millionsof acres of forest into cropland, inad-vertently attracting rodents as well asmany additional workers. In the1980s, more than 100 people in theregion contracted the deadly gua-narito virus spread by rodents. In1999, Malaysian farmers contracted avirus spread to their pigs by fruit batsdisplaced by deforestation.92
Disease transmission also occurs in the other direction, as livestock diseases can devastate wildlife. Bovinetuberculosis originating from domesticcattle has spread rapidly in recentdecades among buffalo and lions andamong smaller numbers of cheetahand baboons in parts of East Africa.This disease is also seriously compro-mising the rapidly expanding deer-farming industry of China andSoutheast Asia. Many infectious dis-eases such as rabies, hog cholera,African swine fever, and screwworm arepotentially dangerous to humans aswell as to wild and domestic animals.93
Looking to theFutureEfforts to understand and manage the relationships between population,health, and the environment and toenact appropriate public policies areunderway through field studies; uni-versity programs to educate policy-
makers about population, health, andenvironment relationships; interna-tional projects to document, evaluate,and disseminate information; andinternational conferences and work-ing groups (see Box 3). These effortscontribute to a knowledge base onpopulation, health, and environmentinteractions; test methods for appro-priate field interventions; engage pol-icymakers in concrete action; andcapitalize on human ingenuity to bal-ance human needs with environmen-tal protection.
Building a Knowledge BaseThe relationships among environ-mental and demographic variableshave spurred hundreds of studiesover the three decades since PaulEhrlich, Donella Meadows, and oth-ers have revived the hypotheses and apocalyptic warning of ThomasMalthus. According to demographersWolfgang Lutz, Alexia Prskawetz, andWarren Sanderson, this body ofresearch constitutes an emergingfield of investigation.94
Three criteria justify calling abody of research studies a distinctfield: a critical mass of people whowork on the issues, joint researchquestions, and common methodolo-gies. Lutz and his colleagues suggestthat population and environmentanalysis easily meets the first two cri-teria, but not necessarily the third.
Despite the lack of commonmethodologies, there is an increasingbody of empirical data about thepopulation and health impacts of climate change, land degradation,forest loss, and species threats.Accordingly, there is greater agree-ment among scientists about globalchanges and the factors that con-tribute to those changes. Satellite and other types of images are provid-ing clearer evidence of what is hap-pening over time.
The ability to track informationfrom different sources with geo-graphic information systems andremote sensing is opening new areas

of study. Patterns and trends inhuman distribution and land andresource use may be analyzed in rela-tion to economic and market activityand changes in geographic and bio-logical measurements.
In 1999, scientists used satelliteimages to determine threats toaquatic plants and animals in LakeVictoria in East Africa. Blooms ofblue-green algae caused by therunoff of agricultural chemicalsstarved fish and plankton of oxygenand sunlight and reduced diversity ofaquatic plants. Increased turbidityinterfered with mate choice, causingsome fish species to die out. An inva-sive species, the water hyacinth, hadmultiplied, causing the lake water tostagnate and creating a breedingground for mosquitoes that spreadmalaria and snails that host bilharzia,a human parasite. Scientists usedremote sensing technology to iden-tify sources of the nitrogen- andphosphorus-rich sediments that werepolluting the lake. Using this infor-mation, researchers, governmentextension agents, and local NGOsare working with communities torehabilitate key microwatersheds.95
Reliable information on popula-tion, health, and environment rela-tionships is now available on theInternet. IUCN—an internationalgroup of government agencies, non-governmental organizations, and sci-entists—has created a database thatdocuments long-term threats to ani-mal and plant species. The IUCNdata suggest that an increasing pro-portion of global land, fresh water,and biological production systems aredominated by people.
A similar effort to spur scientificdebate and to share information hasbeen launched by the Population-Environment Research Network(PERN), a joint project of the Inter-national Union for the ScientificStudy of Population and the Interna-tional Human Dimensions Program.PERN conducts a series of electronicdiscussion forums, or cyberseminars,on population, health, and environ-ment topics that focus on analyses ofrelevant scientific and policy issues.96
Refining Programs Around the world, a number of orga-nizations are addressing population,
31
Box 3Enhancing Expertise in Population, Health, and the Environment
The University of Michigan School of Public Healthoffers two programs to advance population, health,and environment expertise among professionals.The Population-Environment Fellows Programoffers two-year fellowships to U.S. graduates to workon projects that combine assistance for threatenedenvironments with attention to the populationdynamics and reproductive health needs of thecommunities living within those areas.
Another initiative, the Professional Exchange for Applied Knowledge (PEAK) initiative, aims todevelop the leadership capacity of professionals andorganizations in less developed countries who workin family planning, reproductive health, and popu-lation-environment fields. The centerpiece of thisinitiative is a two- to six-month fellowship for early-career professionals from Mexico, Central America,and sub-Saharan Africa. It also supports activities forthe fellows’ home organizations.
These programs provide a way for conservation,health, and development organizations to create
projects that are more people-centered than the tra-ditional conservation projects and policies that relyon “fences and fines” to protect natural areas andresources.
Participants in these programs generally haveadvanced degrees in population, health, and environ-ment-related areas and several years of experience inthe field. They engage in a variety of projects, includ-ing conducting cost-benefit analyses of adding familyplanning services to an organization’s environmentaland economic development activities; developingpartnerships among conservation and reproductive-health NGOs in protected areas; and identifying theforces driving migration into protected areas. Thecommon goals of many of the projects are to ease theenvironmental and human costs of rapid populationgrowth, unsustainable resource use, rural-to-ruralmigration, and unmanaged urban growth.
For more information, see the Population Fellows Programs website: www.sph.umich.edu/pfps/.

32
health, and environmental concernsby incorporating reproductive healthinformation and services into envi-ronmental protection efforts oradding environmental issues toreproductive health or populationeducation programs.
Rural development programs inthe 1970s and 1980s, as well as morerecent integrated conservation anddevelopment projects (ICDPs), werethe first to attempt integration on alarge scale. ICDPs represent anapproach that aims to meet socialdevelopment priorities and conserva-tion goals and therefore is based onthe links between the social settingand natural environments.97
ICDPs were popular in the conser-vation community in the mid-1980s,following the creation of a largenumber of parks and protected areasin the 1970s. Initially, they were well-supported by conservation organiza-tions and development agencies. Buthighly publicized evaluations and cri-tiques of ICDPs and their outcomessurfaced in the 1990s, calling intoquestion the effectiveness of theapproach in meeting conservationgoals. Some groups have been con-cerned that integration of popula-tion and conservation activities leadsto “mission drift”—that the groupswere straying too far from their keyobjectives and capabilities.98
Today, conservation organizationsare exploring other ways to developintegrated programs. Newer projectstend to be smaller than ICDPs, andthey build on partnerships betweensectors instead of incorporating allfunctions into a single project.99
A new generation of integratedpopulation, health, and environmentprograms is being implemented in a variety of countries, includingEcuador, Guatemala, Belize, Madagas-car, Tanzania, and the Philippines.The synergy produced by integratingfamily planning and conservationactivities into community-based pro-jects can create more effective andsustainable programs.
In these smaller projects, ecolo-gists, health specialists, and commu-
nity development experts connect anumber of factors, including envi-ronmental stress, fertility, migration,women’s health, women’s educa-tional status, and economic deci-sions. Close to 50 of these projectshave been documented, and manyare being carried out in the world’sbiodiversity hotspots and tropicalwildernesses by local conservationgroups, national governments, andinternational organizations.100
These projects use various strate-gies to incorporate activities withinthe population, health, and environ-ment sectors in their programs. The“staggered approach” involves estab-lishing a single-sector program andlater incorporating activities from asecond sector. Conservation Interna-tional (CI), an international NGO,used a staggered approach strategy in the remote forests of the Peténregion of Guatemala. CI’s projectstaff assessed an immediate need forreproductive health services as well asconservation activities among thesmall population living in the region.Because of a lack of immediate politi-cal and community support for con-servation work, CI—a conservation,not health services, organization—started delivering reproductive healthservices. While CI would ordinarilyhave partnered with established localexperts in reproductive health, itsdirect involvement in the commu-nity’s health services provided anentry point for its conservation work.Once CI established the services, itsstaff was able to integrate conserva-tion activities.101
Other approaches include “simul-taneous introduction,” which intro-duces a number of programs dealingwith various issues at the same time,and the “bridge” approach, in whichactivities in one sector, for example,health or conservation, support activi-ties in another.
A project managed by Save theChildren-U.S. in the Philippines useda “symbiotic” approach to balanceactivities linked to population growthand environmental management incoastal areas. In this approach, activi-
33
ties depend on one another and are conducted by the same staff.Building on participatory research,community mobilization, and pilotprojects, the Save the Children project used various approaches tounderstand how population dynam-ics were affecting fishing practices.An environmental site assessmentinvestigated coastal environmentalconditions, resource managementpractices, population dynamics, andcommunity attitudes toward bothpopulation and environmentalissues. Geographic information sys-tem maps compared population andland-use data from 50 years ago withrecent trends. Local communitiesconstructed three-dimensional mapshighlighting current land-use pat-terns relative to environmentalresources.102
These approaches allowed the pro-ject to develop baseline data and con-duct focus-group discussions withcommunities and local decisionmak-ers on the relationship between popu-lation and land-use changes, thedirection of these changes, and possi-ble steps to address these trends.Once community members realizedthat population pressures, togetherwith other factors, were increasingsedimentation along the coast andthreatening corals and fish catch, theystarted planting family and commu-nity forests and voluntarily began touse family planning services offered at the local clinic.
As a result, the use of modernfamily planning methods among cou-ples of reproductive age increased by 7 percent in less than two years,and communities decided to increasethe size of protected marine areasfrom 12 to 203 hectares. While this isa small-scale and recent project, itsinitial success provides insight intohow local communities and govern-ment units can design and imple-ment integrated population, health,and environment programs for theprotection and rehabilitation of thecoastal environment.
Ecosystem models such as theSAVANNA model (see page 13), are
also project management tools. Thesemodels allow the visual display of dif-ferent scenarios, enabling local poli-cymakers and scientists to evaluatevarious land-use strategies. In addi-tion to being used in the GreaterSerengeti Ecosystem, SAVANNA hasbeen adapted for use for areas in theUnited States, including Wyoming’sYellowstone National Park, Colorado’sRocky Mountain National Park, andMontana’s Pryor Mountain WildHorse Range.103
Other efforts have focused oncommunity empowerment and mobilization. In South Africa, a com-munity-based environmental andreproductive health program in tworural districts was initiated in 1998 by the government, the UN Popula-tion Fund, the Planned ParenthoodAssociation of South Africa, and theWorking for Water Programme. Theproject was undertaken to restoreoriginal water flows to rivers andstreams; created many jobs, espe-cially for women; and was linked tothe provision of reproductive healthservices.104
Engaging PolicymakersInstitutional structures, such as high-level government committees chargedwith integrating population, health,and environment concerns into
In the Philippines, local communities are mapping environmental andpopulation changes in their landscapes to develop strategies to ensure thelivelihood and well-being of upcoming generations.
Photo removed forcopyright reasons.

national development strategies, canpromote sustainable development.Nepal, for example, established a sepa-rate Ministry for Population and Envi-ronment in 1995 that was responsiblefor formulating environmental andpopulation policies, developing suit-able programs, conducting research,and coordinating population, repro-ductive health, and environment activ-ities with various governmental bodiesand NGOs.105
These approaches are importantbecause they emphasize the need forcollaboration across ministries and gov-ernment departments. Policies to solve
broad problems such as food shortagesmay address migration, intensifiedindustrialization, and higher foodimports. Short-term solutions in onlyone sector are unlikely to be sustain-able over the long term.106
Another strategy for giving policy-makers a deeper understanding ofpopulation, health, and environmentinteractions is to present the results of scientific research in formats acces-sible to a nontechnical audience. TheMillennium Ecosystem Assessment,launched on World Environment Day2001, is working to synthesize for poli-cymakers what is known about the
34
Box 4Missed Connections: International Environmental and Population Conferences
From the 1972 United Nations (UN)Conference on the Human Environ-ment in Stockholm through the 1992UN Conference on Environment andDevelopment in Rio de Janeiro, therewas hope that environmental and demo-graphic challenges facing the planetcould be addressed in an integratedfashion in international forums. Unfor-tunately, the political resolve and capac-ity for multifaceted internationalconferences may be fading. Before the2002 Johannesburg World Summit onSustainable Development (which wasalso a 10-year review of the Rio confer-ence), its chairman, Emil Salim,remarked that the event would likely bethe last of its kind. In 2003, the UNGeneral Assembly voted to end theautomatic five-year reviews of confer-ences; the format and timing of futureconferences will be decided on a case-by-case basis.1 The UN action reflectsconcerns that such conferences wereexpensive and time- and energy-con-suming, and had become routine exer-cises rather than valuable opportunitiesfor international cooperation.
Population has not been a majorcomponent of international environ-mental conferences. Climate modelsnecessarily use demographic projec-tions to create future scenarios ofgreenhouse gas emissions, atmosphericconcentrations, and climate change
and impact. While these models areconsidered in the ongoing Kyoto Proto-col negotiations, no real effort has beenmade to link population and climatepolicy. Similarly, the Convention onBiological Diversity, signed in Rio in1992, has spawned more than 15 majorinternational negotiations and techni-cal meetings. Although conference pro-ceedings usually include populationgrowth as an underlying cause of theloss of biodiversity and habitat, the pos-sibility of involving demographers andreproductive health experts has notbeen actively considered. Integration ofpopulation science and policy into envi-ronmental negotiations remains a sig-nificant unexploited opportunity.2
Parallel circumstances have affectedinternational population conferences.At the 1992 Rio environmental confer-ence, also known as the “Earth Sum-mit,” governments often deferredpopulation-environment discussions inthe belief that these topics would beaddressed at the International Confer-ence on Population and Development(ICPD) scheduled for 1994 in Cairo.But the ICPD negotiations focusedalmost entirely on reproductive rightsrather than on global population policy;environmental concerns were mostlylimited to unofficial events hosted bynongovernmental organizations. Therehas been a reticence to mix environ-
Integrating population science into
environmentalnegotiations is
an unexploitedopportunity.
35
world’s ecosystems. The US$21 mil-lion, four-year effort is bringingtogether 1,500 of the world’s leadingecologists and social scientists to ana-lyze data on the state of the world’secosystems, assess nature’s ability toprovide essential functions such asfood and clean water, and projectenvironmental trends such as defor-estation, loss of species, and pollu-tion. The Global International WatersAssessment is also examining interna-tional water conditions and prob-lems, as well as their social causes.New studies on the nitrogen cycleand persistent organic pollutants
are also complementing the ongoinginvestigation of climate change bythe Intergovernmental Panel on Climate Change.107
A few years ago, about 1,800 scientists participated in the GlobalBiodiversity Assessment to documentthe magnitude and distribution ofbiodiversity and to inventory andmonitor species’ economic value.This assessment had little impact on policy because it failed to find areceptive audience. The report isrespected among the scientific com-munity, but it has not been used bypolicymakers.
mental and population policy issues,perhaps because both present difficultpolitical challenges by themselves, andthey often appeal to different and some-times clashing constituencies.
One challenge to including popula-tion in international environmental discussions is the growing public per-ception that population growth is nearits end in both the more and less devel-oped countries. This view has been rein-forced by UN projections based onassumptions that fertility rates will fallbelow the two-child, or replacement,level in most countries within the nextfew decades. Even if these projectionsare realized, almost 3 billion more peo-ple are likely to be added to the world’spopulation by 2050. Much of the fastestgrowth will occur in countries with thegreatest biodiversity in tropical forestsand other unique habitats. The limitedfunds spent on family planning andother reproductive health services usu-ally flow first to urban areas, wheregreater economies of scale are possible.Populations living in forest and frontierareas are often left with few or no serv-ices, leading to more rapid populationgrowth and loss of species and habitat.3Integration of population and conserva-tion policy at the international and locallevels could protect biodiversity by rec-ognizing that even relatively small popu-lations can lead to environmental
damage when they live in fragile ecosys-tems and by giving a higher priority toreproductive health services for frontierpopulations.
Ideally, policies on population,energy, environment, and climate shouldbe closely coordinated because thesearenas greatly affect each other. Thenew, less-formulaic configuration of UNenvironmental conferences may presentan opportunity not only to integrate thegoals and agreements hammered out inCairo, Rio, and Johannesburg, but alsoto facilitate a synthesis of population andenvironment research and action.
References1. United Nations, Press Release, GA/10141,
June 23, 2003. Ministerial-level populationconferences have been held every 10 yearssince 1974. International technical confer-ences on population were convened in1954 and 1964.
2. Frederick A.B. Meyerson, “The End of theEra of Integrated Conferences: Burningthe Bridge to the 21st Century,” Environ-mental Change and Security Project Report(Washington, DC: Woodrow Wilson Cen-ter, 2003).
3. Frederick A.B. Meyerson, “Population, Bio-diversity, and Changing Climate,” in ClimateChange and Biodiversity; Advances in AppliedBiodiversity Science 4, ed. Lee Hannah andTom E. Lovejoy (Washington, DC: Centerfor Applied Biodiversity Science, 2003).

36
According to analysts, the assess-ment had three main problems forpolicymakers: The researchers failedto determine policymakers’ needsbefore launching the project; govern-ments feared being blamed for theloss of biodiversity documented in thereport; and the researchers did notpresent the results in a format policy-makers could understand and use.108
One of the lessons of the GlobalAssessment Report was that re-searchers and policymakers need tocommunicate better, and greatercommunication is occurring at thenational and regional levels. InBangladesh, the Centre for PolicyDialogue, and in the Philippines, thePhilippine Legislators’ Committeeon Population and Development,have been working to sensitize poli-cymakers and planners on issuesrelated to population, health, andthe environment. These groups workwith other local groups, such asmunicipal governing bodies andcommunity NGOs, to mobilize poli-cymakers’ support for policy deci-sions through regular dialogue at thenational and regional levels, researchstudies on population and sustain-able development, and policy papersbased on research findings and pol-icy consultations.109
The Philippine group has takenthis dialogue to both regional andinternational levels. At a meeting heldin Bangkok in December 2002, 89parliamentarians from 30 countriessigned a declaration for the WorldSummit on Sustainable Developmentthat recognized the importance of thepopulation, health, and environmentinteractions.
Scientists have also been workingto communicate with policymakers atthe international level. In 2002, theGlobal Science Panel, a group ofmore than 30 international scientistsfrom various disciplines, prepared acomprehensive scientific assessmentof the role of population in sustain-able development strategies. Thepanel’s report was released at the2002 Johannesburg World Summit on Sustainable Development.
Several international conferencesand agreements in recent years offerencouraging signs that the world com-munity is ready to act to reduce nega-tive environmental impacts fromhuman activities, but so far the actionshave not successfully integrated popu-lation, health, and environment con-cerns (see Box 4, page 34).
Finding Creative SolutionsHumans have always sought more effi-cient ways to use resources and tosubstitute a more abundant resourcefor a rare or costly one. Substitutionsare inherent in technologicalprogress—regardless of supply con-straints or environmental problemswith the materials being substituted.Copper replaced stone, bronzereplaced copper, iron and later steelreplaced bronze, and aluminumreplaced steel; carbon and glass com-posites and designer ceramics are sub-stituting for all of these. Concrete andasphalt roads have replaced irontracks in transportation networks, andsilicon-based chips replaced bulky vac-uum tubes in communication andcomputing technology.
Technology, including advances inmetallurgy and in the creation of com-posite materials, promises continuedchange in the materials upon whicheconomies depend. The new materialssometimes perform better than thosereplaced. Carbon-fiber composites,which are used in the construction ofaircraft and many other applications,are lighter, stronger, and less chemi-cally reactive than the metals theyreplace, with potentially fewer envi-ronmental costs.
Even without new energy technol-ogy, energy forms can be transformedinto other material forms for the purpose of substitution. Liquid fuelscan be derived from coal. Solar elec-tricity can create hydrogen that canbe burned in internal combustionengines. Biomass (biological wastefrom industry or from municipallandfills) can fuel electrical generat-ing plants.
Researchers andpolicymakers
need to communicate
better.

37
Energy efficiency is a form of sub-stitution. Electric motors with com-puterized controls can run moreefficiently than traditional motors.Generating electricity through gasturbines rather than large thermalplants is another way to substitute amore-efficient technology for a less-efficient one.
But substitutions can be costly.Constructing a large dam to generateelectricity will disrupt human settle-ments, river and terrestrial ecosys-tems, and even local seismic stability.But the costs of that disruption mightbe less than the capital, operating,health, and environmental costs of acoal-fired thermal plant or thousandsof internal combustion engines thatmight otherwise pollute urban areas.
Recycling of manufacturing materi-als is also substitution. Recycling avoidsthe economic and environmental costsof extracting raw materials and theeconomic and environmental costs ofprocessing and disposal. One-fourth ofAmerica’s aluminum demand is metby recycled materials. More than one-half of the natural material that wouldotherwise be extracted and smelted isavoided by recycling iron.
Better engineering is another formof substitution. Cars made of lightermaterials, buildings with more effi-cient heating systems, and computersthat store more information in lessspace are all forms of substitution.The high-tech solutions to energyneeds offer exciting possibilities thatenergy demands need not signifyenvironmental degradation andthreaten catastrophic climate change.
ConclusionThe field of population, health, andenvironment studies has encountered anumber of barriers, most notably a lim-ited theoretical framework and incom-patible methodologies. Researchersalso face problems of working outsidetheir academic disciplines and dealingwith the complexities of topics thatcross many disciplines. Topics like foodsecurity, environmental health, water
availability, energy production andconsumption, and economic opportu-nities are at the heart of human andenvironmental well-being.
Policymakers need to better under-stand research results to guide policydecisions. But population and environ-mental changes are often slow, andprojections of future scenarios arebased on assumptions of conditionsthat are difficult to predict with a highdegree of certainty.
Investing in family planning andreproductive health services benefitspeople and the environment. Themost rapid fertility declines haveoccurred in developing countries thathave improved child survival rates andeducational levels and have imple-mented family planning programs.The relatively small investment neces-sary to implement such programs canyield immense long-term benefits.
Politicians often are stereotyped asshort-term crisis managers, but theinternational political community hasdemonstrated a willingness and abilityto address complex long-term issues,as evidenced in recent internationalagreements on population, biodiver-sity, and ozone depletion. Additionalevidence that reducing pollution ben-efits vulnerable groups such as theyoung, the elderly, and women canhelp buttress the political case forinvesting in environmental protectionand reproductive health. Solid docu-mentation can also support the argu-ment that such investments cancomplement economic growth andhuman well-being.
Sub-Saharan Africa and South Asiastand out as the regions most likely tobe adversely affected by rapidly risingpopulation, given their young agestructures. Especially in Africa, manygovernments and communities lackthe resources or institutional capacityto build sound environmental poli-cies, strengthen investment in educa-tion and primary health care, andquickly adopt new technological inno-vations that further economic growthwith less environmental impact.
Of the many connections amongpopulation, health, and environment,

38
a few stand out as particularly trou-bling: the dependence on fossil fuelsfor economic growth; the challengeof mobilizing support for resourceconservation and biodiversity protec-tion; freshwater scarcity; and environ-mental health threats.
Because these issues have popula-tion, health, and environment dimen-sions, we need to address them in anintegrated fashion, and improve theway we study, document, and commu-nicate the relationships. We need totest approaches to manage these prob-lems at different geographic levels andfor different time periods. And weneed to find ways to engage policy-makers on these issues. Ultimately, thereal issue is whether perception andpolicy can keep pace with a rapidlychanging world.

39
References1. Anne R. Pebley, “Demography and the Environment,” Demography 35, no. 4 (1998): 377-89.2. Carole L. Jolly and Barbara Boyle Torrey, “Introduction,” in Population and Land Use in Developing
Countries, ed. Carole L. Jolly and Barbara Boyle Torrey (Washington, DC: National Academy Press,1993): 1-13.
3. Gordon M. Wolman, “Population, Land Use, and Environment: A Long History” in Population and LandUse in Developing Countries, ed. Carole L. Jolly and Barbara Boyle Torrey (Washington, DC: NationalAcademy Press, 1993): 15-29.
4. Nico Keilman, “The Threat of Small Households,” Nature 421 (Jan. 30, 2003): 489-90; and Jianguo Liuet al., “Effects of Household Dynamics on Resource Consumption and Biodiversity,” Nature 421 (Jan. 30,2003): 530-33.
5. United Nations (UN) Population Division, World Population Prospects: The 2002 Revision (New York:United Nations, 2003); and Brian O’Neill and Deborah Balk, “World Population Futures,” PopulationBulletin 56, no. 3 (2001).
6. Carlyn E. Orians and Marin Skumanich, The Population-Environment Connection: What Does It Mean forEnvironmental Policy? (Seattle: Battelle Seattle Research Center, 1995).
7. UN Environment Programme (UNEP), Global Environment Outlook 3 (London: Earthscan PublicationsLtd., 2002): 34.
8. UN Population Division, World Population Prospects: The 2002 Revision.9. Philip Martin and Jonas Widgren, “International Migration: Facing the Challenge,” Population Bulletin
57, no. 1 (2002): 3.10. UN Population Division, World Urbanization Prospects: The 2001 Revision, accessed online at http://
esa.un.org/unpp, on Aug. 25, 2003; and Martin P. Brockerhoff, “An Urbanizing World,” Population Bul-letin, 55, no. 3 (2000): 3.
11. Jeffrey A. McNeely and Sara J. Scherr, Ecoagriculture: Strategies to Feed the World and Save Wild Biodiversity(Washington, DC: Island Press, 2003): 46-47, 234.
12. Norman Myers, “Environmental Refugees: A Crisis in the Making,” People and the Planet 3, no. 4 (1994): 167.13. World Conservation Union (IUCN) and Population Reference Bureau (PRB), Water and Population
Dynamics: Local Approaches to a Global Challenge (report on a collaborative initiative and workshop atIUCN’s World Conservation Congress, Montreal, Canada, October 1996).
14. Thomas Robert Malthus, An Essay on the Principle of Population, as It Affects the Future Improvement of Society.With Remarks on the Speculations of Mr. Godwin, M. Condorcet, and Other Writers. Reprinted in On Population,ed. Gertrude Himmelfarb (New York: Modern Library, 1960).
15. Jack Parsons, “Population, Environment, and Policy Relations: An Historical Overview,” in Environmentand Population Change, ed. Basia Zaba and John Clarke (Liège, Belgium: Derouzux Ordina Editions,1994): 87-99.
16. Joel E. Cohen, How Many People Can the Earth Support? (New York: W.W. Norton & Co., 1995).17. World Commission on Environment and Development, Our Common Future (New York: Oxford Univer-
sity Press, 1987): 8.18. See Paul R. Ehrlich, Anne H. Ehrlich, and Gretchen C. Daily, “Food Security: Population and Environ-
ment,” Population and Development Review 19, no. 1 (1993): 1-31; and Peter Raven, “Winners and Losers inthe Twentieth-Century Struggle to Survive,” in Resources, Environment and Population: Present Knowledge, FutureOptions, ed. Kingsley Davis and Mikhail S. Bernstam (New York: Oxford University Press, 1991): 259-67.
19. Bjørn Lomborg, The Skeptical Environmentalist: Measuring the Real State of the World (New York: CambridgeUniversity Press, 2001).
20. Donella H. Meadows et al., The Limits to Growth: A Report for the Club of Rome’s Project on the Predicament ofMankind, 2d ed. (New York: Signet, New American Library, 1974).
21. Cohen, How Many People Can the Earth Support?22. H.S.D. Cole et al., Models of Doom: A Critique of The Limits to Growth, With a Reply by the Authors of ‘The Lim-
its to Growth’ (New York: Universe Books, 1973); and Julian Simon and Herman Kahn, eds., The Resource-ful Earth: A Response to Global 2000 (Oxford, England: Basil Blackwell, 1984).
23. Paul Ehrlich and John P. Holdren, “Impact on Population Growth,” Science 171 (1974): 1212-17. 24. William R. Moomaw and Mark D. Tullis, “Population, Affluence, or Technology? An Empirical Look at
National Carbon Dioxide Production,” in People and Their Planet, Searching for Balance, ed. Barbara Bau-dot and William R. Moomaw (New York: Palgrave Macmillan, 1999).
25. Wolfgang Lutz, “Introduction,” in Population-Development-Environment: Understanding Their Interactions inMauritius, ed. Wolfgang Lutz (Berlin: Springer-Verlag, 1994); and Paul Demeny, “Tradeoffs BetweenHuman Numbers and Material Standards of Living,” in Resources, Environment, and Population, ed. Kings-ley Davis and Mikhail S. Bernstam (New York: Population Council, 1991): 408-21.
26. Gayl Ness and Meghan Golay, Population and National Sustainable Development (London: Earthscan Publi-cations Ltd., 1997).
27. Orians and Skumanich, The Population-Environment Connection.28. Wolfgang Lutz, Alexia Prskawetz, and Warren C. Sanderson, eds., Population and Environment: Methods of
Analysis (New York: Population Council, 2002).29. Wolfgang Lutz, Warren C. Sanderson, and Annababette Wils, “Conclusions: Toward Comprehensive P-E
Studies” in Population and Environment: Methods of Analysis, ed. Wolfgang Lutz, Alexia Prskawetz, and

40
Warren C. Sanderson (New York: Population Council, 2002); and Wolfgang Lutz, ed., Population-Devel-opment-Environment.
30. McNeely and Scherr, Ecoagriculture: Strategies to Feed the World and Save Wild Biodiversity: 96; and Environ-mental News Network, “Savanna Model Tracks Delicate Balance in Africa,” CNN.com (Feb. 14, 2003),accessed online at www.cnn.com/2000/NATURE/02/14/savanna.enn/, on Aug. 22, 2003.
31. ”Saving African and North American Wildlife With the Savanna Model,” News Notes, no. 31 (NaturalResource Ecology Laboratory, Colorado State University, 2000), accessed online atwww.nrel.colostate.edu/news/newsnotes/newsnotes31.html, on Aug. 22, 2003.
32. Robert C. Lacy and Philip S. Miller, “Expanding PVA: Incorporating Human Populations and ActivitiesInto PVA for Wildlife Conservation,” in Population Viability Analysis, ed. Stephen Beissinger and Dale R.McCullough (Chicago: University of Chicago Press, 2002).
33. Lutz, Prskawetz, and Sanderson, eds., Population and Environment: Methods of Analysis.34. Terry P. Hughes et al., “Climate Change, Human Impacts, and the Resilience of Coral Reefs,” Science
301 (Aug. 15, 2003): 929-33; and Union of Concerned Scientists, “Climate Impacts, Early WarningSigns: Coral Reef Bleaching” (June 10, 2003), accessed online at www.ucsusa.org/global_environment/global_warming/page.cfm?pageID=511, on Aug. 22, 2003.
35. National Oceanic and Atmospheric Administration, “Coral Reefs: A Guided Tour—What is CoralBleaching?” accessed online at http://response.restoration.noaa.gov/oilaids/coral/tour/05.html, onAug. 22, 2003.
36. Anthony J. McMichael, “Global Environmental Change and Human Population Health: A Conceptualand Scientific Challenge for Epidemiology,” International Journal of Epidemiology 22, no. 1 (1993): 1-8.
37. Lori M. Hunter, The Environmental Implications of Population Dynamics (Santa Monica, CA: RAND, 2000):39-40; and CIESIN, “The Montreal Protocol on Substances That Deplete the Ozone Layer,” accessedonline at www.ciesin.org/TG/PI/POLICY/montpro.html, on July 1, 2003.
38. Lori Ashford, “New Population Policies: Advancing Women’s Health and Rights,” Population Bulletin 56,no. 1 (2001).
39. Hunter, The Environmental Implications of Population Dynamics: 40; and Ivan Noble, “Satellite Shows Dra-matic Aral Loss,” BBC News (July 30, 2003), accessed online at www.bbc.co.uk, on July 30, 2003.
40. Maria Concepcion Cruz et al., Population Growth, Poverty, and Environmental Stress: Frontier Migration in thePhilippines and Costa Rica (Washington, DC: World Resources Institute, 1992).
41. Mark W. Rosegrant, Ximing Cai, and Sarah A. Cline, World Water and Food to 2025 (2002), accessedonline at www.ifpri.org/pubs/books/water2025/water2025.pdf, on Aug. 31, 2003; and InternationalFood Policy Research Institute (IFPRI), “Food for Schooling in Bangladesh” (2001), accessed online atwww.ifpri.org/pubs/ib/ib4_ffs.pdf, on Sept. 1, 2003.
42. James A. Paul, “NGOs and Global Policy Making” (2000), accessed online at www.globalpolicy.org/ngos/analysis/anal00.htm, on Aug. 22, 2003.
43. Dara Carr, “Is Education the Best Contraceptive?” (Washington, DC: Population Reference Bureau,2000); and Justine Sass, “Women, Men, and Environmental Change: The Gender Dimensions of Envi-ronmental Policies and Programs” (Washington, DC: Population Reference Bureau, 2002).
44. Environmental Protection Agency (EPA), National Air Pollutant Emission Trends, 1900-1998 (2000); andEPA, Draft Report on the Environment (June 2003), accessed online at www.epa.gov/indicators/roe/html/roeAir.htm, on July 8, 2003.
45. Roger-Mark De Souza, Household Transportation Use and Urban Air Pollution: A Comparative Analysis ofThailand, Mexico, and the United States (Washington, DC: Population Reference Bureau, 1999).
46. Sass, “Women Men, and Environmental Change.”47. World Bank, World Development Report, 2000/2001: Attacking Poverty (New York: Oxford University Press,
2000).48. “Childhood Asthma Hospitalizations: King County, Washington, 1987-1998,” Morbidity and Mortality
Weekly Report 49, no. 41 (2000): 929-33; and U.S. General Accounting Office, Hazardous and Nonhaz-ardous Waste: Demographics of People Living Near Waste Facilities (1995), accessed online atwww.lib.umich.edu/govdocs/text/rced9584.txt, on Sept. 7, 2003.
49. Dennis Normile, “Poor to Feel Pinch of Rising Fish Prices,” Science 298 (Nov. 8, 2002): 1154.50. UNEP, Global Environment Outlook 3: 304.51. EPA, “Municipal Solid Waste: Basic Facts,” accessed online at www.epa.gov/epaoswer/non-hw/muncpl/
facts.htm, on June 30, 2003.52. World Bank, 2003 World Development Indicators (Washington, DC: World Bank, 2003): table 3.12.53. UNEP, Global Environment Outlook 3: 224.54. Food and Agriculture Organization (FAO), World Agriculture: Toward 2015/2030, Summary Report (Rome:
FAO, 2002); and William Bender and Margaret Smith, “Population, Food, and Nutrition,” PopulationBulletin 51, no. 4 (1997).
55. UNEP, Global Environment Outlook 3: 62.56. FAO, “Food Insecurity and AIDS: A Vicious Circle,” accessed online at www.fao.org/focus/e/aids/
aids2-e.htm, on Jan. 22, 2002.57. Jon Jeter, “AIDS Sickening African Economies,” The Washington Post, Dec. 12, 1999.58. “Zambia Rejects GM Corn on Scientists’ Advice,” Science 298 (Nov. 8, 2002): 1153.59. Jason Otterbein, “Beyond the Rhetoric: Assessing the Risks of Genetically Modified Crops” (March 7,

41
2001), accessed online at http://duke.usask.ca/~ss_phil/GM2.html, on Aug. 31, 2003; and McNeely andScherr, Ecoagriculture: Strategies to Feed the World and Save Wild Biodiversity: 83.
60. César Chelala, “Environmental Impact on Child Health” (Washington, DC: Pan American Health Orga-nization, 2000).
61. Lauretta Burke et al., eds., Pilot Analysis of Global Ecosystems: Coastal Ecosystems (Washington, DC: WorldResources Institute and IFPRI, 2001); and UNEP, Global Environment Outlook 3: 212.
62. Jonathan Nash, “Healthy People Need Healthy Forests” (October 2001), accessed online atwww.prb.org/pdf/HealthyPeopleNeed.pdf, on Aug. 31, 2003.
63. IUCN, 2002 IUCN Red List of Threatened Species (2002), accessed online at www.redlist.org, on July 25, 2003.64. Nigel C.A. Pitman and Peter M. Jergensen, “Estimating the Size of the World’s Threatened Flora,”
Science 298 (Nov. 1, 2002): 989.65. Richard Cincotta and Robert Engleman, Nature’s Place: Human Population and the Future of Biological Diver-
sity (Washington, DC: Population Action International, 2000).66. Frederick A.B. Meyerson, “Population, Biodiversity, and Changing Climate,” in Climate Change and Biodi-
versity, Advances in Applied Biodiversity Science 4, ed. Lee Hannah and Tom E. Lovejoy (Washington, DC:Center for Applied Biodiversity Science, 2003).
67. McNeely and Scherr, Ecoagriculture: Strategies to Feed the World and Save Wild Biodiversity: 23.68. Carbon Dioxide Research Group, “Atmospheric CO2 Concentrations” (July 25, 2003), accessed online at
http://cdiac.esd.ornl.gov/ftp/maunaloa-co2/maunaloa.co2, on Aug. 31, 2003.69. UN Development Program (UNDP) et al., World Resources 2002-2004—People and Ecosystems: The Fraying
Web of Life (2000), accessed online at www.wri.org/wr2000, on Sept. 7, 2003.70. Meinrat O. Andreae, “Biomass Burning in the Tropics: Impact on Environmental Quality and Global
Climate,” in Resources, Environment, and Population, ed. Kingsley Davis and Mikhail S. Bernstam (NewYork: Population Council, 1992); and World Resources Institute (WRI) et al., World Resources 1996-97(New York: Oxford University Press, 1996): 286, 293.
71. UNDP et al., World Resources 2000 CD-ROM (2002): table 21201.72. Carbon Dioxide Information Analysis Center, “National CO2 Emissions From Fossil-Fuel Burning,
Cement Manufacture, and Gas Flaring: 1751-1999,” accessed online athttp://cdiac.esd.ornl.gov/ftp/trends/emissions/usa.dat, on Aug. 31, 2003.
73. Frederick A.B. Meyerson, “Population, Carbon Emissions, and Global Warming: The Forgotten Rela-tionship at Kyoto,” Population and Development Review 24, no. 2 (1998): 115-30.
74. American Association for the Advancement of Science (AAAS), “Population and Ecosystems: Oceans,”in AAAS Atlas of Population and Environment, 2000, accessed online at www.ourplanet.com/aaas/pages/eco09.html., on Aug. 4, 2003.
75. Seth Dunn, “Reading the Weathervane: Climate Policy From Rio to Johannesburg,” WorldWatch Paper160 (2002).
76. McMichael, “Global Environmental Change and Human Population Health”; R. Sari Kovats et al., Cli-mate Change and Human Health: Impact and Adaptation (Geneva: World Health Organization, 2000); andBrian O’Neill, F.L. MacKellar, and Wolfgang Lutz, Population and Climate Change (Cambridge, England:Cambridge University Press, 2000).
77. UNEP, Global Environment Outlook 3: 150-53.78. Liz Creel, “Children’s Environmental Health: Risks and Remedies” (Population Reference Bureau,
2002), accessed online at www.prb.org/childenvhealth, on Aug. 31, 2003.79. Farzaneh Roudi-Fahimi, Liz Creel, and Roger-Mark De Souza, “Finding the Balance: Population and
Water Scarcity in the Middle East and North Africa” (June 2002), accessed online at www.prb.org/pdf/FindingTheBalance_Eng.pdf, on Aug. 31, 2003.
80. John Tibbetts, “Coastal Cities: Living on the Edge,” Environmental Health Perspectives 20, no. 22 (2002):674-81.
81. Sara Curran et al., “Interactions Between Coastal and Marine Ecosystems and Human Population Sys-tems: Perspectives on How Consumptions Mediates This Interaction,” Ambio: A Journal of the HumanEnvironment 31, no. 4 (2002): 264-68; Barbara Best and Alan Bornbusch, eds. “Global Trade and Con-sumer Choices: Coral Reefs in Crisis” (paper presented at the 2001 Annual Meeting of the AmericanAssociation for the Advancement of Science, San Francisco, Feb. 19, 2001); and Burke et al., Pilot Analy-sis of Global Ecosystems: Coastal Ecosystems: 19.
82. FAO, World Fisheries and Aquaculture Atlas CD-ROM (Rome: FAO, 2001).83. FAO, The State of World Fisheries and Aquaculture, Part I. World Review of Fisheries and Aquaculture (2002).84. J.K. Choudhury, “World Forestry Congress,” in AAAS Atlas of Population and Environment (Berkeley, CA:
University of California Press, 2000): 139. 85. UN Population Fund (UNFPA), State of World Population 2001: Footprints and Milestones: Population and
Environmental Change (New York: UNFPA, 2002): 42-48.86. World Health Organization (WHO), Air Quality Guidelines, WHO, 1999 (1999), accessed online at
www.who.int/peh/air/Airqualitygd.htm, on Sept. 1, 2003.87. European Environmental Agency, “2003 Europe’s Environment: The Third Assessment. Air Pollution, “
Environmental Assessment Report no. 1 (2003).88. WRI et al., World Resources 1998-99: Environmental Change and Human Health (New York: Oxford Univer-
sity Press, 1998).
42
89. WRI, “Urban Air: Health Effects of Particulates, Sulfur Dioxide, and Ozone,” accessed online atwww.wri.org/wr-98-99/urbanair.htm, on Sept. 1, 2003.
90. Theo Colborn, Diane Dumanoski, and John Peterson Mayers, Our Stolen Future: Are We Threatening OurFertility, Intelligence, and Survival?–A Scientific Detective Story (New York: Plume Books, 1997).
91. Don Hinrichsen and Bryant Robey, “Population and the Environment: The Global Challenge,” Popula-tion Reports, Series M, no. 15 (Baltimore: Population Information Program, Johns Hopkins UniversitySchool of Public Health, 2000); and International Federation of Red Cross and Red Crescent Societies(IFRC), World Disasters Report: Focus on Public Health (Geneva: IFRC, 2000): chap. 5.
92. Geoffrey Cowley, “How Progress Makes Us Sick,” Newsweek (May 5, 2003): 33-35.93. McNeely and Scherr, Ecoagriculture: Strategies to Feed the World and Save Wild Biodiversity: 82.94. Lutz, Prskawetz, and Sanderson, eds., Population and Environment: Methods of Analysis.95. McNeely and Scherr, Ecoagriculture: Strategies to Feed the World and Save Wild Biodiversity: 161-62.96. Alex de Sherbinin, personal communication, July 2003. Additional information is available at
www.populationenvironmentresearch.org:9080/index.jsp. 97. S. Worah, “International History of ICDPs,” in Proceedings of Integrated Conservation and Development Projects
Lessons Learned Workshop (Hanoi: UNDP/World Bank/World Wildlife Fund, 2000); and Ross Hughes andFiona Flintan, Integrating Conservation and Development Experience: A Review and Bibliography of the ICDP Lit-erature (London: International Institute for Environment and Development, 2001).
98. Clare Ginger, “Organizational Action for Responding to Population-Environment Linkages” (paper pre-sented at the Annual Global Health Council Conference, Washington, DC, May 30, 2003); and personalcommunication, July 2003.
99. Kathleen Mogelgaard, Helping People, Saving Biodiversity (Washington, DC: Population Action Interna-tional (PAI), March 2003); and Eckhard Kleinau and Jennifer Talbot, “When the Whole is Greater Thanthe Sum of Its Parts: Integrated Indicators for Population-Environment Programs,” PECS News (Washing-ton, DC: Woodrow Wilson Center, Environmental Change and Security Project, 2003).
100. Jodie Riesenberger, Planting Seeds Meeting Needs: New Partnerships for Community-Based Resource Conservationand Reproductive Health (Washington, DC: PAI, 2002): 5; Robert Engelman, Plan and Conserve: A SourceBook on Linking Population and Environment Services in Communities (Washington, DC: PAI, 1998); CarolynGibb Vogel and Robert Engelman, Forging the Link: Emerging Accounts of Population and Environment Workin Communities (Washington, DC: PAI, 1999); and UNFPA, State of World Population 2001: 50-51.
101. John Williams, “Integrating Population Into Environmental Field Projects,” PECS News (Washington, DC:Woodrow Wilson Center, Environmental Change and Security Project, 2001); and Rainera L. Luceroand Robert Layng, “Understanding Reproductive Health/Natural Resource Management Integration inthe Philippines,” World Neighbors 28, no. 2 (2002).
102. Robert Layng, “Strengthening Formative Environmental Research Through the Inclusion of PopulationVariables,” Population-Environment Fellows Newsletter (Ann Arbor, MI: Winter 2002/2003).
103. Natural Resource Ecology Laboratory, Colorado State University, “Saving African and North AmericanWildlife With the Savanna Model,” News Notes, no. 31 (2000), accessed online at www.nrel.colostate.edu/news/newsnotes/newsnotes31.html, on Aug. 22, 2003.
104. UNFPA, “Population, Environment and Poverty Linkages: Operational Challenges,” Population and Devel-opment Strategies Series, no. 1 (2001).
105. UNFPA, “Population, Environment and Poverty Linkages: Operational Challenges.” 106. Wolfgang Lutz et al., “Modeling Population-Environment-Development-Agriculture Interactions for Sci-
ence Policy Communication and Advocacy in Africa: The PEDA model” (paper presented to the IUSSPGeneral Conference, Salvador, Brazil, Aug. 18-24, 2001).
107. Edward Ayensu et al., “International Ecosystem Assessment,” Science 286 (Oct. 22, 1999): 685; and UNEP,Global Environment Outlook 3: 345.
108. Jocelyn Kaiser, “New Survey to Collect Global News You Can Use; Millenium Ecosystem Assessment,” Sci-ence 289 (Sept. 8, 2000): 1676.
109. UNFPA, “Population, Environment and Poverty Linkages: Operational Challenges.”

43
Suggested ResourcesEngelman, Robert, et al. People in the Balance. Washington, DC: Population Action
International, 2000.
Harrison, Paul, and Fred Pearce. AAAS Atlas of Population and Environment. Edited byVictoria Dompka Markham. Berkeley, CA: University of California Press and theAmerican Association for the Advancement of Science, 2001.
Hinrichsen, Don, and Bryant Robey. “Population and Environment: The GlobalChallenge,” Population Reports, Series M, no. 15. Baltimore: Johns Hopkins Uni-versity School of Public Health, Population Information Program, 2000.
Hunter, Lori M. The Environmental Implications of Population Dynamics. Santa Monica,CA: RAND, 2000.
Lutz, Wolfgang, Alexia Prskawetz, and Warren C. Sanderson, eds. Population andEnvironment: Methods of Analysis. New York: Population Council, 2002.
Malsawma, Zuali, "Environmental Information on the Web." (October 2003). Avail-able online at www.prb.org/envinfo.
United Nations Development Programme, et al. World Resources 2002-2004: Decisionsfor the Earth: Balance, Voice, and Power. Washington, DC: World Resources Insti-tute, 2003.
UN Population Fund (UNFPA). The State of World Population 2001--Footprints and Milestones: Population and Environmental Change. New York: UNFPA, 2001.

44
Population Reference BureauPopulation, Health, and Environment Program
PRB’s Population, Health, and Environment (PHE) Program disseminatesthe latest analysis and scientific information on the causes and consequencesof critical population, health, and environment interactions, and on the waysthat these interactions can be addressed. Through publications, researchactivities, training programs, and media projects, the program builds localexpertise to contribute to policy decisions, increases the use of populationdata and methodologies for environmental planning, and strengthens jour-nalists’ ability to focus policy attention on key PHE issues.
Recent publications from PRB’s PHE program include:
■ Ripple Effects: Population and Coastal Regions, by Liz Creel, 2003■ Making the Link: Population, Health, Environment, by Jonathan G.
Nash and Roger-Mark De Souza, 2002■ Children's Environmental Health: Risks and Remedies, by Liz Creel,
2002■ Finding the Balance: Population and Water Scarcity in the Middle
East and North Africa, by Farzaneh Roudi-Fahimi, Liz Creel, and Roger-Mark De Souza, 2002
■ Women, Men and Environmental Change, by Justine Sass, 2002■ Healthy People Need Healthy Forests, by Jonathan Nash, 2001■ Household Transportation Use and Urban Air Pollution: A Compara-
tive Analysis of Thailand, Mexico, and the United States, by Roger-MarkDe Souza, 1999
These publications, and many more articles and reports, are on PRB’swebsite, www.prg.org.

Related PRB PublicationsFor more information on population, health, and environment issues, here areseveral PRB publications available in print and on our website.
Making the Link: Population, Health, Environment,by Jonathan G. Nash and Roger-Mark De Souza, 2002This wallchart provides information and data on critical linkages between humanbeings and the environment for major world regions and individual countries. Inaddition to demographic information, the data sheet includes measures of con-sumption like carbon dioxide emissions, energy use, and number of motor vehicles;indicators of public health such as access to safe drinking water and sanitation; andindicators of environmental stress such as rates of deforestation and the number ofthreatened species. (IDS02ENV) $4.50 Also published in French and Spanish.
International Migration: Facing the Challenge,by Philip Martin and Jonas Widgren, 2002This Population Bulletin highlights the challenges brought by the movements of millions of people across nationalborders around the world. International migration has always sparked controversy,
but it has attracted even more attention given the rising incidence of internationalterrorism. (BUL57.1) $7.00
2003 World Population Data Sheet,by Carl Haub, 2003PRB’s population World Population Data Sheet contains the latest population esti-mates, projections, and other key indicators for 200 countries. (DS03ENG) $4.50Also published in French and Spanish.
Recent Population Bulletins
Volume 58 (2003)No. 2 Immigration: Shaping andReshaping America, by Philip Mar-tin and Elizabeth Midgley
No. 1 Population Dynamics inLatin America, by Jorge A. Brea
Volume 57 (2002)No. 4 What Drives U.S. PopulationGrowth? by Mary M. Kent and MarkMather
No. 3 Facing the HIV/AIDS Pan-demic, by Peter Lamptey, MerywenWigley, Dara Carr, and Yvette Collymore
No. 2 Poverty in America: BeyondWelfare Reform, by Daniel T. Lichterand Martha L. Crowley
No. 1 International Migration:Facing the Challenge, by PhilipMartin and Jonas Widgren
Volume 56 (2001)No. 4 Elderly Americans, by Chris-tine L. Himes
No. 3 World Population Futures,by Brian O’Neill and Deborah Balk
No. 2 First Glimpses From the2000 U.S. Census, by Mary M. Kent,Kelvin M. Pollard, John Haaga, andMark Mather
No. 1 New Population Policies:Advancing Women’s Health andRights, by Lori S. Ashford
Volume 55 (2000)No. 4 American Families, by Suzanne M. Bianchi and Lynne M. Casper
No. 3 An Urbanizing World,by Martin P. Brockerhoff
No. 2 America’s Diversity andGrowth: Signposts for the 21st Cen-tury, by Martha Farnsworth Riche
No. 1 Attaining Global Health:Challenges and Opportunities, by Scott C. Ratzan, Gary L. Filerman,and John W. LeSar
Volume 54 (1999)No. 4 Population and Health: An Introduction to Epidemiology,2d ed., by Ian R.H. Rockett
To read selected PRB publications, go to: www.prb.org
To order PRB publications (discounts available):Population Reference Bureau1875 Connecticut Ave., NW, Suite 520Washington, DC 20009Phone: 800-877-9881Fax: 202-328-3937E-mail: [email protected]: www.prb.org

Population Reference Bureau1875 Connecticut Avenue, NW, Suite 520Washington, DC 20009-5728202-483-1100www.prb.org