critical issues for clean energy financing and leds ...€¦ · ecam clean energy financing and...
TRANSCRIPT

USAID CEADIR Project ECAM Clean Energy Financing and LEDS: Initial Status Report i
usd
CRITICAL ISSUES FOR CLEAN
ENERGY FINANCING AND
LEDS SUPPORT TO
CENTRAL AMERICA
THE CEADIR PROJECT
Contract No.: AID-OAA-I-12-00038, Task Order: AID-OAA-TO-14-00007
January 2015
This report was produced for review by the United States Agency for International Development
(USAID). It was prepared by Crown Agents USA, Ltd. for the CEADIR Project.

USAID CEADIR Project ECAM Clean Energy Financing and LEDS: Initial Status Report ii
Crown Agents USA, Ltd. 1 1129 20th Street NW 1 Suite 500 1
Washington DC 20036 1 T: (202) 822-8052 1 www.crownagentsusa.com

USAID CEADIR Project ECAM Clean Energy Financing and LEDS: Initial Status Report 3
CRITICAL ISSUES FOR CLEAN ENERGY FINANCING AND
LEDS SUPPORT TO
CENTRAL AMERICA: Contract No.: AID-OAA-I-12-00038
Task Order: AID-OAA-TO-14-00007
Submitted to: Global Climate Change Office (GCC) and Economic Policy Office (EP) Bureau for Economic Growth, Education, and
Environment/Economic Policy (E3)
U.S. Agency for International Development
1400 Pennsylvania Avenue, NW
Washington, DC 20523
January 30, 2015
Santiago Enriquez, Abt Associates
Gwendolyn Andersen, Abt Associates Elias Epstein, Crown Agents USA
Alan Miller, Crown Agents USA Dan Gies, Enclude Solutions
Bloomberg New Energy Finance
Prepared for the CEADIR Project by Crown Agents – USA with Abt Associates, Bloomberg
New Energy Finance, and Enclude Solutions, Washington, DC
DISCLAIMER
The authors’ views expressed in this publication do not necessarily reflect the views of the United States
Agency for International Development (USAID) or the United States Government.
USAID CEADIR Project ECAM Clean Energy Financing and LEDS: Initial Status Report 4
CONTENTS
ACRONYMS .............................................................................................................................. VIII
1. EXECUTIVE SUMMARY ...................................................................................................... 1
1.1 Study Purpose ................................................................................................................................................ 1
1.2 Conclusions .................................................................................................................................................... 1
1.3 Recommendations ........................................................................................................................................ 5
2. OVERVIEW ............................................................................................................................ 7
2.1 Energy Sector Drivers: Demand, Available Clean Energy, and Need for Private Financing......... 7
2.2 Supporting Clean Energy Finance and LEDS ........................................................................................... 8
2.3 Encouraging Clean Energy Financing ......................................................................................................... 9
2.4 Opportunities for Assistance ......................................................................................................................... 10
2.5 Implications for Needs Assessment ........................................................................................................ 11
3. CLEAN ENERGY TRENDS AND GOALS .........................................................................12
3.1 Trends ........................................................................................................................................................... 12
3.1.1 Declines in Prices for Renewable Energy ............................................................................... 12
3.1.2 Increasing Demand for Electricity ................................................................................................. 12
3.1.3 Increasing Energy Efficiency Opportunities ............................................................................ 17 3.1.4 Reduced Line Loss ....................................................................................................................... 25
3.1.5 Increasing Demand for Liquid Fuels ......................................................................................... 25
3.1.6 Clean Energy as Substitutes for Oil ......................................................................................... 26
3.1.7 Oil Price Fluctuations .................................................................................................................. 27 3.1.8 Enabling Environment .................................................................................................................. 29
3.2 Important Co-benefits ............................................................................................................................... 31 3.2.1 Energy Security Concerns .......................................................................................................... 31
3.2.2 Health Benefits ............................................................................................................................. 33
3.2.3 Job Creation .................................................................................................................................. 34
3.2.4 Gender and Vulnerable Population Impacts ........................................................................... 35
3.3 Goals .............................................................................................................................................................. 35
3.3.1 El Salvador ..................................................................................................................................... 36
3.3.1 Guatemala ...................................................................................................................................... 38
3.3.1 Honduras ....................................................................................................................................... 39
4. CLEAN ENERGY FINANCING ...........................................................................................41
4.1 Current Clean Energy Lending ................................................................................................................ 41
4.1.1 Bank Lending ................................................................................................................................. 41 4.1.2 Specialized and non-specialized funds ...................................................................................... 43
4.1.3 Green Microfinance ..................................................................................................................... 44
4.2 Financing Instruments ................................................................................................................................. 45
4.1 Market Activity by Resource Type ......................................................................................................... 48
4.1.1 Wind ............................................................................................................................................... 48
4.1.2 On-Grid Photovoltaics ................................................................................................................ 52
4.1.3 Geothermal ................................................................................................................................... 53
4.1.4 Biofuels/Biomass ........................................................................................................................... 57

USAID CEADIR Project ECAM Clean Energy Financing and LEDS: Initial Status Report 5
5. BARRIERS AND RESPONSES ............................................................................................63
5.1 Barriers to Clean Energy Lending ........................................................................................................... 63
5.2 Donor Activity .................................................................................................................................................... 65
6. INITIAL NEEDS ASSESSMENT ISSUES ............................................................................71
6.1 Potential Interventions ............................................................................................................................... 72
6.2 Initial List of Organizations to Meet With During the Needs Assessment ................................... 74
REFERENCES ...............................................................................................................................76

USAID CEADIR Project ECAM Clean Energy Financing and LEDS: Initial Status Report 6
LIST OF TABLES Table 1. Public and Private Investments in CE in Central America, 2006-2013 .................................................. 9
Table 2. Installed Capacity and Net Generation in Central America, 2013 ....................................................... 13
Table 3. Potential Energy Efficiency Improvements in Central America, 2014–2025 ...................................... 18
Table 4. Comparison of Hydrocarbon Imports and Total Exports, 2012 .......................................................... 26
Table 5. Oil Import Expenditures and Share of GDP in Central America………………………………..26
Table 6. Energy Subsidies, 2008 .................................................................................................................................... 28
Table 7. Fiscal Incentives for Renewable Energy in El Salvador, Guatemala and Honduras ............................ 30
Table 8. National CE Plans' Goals and Targets in El Salvador, Guatemala, and Honduras……………….35
Table 9. Planned CE Projects in El Salvador (2014–2024) ...................................................................................... 37
Table 10. Planned Fossil Fuel and Large Hydro Electric Projects in Honduras (2014–2022) ......................... 40
Table 11. Top Project Finance Lenders by Country from 2000 to 2014 ............................................................ 43
Table 12. Green Microfinance in El Salvador, Guatemala, and Honduras, 2012 ................................................ 44
Table 13. Remaining Effective Potential of Renewable Resources in Central America, as of 2009 (GWh)48
Table 14. Geothermal Power Financing in El Salvador ............................................................................................ 54
Table 15. Geothermal Asset Financing in Guatemala .............................................................................................. 55
Table 16. Biomass and Biofuel Asset Financing in El Salvador ............................................................................... 58
Table 17. Biomass and Biofuel Asset Financing in Guatemala .....................................................................................60
Table 18. Biomass Asset Financing in Honduras ....................................................................................................... 62
Table 19. IADB Projects in El Salvador, Guatemala, and Honduras, in Preparation or Implementation ...67
Table 20. World Bank Active Projects in Honduras ................................................................................................ 70
USAID CEADIR Project ECAM Clean Energy Financing and LEDS: Initial Status Report vii
LIST OF FIGURES
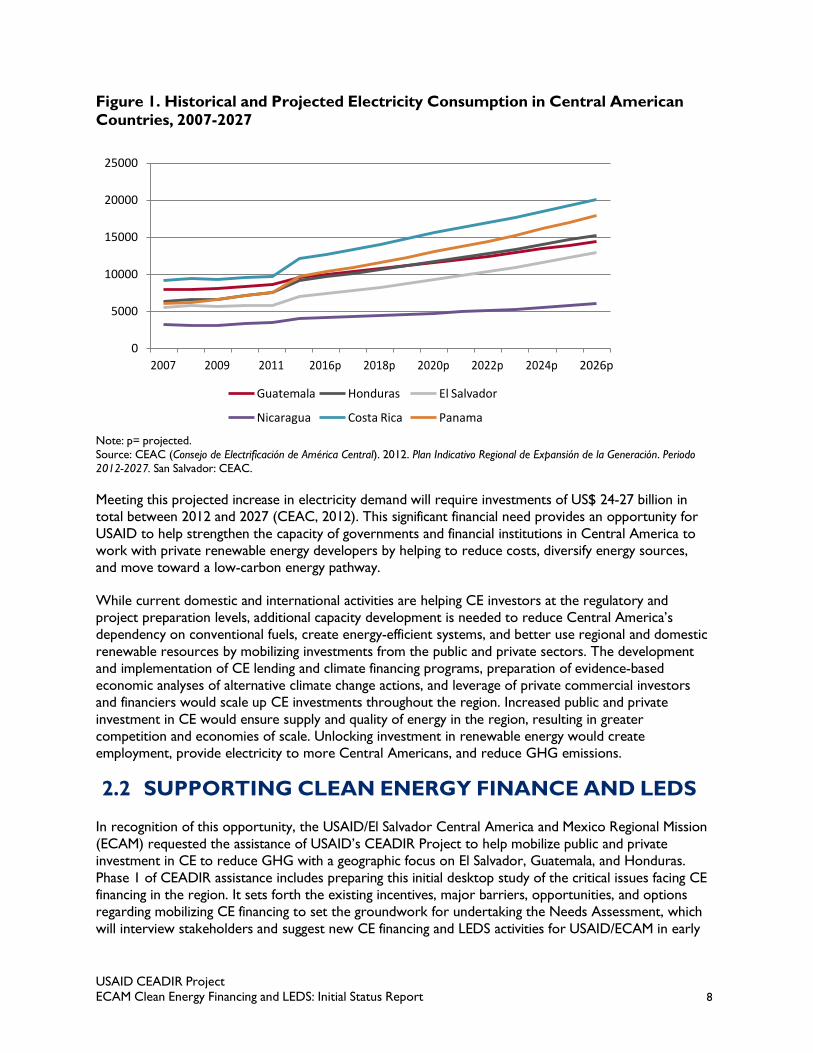
Figure 1. Historical and Projected Electricity Consumption in Central American Countries, 2007-2027 .. 8
Figure 2. Historic and Projected Electricity Demand Annual Growth Rates in El Salvador ........................... 14
Figure 3. Guatemala Energy Consumption, 2012 ..................................................................................................... 14
Figure 4. Electricity Consumption in Guatemala, 1986–2027 ................................................................................ 15
Figure 5. Honduras Energy Consumption, 2009 ....................................................................................................... 16
Figure 6. Estimated Total Demand in Honduras (2014–2027) .............................................................................. 16
Figure 7. Abatement Cost Curve for Mexico's Energy Efficiency Program ........................................................ 19
Figure 8. Electricity End-Use Structure for the Residential Sector, Selected Latin American Cities ............ 20
Figure 9. Total Electricity Losses as a Share of Total Generation ........................................................................ 25
Figure 10. Types of Petroleum Products Consumed in Central America, 1980–2020................................... 29
Figure 11. Total Consumption of Petroleum Products in Central America, by Country, 1980–2020 ........ 29
Figure 12. Energy Security in and Central America and the Caribbean............................................................... 32
Figure 13. Origin of Total Hydrocarbon Imports in El Salvador, 2012 ................................................................ 32
Figure 14. Origin of Total Hydrocarbon Imports in Guatemala, 2012 ................................................................ 33
Figure 15. Origin of Total Hydrocarbon Imports in Honduras, 2012.................................................................. 33
Figure 16. Anticipated Electric Power Generation Sources in El Salvador in 2018 .......................................... 38
Figure 17. Guatemala's Electricity Generation Matrix, 2007, 2012, and 2027 ................................................... 39
Figure 18. Top 10 Clean Energy Financiers in Central America, 2008–2014 (US$ Million) ........................... 42
Figure 19. Mexico and Central America Wind Installation Forecast, 2008–2020 (in MW)............................ 49
Figure 20. Wind Potential Sites in El Salvador ........................................................................................................... 50
USAID CEADIR Project ECAM Clean Energy Financing and LEDS: Initial Status Report 8
ACRONYMS ARECA Accelerating Renewable Energy in Central America
BANDESAL Banco de Desarrollo de El Salvador (El Salvador Development Bank)
BCIE Banco Centroamericano de Integración Económica (Central American Bank for
Economic Integration Bank)
BIO Belgian Investment Company for Developing Countries
BNEF Bloomberg New Energy Finance
CAF Banco de Desarrollo de América Latina (Development Bank of Latin America)
CAFCEF Central American Forum for Clean Energy Financing
CAREC Central American Renewable Energy and Cleaner Production Facility
CASEIF II Central American Small Enterprise Investment Fund II
CDCF Community Development Carbon Fund
CE Clean energy
CEADIR Climate Economic Analysis for Development, Investment, and Resilience
CEAC Consejo de Electrificación de América Central (Central American Electrification
Council)
CEL Comisión Ejecutiva Hidroeléctrica Río Lempa (El Salvador Hydroelectric Executive
Committee for the Lempa River)
CEPAL Comisión Económica para América Latina y el Caribe (Economic Commission for Latin
America and the Caribbean)
CIM Construction, installation, and manufacturing
CNE Consejo Nacional de Energía de El Salvador (El Salvador National Energy Council)
CNEE Comisión Nacional de Energía Eléctrica (National Commission of Electricity of
Guatemala)
CNPML Centro Nacional de Producción Más Limpia de El Salvador (El Salvador National
Center for Cleaner Production)
CO2 Carbon dioxide
CONEE Consejo de Eficiencia Energética de Guatemala (Guatemala Energy Efficiency Council)
DCA USAID Development Credit Authority
ECAM USAID/El Salvador Central America and Mexico Regional Mission
EE Energy efficiency
ENEE Empresa Nacional de Energía Eléctrica de Honduras (Honduras National Electric
Energy Utility)
Finnfund Finnish Development Finance Company
FOMIN Fondo Multilateral de Inversiones (Multilateral Investment Fund)

USAID CEADIR Project ECAM Clean Energy Financing and LEDS: Initial Status Report 9
FONDEPRO Fondo de Desarrollo Productivo (El Salvador Production Development Fund)
GCC Global climate change
GDP Gross domestic product
GHG Greenhouse gas
GIZ Gesellschaft für Internationale Zusammenarbeit (German Agency for International
Development)
GWh Gigawatt-hour
IADB Inter-American Development Bank
INDE Instituto Nacional de Electrificación de Guatemala (National Electrification Institute of
Guatemala)
JICA Japanese International Cooperation Agency
KfW Kreditanstalt für Wiederaufbau Entwicklungsbank (German development bank)
KW Kilowatt
LNG Liquefied natural gas
MEM Ministerio de Energía y Minas de Guatemala (Guatemala’s Ministry of Energy and
Mines)
MIF IADB’s Multilateral Investment Fund
MW Megawatt
Norfund Norwegian Investment Fund for Development
NREL National Renewable Energy Laboratory of the United States
O&M Operation and maintenance
OAS Organization of American States
OLADE Organización Latinoamericana de Energía (Latin American Energy Organization)
PFAN Private Financing Advisory Network
PIEE Plan Integral de Eficiencia Energética (Guatemala Energy Efficiency Plan)
PPA Power purchase agreement
PRONASE Programa Nacional Para el Aprovechamiento Sustenable de la Energía (Sustainable
Energy National Program)
PV Photovoltaic
RCEI Regional Clean Energy Initiative
RCEII Regional Clean Energy Investment Initiative
SERNA Secretaría de Recursos Naturales y Medio Ambiente de Honduras (Honduran
Secretariat of Natural Resources and Environment)
SICA Sistema de la Integración Centroamericana (Central American Integration System)
SIEPAC Sistema de Interconexión Eléctrica de los Países de América Central (Central American
Electrical Interconnection System)

USAID CEADIR Project ECAM Clean Energy Financing and LEDS: Initial Status Report 1
0
SME Small and medium enterprise
TWh Terawatt/hour
UNDP United Nations Development Programme
USAID United States Agency for International Development

USAID CEADIR Project ECAM Clean Energy Financing and LEDS: Initial Status Report 1
1
Acknowledgements
We would like to express our sincere thanks to our United States Agency for International
Development (USAID) managers for the Climate Economic Analysis for Development, Investment and
Resilience (CEADIR) project for their directions and leadership in preparing this report, which include
Jason Seuc (Economist, USAID/ECAM), Dr. Yoon Joo Lee (Economist, USAID EGEE/EP/E and
Contracting Officer’s Representative), Dr. Eric L. Hyman (Economist, USAID/E3/EP), Zephyr Taylor
(Clean Energy Advisor, USAID/E3/GCC), and Matthew Ogonowski (Global Climate Change Specialist,
USAID/E3/GCC).
We also are grateful for all who have contributed to our understanding and reviewed previous versions
of this document, including Dr. Eric L. Hyman (Economist, USAID/E3/EP), Zephyr Taylor (Clean Energy
Advisor, USAID/E3/GCC), Dr. Marcy Trump, (CEADIR Chief of Party), Alan Miller (CEADIR Climate
Finance Technical Advisor), Maria E. Netto (Financial Institutions Lead Specialist, Inter-American
Development Bank), Dr. Todd Johnson (Lead Energy Specialist at the World Bank), Arnaldo Viera de
Carvalho (Senior Energy Specialist at the Energy Division of the Inter-American Development Bank),
David E. Rodgers (Senior Energy Specialist, Global Environment Facility), Pablo Torres (Analyst, Climate
Investment Funds, World Bank), Patrick Doyle (Senior Energy and Climate Change Specialist at Inter-
American Development Bank), and Francisco Acuña (CEO of InTrust Global Investments, LLC). Diane
Ferguson was the editor.

USAID CEADIR Project ECAM Clean Energy Financing and LEDS: Initial Status Report 1
1. EXECUTIVE SUMMARY The Climate Economic Analysis for Development, Investment and Resilience (CEADIR)
Project, funded by USAID, will prepare for, conduct, and develop recommendations from a Central
America regional Needs Assessment mission to assess the countries’ priorities and capabilities in Clean
Energy (CE) financing and Low Emission Development Strategies (LEDS) planning. The Needs
Assessment will identify and recommend to USAID, based on consultative in-country meetings, the high
priority activities requested by key stakeholders to help mobilize financing for CE (renewable and energy
efficiency) actions and LEDS planning with initial efforts focusing in El Salvador, Guatemala, and
Honduras.
1.1 STUDY PURPOSE
This desktop study reviews the state of CE markets and capacity of these countries’ financial institutions
for and barriers to scaling up of CE lending—especially by the commercial lending sector. In addition,
the report provides background information on the enabling environments and LEDS planning that
supports CE lending. It presents the major conclusions of this assessment and highlights areas for
further in-country review to be able to recommend areas for technical support from CEADIR. The in-
country Needs Assessment is to conduct interviews of key stakeholders to complement the desktop
analysis. After conducting interviews with local financial institutions and other stakeholders, we will have
a fuller understanding of the key barriers to CE lending and the work being done by other donors to
understand where CEADIR technical assistance provides value added to mobilizing CE financing and
enhancing LEDS planning.
1.2 CONCLUSIONS
The study provides an initial overview of the problem and issues in El Salvador, Guatemala and Honduras
(Section 2), a description of CE market trends and government goals (Section 3), the state of
CE financing by the commercial and public sectors (Section 4), an explanation of identified CE financing
barriers and donor responses (Section 5); and recommends issues to be addressed during the Needs
Assessment (Section 6). The initial analysis suggests the following set of trends, goals and conclusions,
which directly affect the mobilization and scaling of financing for CE mitigation actions and LEDS planning
in the three countries:
Excess Demand in Energy Markets May Lead to Higher Emissions
Large hydropower and fossil fuels dominate the electricity and liquid fuel use in all three countries.
Further trends to meet rapidly rising energy demand may increase fossil fuel use as large hydro
opportunities are maxed out and societal acceptance discouraged. Thus, El Salvador, Guatemala, and
Honduras may see rising greenhouse gas emissions from their energy sectors unless the rate of reliance
on CE exceeds a shift towards higher dependency on high-carbon fuels.
Other notable energy demand, fuel mix and greenhouse gas emission trends affecting the need for CE
financing and climate change impacts from the countries include

USAID CEADIR Project ECAM Clean Energy Financing and LEDS: Initial Status Report 2
Electricity and liquid fuel demand in Central America is expected to continue to increase
substantially over the next two decades (doubling or tripling based on the country);
The current reliance on hydropower may be eclipsed where fossil fuel imports are projected to
meet future demand; and
Honduras plans to add 1,100 MW in capacity from coal and bunker fuel, which will have
significant impact on future greenhouse gas emissions and energy security for the country.
State of Clean Energy Markets: Trends and Goals
While the use of CE is rising across these countries, there still is significant untapped potential for
increasing the use of renewable energy and implementing efficient energy systems. Table E.1 shows that,
except in Belize, public and private investments in CE from 2006 to 2013 remain in the low 20
percentiles of total generation for the three ECAM countries. Other trends involve the improvement of
the policy and regulatory enabling environments for promoting CE markets and financing over the past
decade, with the establishment of private power laws, CE purchase power agreements, feed-in tariffs,
and national targets/goals for renewable and energy efficiency generation.
Expansion of CE use, however, had tapered off during the past five years as economies contracted, and
barriers to entry and financing for CE still posed important hurdles. As such, renewable and especially
energy efficiency projects remain under-financed and underdeveloped by the local financing and
commercial sectors.
Table E.1. Public and Private Investments in CE in Central America, 2006-2013
Country
Total Clean Energy Investment, 2006-
2013
(US$ billion)
Installed Power
Capacity (GW)
Renewable Share
(%)
Cumulative (Total) Clean Energy Generation
(GWH)
Belize 0.19 0.16 56 308
Costa Rica 1.7 3 31 3952
El Salvador 0.24 2 22 1691
Guatemala 0.59 3 23 2031
Honduras 0.81 2 22 1196
Nicaragua 1.6 1 31 1442
Panama 1.3 2 8 685
Totals 6.43 13.16 - 11,305
Source: FOMIN and BNEF (Fondo Multilateral de Inversiones and Bloomberg New Energy Finance). 2013. Climascopio 2013. Nuevas Fronteras para las Inversiones en Energía de Bajas Emisiones de Carbono en América Latina y el Caribe. Washington, DC:
FOMIN.
The dominant sources of renewable energy installed capacity and net generation by country are
provided in Table E.2 below.

USAID CEADIR Project ECAM Clean Energy Financing and LEDS: Initial Status Report 3
Table E.2. Installed Capacity and Net Generation in Central America, 2013
Country
Total
Hydro
Geo-
thermal
Wind
Cogen-
eration
Solar
Biogas
Thermal
Installed Capacity (MW) Central America
12,798.0 5,380.2 625.6 416.7 983.5 1.0 10.1 5,381.0
Costa Rica 2,731.2 1,725.3 217.5 148.1 40.0 1.0 3.7 595.7
El Salvador 1,562.6 486.8 204.4 0 110.0 n.a. 6.4 755.0
Guatemala 2,968.4 996.6 49.2 0 594.2 n.a. n.a. 1,328.4
Honduras 1,747.9 558.0 0 102.0 105.5 n.a. n.a. 982.4
Nicaragua 1,271.7 119.7 154.5 146.6 133.8 n.a. n.a. 717.1
Panama 2,516.2 1,493.8 0.0 20.0 n.a. n.a. n.a. 1,002.4
Net Generation (GWh) Central America
45,735.3 21,671.5 3,778.7 1 351.4
2,291.1 1.4 20.0 16,621.1
Costa Rica 10,136.1 6,851.0 1,516.7 484.6 86.3 1.4 0 1,196.0
El Salvador 5,895.5 1,848.4 1,442.3 0 229.5 n.a. 20.0 2,355.3
Guatemala 9,270.6 4,630.8 212.3 0 1,520.5 n.a. n.a. 2,906.9
Honduras 7,826.4 2,738.7 0 310.2 179.6 n.a. n.a. 4,597.9
Nicaragua 3,744.7 448.2 607.3 555.0 275.2 n.a. n.a. 1,858.9
Panama 8,862.0 5,154.3 0 1.6 n.a. n.a. n.a. 3,706.0
Source: CEPAL (Comisión Económica para América Latina y el Caribe). 2014. Centroamérica: Estadísticas de Producción del Subsector Eléctrico, 2013. Chile: CEPAL.
State of Clean Energy Financing
Finance is flowing into CE in all countries, but the total flows come mostly from outside or donor
sources of funding and represent a small portion of total existing or planned energy investments. The
multilateral development and international banks (MDBs) still provide the majority of CE financing.
These include KfW Entwicklungsbank (KfW) from Germany, the World Bank, and the Export-Import
Bank of the United States (table E.3). Regional and national development banks such as Banco
Centroamericano de Integración Económica (BCIE) and Banco de Desarrollo de El Salvador are amongst
the top CE lenders. The CE lending activity recorded in public documents and by Bloomberg New
Energy Finance (BNEF) from private sector banks includes Banco Agromercantil de Guatemala
Honduras, Banco Lafise Honduras, Banco Finnaciera commercial Hondurena, and Banco Atlantida.
With increasing capacity development, commercial banks in-country can help to fill future CE
investment needs to match and perhaps eventually exceed the outsized role currently played by MDBs,
regional and national banks. An increasing role for local or regional banks appears important if
sustainable CE financing industries are to evolve.

USAID CEADIR Project ECAM Clean Energy Financing and LEDS: Initial Status Report 4
Table E.3. Top Clean Energy Project Finance Lenders by Country 2000 to 2014
Country Project Finance Lenders Total Lending (US $ million)
Percentage of funding by country
El Salvador KfW Entwicklungsbank 22.17 49.00
Central American Bank for Economic Integration 14.93 33.00
Banco de Desarrollo de El Salvador 8.14 18.00
Guatemala Clipper Acquisitions Corp. 42.00 31.17
The World Bank Group 27.00 20.04
Central American Bank for Economic Integration 21.90 16.25
G&T Continental 16.90 12.54
Banco Agromercantil de Guatemala SA 16.90 12.54
KfW Entwicklungsbank 10.03 7.45
Honduras The World Bank Group 184.08 27.39
Central American Bank for Economic Integration 165.50 24.63
Export-Import Bank of the United States 158.80 23.63
Nederlandse Financierings Maatschappij voor Ontwikkelingslanden NV
135.63 20.18
OPEC Fund for International Development 14.59 2.17
EMP Global LLC 8.13 1.21
Banco Lafise Honduras SA 2.63 0.39
Banco Financiera Comercial Hondurena SA 2.63 0.39
Source: Alves, Lilian, Associate, Latin America, BNEF (Bloomberg New Energy Finance). January 5, 2015, private communication with Gwendolyn Andersen, Abt Associates, January 5, 2015
Barriers and Responses to Clean Energy Financing
The key barriers to scaling up CE financing from the commercial lending industry are
Lack of direct encouragement, involvement, understanding, and commitment of the private
commercial lending industry to CE financing;
Limited credit product options and systems at private banks for marketing and financing of CE; Limited data on CE market size and profitable investment opportunities and data on wind or
small hydropower resource;
Public-private partnerships for scoping renewable resource potential can bolster joint
development efforts such as tendering of renewable electricity capacity;
Lack of capacity for developing integrated technical solutions;
Time-consuming procedures; Insufficient regulatory frameworks to promote the introduction of renewable energy sources
that require relatively high initial investment costs;
Inadequate capacity in research, public awareness, and the private sector;
Legal and financial frameworks that may be inadequate to accomplish CE targets;
Small market size; and
Electricity markets designed for fossil fuels.

USAID CEADIR Project ECAM Clean Energy Financing and LEDS: Initial Status Report 5
The MDBs and USAID are working to address such barriers, so the Needs Assessment should focus on
gathering financial institutions (FIs) perspectives on those that remain most critical to scaling up capital
flows over the short and intermediate terms.
1.3 RECOMMENDATIONS
In terms of mobilizing finance for CE, there are three key areas of concern. First, it is unclear when the
legislation promoting energy efficiency will be passed and how the financial markets will respond to the
opportunity. Energy efficiency is typically an area of missed opportunities. Second, the financing is largely
taking place without the participation of local banks, reducing the local benefits of CE investments and
displaying a dependence on external development institutions rather than an integrated, competitive
private market. Finally, it is unclear whether the increased investment in CE will be sufficient to meet the
projected increases in energy demand without continued effort by external donors, or whether these
countries will turn to fossil fuels for new capacity, increasing GHG emissions. Fortunately, there is
donor activity in each of these activities. An exception is in providing hands-on, direct technical
assistance and capacity development to local financial institutions.
Based on the findings of this initial review, we have identified the following areas that require further
investigation during the in-country needs assessment.
Clean Energy Financing Sector
Solicit input from senior and operational managers at local financial institutions on the perceived
advantages, risks, and opportunities associated with CE lending and their needs;
Determine the FIs’ lending requirements (loan size, sectors, maximum of minimum lending
criteria), lending processes, and credit product development path(s);
Assess existing successful and identify potential financial instruments that would scale-up and/or
reduce perceived risks of CE lending;
Analyze the perceived attitudes towards CE lending of the FIs about the current enabling
environments and explore recommendations for removal of any barriers;
Inquire about interest in lending to the geothermal sector;
Determine the short- versus long-term capitalization requirements, debt securitization, available
loan guarantees, participation with other FIs (impact investors, micro-financing institutions,
development banks) that help mitigate lending risks;
Perform a cursory market diagnostic of the capability of local financial institutions on CE lending;
based on an existing bank-capacity CE lending survey tool developed by Enclude Solutions, Ltd.;
Analyze and incorporate into interviews involvement of vulnerable populations (indigenous
people, women) financial institution outreach and CE lending programs; and
Interview national, regional, and international development bank representatives and
representatives of other actual or potential CE lenders to determine their current or planned
involvement in the market and with commercial lending institutions.
Clean Energy Financing and LEDS Enabling Environment
Discuss with USAID, host country governments, CE trade associations, project developers and
other CE market actors the current incentives and disincentives for increasing CE lending by the
commercial sectors;
Identify current and planned use of modeling for CE and LEDS planning at the national levels;

USAID CEADIR Project ECAM Clean Energy Financing and LEDS: Initial Status Report 6
Solicit recommendations for linking LEDS planning to CE financing from policy makers and
financiers to ensure compatibility of market signals with national climate change goals; and
Analyze the roles for vulnerable populations and women in local and national planning initiatives
and CE project development.
At the conclusion of the Needs Assessment, the CEADIR team will present options for technical
assistance in the form of knowledge dissemination, networking, and training to build capacity of financial
institutions for the purpose of facilitating the mobilization of private and public investment in CE in
Central America to reduce greenhouse gas (GHG) emissions.

USAID CEADIR Project ECAM Clean Energy Financing and LEDS: Initial Status Report 7
2. OVERVIEW This section summarizes the status of the energy and CE markets in El Salvador, Guatemala, and
Honduras as relevant for USAID to support the countries in mobilizing additional lending to renewables
and energy efficiency systems in the countries. The purpose is not an exhaustive analysis of the enabling
environments and energy needs or supplies, but rather to highlight relevant facts that affect current and
future lending to CE and the preparation of LEDS plans.
2.1 ENERGY SECTOR DRIVERS: DEMAND, AVAILABLE
CLEAN ENERGY, AND NEED FOR PRIVATE FINANCING
The Central American Electrification Council (CEAC), integrated by representatives from the
governments of Costa Rica, El Salvador, Guatemala, Honduras, Nicaragua, and Panama, projects a near
doubling of electricity consumption in the region from 42.5 TWh in 2005 to 82.8 TWh by 2025 (CEAC,
2012).1 Panama is projected to have the highest growth during this period, followed by El Salvador and
Costa Rica, as indicated in Figure 1. It should be noted that such projections estimate higher than
historical growth rates and assume several favorable developments, such as a growing regional electricity
market, energy integration with Colombia, and a rapid increase in access to electricity to the important
share of the population that does not have it (CEAC, 2012; BNEF, 2014).
The United Nations’ Comisión Económica para América Latina y el Caribe (Economic Commission for
Latin America and the Caribbean) (CEPAL) (2007) estimates that intermittent renewable energy, i.e.
resource that is not continuously available due to natural resource variations, such as wind and solar,
could contribute approximately 20 percent of total electricity consumption by 2020. About 17.5 percent
of industrial and commercial energy could be saved with efficiency measures (CEPAL, 2007). The United
States Government Enhancing Capacity for Low Emission Development Strategy (EC-LEDS) Initiative
signed Memoranda of Understanding for setting strategic partnerships with the governments of Costa
Rica and Guatemala to provide assistance enhancing their capacity to transition to low-carbon emission
development paths through displacing projected conventional fuel use with CE, defined in this document
as renewable energy and energy efficiency.
1 The source indicates that these projections were estimated using econometric and statistical methods, but does not provide
any additional methodological information.
USAID CEADIR Project ECAM Clean Energy Financing and LEDS: Initial Status Report 8
Figure 1. Historical and Projected Electricity Consumption in Central American
Countries, 2007-2027
25000
20000
15000
10000
5000
0
2007 2009 2011 2016p 2018p 2020p 2022p 2024p 2026p
Guatemala Honduras El Salvador
Nicaragua Costa Rica Panama
Note: p= projected.
Source: CEAC (Consejo de Electrificación de América Central). 2012. Plan Indicativo Regional de Expansión de la Generación. Periodo
2012-2027. San Salvador: CEAC.
Meeting this projected increase in electricity demand will require investments of US$ 24-27 billion in
total between 2012 and 2027 (CEAC, 2012). This significant financial need provides an opportunity for
USAID to help strengthen the capacity of governments and financial institutions in Central America to
work with private renewable energy developers by helping to reduce costs, diversify energy sources,
and move toward a low-carbon energy pathway.
While current domestic and international activities are helping CE investors at the regulatory and
project preparation levels, additional capacity development is needed to reduce Central America’s
dependency on conventional fuels, create energy-efficient systems, and better use regional and domestic
renewable resources by mobilizing investments from the public and private sectors. The development
and implementation of CE lending and climate financing programs, preparation of evidence-based
economic analyses of alternative climate change actions, and leverage of private commercial investors
and financiers would scale up CE investments throughout the region. Increased public and private
investment in CE would ensure supply and quality of energy in the region, resulting in greater
competition and economies of scale. Unlocking investment in renewable energy would create
employment, provide electricity to more Central Americans, and reduce GHG emissions.
2.2 SUPPORTING CLEAN ENERGY FINANCE AND LEDS
In recognition of this opportunity, the USAID/El Salvador Central America and Mexico Regional Mission
(ECAM) requested the assistance of USAID’s CEADIR Project to help mobilize public and private
investment in CE to reduce GHG with a geographic focus on El Salvador, Guatemala, and Honduras.
Phase 1 of CEADIR assistance includes preparing this initial desktop study of the critical issues facing CE
financing in the region. It sets forth the existing incentives, major barriers, opportunities, and options
regarding mobilizing CE financing to set the groundwork for undertaking the Needs Assessment, which
will interview stakeholders and suggest new CE financing and LEDS activities for USAID/ECAM in early

USAID CEADIR Project ECAM Clean Energy Financing and LEDS: Initial Status Report 9
2015. From Phase 1 will be a set of recommended and selected CE finance and LEDS support activities
for CEADIR. Phase 2 would implement the activities selected by USAID/ECAM.
2.3 ENCOURAGING CLEAN ENERGY FINANCING
In Central America, national energy policies and regulatory frameworks are in place, as well as a regional
sustainable energy strategy for 2020, including the diversification of energy sources and increased use of
renewable resources (Dolezal et al., 2013). Available energy expansion plans in El Salvador, Guatemala,
and Honduras suggest that the share of fossil-fired resources in new capacity additions will decrease
(USAID, 2010). El Salvador plans to reduce the contribution of fossil fuels in generation from 50 percent
in 2013 to 40 percent in 2018 (CNE, 2014). Guatemala plans to increase the share of electricity
generation from renewable sources from 50.6 percent in 2007 to 67 percent in 2027. By 2012, more
than 65 percent of electricity was already being generated from renewable sources (MEM, 2013). In
Honduras, the Generation Expansion Plan 2008-2022 contemplates a net increase in installed capacity of
around 1,980 MW, with 55 percent of which will be from renewable sources (ENEE, 2008). According
to USAID (2010:47), developments since 2008, as well as projects expected to reach completion in the
next few years anecdotally support “…the view that the long-term trend toward heavier reliance on
fossil fuel generation resources has slowed and begun to reverse itself, even if to a very limited degree
so far.” (USAID, 2010).
Table 1. Public and Private Investments in CE in Central America, 2006-2013 shows that investments
have been made in CE albeit not sufficient to meet unserved CE developer and electricity consumer
demand. (BNEF), 2014) National development banks (e.g., Banco de Desarrollo de El Salvador and Banco
Agromercantil de Guatemala SA), commercial banks (e.g., G&T Continental, Banco Lafise Hondura
s SA, Banco Financiera Comercial Hondurena SA, and Nederlandse Financierings Maatschappij Voor
Ontwikkelingslanden NV), and international lenders (Inter-American Development Bank (IADB),
International Finance Corporation, (IFC), Kreditanstalt fuer Wiederaufbau (KfW), Banco
Centroamericano de Integración Económica (BCEI), the World Bank, and the Export-Import Bank of the
United States) are also scaling up CE lending in the region.
Table 1. Public and Private Investments in CE in Central America, 2006-2013
Country
Total Clean Energy
Investment, 2006-
2013 (US$ B)
Installed Power
Capacity
(GW)
Renewable Share (%)
Total Clean Energy Generation
(GWh)
Belize 0.19 0.16 56 308
Costa Rica 1.7 3 31 3952
El Salvador 0.24 2 22 1691
Guatemala 0.59 3 23 2031
Honduras 0.81 2 22 1196
Nicaragua 1.6 1 31 1442
Panama 1.3 2 8 685
Totals 6.43 13.16 11,305
Source: FOMIN and BNEF (Fondo Multilateral de Inversiones and Bloomberg New Energy Finance). 2013. Climascopio 2013. Nuevas Fronteras para las Inversiones en Energía de Bajas Emisiones de Carbono en América Latina y el Caribe. Washington, DC:
FOMIN.

USAID CEADIR Project ECAM Clean Energy Financing and LEDS: Initial Status Report 10
However, energy intensity in Central America has decreased at an annual rate of only 0.43 percent,
trailing improvements in the global average of 1.2 percent. Energy efficiency interventions, including
reductions in electricity losses, could result in energy savings of 12,255 GWh by 2025, more than 15
percent of total demand in Central America (CEPAL, 2014b). These actions could result in cost savings
of close to US$ 1.5 billion for end users and reductions in carbon dioxide equivalent (CO2e) emissions
of 7.9 million tons CO2e per year. The IADB concluded that a US$ 550 million investment in energy
efficiency could eliminate the need to invest US$ 1.7 billion in 12 open-cycle, natural gas-fired electricity
generation facilities over 10 years. Nexant found that investing US$ 118 million in residential,
commercial, and industrial energy efficiency could reduce demand by 54 MW, (about 20 percent of
average annual load growth during 2005–2009) at an average incremental cost of US$ 0.03 per kWh
(USAID, 2010). Still despite the uptick in renewable energy use across all ECAM countries, some
important constraints to mobilizing financing appear:
Lack of direct encouragement, involvement, understanding, and commitment of the private
commercial lending industry to CE financing;
Minimal credit product options and systems at private banks for marketing to and financing of
CE, leading to the lack of transparent procedural and lending requirements for project
developers;
Limited CE data on market size and profitable options available to CE project developers, such
as lack of available resource data for wind or small hydroelectricity;
Lack of technical capacity by regulators, grid operators, and utilities for integrating technical
solutions, such as intermittent renewable energy, particularly through electricity trading;
Complicated and time-consuming procedures to obtain permits and licenses from the
appropriate authorities;
Regulatory processes that require relatively high initial investment costs by developers;
Inadequate research, education, and training of renewable energy professionals and lenders;
Legal and financial frameworks that may be inadequate to accomplish CE targets and ensure they
survive political transitions;
Relatively small CE market size that is curtailed by production caps on total electricity
generation to come from renewable energy projects as set by national utilities or national
energy councils;
Electricity markets and pricing designed for base-load fossil fuel use, putting intermittent
renewable energy at a competitive disadvantage;
Inadequate planning and support for geothermal energy combined with legal hurdles; and
Limited involvement of women entrepreneurs in CE lending and project development.
While there is room for strengthening of the legal and policy enabling environments, there appears to be
a need for greater involvement of and commitment by the private lenders, equity investors, and project
developers to take advantage of CE opportunities.
2.4 OPPORTUNITIES FOR ASSISTANCE
Potential CE financing and LEDS interventions for ECAM include: Direct involvement of commercial lenders in understanding the market opportunities for and
credit development needs of the CE markets;

USAID CEADIR Project ECAM Clean Energy Financing and LEDS: Initial Status Report 11
Capacity development tailored to commercial and potentially national development banks’ and
project developers’ needs to mobilize lending to this emerging CE market;
Information dissemination of CE market assessments to build a publicly available internet
accessible repository of existing CE markets, including resource assessments;
Market assessments for financial institutions to assess capabilities and develop products for CE
lending;
Establishment or expansion of use of the USAID Development Credit Authority (DCA) loan
guarantees;
Roll out the USAID Clean Energy Lending Toolkit to interested lending institutions;
Development of a CE investor guide with project, financial lender, and bankable policy needs
toolbox;
Facilitate training for integrated clean technical solutions, including modeling that integrates
LEDS economic analysis, energy, and emissions;
Facilitate bank access to USAID/DCA loan guarantees for CE; and
Support the establishment of monitoring and evaluation frameworks to assess the progress of El
Salvador, Guatemala, and Honduras in meeting the ambitious energy policy goals they have
established.
2.5 IMPLICATIONS FOR NEEDS ASSESSMENT
The desktop study investigated publicly available information and narrowed the scope of the
investigation during the Needs Assessment trip. The literature indicates the need for increased capacity
in electricity generation and the potential for cost-effective energy savings. There is potential for
expanding production from renewable resources. Significant improvements to the enabling environment
have occurred or are underway, as evidenced by the pipeline of renewable energy projects.
CEADIR proposes to conduct interviews with local financial institutions, local project developers,
professors in higher education institutions, and some members of government ministries and civil
society organizations during field visits to El Salvador, Guatemala, and Honduras. The team proposes to
investigate the capability of local financial institutions for CE lending, learn their perspectives on the risks
and opportunities involved in this market, and explore financial instruments that would reduce the
perceived risks of CE lending.
Our literature review found very little information on gender representation in policy making,
regulation, financial institutions, and project developers, as well as little evidence regarding the impact
such representation has on outcomes. In addition, our literature review found very little information
regarding the use of modeling for energy and LEDS policy setting.
The Needs Assessment will thus focus primarily on the experience, perspectives, and capabilities of local
financial institutions with the purpose of developing recommendations for USAID ECAM for activities
that will help scale up CE finance in a manner that complements rather than duplicates efforts of other
projects and donors.

USAID CEADIR Project ECAM Clean Energy Financing and LEDS: Initial Status Report 12
3. CLEAN ENERGY TRENDS AND
GOALS This section focuses on major trends and country goals for CE in El Salvador, Guatemala, and Honduras
along with the important co-benefits that can accompany a transition to CE. In electricity, trends include
rapid declines in the prices of photovoltaic and wind technologies, increasing demand for electricity, and
opportunities for energy efficiency. Petroleum trends include increasing demand and opportunities to
substitute CE. The co-benefit discussion includes energy security, health, job creation, and impacts on
gender and vulnerable populations.
3.1 TRENDS
3.1.1 DECLINES IN PRICES FOR RENEWABLE ENERGY
A recent World Bank study on Central America found that some renewables are more cost competitive
than fossil fuel energy sources for the generation of electricity. The levelized cost of energy was US$
0.05-0.089/KWh for geothermal power and US$ 0.07-0.08/KWh for hydropower. The LCOE was US$
0.12-0.15/KWh for heavy fuel oil and US$ 0.10-0.11/KWh for coal-powered generation (Dolezal, et al.,
2013).
The LCOE for geothermal US$ 0.072-0.089/KWh (with capital costs of US$ 4,000-5,000/kW) and US$
0.05-0.06/KWh at a capital cost of US$ 2,500/kW, (World Bank, 2012). Baseload hydroelectric power in
the region cost US$ 0.07-0.08/KWh (at a capital cost of US$ 2,500/kW, which may be overly optimistic
since some recent large-scale plants had a capital cost of $4,000/kW).
3.1.2 INCREASING DEMAND FOR ELECTRICITY
Member countries of [Sistema de la Integración Centroamericana (Central American Integration System)
(SICA) developed the Central American Sustainable Energy Strategy 2020 with support from the
CEPAL. 2 3 The strategy estimates that regional energy demand will increase from 34,504 GWh in
2006 to 67,467 GWh in 2020. In turn, power demand will almost double from 34 TWh in 2005 to 67
TWh in 2020.4 Meeting this growing demand would require augmenting installed capacity by 6,000–7,000
MW, with investments of US$ 12–18 billion, of which US$ 11–14 billion would be needed to expand
electricity generation (CEPAL, 2007). More recent estimates by CEAC (2012) project a near doubling of
electricity consumption in the region from 42.5 TWh in 2011 to 82.8 TWh by 2025. Meeting this
projected increase in electricity consumption will require investments of US$ 24-27 billion in total
between 2012 and 2027 (CEAC, 2012).
2 The member countries of SICA are Belize, Costa Rica, El Salvador, Guatemala, Honduras, Nicaragua, Panama, and the
Dominican Republic.
3 CEPAL, 2007
4 These figures correspond to the medium-growth scenario in the strategy.

USAID CEADIR Project ECAM Clean Energy Financing and LEDS: Initial Status Report 13
Some of the primary goals that the strategy aims to meet by 2020 are to increase the share of
renewables in regional electricity generation by 11 percent; reduce from 16.2 percent to 12 percent or
less the losses from the countries’ electric systems; decrease by at least 10 percent the consumption of
fossil fuels in the transport sector, which amounted to about 47 million barrels of oil in 2006; and
reduce by 20 percent the region’s GHG emissions relative to a baseline scenario, which is equivalent to
a reduction of about 24 MtCO2eq (CEPAL, 2007).
Despite having significant renewable energy resources, Central American countries obtain an important
share of the energy they consume from imported fossil fuels and fuelwood. Thermal power contributes
48 percent, 45 percent, and 56 percent of the installed electric generation capacity in El Salvador,
Guatemala, and Honduras, respectively. In 1990, hydropower resources represented 66 percent of the
total installed generation capacity, while thermal made up about 30 percent. Between1990 and 2013 the
use of fossil fuels increased (Table 2).
Table 2. Installed Capacity and Net Generation in Central America, 2013
Location
Total
Hydro
Geo-
thermal
Wind
Cogen-
eration
Solar
Biogas
Thermal
Installed (MW)
Central America
12,798.0 5,380.2 625.6 416.7 983.5 1.0 10.1 5,381.0
Costa Rica 2,731.2 1,725.3 217.5 148.1 40.0 1.0 3.7 595.7
El Salvador 1,562.6 486.8 204.4 0 110.0 n.a. 6.4 755.0
Guatemala 2,968.4 996.6 49.2 0 594.2 n.a. n.a. 1,328.4
Honduras 1,747.9 558.0 0 102.0 105.5 n.a. n.a. 982.4
Nicaragua 1,271.7 119.7 154.5 146.6 133.8 n.a. n.a. 717.1
Panama 2,516.2 1,493.8 0.0 20.0 n.a. n.a. n.a. 1,002.4
Net Generation (GWh)
Central America
45,735.3 21,671.5 3,778.7 1,351.4 2,291.1 1.4 20.0 16,621.1
Costa Rica 10,136.1 6 851.0 1,516.7 484.6 86.3 1.4 0 1,196.0
El Salvador 5,895.5 1,848.4 1,442.3 0 229.5 n.a. 20.0 2,355.3
Guatemala 9,270.6 4,630.8 212.3 0 1,520.5 n.a. n.a. 2,906.9
Honduras 7,826.4 2,738.7 0 310.2 179.6 n.a. n.a. 4,597.9
Nicaragua 3,744.7 448.2 607.3 555.0 275.2 n.a. n.a. 1,858.9
Panama 8,862.0 5,154.3 0 1.6 n.a. n.a. n.a. 3,706.0
Source: CEPAL (Comisión Económica para América Latina y el Caribe). 2014. Centroamérica: Estadísticas de Producción del Subsector Eléctrico, 2013. Chile: CEPAL.
In El Salvador, the Consejo Nacional de Energía (National Energy Council) (CNE) estimates that
electricity demand will grow at an average annual rate of 3.6 percent during 2011–2024 (CNE, 2010). As
a result, power demand would increase from 5,983 GWh in 2013 to 8,853.3 GWh in 2024. Figure 2
shows that the estimated rate is close to the average annual growth rate of 3.5 percent observed
between 2000 and 2013, although annual fluctuations ranged from -2.1 percent to 9.2 percent (CNE,
2014).

USAID CEADIR Project ECAM Clean Energy Financing and LEDS: Initial Status Report 14
Figure 2. Historic and Projected Electricity Demand Annual Growth Rates in El
Salvador
Source: CNE (Consejo Nacional de Energía, El Salvador). 2014. Plan Indicativo de la Expansión de la Generación Eléctrica de El Salvador 2014–2024. San Salvador: CNE.
Electricity consumption in El Salvador is also likely to grow to serve the approximately 100,000 families,
or 7.8 percent of the population, who still lack access to electricity in El Salvador. These are mostly
located in rural areas, which have 79 percent coverage, compared with 97 percent in urban areas.
Electricity coverage varies widely by department, from 63.8 percent in Ahuachapán to 83.5 percent in
Santa Ana. The electrification strategy for rural areas of the Government of El Salvador emphasizes
complementary connections to existing grids and the establishment of off-grid solar systems (CNE,
2010). About 27 percent of Salvadoran households use fuelwood for cooking, which provides around 31
percent of the total energy use in the country (Dolezal et al., 2013).
In Guatemala, electricity represents 9.5 percent of total energy consumption. Approximately, 51.4
percent of electricity is provided by large hydro and 12.23 percent from other renewables (biomass and
geothermal). Petroleum products, mostly for the transport sector, account for 33.66 percent, while the
remaining 56.84 percent consists of fuelwood (Figure 3).
Figure 3. Guatemala Energy Consumption, 2012
Fuelwood,
56.8%
Oil products,
33.7%
Hydro 51.4%
Bunker 24.2%
Electricity, 9.5%
Diesel
oil 0.2% Imports
3.9%
Geother -mal 2.8%
Biomass
9.4%
Coal 8.1%
Source: MEM [Ministerio de Energía y Minas (Ministry of Energy and Mines)]. 2013. Política Energética 2013–2027. Guatemala: MEM.

USAID CEADIR Project ECAM Clean Energy Financing and LEDS: Initial Status Report 15
Electricity consumption has grown at an average annual rate of 7 percent over the last 25 years, albeit at
a significantly lower rate between 2008 and 2012. The National Energy Policy 2013–2027 projects that
electricity demand will continue to grow 7 percent per year, to a total of 16,800 GWh in 2027. Meeting
this demand would require an installed capacity of approximately 3,000 MW (MEM, 2013) (Figure 4).
Figure 4. Electricity Consumption in Guatemala, 1986–2027
Source: MEM [Ministerio de Energía y Minas (Ministry of Energy and Mines)]. N.D. Estadísticas Energéticas Subsector Eléctrico 2013. Guatemala: MEM.
The electricity market is also likely to grow because of the high percent of the population that still does
not have access to electricity. At the national level, 89.5 percent of the population has access to
electricity. However, coverage varies markedly by region, from 44 percent in Alta Verapaz to 94 percent
in Zacapa (MEM, 2013).
In Honduras, fuelwood was also the main source of energy, representing 43 percent of energy
consumption in 2009. Petroleum products follow at 40 percent, and electricity 11 percent of total
energy consumption (Figure 5).

USAID CEADIR Project ECAM Clean Energy Financing and LEDS: Initial Status Report 16
Figure 5. Honduras Energy Consumption, 2009
Coal, 0.1%
Fuelwood, 42.8%
Oil Products,
39.5%
Biomass, 4.6%
Electricity, 11.0%
LNG, 2.0%
Cogenera- tion 5.7%
Hydro 32.7%
Thermal 61.6%
Sources: DGE (Dirección General de Energía). 2009. Balance Energético 2009. Tegucigalpa: DGE.; CEPAL (Comisión Económica para América Latina y el Caribe). 2014b. Energy Efficiency in Central America: Progress and Action Towards
the Fulfillment of the Goals of the Central American Sustainable Energy Strategy, 2013. Chile: CEPAL.
Empresa Nacional de Energía Eléctrica (ENEE), the Honduran national electric utility, projected that
total demand for electricity would grow at an annual growth rate of 5.67 percent in 2014, gradually
decreasing to 3.5 percent in 2028, with total projected consumption to of 2,400 MW in 2027 (Figure 6).
Figure 6. Estimated Total Demand in Honduras (2014–2027)
6%
5%
4%
3%
2%
1%
0%
2014 2015 2016 2017 2018 2019 2020 2021 2022 2023 2024 2025 2026 2027
Total Demand Annual Growth Rate
MW 3,000
2,500
2,000
1,500
1,000
500
0
Source: EENE (Empresa Nacional de Energía Eléctrica). 13 June 2014. Escenario Base Final Proyeccion de Demanda de Energía Eléctrica 2014-2028 Sistema Interconectado Nacional: ENEE. Accessed October 9, 2014, from
http://www.enee.hn/planificacion/2014/resumen%20proyeccion%20demanda%20honduras.pdf
Renewable energy generation in the Honduran grid decreased from 100 percent in 1990 to 36 percent
in 2006. The capacity for large hydroelectricity stayed constant and the gap was largely met with natural
gas, oil, diesel, and more recently coal.5 This is the sharpest reduction of any country in the region and
the current level of renewable energy penetration is the second lowest, only after Nicaragua. The
5 Alves, Lilian, Bloomberg New Energy Finance, Empresa Nacional de Energía Eléctrica, Latin American & Caribbean Installed
Capacity Database, August 15, 2013

USAID CEADIR Project ECAM Clean Energy Financing and LEDS: Initial Status Report 17
country’s supply–demand balance has typically been extremely tight, and this situation worsened in the
first half of the last decade because of delays in securing new supplies, which prompted emergency
measures and the introduction of diesel facilities. In recent years, Honduras has relied on imports to
meet load growth.
As recently as August 2014, Honduras experienced difficulties in meeting its electricity demand. Low
precipitation resulted in reduction of electricity generation by the Francisco Morazán hydroelectric plant
that supplies electricity to Tegucigalpa. As a result, a series of rationing measures were introduced.6 As
part of its strategy to cope with the energy shortage, Honduras is offering a feed-in tariff for solar power
plants that come online before August 2015 (Bloomberg New Energy Finance [BNEF], 2014).
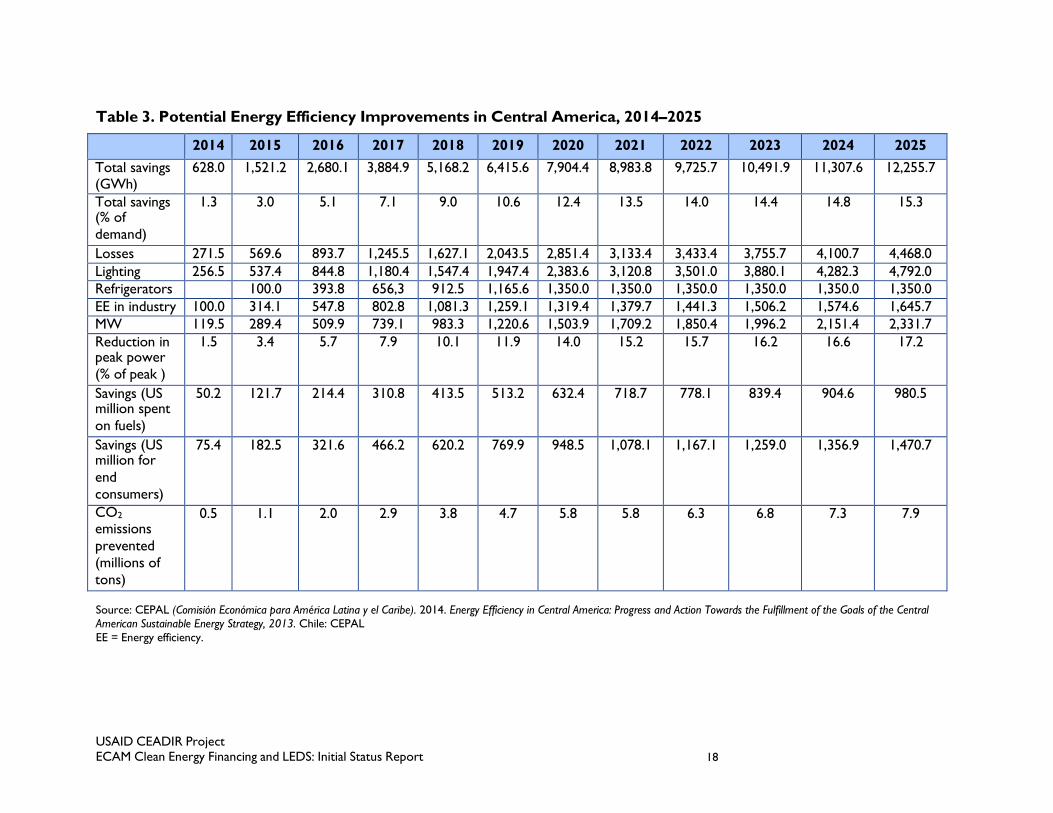
3.1.3 INCREASING ENERGY EFFICIENCY OPPORTUNITIES
CEPAL (2014b) estimates that the implementation of energy efficiency interventions, including
reductions in electricity losses, would result in energy savings of 12,255 GWh by 2025, over 15 percent
of total electricity demand in Central America by the end of the period. These actions would result in
savings of close to US$ 1.5 billion for end users and reductions in CO2 emissions of up to 7.9 million
tons (Table 3), assuming little to no direct or indirect rebound effects.
6 Uclés, 2014
USAID CEADIR Project ECAM Clean Energy Financing and LEDS: Initial Status Report 18
Table 3. Potential Energy Efficiency Improvements in Central America, 2014–2025
2014 2015 2016 2017 2018 2019 2020 2021 2022 2023 2024 2025
Total savings (GWh)
628.0 1,521.2 2,680.1 3,884.9 5,168.2 6,415.6 7,904.4 8,983.8 9,725.7 10,491.9 11,307.6 12,255.7
Total savings (% of
demand)
1.3 3.0 5.1 7.1 9.0 10.6 12.4 13.5 14.0 14.4 14.8 15.3
Losses 271.5 569.6 893.7 1,245.5 1,627.1 2,043.5 2,851.4 3,133.4 3,433.4 3,755.7 4,100.7 4,468.0
Lighting 256.5 537.4 844.8 1,180.4 1,547.4 1,947.4 2,383.6 3,120.8 3,501.0 3,880.1 4,282.3 4,792.0
Refrigerators 100.0 393.8 656,3 912.5 1,165.6 1,350.0 1,350.0 1,350.0 1,350.0 1,350.0 1,350.0
EE in industry 100.0 314.1 547.8 802.8 1,081.3 1,259.1 1,319.4 1,379.7 1,441.3 1,506.2 1,574.6 1,645.7
MW 119.5 289.4 509.9 739.1 983.3 1,220.6 1,503.9 1,709.2 1,850.4 1,996.2 2,151.4 2,331.7
Reduction in peak power
(% of peak )
1.5 3.4 5.7 7.9 10.1 11.9 14.0 15.2 15.7 16.2 16.6 17.2
Savings (US million spent
on fuels)
50.2 121.7 214.4 310.8 413.5 513.2 632.4 718.7 778.1 839.4 904.6 980.5
Savings (US million for
end
consumers)
75.4 182.5 321.6 466.2 620.2 769.9 948.5 1,078.1 1,167.1 1,259.0 1,356.9 1,470.7
CO2
emissions
prevented
(millions of
tons)
0.5 1.1 2.0 2.9 3.8 4.7 5.8 5.8 6.3 6.8 7.3 7.9
Source: CEPAL (Comisión Económica para América Latina y el Caribe). 2014. Energy Efficiency in Central America: Progress and Action Towards the Fulfillment of the Goals of the Central American Sustainable Energy Strategy, 2013. Chile: CEPAL
EE = Energy efficiency.

USAID CEADIR Project ECAM Clean Energy Financing and LEDS: Initial Status Report 19
The Inter-American Development Bank (IADB) concluded that US$ 550 million in energy efficiency
investments could eliminate the need to invest US$ 1.7 billion in new, natural gas-fired generation
facilities over 10 years. Separately, an analysis by Nexant finds that investing US$ 118 million in a
relatively small suite of residential, commercial, and industrial measures could produce annual savings in
electricity consumption of 276 GWh, about 25 percent of average annual growth in sales. These
investments could also reduce demand by some 54 MW, about 20 percent of average annual load
growth during 2005–2009, at an average incremental cost of US$ 0.03 per kWh (USAID, 2010).
Other studies have found that energy efficiency measures can have negative costs. For example, the
Programa Nacional Para el Aprovechamiento Sustenable de la Energía (PRONASE) program in Mexico in
2009 found that energy efficiency measures in lighting could save US$ 60/MWh and replacing domestic
appliances and electronics with more efficient models could save US$ 55/megawatt hour (Figure 7.
Abatement Cost Curve for Mexico's Energy Efficiency Program). Food refrigeration consumes the
largest share of electricity in homes in many Latin American cities, likely constituting a large area of
opportunity for CE financing (Figure 8).
Figure 7. Abatement Cost Curve for Mexico's Energy Efficiency Program
Source: Published on November 27, 2009, http://cgservicios.df.gob.mx/prontuario/vigente/2504.htm

USAID CEADIR Project ECAM Clean Energy Financing and LEDS: Initial Status Report 20
Figure 8. Electricity End-Use Structure for the Residential Sector, Selected Latin
American Cities
Several assessments conducted to date, including those that informed the development of energy
efficiency bills in El Salvador, Guatemala, and Honduras, find that energy efficiency programs have
untapped potential that could result in 5-10 percent savings of fuel in the transport sector and
reductions in electricity losses from 27-12 percent to 10-12 percent (CEPAL, 2014b).7 Each of these
countries has taken important steps to articulate a national policy on energy efficiency, proposed bills
that would provide the legal underpinnings to energy efficiency programs, and initiated several
assessments and pilot activities. Yet the actual implementation of a coherent regulatory framework has
occurred only in Costa Rica. In El Salvador, Guatemala, and Honduras, energy efficiency laws are yet to
be approved by the national congresses. Development of a regional energy efficiency policy and program
framework has been more limited than activities undertaken at the national level (USAID, 2010). Largely
as a result of this lack of progress in the adoption of a coherent regulatory framework for energy
efficiency, Central America’s energy intensity, defined as energy used per unit of GDP, has fallen at an
annual rate of only 0.43 percent, compared with a global average of 1.2 percent.8
Progress has been even slower in increasing energy efficiency in transportation, which constituted over
half of total consumption of refined petroleum products in the region. Efforts to reduce fuel
consumption in transportation could have considerable environmental benefits. Fuel consumption
generates a number of health damaging pollutants, including fine particulate matter. As of 2010, 33
percent of the population in El Salvador 84 percent of the population in Guatemala, and 40 percent of
the population in Honduras is estimated to be exposed to levels of particulate matter that exceeded the
World Health Organization guidelines.9 Reduction in fuel consumption would also result in
7 CEAC (Consejo de Electrificación de América Central (2007), Plan Indicativo Regional de Expansión de la Generación,
período 2006-2020.
CEAC (2005), Plan Indicativo Regional de Expansión de la Generación, período 2005-2019, abril.
8 Personal email communication, Arnaldo Vierira de Carvalho, Lead Energy Specialist, Energy Division, IDB, June 25, 2014
9 Data from databank.worldbank.org. Accessed on January 11, 2015.

USAID CEADIR Project ECAM Clean Energy Financing and LEDS: Initial Status Report 21
macroeconomic benefits, as El Salvador, Guatemala, and Honduras spend 0.75, 0.72, and 0.43 percent,
respectively, of GDP in oil subsidies and significant foreign currency in oil imports, as discussed in
section 3.3.1 below (IMF, 2013). Environmental efforts to date in this area have largely focused on
studies of potential strategies for inducing changes in patterns of vehicle use, public transportation
systems, and the fuel efficiency or fuel substitution for motor vehicles (USAID, 2010).
Costa Rica and Panama have energy efficiency legislation in place, while El Salvador, Guatemala,
Honduras, and Nicaragua have energy efficiency bills as of January 2015.
In El Salvador, in March 2014, the Ministry of Economy and CNE presented an Energy Efficiency Bill to
the National Congress (Anteproyecto de Ley de Eficiencia Energética), which is currently under discussion
and awaiting approval. The bill’s main objectives are to:
Provide legal support and increase the sustainability of actions aimed at energy efficiency.
Empower CNE to promote, coordinate, and implement activities in the area of energy efficiency.
Encourage energy management in productive sectors through voluntary and mandatory
instruments, including education, promotion, and dissemination of energy efficiency.
Establish the public sector’s Committees on Energy Efficiency in State Institutions to formulate
and implement energy efficiency plans.
Prepare studies in the private sector to identify priority areas for action and the goals, time, and
resources needed for the execution of energy savings plans.
Incorporate energy efficiency in the appropriate educational programs and curricula. 10
This bill was developed with technical and financial support from the IADB and Gesellschaft für
Internationale Zusammenarbeit (German Agency for International Development, GIZ).
Despite the absence of effective energy efficiency legislation, a Department of Energy Efficiency was
recently created within CNE, further emphasizing the importance that the organization is placing on its
energy efficiency programs. The Department has five staff members who work exclusively on El
Salvador’s energy efficiency programs, funded through regular CNE budgets and contributions from
international donors.
Ongoing energy efficiency programs in El Salvador include the following:
The El Salvador Production Development Fund (FONDEPRO). This fund, created by the
Ministry of Economy, aims to improve the productivity and competitiveness of micro and small and
medium enterprises (SMEs) operating in El Salvador, through grants, cofinancing of projects, and
technical assistance to improve their productivity and processes. FONDEPRO supports energy
efficiency activities in industry through its Cleaner Production Fund, financing initiatives that are
environmentally friendly or that improve energy efficiency. Through credit lines, FONDEPRO supports
micro-enterprises and SMEs in implementing energy efficiency in their respective industries.
Centro Nacional de Producción Más Limpia (CNPML) began operations in 1998 with
financing from the Swiss Government and support from the United Nations Industrial
Development Organization. CNPML works with firms, including small enterprises, in El Salvador
to promote cleaner production and sustainable development. It provides consulting, financing,
10 http://www.minec.gob.sv/index.php?option=com_content&view=article&id=2575:presentan-anteproyecto-de-ley-de-
eficiencia-energetica&catid=1:noticias-ciudadano&Itemid=77.
USAID CEADIR Project ECAM Clean Energy Financing and LEDS: Initial Status Report 22
and training in energy efficiency, renewable energy, and related areas. CNPML has launched
projects for SMEs providing energy audits and technical assistance.
The Asociación Salvadoreña de Industriales has created a program called Aprender Haciendo
that delivers high-level training to professionals from industries so that they can identify and
implement energy efficiency opportunities. It developed a tool for appraisal of energy efficiency
investment, in conjunction with the Greenmax Corporation with the support of the United
Nations Development Program (UNDP). This tool includes modules for project developers and
financial institutions.
El Salvador Ahorra Energía. This program launched in El Salvador in 2011 and coordinated
by CNE involves more than 20 organizations, including international donors, universities,
governmental bodies, development banks, and business chambers, that promote energy
efficiency in different sectors of society.11 The program was a result of the Energy Efficiency
Program for Latin America and the Caribbean, which was implemented by the Organización
Latinoamericana de Energía (OLADE). The program’s goal is to promote a culture of energy
efficiency among its citizens. Capacity-building efforts aim to enable industries and other
commercial and public entities in the country to incorporate energy efficiency measures in their
activities and processes.
Comités de Eficiencia Energética en el Sector Público (Energy Efficiency Committees in
the Public Sector) have been created in different public sector departments to reduce energy
consumption. The CNE has calculated that energy consumption in the public sector was
approximately 146 GWh in 2009 at a cost of approximately US$ 20.9 million. Members of the
committees receive energy efficiency training from CNE.
Energy Efficiency in Government Buildings. UNDP and CNE launched this three-year
project project in 2011 to reduce public sector energy consumption with funding from the
Global Environment Facility. According to CNE, the potential energy savings identified in
different public sector entities would result in a 23 percent reduction in energy consumption.
Energy audits conducted in 10 hospitals identified potential energy savings of more than US$
500,000. As of the end of 2014 only a few projects had been implemented. MARN reported a
10 percent saving in energy consumption as a result of installing more efficient lightning in its
main building, while the Defensoría del Consumidor office (Consumer Protection Attorney’s)
achieved 63 percent in energy savings with a similar project.12
Financing Program by Banco de Desarrollo de El Salvador (El Salvador Development
Bank, BANDESAL). The first phase of the financing program was launched in 2006 with a budget
of US$ 10 million, and the second phase in 2009 with a budget of US$ 27 million. The program
also has a Technical Assistance Fund of US$ 800,000 for energy audits and studies. Following
Phases I and II, approximately US$ 20 million in credit was made available to local companies,
and approximately US$ 300,000 was disbursed from the Technical Assistance Fund between
2007 and 2011. 13 In October 2014, BANDESAL and the German Development Bank (KFW) a
new US$ 130 million program to finance energy efficiency and alternative energy investments in
micro, small, and medium enterprises. 14
11 For a list of participating agencies, see http://www.elsalvadorahorraenergia.com.sv/index.php/programa
12 http://www.elsalvadorahorraenergia.com.sv/index.php/casos-de-exito
13 This section is based on CEPAL (2014b).
14 http://www.elsalvador.com/mwedh/nota/nota_completa.asp?idCat=47861&idArt=9140716

USAID CEADIR Project ECAM Clean Energy Financing and LEDS: Initial Status Report 23
Guatemala’s draft Anteproyecto de Ley de Eficiencia Energética (Energy Efficiency Bill) awaits
congressional approval. It covers the following main areas:
Creation of CONEE [Consejo de Eficiencia Energética de Guatemala/Guatemala Energy
Efficiency Council] as a technical unit within the Ministry of Energy and Mines, with a dedicated
budget and administrative, financial, and functional autonomy. It would be responsible for
preparing and executing a National Energy Efficiency Plan, managing an Energy Efficiency Fund,
and developing and enforcing norms and standards associated with rational use of energy.
Development of a national energy efficiency plan for a 15-year period. The plan is to identify
opportunities for energy efficiency and investment needs and for developing short-, medium-,
and long-term energy efficiency programs. The plan would be reviewed at least every 5 years.
Creation of an Energy Efficiency Fund to finance programs, projects, and capacity development.
The Energy Efficiency Fund is expected to be financed with resources received from
international organizations, taxes on the sale of energy, and contributions from domestic
development programs.
Requirement for public and private energy companies involved in the distribution of electricity,
refined petroleum products, and gas to promote efficient use of energy among their customers
by educating them on industry best practices. Distribution companies would also be required to
measure, control, and reduce energy losses, including losses as a result of theft.
Requirement for public sector contracts for energy-intensive appliances and equipment to take
life cycle energy efficiency into account. CONEE would be responsible for implementing the
standards and.
Creation of a National Energy Efficiency Prize awarded by CONEE to individuals, companies, or
entities.
Ongoing energy efficiency programs in Guatemala include the following:
Plan Integral de Eficiencia Energética (PIEE, Guatemala Energy Efficiency Plan). Developed
by Comisión Nacional de Energía Eléctrica (CNEE, National Commission of Electricity) with
IADB funding of approximately US$ 750,000. The PIEE supported consulting services, pilot
projects, research, workshops, and capacity-building measures, aimed at strengthening
institutions and training individuals. A key outcome was the development of the draft Energy
Efficiency Bill in 2011. Nine energy efficiency pilot projects were implemented for commercial,
industrial, residential entities. The pilots had a total investment of around US$ 120,000, which
resulted in actual energy savings of around US$ 300,000 and 1.12 million kWh of electricity per
year (CNEE, 2012).
Energy efficiency campaigns. The Ministry of Energy and Mines and CNEE have launched
several energy-saving campaigns in the country through newspapers, television, and radio to
educate the public on the importance of using energy efficiently. In 2011, the communications
firm Ogilvy & Mather Publicidad S.A. was awarded a contract to create a public awareness
campaign on energy efficiency (CNEE, 2012).
Replacement of incandescent lamps. MEM and Instituto Nacional de Electrificación (INDE,
National Electrification Institute) implemented a pilot project in the municipality of Estor to
replace 2,640 75-watt incandescent bulbs with 15-watt compact fluorescent bulbs in 660 homes
that use 80 percent less electricity percent (CEPAL, 2009).
USAID CEADIR Project ECAM Clean Energy Financing and LEDS: Initial Status Report 24
Educational activities. The MEM and Ministry of Education prepared educational material for
primary school students to develop a culture of efficient energy use among students (CEPAL,
2009).
Modern urban transport systems. Guatemala City and the national government developed
the Transmetro and Transurbano between 2006 and 2011 to improve urban mobility and
reduce traffic congestion in the metropolitan area.
Energy-efficient firewood stoves in rural areas. With support from the Global Alliance for
Clean Cookstoves, the country approved the National Strategy for Sustainable Use of Wood in
May 2014. The strategy aims to deploy 65,000 improved cookstoves per year over the next 10
years and inform 70 percent of the population about the sustainable use of firewood. 15
Honduras has a draft bill on rational energy use that was received by the National Congress in March
2012. A new entity would be created within Secretaría de Recursos Naturales y Medio Ambiente de
Honduras (SERNA, Honduran Secretariat of Natural Resources and Environment) to promote energy
efficiency. The bill proposes
Creation of a fund to finance energy audits and energy efficiency projects and programs. The
fund would be financed by domestic and international sources and be managed by SERNA.
Establishment of a standards and labeling program for electrical appliances.
An energy information databases to monitor energy consumption patterns in the country, under
SERNA’s responsibility. Suppliers and importers of energy would be required to make energy
consumption data available to SERNA for the database.
Increasing efficient energy use in transport through reorganization of traffic flows, and
modernization of public transport fleets.
Introduction of tax exemptions and other incentives for energy-efficient equipment.
Ongoing energy efficiency programs in Honduras include the following:
Energy efficiency standards. The Organismo Hondureño de Normalización (Honduran
Standards Agency) has developed voluntary energy efficiency standards for compact fluorescent
lamps, air conditioners, motors, and refrigerators. The standards specify energy efficiency
standards and labeling requirements.
Plan Estratégico de Ahorro de Combustible y Electricidad (Strategic Plan for Saving
Electricity and Fuels). This plan, approved in March 2012, aims to reduce energy consumption in
the public and private sectors through education campaigns, time-of-use electricity tariffs, and
energy conservation in public sector offices.
Project for Energy Efficiency in the Industrial and Business Sectors. Launched in 2005,
the project provided technical support and capacity development to promote energy efficiency
in the Honduran commercial and industrial sectors. The project was promoted by the
Honduran Business Council for Sustainable Development, with cooperation from the Honduran
government, SERNA, UNDP, and external donors. The project promotes best practices in
Honduran industry to cut GHG emissions, improve efficiency, promote use of energy-efficient
equipment, and improve the overall competitiveness of businesses. Through the project,
financing was made available for energy audits, capacity-building efforts, and energy efficiency
research in commercial and industrial entities in Honduras (CEPAL, 2014b).
15 This section is based on the information provided by CEPAL (2014b).
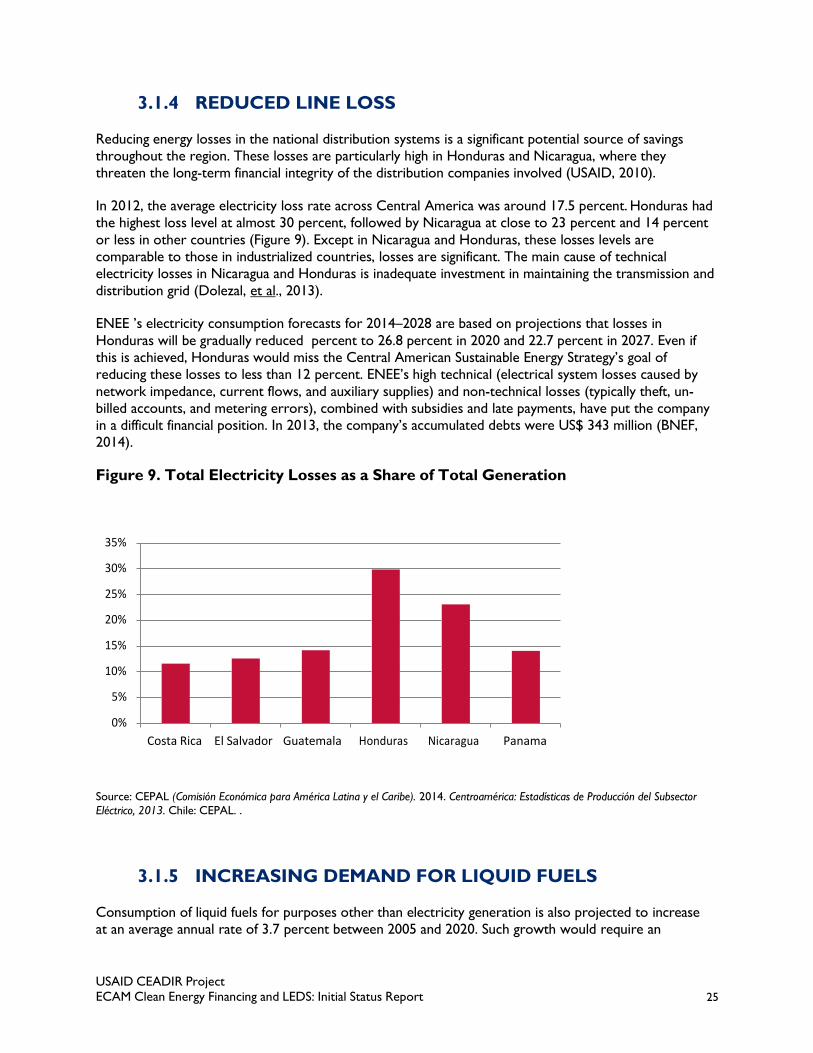
USAID CEADIR Project ECAM Clean Energy Financing and LEDS: Initial Status Report 25
3.1.4 REDUCED LINE LOSS
Reducing energy losses in the national distribution systems is a significant potential source of savings
throughout the region. These losses are particularly high in Honduras and Nicaragua, where they
threaten the long-term financial integrity of the distribution companies involved (USAID, 2010).
In 2012, the average electricity loss rate across Central America was around 17.5 percent. Honduras had
the highest loss level at almost 30 percent, followed by Nicaragua at close to 23 percent and 14 percent
or less in other countries (Figure 9). Except in Nicaragua and Honduras, these losses levels are
comparable to those in industrialized countries, losses are significant. The main cause of technical
electricity losses in Nicaragua and Honduras is inadequate investment in maintaining the transmission and
distribution grid (Dolezal, et al., 2013).
ENEE ’s electricity consumption forecasts for 2014–2028 are based on projections that losses in
Honduras will be gradually reduced percent to 26.8 percent in 2020 and 22.7 percent in 2027. Even if
this is achieved, Honduras would miss the Central American Sustainable Energy Strategy’s goal of
reducing these losses to less than 12 percent. ENEE’s high technical (electrical system losses caused by
network impedance, current flows, and auxiliary supplies) and non-technical losses (typically theft, un-
billed accounts, and metering errors), combined with subsidies and late payments, have put the company
in a difficult financial position. In 2013, the company’s accumulated debts were US$ 343 million (BNEF,
2014).
Figure 9. Total Electricity Losses as a Share of Total Generation
35%
30%
25%
20%
15%
10%
5%
0%
Costa Rica El Salvador Guatemala Honduras Nicaragua Panama
Source: CEPAL (Comisión Económica para América Latina y el Caribe). 2014. Centroamérica: Estadísticas de Producción del Subsector
Eléctrico, 2013. Chile: CEPAL. .
3.1.5 INCREASING DEMAND FOR LIQUID FUELS
Consumption of liquid fuels for purposes other than electricity generation is also projected to increase
at an average annual rate of 3.7 percent between 2005 and 2020. Such growth would require an
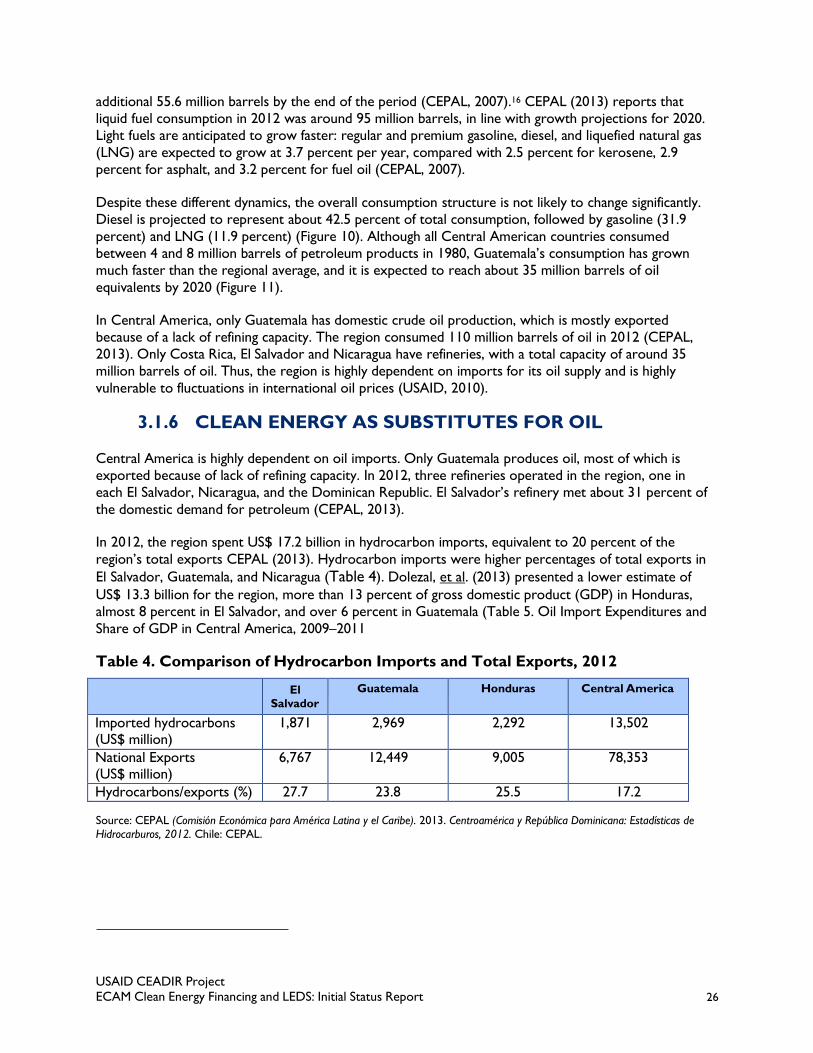
USAID CEADIR Project ECAM Clean Energy Financing and LEDS: Initial Status Report 26
additional 55.6 million barrels by the end of the period (CEPAL, 2007).16 CEPAL (2013) reports that
liquid fuel consumption in 2012 was around 95 million barrels, in line with growth projections for 2020.
Light fuels are anticipated to grow faster: regular and premium gasoline, diesel, and liquefied natural gas
(LNG) are expected to grow at 3.7 percent per year, compared with 2.5 percent for kerosene, 2.9
percent for asphalt, and 3.2 percent for fuel oil (CEPAL, 2007).
Despite these different dynamics, the overall consumption structure is not likely to change significantly.
Diesel is projected to represent about 42.5 percent of total consumption, followed by gasoline (31.9
percent) and LNG (11.9 percent) (Figure 10). Although all Central American countries consumed
between 4 and 8 million barrels of petroleum products in 1980, Guatemala’s consumption has grown
much faster than the regional average, and it is expected to reach about 35 million barrels of oil
equivalents by 2020 (Figure 11).
In Central America, only Guatemala has domestic crude oil production, which is mostly exported
because of a lack of refining capacity. The region consumed 110 million barrels of oil in 2012 (CEPAL,
2013). Only Costa Rica, El Salvador and Nicaragua have refineries, with a total capacity of around 35
million barrels of oil. Thus, the region is highly dependent on imports for its oil supply and is highly
vulnerable to fluctuations in international oil prices (USAID, 2010).
3.1.6 CLEAN ENERGY AS SUBSTITUTES FOR OIL
Central America is highly dependent on oil imports. Only Guatemala produces oil, most of which is
exported because of lack of refining capacity. In 2012, three refineries operated in the region, one in
each El Salvador, Nicaragua, and the Dominican Republic. El Salvador’s refinery met about 31 percent of
the domestic demand for petroleum (CEPAL, 2013).
In 2012, the region spent US$ 17.2 billion in hydrocarbon imports, equivalent to 20 percent of the
region’s total exports CEPAL (2013). Hydrocarbon imports were higher percentages of total exports in
El Salvador, Guatemala, and Nicaragua (Table 4). Dolezal, et al. (2013) presented a lower estimate of
US$ 13.3 billion for the region, more than 13 percent of gross domestic product (GDP) in Honduras,
almost 8 percent in El Salvador, and over 6 percent in Guatemala (Table 5. Oil Import Expenditures and
Share of GDP in Central America, 2009–2011
Table 4. Comparison of Hydrocarbon Imports and Total Exports, 2012
El Salvador
Guatemala Honduras Central America
Imported hydrocarbons (US$ million)
1,871 2,969 2,292 13,502
National Exports (US$ million)
6,767 12,449 9,005 78,353
Hydrocarbons/exports (%) 27.7 23.8 25.5 17.2
Source: CEPAL (Comisión Económica para América Latina y el Caribe). 2013. Centroamérica y República Dominicana: Estadísticas de Hidrocarburos, 2012. Chile: CEPAL.

USAID CEADIR Project ECAM Clean Energy Financing and LEDS: Initial Status Report 27
Table 5. Oil Import Expenditures and Share of GDP in Central America, 2009–2011
2009 2010 2011
Country Million US$ Percentage
GDP
Million US$ Percentage
GDP
Million US$ Percentage
GDP
El Salvador 1,038 5 1,350 6.3 1,819 7.9
Guatemala 2,014 5.4 2,227 5.4 2,951 6.3
Honduras 1,215 8.6 1,684 10.9 2,267 13.4
Central America
7,383 5.7 9,320 6.3 13,265 8
Source: Dolezal, Majano, Ochs, A., and Palencia,, 2013. The Way Forward for Renewable Energy in Central America. Washington, DC: Worldwatch Institute.
On October 14, 2014, the International Energy Agency significantly lowered its forecast of world oil
demand. Weakening demand, coupled with abundant supplies associated with Libya’s continued recovery
and Iraq’s growing flows, resulted in lower oil prices. The price of Brent crude has been falling since June
2014 and reached a price of less than US$ 85 per barrel by mid-October. This is the lowest price since
2010.17 While lower oil prices could benefit Central American economies, they could also make
renewable alternatives less competitive.
3.1.7 OIL PRICE FLUCTUATIONS
Central America is vulnerable to high and unpredictable oil prices. In 2008, the global price of oil
reached an all-time high of $145 per barrel and Central America spent $11.2 billion on oil imports, up
nearly 50 percent from 2006. As energy-intensive industries across the region faced rising costs, their
competitiveness diminished in international markets relative to industries where electricity was not
dependent on petroleum.
Increased spending on oil imports can negatively affect the trade deficit of countries. The resulting rising
costs for electricity generation can create political pressures for price controls or subsidies creating
uncertainty for potential investors (Dolezal et al., 2013).
Governments across Central America have used energy subsidies to shield their economies from high
oil prices, improve people’s access to energy, and promote economic growth. These subsidies have
increased dramatically in recent years. El Salvador alone provides $420 million annually in energy
subsidies for electricity, gasoline, propane, and public transportation—nearly double the amount of
Honduras and representing nearly 14 percent of the national revenue (Table 6). According to more
recent figures from IMF (2013), fuel subsidies in El Salvador, Guatemala, and Honduras were equivalent
to 4.21, 6.12, and 1.81 percent of the government’s revenue respectively.
17 http://www.iea.org/oilmarketreport/omrpublic/

USAID CEADIR Project ECAM Clean Energy Financing and LEDS: Initial Status Report 28
Table 6. Energy Subsidies, 2008
Electricity
Gasoline
Propane
Public Transportation
Share of GDP
Share of Revenue
Country million U.S. dollars percent
El Salvador 223 n.a. 140.0 57.1 1.5 13.5
Honduras 42.1 156.6 n.a. 19.9 1.6 9.5
Guatemala 37.8 n.a. n.a. 48.4 0.2 2.2
Source: Dolezal, A., Majano, A.M., Ochs, A., and Palencia, R. 2013. The Way Forward for Renewable Energy in Central America. Washington, DC: Worldwatch Institute.
Spot market prices for electricity in the competitive wholesale markets of El Salvador, Nicaragua, and
Panama increased significantly after 2004 due to the sharp increase in the price of bunker fuel used by
less efficient and more expensive marginal generation plants (USAID, 2010).
Electricity prices for end users have generally risen due to higher generation costs, but residential tariffs
remain relatively low, particularly in Honduras where residential consumer were subsidized up to 55
percent as of December of 2014. The Empresa Nacional de Energía Eléctrica (National Electricity Utility)
accumulated a debt of US$ 343 million as a result of technical and non-technical losses, late payments
and subsidies (BNEF, 2014). Furthermore, the increases in electricity losses occurring in some countries,
particularly Honduras, have added to the financial burden on distribution companies. World Bank
estimates suggest that the total deficit associated with insufficient tariffs totaled approximately US$ 554
million in 2008. This figure does not include the effect of cross-subsidies or the cost of additional losses,
so it must be considered a lower bound for the total cost of shielding consumers from higher electricity
tariffs.
The Consejo de Electrificación de América Central (Central American Electrification Council) has
conducted simulations and analysis indicating that increased use of renewable resources (particularly
hydropower) could reduce total expansion costs because lower operation costs would offset higher
upfront investment costs (USAID, 2010). The World Bank (2010) similarly concludes that switching to
renewable energy for electricity generation can result in cost advantages compared to fossil fuels.

USAID CEADIR Project ECAM Clean Energy Financing and LEDS: Initial Status Report 29
Figure 10. Types of Petroleum Products Consumed in Central America, 1980–
2020
Source: CEPAL (Comisión Económica para América Latina y el Caribe). 2007. Estrategia Energética Sustentable Centroamericana 2020.
México, D.F.: CEPAL.
Figure 11. Total Consumption of Petroleum Products in Central America, by
Country, 1980–2020
Source: CEPAL (Comisión Económica para América Latina y el Caribe). 2007. Estrategia Energética Sustentable Centroamericana 2020.
México, D.F.: CEPAL.
3.1.8 ENABLING ENVIRONMENT
This section describes the state of the readiness of public institutional finance. All countries in the region
have begun to adopt measures to encourage a favorable investment climate for sustainable energy.

USAID CEADIR Project ECAM Clean Energy Financing and LEDS: Initial Status Report 30
Although Central American governments have conducted renewable energy sources assessments with
support from international donors, they have largely focused on the early stages of energy planning. For
actual investment decisions, more detailed, location-specific assessments that include data on seasonal
and diurnal variability of demand and supply are needed. In the case of wind energy, policy makers would
benefit from having access to information about optimal wind conditions in broad geographic zones.
Policy makers could use this information to design energy strategies that integrate wind profiles with
data from other technologies, demand curves, and transmission opportunities and barriers. More
detailed information for individual sites could be later assessed by project developers. The potential and
challenges of using wind power throughout the day and year need to be analyzed for a set of potential
sites, thus enabling policy making and investments (Dolezal et al., 2013).
NREL’s online tool “PVWatts” contains site-specific data to calculate photovoltaic energy output for
Belize, Guatemala, Honduras, Nicaragua, and El Salvador (http://pvwatts.nrel.gov). While this tool
provides a good overview of the solar potential, it does not eliminate the need for technical feasibility
studies particular locations.
There is a lack of comprehensive energy system analysis for integrated planning in the region. Renewable
energy potential needs to be considered with load profiles in a region and integrated with other existing
and planned electricity sources—and efficiency measures, including off-grid solutions. Data on how the
expected variability of different renewable resources aligns with daily and seasonal electricity demand
patterns can help energy planners harness these energy sources efficiently. Integrating diverse renewable
and nonrenewable energy resources from different locations into the grid can reduce the effects of
localized intermittency (Dolezal et al., 2013).
All countries in the region have begun to adopt measures to encourage a favorable investment climate
for sustainable energy. Although many have established fiscal incentives for renewable energy regulatory
measures and public financing are less common (Table 7).
Table 7. Fiscal Incentives for Renewable Energy in El Salvador, Guatemala and
Honduras
Capital Subsidy,
Grant, or Rebate
Investment of Production Tax
Credits
Reduction in Sales, Value- Added Tax, Income,
Customs or Other Taxes
Energy Production
Payment
El Salvador No Yes Yes Yes
Guatemala No Yes Yes No
Honduras No Yes Yes No
Source: Dolezal, A., Majano, A.M., Ochs, A., and Palencia, R. 2013. The Way Forward for Renewable Energy in Central America.
Washington, DC: Worldwatch Institute. .
Honduras offers renewable electricity projects a 10 percent price premium for the first 15 years under
the Law for Promotion of Electricity Generation with Renewable Sources adopted in 2007. In 2014, ,
the country began offering a feed-in tariff for solar plants that come online before August 2015 to help
reduce electricity shortages. Solar plants can receive a price of US$ 180/MWh for 15 years, an increase
of about US$ 30/MWh over the 10 percent premium offered by the 2007 law. The new feed in tariff
(FiT) is limited to 300 MW, but only 130 MW is expected to come online before the deadline (BNEF,
2014).
Central America currently has no legally binding quota obligations (also known as renewable portfolio
standards, or RPSs) in place. These measures require distributors to purchase a minimum amount of

USAID CEADIR Project ECAM Clean Energy Financing and LEDS: Initial Status Report 31
electricity generation from renewables or require that a utility purchase or generate a certain amount of
its electricity from renewables by a given date.
Despite of these incentives, project developers interviewed by Dolezal et al. (2013), complained that
governments have not fulfilled past obligations to reimburse import taxes or delays have been lengthy
and there was a lack of coordination with customs and other tax authorities on tax rebates. Income tax
exemptions for renewables exist in El Salvador, Guatemala and Honduras. However, these instruments
need to be tailored to the characteristics of renewable energy projects. This is illustrated by the case of
El Salvador, where tax exemptions only applied to the first 10 years of a project, although much of the
net income from wind development in the region is not generated within that period.
Despite growing institutional capacity aimed at promoting sustainable energy, barriers to governance
and transparency hinder the growth of renewables in the region. The time-consuming government
approvals that developers have to obtain to advance a project and the lack of transparency, reliability,
and accountability of the process, are major barriers. One of the most notable obstacles is the long time
required to process an environmental impact assessment, approve construction permits, and obtain tax
concessions for renewable energy projects. For example, it took more than a decade for the largest
wind farm in the region, Cerro de Hula in Honduras, to proceed from the feasibility study to
commissioning.
3.2 IMPORTANT CO-BENEFITS
3.2.1 ENERGY SECURITY CONCERNS
El Salvador imports 100 percent of its oil and diesel 47 percent of the national installed power capacity
(FOMIN and BNEF, 2013). Guatemala, Honduras, and El Salvador are part of the Petrocaribe initiative,
through which countries buy oil from Venezuela, paying a 5-50 percent upfront with a grace period of
one to two years. The rest can be paid through a 17-25 year-financing agreement with a 1 percent
interest rate if oil prices are above US$ 40 per barrel. However, there are signs that Venezuela’s
economic difficulties may result in renegotiation of these terms. This may pose a particular risk for El
Salvador, which bought about 20 percent of its oil imports from Venezuela and had annual deferred
payments equivalent to 1 percent of GDP (Figure 12).

USAID CEADIR Project ECAM Clean Energy Financing and LEDS: Initial Status Report 32
Figure 12. Energy Security in and Central America and the Caribbean
Source: http://www.economist.com/news/americas/21621845-venezuelas-financing-programme-leaves-many-caribbean- countries-vulnerable-single-point
Central import hydrocarbons from a relatively small group of exporters, the United States, Venezuela,
Colombia, Mexico, and Ecuador. Imports from Venezuela have been decreasing steadily since the early
2000s, while the United States has increased its share in these markets, particularly in Honduras, where
it supplies practically all hydrocarbon imports (Figure 13. Origin of Total Hydrocarbon Imports in El
Salvador, 2012 through Figure 15. Origin of Total Hydrocarbon Imports in Honduras, 2012
Figure 13. Origin of Total Hydrocarbon Imports in El Salvador, 2012
Source: CEPAL (Comisión Económica para América Latina y el Caribe). 2013. Centroamérica y República Dominicana: Estadísticas de
Hidrocarburos, 2012. Chile: CEPAL.

USAID CEADIR Project ECAM Clean Energy Financing and LEDS: Initial Status Report 33
Figure 14. Origin of Total Hydrocarbon Imports in Guatemala, 2012
Source: CEPAL (Comisión Económica para América Latina y el Caribe). 2013. Centroamérica y República Dominicana: Estadísticas de
Hidrocarburos, 2012. Chile: CEPAL.
Figure 15. Origin of Total Hydrocarbon Imports in Honduras, 2012
Source: CEPAL (Comisión Económica para América Latina y el Caribe). 2013. Centroamérica y República Dominicana: Estadísticas de
Hidrocarburos, 2012. Chile: CEPAL.
3.2.2 HEALTH BENEFITS
CEPAL (2009) estimated the externalities of fossil fuel-based electricity generation in Central America
under several scenarios. It found that the health costs from local pollution would raise the cost of

USAID CEADIR Project ECAM Clean Energy Financing and LEDS: Initial Status Report 34
electricity anywhere from US$ 0.0009/KWh to US$ 0.0027/KWh, or by an average of US$
0.0014/KWh.18 According to CEPAL, 59 percent of the cost was caused by SO2 emissions, 29 percent
by particulate matter, and 12 percent by NOx emissions. When the climate impacts of CO2 emissions
were considered, the “true cost” of electricity increased by another US$ 0.0087-0.023/KWh 0.87 - 2.3
cents per kWh, using a conservative social cost of $20 per ton of CO2 emitted. Internalization of both
types of externalities would raise electricity costs by an average of US$ 0. 0157/KWh 1.57 cents per
kWh.
CEPAL also analyzed externalities for energy in Central America and the Caribbean over the period
2010–23. It found that average annual climate-related costs were US$ 307 million, and average annual
health-related costs were US$ 44 million. Applying these results to energy expansion scenarios used in
the Central America Sustainable Energy Strategy 2020, the study found that externalities related to
health and climate change would increase the real cost of fossil fuel generation plants by between 8 and
10.6 percent through 2020 (CEPAL, 2009).
3.2.3 JOB CREATION
Investments in energy efficiency, renewable energy capacity, and improving the electrical grid are
expected to create new job opportunities in Central America. Direct renewable energy jobs are
generally divided into two categories: (1) construction, installation, and manufacturing (CIM), and (2)
operation and maintenance. CIM jobs tend to be concentrated in the first few years of setting up a
renewable energy facility. In comparison, most O&M jobs exist for the lifespan of the facility. In general,
renewable power plants are more labor intensive than fossil fuel-based power plants, resulting in a
comparatively higher number of jobs. Given that almost all fossil fuels in Central America are imported,
it is expected that a major switch toward renewable energies would result in significant job-creation
benefits.
In the short term, each new MW of photovoltaic capacity may create 20 manufacturing jobs, 30
installation jobs, and one maintenance job. Assuming a 25-year lifespan for PV installations, this would
result in 0.8 manufacturing jobs and 1.2 installation jobs annually per MW of installed capacity.19 Each
additional MW of wind capacity may create 16 jobs in manufacturing and the supply of components; five
jobs in wind farm development, installation, and indirect employment; and 0.33 jobs in O&M.20 Assuming
again a 25-year lifetime for wind installations, this would result in 0.64 manufacturing jobs and 0.2
installation jobs annually per MW generated (Dolezal et al., 2013).
Despite the lack of a fully developed CE value chain in any Central American country, necessitating the
use of some foreign labor, installation and O&M jobs require in-country technicians and professionals.
Most manufacturing will be concentrated in the countries where renewable energy equipment and
materials are made.
18 This study was conducted before the World Health Organization published its 2010 Global Burden of Disease Report, which
provided higher costs for the health effects caused by fine particulate matter.
19 M. Wei, S. Patadia, and D.M. Kammen, “Putting Renewables and Energy Efficiency to Work: How Many Jobs Can the Clean
Energy Industry Generate in the US?” Energy Policy, vol. 38 (2010), pp. 919–31.
20 Case Study 4 from L.M. Salazar, “Zamorano Leads Projects: Alternative Energy Sources,” 23 April 2010 at
www.zamorano.edu/english/2010/04/23/zamorano-leads-projects-alternative-energy-sources.

USAID CEADIR Project ECAM Clean Energy Financing and LEDS: Initial Status Report 35
3.2.4 GENDER AND VULNERABLE POPULATION IMPACTS
For many years, the discussion on gender and energy has focused largely on household energy,
particularly the burning of traditional biomass for cooking and its impacts on health of women and
children. As of 2011, the share of population using fuelwood for cooking was 27 percent in El Salvador,
73 percent in Guatemala, and 69 percent in Honduras (generally in closed environments with inefficient
cookstoves) (Dolezal et al., 2013).
Provision of modern energy, including from renewables, has the potential to reduce hours spent
collecting fuelwood and other energy sources for use in the home and allow time for education and
income generation. Women are also increasingly involved in renewable energy technical projects and are
taking on new responsibilities, such as electrifying their communities, businesses, and homes.
Currently, as true for most of the world, women are underrepresented in the electricity industry, and in
related businesses and university programs. Women are becoming increasingly economically active in
business with women’s business associations. The team anticipates meeting with these groups to discuss
the potential for improving the gender balance in the CE sector.
3.3 GOALS
Table 8 summarizes goals and targets of the national CE plans in El Salvador, Guatemala, and Honduras.
Available expansion plans suggest that the share of fossil-fired resources in new capacity additions will
decrease relative to previous periods. Developments from 2008 to the present, as well as projects
expected to reach completion in the next few years, suggest that there is a trend toward reducing
reliance on fossil generation resources (USAID, 2010).

USAID CEADIR Project ECAM Clean Energy Financing and LEDS: Initial Status Report 36
Table 8. National CE Plans' Goals and Targets in El Salvador, Guatemala, and
Honduras
Country (Renewable Share of Electricity Use,
2011)
Energy Plan (Issuing/Overseeing
Agency)
CE Goals and Targets
El Salvador (63.3%) Política Energética Nacional 2010– 2024 (National Energy Council)
Provide affordable and continuous
power supply
Build institutional capacity
Reduce oil dependence
Minimize detrimental
environmental and social impacts of
energy, considering climate change
Guatemala (64.2%) Politica Energética 2013–2027 (Ministry of Energy and Mines)
Cover current and future energy
demand
Strengthen electric power
transmission
Diversify the energy mix and
reduce oil dependence
Generate 80% of electricity from
renewable sources by 2027
Honduras (43.5%) Visión del País 2010–2038 Plan de Nación 2010–2022 (Technical
Secretariat for Planning and External
Cooperation)
Reduce reliance on hydrocarbons
Mitigate and adapt to climate
change
Expand country-wide electricity
coverage to 85% by 2015 and 90%
by 2020
Generate 60% of electricity from
renewable sources by 2022 and
80% by 2038
Invest $1.5 billion in renewable and
hydroelectric sources by 2022
Source: Dolezal, A., Majano, A.M., Ochs, A., and Palencia, R. 2013. The Way Forward for Renewable Energy in Central America. Washington, DC: Worldwatch Institute.
3.3.1 EL SALVADOR
To meet El Salvador’s projected demand, 200 MW of electric power capacity may need to be installed in
2015–2016. Approximately19 percent of El Salvador’s electricity generation, about 1,290 GWh, was
expected to be provided by projects developed between 2011and 2015 (CNE, 2010). Table 9 lists the
main projects that were expected to begin operations between 2014 and 2024. There was no mention
in the National Energy Policy about the role of energy efficiency in meeting the country’s growing
electricity demand.

USAID CEADIR Project ECAM Clean Energy Financing and LEDS: Initial Status Report 37
Table 9. Planned CE Projects in El Salvador (2014–2024)
Name
Energy Source
Expected Operational
Date
Installed Power
(MW)
Investment
($/kW)
Fixed, O&M costs ($/kW
year)
5 Noviembre (expansion)
Hydro 2016 80.0 258.85 1.98
Chaparral Hydro 2017 65.7 585.81 1.98
Cimarrón Hydro 2023 261 336.58 1.98
H-Xacbal Hydro 2015 30.0 n.a. n.a.
Ahuachapán (optimization)
Geothermal 2016 6.0 711.14 6.45
Berlín V-1 Geothermal 2017 6.0 338.80 6.45
Berlín V-2 Geothermal 2019 30.0 338.80 6.45
Chinameca Geothermal 2019 30.0 276.55 6.45
Motores a GN LNG 2017 380.0 158.15 3.56
CEL Photovoltaics
Solar 2014 14.2 293.08 2.93
FV Zona Oriental Solar 2017 60.0 293.08 2.93
Wind project Wind 2018 40.0 234.47 2.93
El Angel (expansion)
Biomass 2015 21.0 n.a. n.a.
Caparrastique (expansion)
Biomass 2015 55.0 n.a. n.a.
Source: CNE (Consejo Nacional de Energía, El Salvador). 2014. Plan Indicativo de la Expansión de la Generación Eléctrica de El Salvador 2014–2024. San Salvador: CNE.
Note. Figures in US$ calculated using an exchange rate of 8.53 colones = 1 USD, based on www.oanda.com, accessed October
09, 2014.
When the LNG project is slated to begin operations in 2018, about 40 percent of El Salvador’s energy is
expected to originate from fossil fuels, and the remainder of renewable energies. The share of fossil
fuels could increase about 2 percent if hydropower projects are delayed or cancelled as a result of social
opposition (Figure 16. Anticipated Electric Power Generation Sources in El Salvador in 2018). Also, if
hydropower projects do not start operations, energy prices in El Salvador were expected to be 13
percent higher in 2024 (CNE, 2014).

USAID CEADIR Project ECAM Clean Energy Financing and LEDS: Initial Status Report 38
Figure 16. Anticipated Electric Power Generation Sources in El Salvador in 2018
Scenario 1: With New Hydropower Operations at
El Chapparal, Cimmaron, and Hidro Xacbal
Scenario 2: Without New Hydropower Operations
Wind 2% Biomass
Solar 2% 3%
LNG 32%
Hydro 29%
Petrole- um 8%
Source: CNE (Consejo Nacional de Energía, El Salvador). 2014. Plan Indicativo de la Expansión de la Generación Eléctrica de El
Salvador 2014–2024. San Salvador: CNE.
3.3.1 GUATEMALA
Guatemala’s National Energy Policy 2013–2027 projects a significant increase in the contributions of
renewable sources to its electricity generation matrix (Figure 17). Bunker fuel is anticipated to decrease
from 36 percent in 2007 to 11 percent of electricity generation in 2027. Hydropower is expected to
become the fastest growing source of electricity, from 37.6 percent in 2007 to 46 percent in 2027, while
geothermal would double from 3 percent to 6 percent during the same period. The policy aims to
increase renewable energy generation by 500 MW by 2027 (MEM, 2013).
Geother-mal 24%
Biomass
Wind 2% 3%
Solar 2%
27%
LNG 34%
Geother-mal 24%
8%

USAID CEADIR Project ECAM Clean Energy Financing and LEDS: Initial Status Report 39
Figure 17. Guatemala's Electricity Generation Matrix, 2007, 2012, and 2027
100%
90%
80%
70%
60%
50%
40%
30%
20%
10%
0%
2007 2012 2027
LNG
Mineral coal
Sugarcan bagasse
Diesel oil
Bunker
Geothermal
Hydro
Source: MEM (Ministerio de Energía y Minas). N.D. Estadísticas Energéticas Subsector Eléctrico 2013. Guatemala: MEM.
Guatemala is planning to add 1.8 GW of new capacity (above the existing 2.8 GW) between 2014 and
2018. Approximately1.2 GW of this increase is anticipated to come from large and small hydropower.
The country appeared to be on track for this goal, as it auctioned 623 MW of capacity to be delivered
by 2015 and is tendering another 250 MW to be delivered by 2017 (BNEF, 2014). Recent auctions have
included renewable energy quotas. The 2012 auction of 600 MW required at least 300 MW from
renewables, including at least 200 MW from hydropower, 70 MW from biomass, and 30 MW from solar
and wind. A maximum of 20 MW was allowed for bunker fuel, 80 MW for coal, and 200 MW for natural
gas.21 In August 2014, MEM indicated that it was analyzing the possibility of organizing an auction for 300
MW of geothermal power.22
3.3.1 HONDURAS
ENEE’s generation expansion plan for Honduras 2008–2022 proposed an addition of 1,921 MW
between 2014 and 2022, with 1,100 MW from coal and bunker fuel, and 821 MW from hydropower.
Over this period, six coal and bunker fuel plants with a capacity of 1,338 MW were expected to stop
operating. Thus, there would be a net increase in installed capacity of 583 MW, excluding small
hydropower or other renewables (Table 10. Planned Fossil Fuel and Large Hydro Electric Projects in
Honduras (2014–2022)
21 http://www.mem.gob.gt/2012/10/29/presentan-ofertas-para-contratacion-de-600-mw/
22 http://www.mem.gob.gt/2014/08/28/peg-3-alcanza-los-precios-mas-bajos-de-la-historia-en-compra-de-energia/

USAID CEADIR Project ECAM Clean Energy Financing and LEDS: Initial Status Report 40
Table 10. Planned Fossil Fuel and Large Hydro Electric Projects in Honduras
(2014–2022)
Project Fuel Year MW
Diesel engines Bunker 2018 500
Coal plant Coal 2017/2019/2021 100/300/200
Tablón Hydro 2014 20
Piedras Amarillas Hydro 2015 100
Tornillito Hydro 2015 160
Llanitos Hydro 2015 98
Jicatuyo Hydro 2016 173
Valencia Hydro 2020 270
Source: EENE (Empresa Nacional de Energía Eléctrica). 13 June 2014. Escenario Base Final Proyeccion de Demanda de Energía Eléctrica 2014-2028 Sistema Interconectado Nacional: ENEE,.Accessed October 9, 2014, from
http://www.enee.hn/planificacion/2014/resumen%20proyeccion%20demanda%20honduras.pdf
In June 2014, ENEE approved more than 40 contracts for the generation of 560 MW from renewables,
including 450 MW from hydro, 70 MW from biomass, and 40 megawatts. A new law that ended ENEE’s
generation monopoly entered into force on July 4, 2014. Thus, developers that expect to be able to
participate in competitive bids based on the new law criticized the timing of these contracts.23
23 http://www.energias-renovables.com/articulo/aprueban-560-mw-de-energia-renovable-20140628

24 Dolezal, et al. (2013) is a primary reference for the CE financing issues and values found in this section.
USAID CEADIR Project ECAM Clean Energy Financing and LEDS: Initial Status Report 41
4. CLEAN ENERGY FINANCING This section focuses on current and planned lending for CE.24 The section covers sources of CE finance
including banks, international climate and development funds, and microfinance. It then discusses
instruments typically used for project finance that, if adopted by local banks, would allow more local
banks to manage the risk of CE project finance. It offers ideas on instruments that are beginning to be
used in other areas of the world for project finance that could, theoretically, become important in
Central America. Finally, it covers the current state of CE financing by types of renewable resources
listing the completed, pending, and potential CE investments by country.
4.1 CURRENT CLEAN ENERGY LENDING
Although there is some lending by local banks, such as Banco Atlantida in Honduras, the majority of CE
lending in Central America is by large, multilateral development banks or national development banks.
BNEF tracks large investments that meet a size threshold of at least one MW or US$ 1million. Only
three local banks meet this threshold: Banco de Desarrollo de El Salvador, a public sector bank that
offers a specific credit line for renewable energy; Banco Lafise Honduras, which offers financial services
in the Central American and Caribbean region; and Banco Financiera Comercial Hondurena, offering
corporate and consumer banking products.
4.1.1 BANK LENDING
The majority of CE lending in Central America is by large, multilateral development banks or national
development banks rather than local banks according to the most recent monitoring by BNEF. Figure 18
provides a summary of the top CE financiers for Central America overall from 2008 to 2014. In
contrast,

USAID CEADIR Project ECAM Clean Energy Financing and LEDS: Initial Status Report 42
Table 11 provides the top project finance lenders by country from 2000 to 2014.
These two graphics show that the regional and national development banks play an outsized role in CE
investments relative to the local private sector banks. Despite CE increasing as a portion of total
generation, the bulk of the CE lending comes from external or regional financiers. It might be that to
build a sustainable CE financing market, the lending sector would benefit from more local financing of CE
projects. The reliance on “outside” or higher volume lenders with project financing financial instruments
demonstrates that they are willing to accept and can mitigate higher perceived market risks of CE
relative to other lending opportunities.
In 2009, CABEI’s Accelerating Renewable Energy in Central America (ARECA) program interviewed
representatives of the largest banks in each country. In Honduras, the four banks reported participated
in the financing of renewable energy power plants of up to ten MW. Four out of six banks interviewed
in Guatemala said that they had done so. Only one local bank in El Salvador had financed a renewable
energy power plant.25
Figure 18. Top 10 Clean Energy Financiers in Central America, 2008–2014 (US$
Million)
BCIE
FMO (Netherlands)
EXIM (US)
IDB
World Bank
NORD/LB
DEB (Germany)
Sprott
BICSA
IIC
0 50 100 150 200 250 300 350 400
Source: BNEF (Bloomberg New Energy Finance). 2014. H2 2014 Mexico and Central America Market Outlook. In the midst of transformation. 31 July 2014.
25 CABEI’s studies are found here: http://www.proyectoareca.org/?cat=1015&title=Estudios&lang=es

USAID CEADIR Project ECAM Clean Energy Financing and LEDS: Initial Status Report 43
Table 11. Top Project Finance Lenders by Country from 2000 to 2014
Country Project Finance Lenders Cumulative Lending (US
$Million)
Percentage of funding within
country
El Salvador KfW 22.17 49.00
Banco Centroamericano de Integración Económica 14.93 33.00
Banco de Desarrollo de El Salvador 8.14 18.00
Total 100%
Guatemala Clipper Acquisitions Corp. 42.00 31.17
The World Bank Group 27.00 20.04
Banco Centroamericano de Integración Económica 21.90 16.25
G&T Continental 16.90 12.54
Banco Agromercantil de Guatemala SA 16.90 12.54
KfW 10.03 7.45
Total 100%
Honduras The World Bank Group 184.08 27.39
Banco Centroamericano de Integración Económica 165.50 24.63
Export-Import Bank of the United States 158.80 23.63
Nederlandse Financierings Maatschappij voor Ontwikkelingslanden NV
135.63 20.18
OPEC Fund for International Development 14.59 2.17
EMP Global LLC 8.13 1.21
Banco Lafise Honduras SA 2.63 0.39
Banco Financiera Comercial Hondurena SA 2.63 0.39
Total 100%
Note: BNEF tracks all assets above 1 MW and all investment above US$ 1M.
Source: Alves, Lilian, Associate, Latin America, BNEF (Bloomberg New Energy Finance). January 5, 2015, private
communication.
4.1.2 SPECIALIZED AND NON-SPECIALIZED FUNDS
Globeleq Mesoamerica Energy is a venture capital fund that specializes in development of wind power in
Central America (it previously operated as Mesoamerica Energy). The Central American Renewable
Energy and Cleaner Production Facility (CAREC) was developed by E+Co Capital with support from the
IADB’s Multilateral Investment Fund (MIF), El Banco Centroamericano de Integración Económica (BCIE),
the Belgian Investment Company for Developing Countries (BIO), the Finnish Development Finance
Company (Finnfund), and the Netherlands’ Triodos Bank. CAREC used mezzanine financing mechanisms
such as subordinated debt, convertible debt, preferred shares, and other non-traditional financing
instruments to fund energy projects. Between 2006 and 2011, CAREC invested close to $10 million in
eight projects, including three small hydropower plants in Honduras and a biogas production facility in
Guatemala. By 2012, the fund allocation stage for CAREC had ended, and it focused entirely on managing
existing investments.
In addition, many non-specialized funds are open to investments in renewable energy. For example, the
Central American Small Enterprise Investment Fund II (CASEIF II) is a US$ 35 million risk capital fund
administered by the Latin American Financial Services (Grupo LAFISE) regional banking group. Investors

USAID CEADIR Project ECAM Clean Energy Financing and LEDS: Initial Status Report 44
include the IADB’s MIF, Banco Centroamericano de Integración Económica (BCIE), the Norwegian
Investment Fund for Development (Norfund), the Swiss Investment Fund for Emerging Markets,
Finnfund, CAF, and BIO. CASEIF II was created to invest in small and medium enterprises in the growth
stage in Central America and the Dominican Republic. It invests in shares and other capital or quasi-
capital instruments and remains a shareholder for a four to seven year period. In 2009, the fund
acquired 20 percent participation in Tecnosol, a Nicaraguan company specialized in off-grid renewable
energy solutions to rural families, which plans to expand to other countries in the region.
These limited experiences suggest that long term and flexible financing and equity instruments can help
to complement the commercial options available in the region, especially for small- and medium-scale
private developers. Some of these funds have also invested technical and financial resources to help
project developers prepare business plans, find other sources of financing, and obtain permits.
4.1.3 GREEN MICROFINANCE
Increasingly, microfinance institutions are developing programs to support distribution of renewable
energy in communities and to meet the energy needs of small businesses. The number of institutions
offering green microfinance in Central America is growing. However, 2012 data suggest that the
existence of these institutions and their programs has not necessarily translated into increased CE
lending, particularly in Guatemala and Honduras..
This is due to their inability to evaluate CE projects. Financial costs on microloans range from 1.5 to 28
percent, depending on the institution and product. Table 12 provides information on the number of
registered microfinance institutions in each country.
Table 12. Green Microfinance in El Salvador, Guatemala, and Honduras, 2012
Country
Total Number
of
Microfinance Institutions
Number of Microfinance
Institutions Offering Green
Loans
Average Interest Rate on Green
Microloans
Total Amount of Green Microloans
Disbursed
Number of Borrowers
El Salvador 19 3 11% $250,000 500
Guatemala 23 3 n.a. 0 0
Honduras 24 6 n.a. 0 0
Source: Dolezal, A., Majano, A.M., Ochs, A., and Palencia, R. 2013. The Way Forward for Renewable Energy in Central America. Washington, DC: Worldwatch Institute.

USAID CEADIR Project ECAM Clean Energy Financing and LEDS: Initial Status Report 45
4.2 FINANCING INSTRUMENTS
Infrastructure projects such as energy generation and distribution are complex and require long-term
investment capabilities as they have a long payback period. They also require sizable capital investment.
Thus, the types of financial instruments often needed for supporting CE projects by the lending industry
are fairly specific, although commonly known. This section describes the types of available financial
instruments needed for CE lending. In addition it addresses how local financial institutions in these three
countries have learned or can learn how to manage risk associated with CE lending through training in
project finance techniques and, for example, with use of the USAID Clean Energy Lending Toolkit.
Finally, this section includes a discussion of other instruments that, recently, are beginning to be used in
project finance and could conceivably become important in the area of CE funding.
Over the past few decades, developing countries have increasingly turned from reliance on public
funding (World Bank, International Finance Corporation, regional banks) to the private sector to help
finance, construct, and manage electric power. The turn to the private sector resulted from the
desperate need for investment in infrastructure to improve service levels, coupled with state owned
enterprises that were no longer credit worthy or financially viable.
In traditional corporate finance, lenders assess and rely upon the overall creditworthiness of the
corporation making the investment. The lender has recourse to all of the corporation’s assets. If a
corporation funds a project and the project declares bankruptcy it could impact on the rest of the
corporation’s portfolio. The size, complexity, and long-time frame of energy investments leave
corporations unwilling to make these investments without the protection of limited recourse finance
where only those funds invested in the project are at risk. Funding of power projects, from electricity
generation to transmission, has thus increasingly taken the form of project finance. Project finance
provides lenders with recourse, or claim, only to the cash flows and assets of the specific project itself,
not to corporations other assets. In practice, in developing countries, project finance is frequently
backed by government or donor guarantees to provide greater reassurance to lenders of repayment.
This increases lending available and reduces the cost of capital.
Investments typically involve equity and debt. Equity is money or the monetary value of contributions
that provide an ownership stake. Debt is money that has to be repaid to a lender, with interest. The
lower the equity contribution, the less the project sponsors, or owners, are risking. Simultaneously, the
lower the equity contribution, the higher the debt contribution (or debt-equity ratio) must be, resulting
in greater risk to the lenders and decreasing their willingness to lend.
In project finance, equity, or ownership financing, is largely provided by corporate sponsors and
developers. Debt financing is largely provided by bank syndicated loans. The loans are secured by
project assets, not on the other assets of the project sponsors, and repayment is based on the cash
flows of the project.
In standard project finance, the project sponsors establish a new company for the purpose of a specific
infrastructure project. This company is in the form of a Special Purpose Vehicle (SPV). Because they are
formed for a specific project they are sometimes called “single purpose entities.” SPVs allow investors
such as corporations to limit their risk to the amount of money invested rather than expose their other
assets in the event of bankruptcy. Frequently, the equity investors include companies that are
contractually involved in the project and thus have multiple financial incentives in its success; they are

USAID CEADIR Project ECAM Clean Energy Financing and LEDS: Initial Status Report 46
paid for their portion of the construction and they are incentivized by cash flows from a successfully
operating project.
The bulk of project finance is in the form of debt, not equity. Debt capital is provided as either loans or
bonds. The vast majority is provided through loans. The amount of debt required is typically too risky
for one bank to take on alone so banks join together to form a syndicate. Syndication allows banks to
participate in lending for large power projects while managing their risk by limiting their exposure. In a
syndicate, one bank or a small group of banks serves as the mandated lead arranger, committing to the
SPV to provide the entire loan of a set amount. The arranger then invites other banks to participate by
providing a portion of the loan. These banks may proceed to a third tier by allowing other banks to
participate, creating a pyramid structure.
With the debt supplied through project bonds, investors lend money to the SPV and are repaid through
cash flows generated by the SPV throughout its life. The use of bonds as a form of debt financing has
started to increase as more institutional investors see infrastructure investment as attractive for long-
term, predictable cash flows. In addition, the market for “green/climate” bonds has increased markedly
over the past five years and may become a significant source of CE financing for Latin American projects.
Nearly US$ 37 billion of green bonds were issued in 2014, more than triple the 2013 issuance (BNEF,
January 15, 2015). Through skillful application of project finance techniques, most risks can be mitigated.
This route may be cheaper than creating external mitigating or credit enhancement instruments where a
bank perceives a risk.
The key characteristics of project financing are:
Capital intensity: Project finance techniques are used when a project requires a large upfront
investment and project income is spread over a long period (typically 10–25 years). Most
infrastructure projects fall into this category.
Use of special-purpose entities: Project financing supports a new legal entity (the project
company), with the sole purpose of executing the project. The special-purpose vehicle (SPV)
limits investor risk to the funds provided.
Complex codified structure: Project finance transactions have similar structural components
and stakeholders, regardless of the sector. Each transaction may have a greater number of
stakeholders than balance sheet financing.26 All relationships between stakeholders are governed
by contractual agreements. The number of contractual agreements increases the complexity of
project finance over typical corporate finance.
Focus on cash flows not assets: Since a new, special-purpose vehicle (SPV) has no credit
history, lenders need to focus on the project’s cash flow, which requires a different credit
evaluation process. Lenders must concern themselves with the project’s sensitivity to potentially
adverse factors, such as construction overruns and operational risks.
Higher Costs: Raising capital through project finance is generally more expensive than through
balance sheet financing. The greater need for information, monitoring, and contractual
agreements increases transaction costs. Lenders charge a higher interest rate to compensate for
the non-recourse financing. Margins for project financing also often include premiums for
country and political risks.
26 A company’s balance sheet lists assets and liabilities as of a set moment in time. “Balance sheet financing” includes liabilities
that appear on the balance sheet such as loans, debt, and equity and thus include typical secured debt financing and third party
equity. In typical secured debt financing lenders look at the assets of an owner or developer rather than the cash flow of the
project. The assets of the owner or developer can be seized to repay the loan.

USAID CEADIR Project ECAM Clean Energy Financing and LEDS: Initial Status Report 47
As mentioned in section 4.1.2, the Central American Renewable Energy and Cleaner Production Facility
(CAREC) used mezzanine financing to fund energy projects. This may be an instrument that grows in
importance for infrastructure finance. Mezzanine financing mechanisms such as subordinated debt,
convertible debt, and preferred shares has not typically been used to finance infrastructure. Mezzanine
debt gives the lender the right to convert the loan amount to an ownership or equity stake if the loan is
not paid back in time and on full. It is often employed in buyouts, growth financing, and other private
equity transactions. Mezzanine debt combines characteristics of debt and equity instruments.
There is speculation that crowdfunding may be a source of investment for infrastructure in the future.
There are some examples in developed countries of crowdfunding being used to raise money for public
infrastructure. Mosaic is a crowdfunding platform to finance solar arrays. Mosaic charges a one percent
fee on each investment. Loans are typically paid back over ten years. The minimum investment is US
$25. Divvy is a crowdfunding platform for renewable energy with two pilot projects that repay investors
with reductions on their utility bills.27 This instrument could allow people to directly invest in and have
an ownership stake in CE projects. This could potentially increase the funds available and result in
greater public support for CE projects and policies.
Aggregation of small renewable energy projects would allow smaller banks to originate loans and resell
them to larger investors. Accomplishing this would require standardized approval processes and lending
guidelines that met the criteria of the loan purchaser.
27 Gilpin, Lyndsey, How crowdfunding solar power is democratizing the way we finance clean energy, TechRepublic, March 13,
2014 http://www.techrepublic.com/article/how-crowdfunding-solar-power-is-democratizing-the-way-we-finance-clean-energy/
accessed January 23, 2015.
Case Study – Banco Atlantida
Banco Atlantida in Honduras is a good example of how CE lending capacity can be improved. Banco Atlantida identified
mid-scale renewable energy lending as a long-term strategic opportunity and received a US $50 million credit line from
the IFC-Canada Climate Change Programme for this purpose. Banco Atlantida hired local consultants to assess the technical feasibility of project proposals and ensure compliance with government permitting and environmental and social
laws and IFC policies. A social and environmental compliance expert monitored implementation of the agreements with
local partners after projects had been commissioned. Banco Atlantida had good relationships with the parastatal electric utility (ENEE) and the Ministry of Environment. Loan applicants submitted information on all compliance requirements to
the bank’s credit committee early in the loan appraisal process.
Banco Atlantida offers project finance for the following types of CE:
• Energy efficiency for buildings, transport, and industry;
• Photovoltaics;
• Biogas;
• Biomass;
• Clean cookstoves;
• Wind power; and
• Hydropower.
These loans can be used for capital costs; civil engineering works (concrete, canals, roads); and cables, wiring, and
auxiliary equipment. Banco Atlantida has found cross-selling of its CE loan products to corporate clients effective. It has
actively marketed RE loans at national and regional conferences across Central America. Banco Atlantida has trained staff
in its commercial and risk departments on RE technology, contracts, and finance. The renewable energy finance unit is
part of a new department that includes a project finance unit and a syndication unit.
The bank’s Risk Department played an important role in appraisal of RE projects before they went to the main credit
committee for approval. It relied on power purchase agreements as the basis for financing project cash flows, although it
required collateral from some project developers, depending on their credit history and project size.

USAID CEADIR Project ECAM Clean Energy Financing and LEDS: Initial Status Report 48
4.1 MARKET ACTIVITY BY CE RESOURCE TYPE
This section discusses current and planned investment activities in renewable energy electricity
generation by resource type. It provides an overview of the renewable energy resources and discusses
current investments. This section focuses on market activity publicly reported as of October, 2014, in
wind, on-grid photovoltaics, geothermal, and biofuels/biomass sectors.
CEPAL, 2007 and Dolezal, et al., 2007 quantified the total and remaining effective potential of renewable
sources in the region based on each country’s energy policy. While these figures are not always
consistent, they showed that most of the region’s renewable energy potential was not being used (Table
13).
Table 13. Remaining Effective Potential of Renewable Resources in Central
America, as of 2009 (GWh)
Hydropower Geothermal Wind Bagasse
Country Total
Remaining
Total
Remaining
Total
Remaining
Total
Remaining
El Salvador 9,483 6,544 2,039 2,605 n.a. 2,798 n.a. 273
Guatemala 17,107 15,010 6,132 3,630 n.a. 2,124 n.a. 1,075
Honduras 21,900 15,302 736 545 n.a. 2,883 n.a. 320
Central America
94,171 73,758 18,15 7
13,984 n.a. 17,085 n.a. 2,316
Source: Total figures are from CEPAL (Comisión Económica para América Latina y el Caribe). 2007. Estrategia Energética Sustentable
Centroamericana 2020. México, D.F.: CEPAL.; Remaining potential figures are from Dolezal, A., Majano, A.M., Ochs, A., and Palencia, R. 2013. The Way Forward for Renewable Energy in Central America. Washington, DC: Worldwatch Institute.
4.1.1 WIND
Wind power is still at an early stage in much of Central America. As of 2014, El Salvador and Guatemala
had no installed wind electric generation capacity. El Salvador’s state-owned electric utility is planning to
develop its first utility-scale wind farm. Earlier this year Guatemala closed financing on its first wind farm.
Honduras had 102 MW of installed wind generation capacity (BNEF). BNEF (2014) estimated 1.3 GW of
new wind capacity would be installed in Central America (excluding Mexico) through 2020 (Figure 19).

USAID CEADIR Project ECAM Clean Energy Financing and LEDS: Initial Status Report 49
Figure 19. Mexico and Central America Wind Installation Forecast, 2008–2020 (in
MW)
Source: BNEF (Bloomberg New Energy Finance). 2014. H2 2014 Mexico and Central America Market Outlook. In the midst of
transformation. 31 July 2014.
El Salvador has many areas with good-to-excellent wind resources, particularly on elevated terrain areas
of the southwest, northeast, and northwest. The Japan Weather Association identified 12 suitable sites
for wind power development based on a wind potential map created by the Solar and Wind Energy
Resource Assessment and wind measurements conducted in 2006–2007 by the Finnish Meteorological
Institute. Each of these sites has a wind potential greater than 700 W/m2 at 50 m above ground level
(Figure 20). Establishment of a wind monitoring system would be an important next step.
A review of closed asset financing from BNEF reveals no wind projects in El Salvador. Asset financing is
borrowing based on balance sheet assets. Thus no wind projects in El Salvador have concluded, or
closed, on financing based on assets. The state-owned parastatal Comisión Ejecutiva Hidroeléctrica Río
Lempa (CEL) plans to develop the nation’s first utility-scale wind project to diversify the country’s
energy mix.28 Forty two MW of wind power in El Salvador. CEL’s original plan to commission the plant
by 2015 will not be achieved as no apparent progress has been made since 2012. In addition, a recent
tender for 40 MW in a different site ended without a winner (BNEF, 2014).
28 Nielsen, Stephen, CEL Planning El Salvador’s First Wind, Solar Energy Projects, BNEF, June 14, 2012

USAID CEADIR Project ECAM Clean Energy Financing and LEDS: Initial Status Report 50
Figure 20. Wind Potential Sites in El Salvador
Point
(area)
Annual Mean Wind Speed
meters per second (m/s) at three
different measuremtn heights
Annual wind Potential watts per
meter squared (W/m2) at three
different measurement heights
30 m 50 m 80 m 30 m 50 m 80 m
1 6.50 7.32 7.66 574.0 843.8 1010.2
2 5.15 5.94 6.62 401.6 703.4 1036.7
3 8.20 8.52 8.69 1072.2 1231.2 1348.9
4 6.61 7.42 7.94 485.1 707.0 899.1
5 8.19 8.48 8.55 1100.8 1237.1 1281.8
6 8.22 8.87 9.33 806.0 1013.6 1193.8
7 8.61 8.95 9.08 1183.2 1363.3 1460.1
8 7.26 7.81 7.96 1029.6 1287.6 1402.6
9 5.82 6.26 6.44 589.5 749.0 849.5
10 5.96 6.30 6.47 591.6 708.8 794.9
11 5.94 6.30 6.46 576.9 700.9 782.6
12 6.75 7.56 7.98 636.4 911.5 1103.1
Source: CNE/JICA (Consejo Nacional de Energía/Japanese International Cooperation Agency). 2012. Plan Maestro para el Desarrollo
de la Energía Renovable en El Salvador. San Salvador: CNE/JICA.
In Guatemala, data from the National Rural Electric Cooperative, wind turbine manufacturer Kenetech
Windpower, and wind developers confirm areas of good wind resource in the southeast. Data were
available from areas south of Guatemala City and Antigua, ridges near Comapa and the border with El

USAID CEADIR Project ECAM Clean Energy Financing and LEDS: Initial Status Report 51
Salvador, and ridges in Huite region near Zacapa. A wind map developed by the U.S. National
Renewable Energy Laboratory (NREL) indicates many other areas in southern and eastern Guatemala
with good-to-excellent wind resources. Wind resources are generally lower at high elevations above
2,500–3,000 m than in exposed terrain at elevations of 800–2,000 m. This reduction in wind resource at
very high elevations is confirmed by upper-air data and by measurement towers, including data from a
site at 3,300 m elevation in southwestern Guatemala where measured wind resource was only low-to-
marginal (Class 1–2) (NREL, N.D.).
Banco Centroamericano de Integración Económica (BCIE) is providing a US$ 50.7 million loan to finance
the 53 MW San Antonio el Sitio wind farm, the first in Guatemala. Located in the, in the municipality of
Villa Canales, this wind farms is expected to be commissioned in 2015 (BNEF, 2014). BCIE’s financial
support was structured as a syndicated loan with the participation of the G&T Continental Bank and the
Banco Agromercantil de Guatemala.29 Two additional wind farms have been contracted, the 30 MW
Teresa C1 plant and the 21 MW Viento Blanco plant. Both of these were planned to be completed in
2015, but financial closure has not been reached in either case. Additional wind projects could be
contracted through further energy auctions being conducted by the Government of Guatemala (BNEF,
2014).
In Honduras, data from Kenetech and wind developers confirm areas of good-to-excellent wind
resources (Class 4–7) on the ridge crests and elevated terrain areas in the region near Tegucigalpa,
particularly at several sites near Santa Ana along the divide south of Tegucigalpa. 30 Upper-air data from
Tegucigalpa confirm the very strong winds that occur in this region. There are numerous other areas of
good-to excellent wind resources in southern Honduras. Some of the prominent ridge crests in
northern Honduras are expected to have good wind resources, based on upper-air data, but no on-site
measurement data are available. Ocean satellite data show areas of moderate-to-good wind resources
(Class 3–4) for exposed coastal areas and offshore islands of the Caribbean Sea, except for the western
coast of Honduras where the resources are only Class 1–2. Unfortunately, no wind measurement data
were available to confirm the Class 3–4 resources estimated for the exposed coastal areas (NREL,
N.D.).
Honduras had 102 MW of installed wind capacity in 2013 (BNEF). The Mesoamerica Cerro de Hula
Wind Farm commenced operation in 2011.31 Cerro de Hula is also expected to increase its installed
capacity to 126 MW, with an investment of US$ 60 million by Globeleq, partly financed by the U.S.
Export–Import Bank. In 2014 the project received a guarantee from the Multilateral Investment
Guarantee Agency, the political risk insurance and credit enhancement arm of the World Bank Group, to
enable the expansion.32 When operational, Cerro de Hula is expected to be able to supply 10 percent
of the country’s electricity demand. Electricity from Cerro de Hula is expected to be sold at US$ 0.12
per KW/hour, resulting in savings of US$ 40 million for the utility.33
Spanish firms Iberdrola and Gamesa have initiated construction of the 50 MW San Marcos wind farm,
140 km south of Tegucigalpa near the border with Nicaragua. Honduran Grupo Terra, owner of the
29 http://www.energias-renovables.com/articulo/financiacion-para-el-primer-parque-eolico-20140325
30 Class 3 or above is considered suitable for utility-scale wind turbines.
31 Globeleq website, http://globeleq.com/portfolio/operating_assets/11/Cerro-de-Hula, accessed December 16, 2014.
32 “Honduran project gets $82m investment guarantee,” WindPower Monthly, 7 February 2014,
http://www.windpowermonthly.com/article/1230369/honduran-project-gets-82m-investment-guarantee, accessed December 16,
2014.
33 http://www.proceso.hn/component/k2/item/28138.html

USAID CEADIR Project ECAM Clean Energy Financing and LEDS: Initial Status Report 52
Cerro de Hula wind farm, received a US$ 127.5 million loan from an international consortium. The debt
arranger is Nederlandse Financierings Maatschappij voor Ontwikkelingslanden NV. Other members of
the syndicate are the German development finance institution Deutsche Investitions- und
Entwicklungsgesellschaft mbH (DEG), the private sector investment arm of the French development
body Agence Française de Développement, the OPEC Fund for International Development (OFID), and
the Interact Climate Change Facility (ICCF).34 The term loan was closed February 5, 2014 (BNEF, 2014).
The development of the 45 MW Chinchayote wind farm also began in 2013. Vientos de San Marcos is
developing this project with an investment of US$ 170 million. The 3.9 MW Ocean View wind park farm
is under construction in Roatán Island, located in the Bay Islands archipelago in the Caribbean. The total
investment for this project is estimated at US$ 4.5 million.35
Wind power has the lowest investment cost per unit of capacity among the renewable energies in El
Salvador in CNE’s project pipeline (US$ 235/kW). Its’ fixed and operation and maintenance (O&M)
costs of US$ 2.93/kW year are similar to those of solar energy and lower than LNG and geothermal.
4.1.2 ON-GRID PHOTOVOLTAICS
The photovoltaics market in El Salvador, Guatemala, and Honduras is still nascent, with no utility-scale
photovoltaic capacity as of 2013 (BNEF). Financing for the first utility-scale plant in El Salvador was
obtained in 2013. This 14.2 MW project called “15 de Septiembre”, located in the municipalities of
Estanzuelas and San Ildefonso, about 90 km away from San Salvador, is expected to cost US$ 58 million
(BNEF, 2014). If the plant began operations in 2014, as planned, it will be the largest photovoltaic power
plant in Central America. A 5 MW photovoltaic plant began operating in Guatemala in 2014. Honduras
had no utility-scale photovoltaic capacity in operation, but large projects underway (BNEF, 2014).
A 60 MW photovoltaic powerplant in the Eastern Zone of El Salvador is expected to begin operations in
2017. Only project development and installation are done in country (Fondo Multilateral de Inversiones
{Multilateral Investment Fund FOMIN [/] and BNEF, 2013). DELSUR contracted 94 MW of PV capacity
at an average price of US$ 116/MWh that are to be delivered by October 2016. These will be developed
by three firms: DP NEOEN-ALMAVAL has a 60 MW PV project; Solar Reserve Development will
develop a 20 MW project; and UDP Proyecto La Trinidad will develop two projects of 8 MW and 6
megawatts.36 DELSUR’s tender was originally open to both wind and solar, but the wind bids were
above DELSUR’s ceiling price of US$ 123/MWh (BNEF, 2014).
Guatemalan President Otto Pérez inaugurated a 5 MW photovoltaic power plant in May 2014 located in
the northeastern Zacapa. The power plant, developed by the firms Green, ECO Solar, Gransolar, and
IDC group, is expected to provide electricity for 40,000 households.37 The solar complex Xepultul II is
to be built by an alliance formed by the Italian firm Enel Green Power and Barefoot College, a
nongovernmental organization that develops renewable energy based electricity for rural communities.
This complex is to provide electricity to the public areas of three communities, including schools,
meeting areas, town offices, and religious buildings.38 The 6.2 MW Sibo plant won a 15-year power
34 http://www.energias-renovables.com/articulo/iberdrola-ingenieria-y-gamesa-construiran-un-parque-20140714
35 http://www.energias-renovables.com/articulo/isla-de-roatan-permiso-ambiental-para-un-20130318
36 http://www.cne.gob.sv/index.php?option=com_content&view=article&id=425:2014-07-25-23-15-28&catid=1:noticias-
ciudadano&Itemid=77
37 http://www.mem.gob.gt/2014/06/02/sol-zacapaneco-iluminara-40-mil-hogares/
38 http://www.energias-renovables.com/articulo/xepultul-ii-fotovoltoica-para-tres-pueblos-rurales-20140204

USAID CEADIR Project ECAM Clean Energy Financing and LEDS: Initial Status Report 53
purchase agreement (PPA) contract with Empresa Electrica de Guatemala in an energy auction in 2012.
The Sibo plant is being developed by Gransolar and Greenergyze (part of Grupo Ecos), and obtained
US$ 130/MWh in financing from the Guatemalan G&T bank. Grupo Onyx has filed for a US$ 14.23 M
solar electric facility called Horis I, but has not yet closed on financing (BNEF).
Three solar power plants have been announced in Honduras, but financing has not yet closed -- the
SunEdison Pacifico Solar PV Plant, Upower Pacific Solar Energy Nacome PV Plant, and the Upower
PRODERSSA Nacome PV Plant. The first was seeking a term loan while the other two were looking for
balance sheet financing (BNEF). Solar Power and Compania Hondurena de Energia Solar announced in
October 2014 that they had reached an agreement with Canadian Solar Inc. to develop two 73.2 MW
solar farms in southern Honduras which are expected to be complete in March of 2015.39
Solar power has investment capital cost of US$ 293/kW and O&M costs of US$ 2.93/kW year. These
are lower than most geothermal and hydropower power plants, but relatively higher than other
renewable sources.
Honduras was offering a 15-year feed-in tariff (US$ 180/MWh) for solar plants commissioned by 2015.
The incentive is limited to a maximum of 300 MW of capacity.
4.1.3 GEOTHERMAL
According to the World Bank (2012), the potential for geothermal power generation in Central
America is estimated at 3,000 - 13,000 MW,40 About 50 sites have been identified for possible
development, including 4–13 in El Salvador, 8–13 in Guatemala, and 6–7 in Honduras. If the upper range
of the capacity estimate is developed, geothermal could supply nearly all of the region‘s electricity
demand. The range of estimated potential is wide because only a small fraction of the identified sites has
been validated by actual drillings, and because different groups have used alternative methodologies to
estimate the potential. This underscores the large uncertainty of resource estimates in the absence of
drilling information and indicates the need for increased exploration and test drilling to fill the
information gap (World Bank, 2012).
Geothermal energy comprised 24 percent of El Salvador’s installed electricity capacity (204 MW) in
2014, one of the largest shares in the world for this resource. The CNE has included three geothermal
power plants in the pipeline: 1) a 6 MW expansion at Ahuachapán by 2016, 2) a l 6 MW expansion of
Berlín another in 2017, and an additional 30 MW expansion of Berlín by 2019. These projects are
welcome developments as there has not been significant investment in geothermal power plants for
nearly a decade (Table 14).
Domestic components of geothermal power in El Salvador include exploration/production drilling,
turbine and power block, balance of plant, and project development (FOMIN and BNEF, 2013).
39 Munro, Stephen, “Canadian Solar Supplying 146.4 Megawatts for Honduras Projects,” BNEF, October 15, 2014.
40 World Bank estimates are based on the following studies: Bundshuh, T. Knopp, R. Muller, R, Kim, J.L., Neck, V., & Fanghanel,
T., 2000. “Application of LIBD to the determination of the solubility product of thorium (IV)- colloids”. Radiochimica Acta, 88,
625-629; Japanese Bank for International Cooperation (JBIC). “The Role of Geothermal Energy in the Electric Sectors of the
Plan Puebla Panama Region”, November 2006; and Guzman, Carlos Roberto, “Desarrollo Geotérmico en Centroamérica”, La
Geo, 2009.
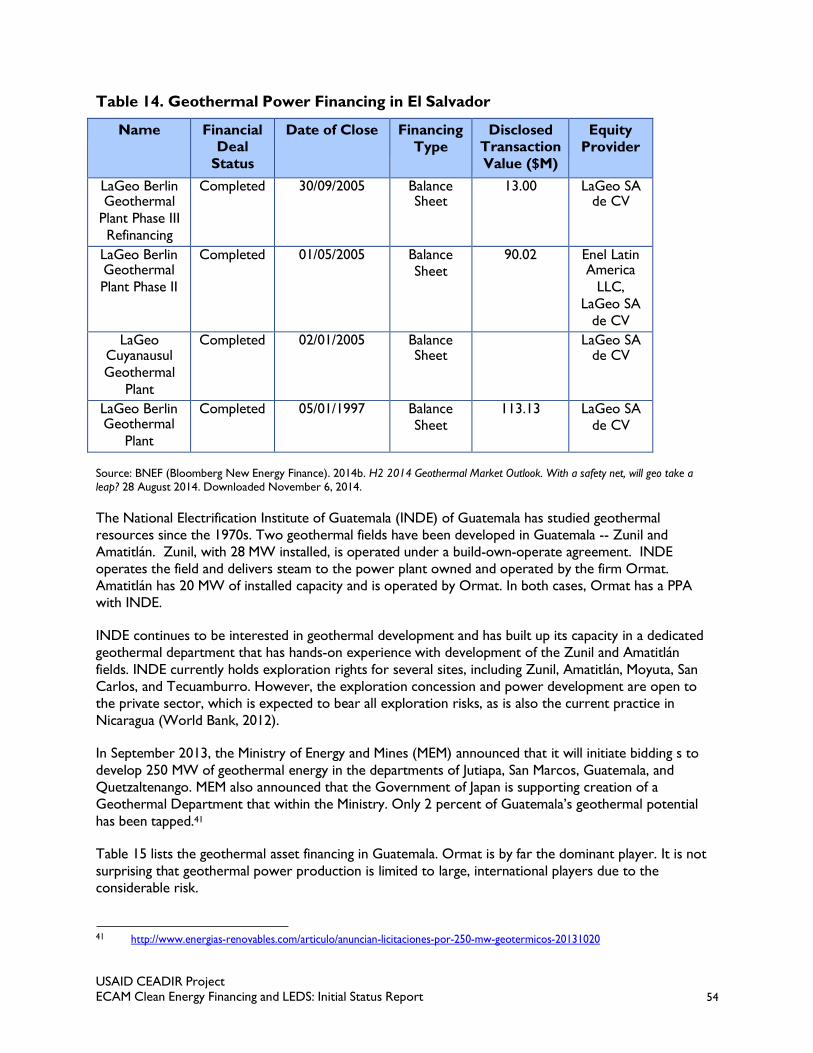
USAID CEADIR Project ECAM Clean Energy Financing and LEDS: Initial Status Report 54
Table 14. Geothermal Power Financing in El Salvador
Name Financial Deal
Status
Date of Close Financing
Type
Disclosed Transaction
Value ($M)
Equity
Provider
LaGeo Berlin Geothermal
Plant Phase III
Refinancing
Completed 30/09/2005 Balance Sheet
13.00 LaGeo SA de CV
LaGeo Berlin Geothermal
Plant Phase II
Completed 01/05/2005 Balance Sheet
90.02 Enel Latin America
LLC,
LaGeo SA
de CV
LaGeo Cuyanausul
Geothermal
Plant
Completed 02/01/2005 Balance Sheet
LaGeo SA de CV
LaGeo Berlin Geothermal
Plant
Completed 05/01/1997 Balance Sheet
113.13 LaGeo SA de CV
Source: BNEF (Bloomberg New Energy Finance). 2014b. H2 2014 Geothermal Market Outlook. With a safety net, will geo take a leap? 28 August 2014. Downloaded November 6, 2014.
The National Electrification Institute of Guatemala (INDE) of Guatemala has studied geothermal
resources since the 1970s. Two geothermal fields have been developed in Guatemala -- Zunil and
Amatitlán. Zunil, with 28 MW installed, is operated under a build-own-operate agreement. INDE
operates the field and delivers steam to the power plant owned and operated by the firm Ormat.
Amatitlán has 20 MW of installed capacity and is operated by Ormat. In both cases, Ormat has a PPA
with INDE.
INDE continues to be interested in geothermal development and has built up its capacity in a dedicated
geothermal department that has hands-on experience with development of the Zunil and Amatitlán
fields. INDE currently holds exploration rights for several sites, including Zunil, Amatitlán, Moyuta, San
Carlos, and Tecuamburro. However, the exploration concession and power development are open to
the private sector, which is expected to bear all exploration risks, as is also the current practice in
Nicaragua (World Bank, 2012).
In September 2013, the Ministry of Energy and Mines (MEM) announced that it will initiate bidding s to
develop 250 MW of geothermal energy in the departments of Jutiapa, San Marcos, Guatemala, and
Quetzaltenango. MEM also announced that the Government of Japan is supporting creation of a
Geothermal Department that within the Ministry. Only 2 percent of Guatemala’s geothermal potential
has been tapped.41
Table 15 lists the geothermal asset financing in Guatemala. Ormat is by far the dominant player. It is not
surprising that geothermal power production is limited to large, international players due to the
considerable risk.
41 http://www.energias-renovables.com/articulo/anuncian-licitaciones-por-250-mw-geotermicos-20131020

USAID CEADIR Project ECAM Clean Energy Financing and LEDS: Initial Status Report 55
Table 15. Geothermal Asset Financing in Guatemala
Name Financing
Status
Closing Date
for Financing
Financing
Type
Disclosed Transaction
Value ($M)
Equity
Provider
USG El Ceibillo
Geothermal
Plant
Announced
/filed
Balance
Sheet
US Geothermal
Inc
Ormat Amatitlan
Geothermal
Plant
Refinancing
Completed
21/05/2009
Term loan
42.00
Ormat
Technologies
Orzunil I de Electricidad
Zunil
Geothermal
Plant
Acquisition
Completed
26/06/2006
Balance
Sheet
3.25
Ormat
Technologies Inc
Orzunil de Electridad
Zunil
Geothermal
Plant
Acquisition
Completed
20/03/2006
Balance
Sheet
14.75
Ormat
Technologies Inc
Amatitlan Geothermal
CDM Project
Completed
15/03/2006
Balance
Sheet
55.20
Ormat
Technologies Inc
Source: BNEF (Bloomberg New Energy Finance). 2014b. H2 2014 Geothermal Market Outlook. With a safety net, will geo take a leap? 28 August 2014. Downloaded November 6, 2014.
In Honduras, six geothermal sites were identified in the 1970s and 1980s. The potential was considered
modest, with the Platanares field being the most promising. The Government has awarded concessions
for three: the Pavana, Azacualpa (Geopower), and the Platanares field (Geoplatanares). SERNA
coordinates geothermal activities in the country and it has conducted a complete survey of 204 surface
manifestations.
The Government of Honduras has provided concessions to private companies for the development of
the resource. Exploration of Platanares had been conducted since the 1980s with public resources and
international help, but is now being developed by the private sector (World Bank, 2012). In late 2013,
Ormat purchased the Platanares geothermal plant, which is expected to produce 39 megawatts. Ormat
can hold the concession for 15 years and it has obtained a PPA agreement signed for the plant with the
public utility ENEE. Platanares plant was developed as a result of a competitive bid tendering process for
renewable energies conducted by the Honduran Government in 2010. Honduran energy developer
Elcosa oversaw the exploratory phase of the Platanares project (BNEF, 2014b).
Geothermal pre-survey and exploration activities are risky because they can lead to negative conclusions
about the potential of the geothermal resource, but these are relatively low-cost activities. Test drilling
is high risk since it requires US$ 2–6 million and has an uncertain outcome. Greenfield deep-well drilling

USAID CEADIR Project ECAM Clean Energy Financing and LEDS: Initial Status Report 56
is successful in one out of three attempts. The success rate may improve with multiple drillings at a site,
but the maximum success rate of around 60–80 percent. If the first three activities can be carried out
successfully, the development risk may fall dramatically and be similar to other thermal power-
generating technologies. Although the risk is lower than in exploration and test drilling phases, there is
long-term operational risk related to declining temperature and permeability of the geothermal
reservoir, the possibility of a high level of mineralization, and problems with the reinjection process of
geothermal fluids. These risks are considered manageable.
Investments to address the high, upfront risks for geothermal development are large. For example, US$
14–39 million may be needed in the first three phases with no guarantee of success. Given that lenders
are unlikely to finance these activities, government risk-sharing measures can be critical for
complementing private sector resources, either through a joint public-private partnership or other
financial instruments.
Three broad development models have been used for geothermal development in Central America --
the state-owned model, public-private partnerships, and private sector concessions. In Costa Rica, the
national power company was the only developer of geothermal resources in the country. LaGeo in El
Salvador is a good example of a public-private development strategy. In particular, it is worth highlighting
the catalytic role of the private firm Enel in providing technical advice and funding for the company. The
approach in El Salvador has been successful, although project risks were indirectly backed by the
Government. Nicaragua awarded concession areas to the private sector, which had to take on the
exploration risk and develop the resource. The situation in Honduras was similar to Nicaragua, but only
two concessions had been contracted as of 2012. In recent years, Guatemala followed an approach
similar to Nicaragua’s. The GoG offered concessions to private developers, except for those already
held by INDE. In the early years, the upfront resource risks were borne solely by the GoG.
Concessional finance from development financial institutions for geothermal power has increased along
with use of risk mitigation and reduction tools and increased market participation. CAF [Banco de
Desarrollo de América Latina/ Development Bank of Latin America, Germany’s KfW [Bank aus
Verantwortung/German Development Bank], and the European Commission created a risk mitigation
fund for geothermal power, that is expected to begin operating in 2015. The fund is to initially serve
early-stage development projects in Bolivia, Chile, Colombia, Ecuador, and Peru, but might expand to
other Latin American countries (BNEF, 2014b).
Comprehensive inventories of geothermal resources with high-quality data are available in relatively few
countries (e.g., Indonesia), but are a strong attraction for the private sector. Nicaragua is the only
country in Central America with a completed geothermal resource inventory and the private sector
there has shown significant interest in getting exploration concessions, particularly for sites with quality
resource information.
El Salvador has accumulated extensive in-country experience and is in a good position to scale up
geothermal capacity, but needs to clarify the role of LaGeo, the sole geothermal developer in the
country. Honduras and Panama have relatively little experience in this area.
The Guatemalan Government could usefully strengthen in-house capacity for geothermal development,
develop its geothermal resource inventory, and explore other risk-sharing mechanisms in addition to the
separation of steam and power production. Honduras and Panama need to undertake an inventory of
geothermal resources and, based on that, decide if geothermal will play a role in their power expansion. 42
42 This section draws heavily from the World Bank (2012).
USAID CEADIR Project ECAM Clean Energy Financing and LEDS: Initial Status Report 57
4.1.4 BIOFUELS/BIOMASS
Biofuel production in Central America falls far short of its potential. Both Guatemala and El Salvador
have an estimated potential to produce 265–285 metric billion tons of biofuel. Although the bulk of this
capacity is for ethanol, about a tenth of El Salvador’s is for biodiesel. Guatemala and Honduras each
generate an estimated 1 million liters annually mainly from and palm, jatropha, and castor oil plan for
domestic use (Dolezal et al., 2013).
CEPAL (2007) simulated the effects of blending sugarcane-based ethanol with gasoline, starting with 1.1
percent in 2007, steadily increasing to 10 percent by 2015, and staying at that level until 2020. Meeting
this goal would require an annual production of around 650 million liters of ethanol per year and an
additional 115,000 hectares (ha) would need to be allocated to sugarcane plantations, a 28.1 percent
increase over 2005. Under this scenario, Guatemala would need to use 16 percent of its arable land to
grow sugarcane, 15 percent more than in 2005. El Salvador would have to devote 11 percent of its land
for sugarcane, a 33.6 percent increase over 2005.
CEPAL (2007) also estimated the land required for a gasoline blend with 5 percent palm oil-based
biodiesel by 2020. This would require 1,259 ha in El Salvador, 2,294 ha in Guatemala, and 581 ha in
Honduras. The Government of El Salvador has stated that, high-quality arable land should be used to
grow food, while biofuel crops should be grown in marginal lands the country’s small size (CEPAL,
2007).
In 2010, the San Francisco-based firm Nexant found strong interest in biofuels in the region, but noted
that despite the momentum toward more comprehensive policies and programs to promote the
production and utilization of biofuels, the broader development of biofuels in the region faced important
limitations. These include availability of land, environmental and social concerns, production volumes,
international markets, quality assurance, technical limitations and costs, political and administrative
complexity, and public communication. It also concluded that fossil fuel use was likely to grow faster
than biofuels in the future (USAID, 2010).
In El Salvador, CNE has expansion of two biomass power plants in its pipeline that would add a total of
76 MW of capacity in 2015. Two other power plants were being developed to expand the capacity of
existing sugar mills and feed surplus electricity to the grid. In El Paisanal (40 km from San Salvador), La
Cabaña planned to invest US$ 35.5 million to increase its capacity 20 MW by 2014–15. Between January
and June 2013, La Cabaña fed 12.8 GWh to the grid.
The Chaparrastique sugar mill, owned by the Compañía Azucarera Salvadoreña (Cassa), planned to
increase its electric generation capacity from 16 to 62 megawatts. Chaparrastique and another sugar mill,
Centaral Izalco, also owned by Cassa produced over 120 GWh during the first half of 2013, while El
Angel sold with 61.8 GWh to the grid in the first half of 2013.43
The first sugarcane-based ethanol production plant in El Salvador was inaugurated in July 2014. It is
located in the city of Catacamas and is part of an initiative by the Organization of American States (OAS)
to expand biofuel activity with technical assistance from Brazil and the United States. This plant is
expected to produce 290 liters every eight hours. The Hernández administration is supporting farmers
to grow palm for biodiesel. The country anticipates investments of over US$ 72 million to expand the
cultivated area of African palm from 135,000 ha in mid-2014 to 260,000 ha over four years.44
43 http://www.energias-renovables.com/articulo/avanza-la-biomasa-20130814
44 http://www.energias-renovables.com/articulo/entra-en-operaciones-la-primera-planta-de-20140725

USAID CEADIR Project ECAM Clean Energy Financing and LEDS: Initial Status Report 58
Table 16 lists biomass, biofuel, and landfill investments in El Salvador between 2002 and 2011.
Table 16. Biomass and Biofuel Asset Financing in El Salvador
Name Sector Financial
Deal
Status
Date of Close of
Financing
Financing
Type
Disclosed
Transaction
Value ($M)
Equity
Provider
Southridge El Salvador
Bioethanol Plant
Biofuels Abandoned 30/11/2011 Balance Sheet
Southridge Enterprises
Inc
Nejapa Landfill Gas Plant
Biomass & Waste
Completed 31/03/2010 Balance Sheet
14.30 AES Corp/VA
Gasohol Acajutla
Bioethanol
Dehydration
Plant Expansion
Biofuels Completed 31/12/2008 Balance Sheet
Nejapa Landfill Gas Plant
Acquisition
Biomass & Waste
Completed 01/04/2008 Balance Sheet
AES Corp/VA
Ingenio La Cabana El
Paisnal
Bioethanol and
Power Plant
Biofuels Completed 31/12/2006 Balance Sheet
Ingenio La Cabana SA
de CV
Bio Energia Valle Zapotitán
Biodiesel Plant
Biofuels Completed 19/04/2006 Balance Sheet
2.50
Gasohol Acajutla
Bioethanol
Dehydration
Plant
Biofuels Completed 31/12/2005 Balance Sheet
ARFS Acajutla Bioethanol
Dehydration
Plant
Biofuels Completed 30/09/2005 Balance Sheet
13.00 American Renewable
Fuel
Suppliers
Ltda de CV
CASSA Central Izalco Biomass
Plant
Biomass & Waste
Completed 01/07/2002 Balance Sheet
Cia Azucarera
Salvadorena
SA
CASSA Central Izalco Biomass
Plant
Biomass & Waste
Completed 01/07/2002 Balance Sheet
Cia Azucarera
Salvadorena
SA
Source: BNEF (Bloomberg New Energy Finance). 2014b. H2 2014 Geothermal Market Outlook. With a safety net, will geo take a leap? 28 August 2014. Downloaded November 6, 2014.
The Guatemalan Government signed a memorandum of understanding with the OAS in August 2014 to
begin a pilot project to mix ethanol with gasoline. If successful, the project may lead to a national
ethanol program. The six-month pilot will involve 20 vehicles owned by individuals and government
agencies. The Ministry of Energy and Mines highlighted the importance of substituting imported

USAID CEADIR Project ECAM Clean Energy Financing and LEDS: Initial Status Report 59
petroleum products with biofuels from domestically grown sugarcane. The OAS will also support
creation of a biofuels unit within MEM.
The Magdalena sugar mill, located in Guatemala’s southern Escuintla Department, began operation of a
new US$ 80 million plant in 2012, increasing its installed capacity from 69 MW to 125 megawatts. The
sugar mill uses 50 MW for internal consumption, and the remaining 75 MW are dispatched to the grid. It
also plans to operate a biogas plant using wastes from the vinasses (alcohol distillation residues). This
sugar mill is the fourth largest in the world and is expected to provide to the grid an amount equivalent
to almost 5 percent of the national electricity consumption.45
Table 17 shows the biomass, biofuel, and waste projects financed in Guatemala between 2001 and 2010.
45 http://www.energias-renovables.com/articulo/un-ingenio-genera-energia-que-aporta-al-20121127

USAID CEADIR Project ECAM Clean Energy Financing and LEDS: Initial Status Report 60
Table 17. Biomass and Biofuel Asset Financing in Guatemala
Name Sector Financial Deal
Status
Date of
Close
Financing
Type
Disclosed Transaction
Value ($M)
Equity
Provider
Ingenio Palo Biomass Completed 31/12/ Balance Cia Agricola Gordo Biomass & 2010 Sheet Industrial
Plant Waste Ingenio Palo
Gordo SA
ILG DARSA Cuyotenango
Bioethanol Plant
Biofuels Completed 31/12/ 2009
Balance Sheet
Industrias Licoreras de
Guatemala SA
Pantaleon Biofuels Completed 02/06/ Balance Pantaleon Sugar Bioetanol 2009 Sheet Holdings Co Ltd
Bioethanol Plant
Expansion
Guatecarb Biomass Completed 01/09/ Balance UniCarbo Colonia Landivar & 2008 Sheet Energia Biogas
Landfill Gas Waste Ltda Flaring CDM
Project
Olmeca Tecun Uman CDM
Biomass Plant
Biomass &
Waste
Completed 16/06/ 2008
Balance Sheet
Olmeca SA
Ingenio Magdalena
Bioethanol and
Power Plant
Biofuels Completed 31/12/ 2007
Balance Sheet
Ingenio Magdalena SA
Agrocaribe Biomass Completed 01/05/ Balance Agroindustrial Champona & 2007 Sheet Del Caribe SA
Biogas Project Waste
Pantaleon Bioetanol
Bioethanol Plant
Biofuels Completed 31/12/ 2006
Balance Sheet
Pantaleon Sugar Holdings Co Ltd
Pantaleon Biomass Completed 31/12/ Balance Pantaleon Sugar Bioetanol & 2004 Sheet Holdings Co Ltd
Biomass Plant Waste Expansion
San Diego Masagua City
Biomass Plant
Biomass &
Waste
Completed 01/08/ 2004
Balance Sheet
San Diego SA
Alcoholes MAG Bioethanol Plant
Biofuels Completed 31/12/ 2001
Balance Sheet
Ingenio Magdalena SA,
Central
Agroindustrial
Guatemalteca
SA
Source: BNEF (Bloomberg New Energy Finance). 2014b. H2 2014 Geothermal Market Outlook. With a safety net, will geo take a leap? 28 August 2014. Downloaded November 6, 2014.

USAID CEADIR Project ECAM Clean Energy Financing and LEDS: Initial Status Report 61
In Honduras, the Asociación Hondureña de Maquiladores (Honduran Maquila Association) reported that
four biomass projects would begin operations between 2013 and 2015 to provide energy to the textile
industry. A total of US$ 180 million will be invested in two power plants in the Choloma municipality
with a total capacity of 60 megawatts. The municipality of Potrerillos is expected to obtain an
investment of US$ 60 million for a 20 MW biomass project. The fourth one, in the municipality of
Quimistán, representing investments of US$ 80 million, is to have a capacity of 26 megawatts.
Table 18 shows biomass and waste energy projects financed in Honduras between 2002 and 2008, but
transaction values were not available.

USAID CEADIR Project ECAM Clean Energy Financing and LEDS: Initial Status Report 62
Table 18. Biomass Asset Financing in Honduras
Name Sector Financial
Deal
Status
Date
of
Close
Financing
Type
Disclosed
Transaction
Value (US$M)
Equity Provider
ERH El Negrito Biogas Plant
Biomass & Waste
Completed 01/07/ 2008
Balance Sheet
Not Reported
Lean Exportadora
Biomass &
Completed
01/06/
Balance
Exportadora del del Atlantico
Biogas Plant Waste 2008 Sheet Atlantico Aguan
Simtex
Biomass &
Completed
09/02/
Balance
Simtex International
Green Valley International S de
Biomass Plant Waste 2008 Sheet RL de CV
Biogas Energia Los Leones Biogas
Plant
Biomass &
Waste
Completed
12/12/
2007
Balance
Sheet
Not Reported
Exportadora del
Biomass &
Completed
01/12/
Balance
Exportadora del Atlantico Aguan
Biogas and
Biomass Project Waste 2007 Sheet Atlantico Aguan
EECOPALSA El
Biomass &
Completed
29/12/
Balance
Energia Ecologica Castano Village
Biomass Plant Waste 2006 Sheet de Palcasa SA
Eecopalsa El
Biomass &
Completed
01/06/
Balance
Energia Ecologica Progreso Biogas
Plant Waste 2006 Sheet de Palcasa SA
CAHSA Villanueva Biomass &
Completed 31/12/ Balance Cia Azucarera
Biomass Plant Waste 2004 Sheet Hondurena SA
Azucarera
Biomass &
Completed
29/10/
Balance
Cia Azucarera Chumbagua San
Marcos Biomass Chumbagua SA de
Plant Waste 2004 Sheet CV
Cia Azucarera
Biomass &
Completed
02/04/
Balance Cia Azucarera
Tres Valles Tres Valles SA de
Biomass Plant Waste 2003 Sheet CV
Inversiones
Biomass &
Completed
05/08/
Balance
Inversiones Hondurenas El
Progreso Biomass Hondurenas SA
Plant Waste 2002 Sheet de CV
Azucarera La
Biomass &
Completed
01/06/
Balance
Azucarera La Grecia Marcovia
Biomass Plant Waste 2002 Sheet Grecia SA de CV
Cerveceria Hondurena San
Pedro Sula Biogas
Plant
Biomass &
Waste
Completed
12/01/
2002
Balance
Sheet
SABMiller PLC
Source: BNEF (Bloomberg New Energy Finance). 2014b. H2 2014 Geothermal Market Outlook. With a safety net, will geo take a leap? 28 August 2014. Downloaded November 6, 2014.

USAID CEADIR Project ECAM Clean Energy Financing and LEDS: Initial Status Report 63
5. BARRIERS AND RESPONSES This section summarizes the barriers identified in the literature to CE lending in El Salvador, Guatemala
and Honduras. Many of these are being addressed by USAID and other donors, including the IADB and
World Bank. During the Needs Assessment we will explore with local stakeholders what barriers
present the greatest impact and are not being addressed. We will investigate what technical assistance
to financial institutions in the form of knowledge dissemination, networking, and training would facilitate
private and public investment in CE in Central America to reduce GHG emissions. In addition, we will
inquire about the use of energy and economic modeling for energy and low emission development
planning as we were not able to answer this question with a desktop review.
This section also explores the activities being undertaken by various donors in Central America to
address the barriers identified. USAID desires to leverage and contribute to rather than duplicate
existing efforts. A review of existing efforts by USAID and other donors demonstrates that there
remains a need in developing the local capacity of lenders in the CE sector.
5.1 BARRIERS TO CLEAN ENERGY LENDING
Remaining barriers to CE lending and LEDS include
Lack of direct encouragement, involvement, understanding, and commitment of
the private commercial lending industry to CE financing. Many lenders do not
understand renewable energy technology, Special Purpose Vehicles,46 and other innovations for
project finance. The staff of many domestic financial institutions interested in beginning CE
lending operations generally have not received formal project finance training and often lack
experience with complex transactions. Without this understanding, new areas are considered
risky and less likely to get funding or funding on competitive terms. Local banks need long-term,
on-site assistance in the sourcing and origination of projects, screening of these on their
technical merits, and the step-by-step process from analysis and credit decision to disbursement.
In-house project finance training based on actual projects is the preferred method to ensure a
bank’s ability to finance renewable energy projects.47
Limited credit product options and systems at private banks for marketing and
financing of CE. Without active interest in CE lending, most private banks do not have specific
finance products available or dedicated staff for this market. This leads to a lack of transparent
procedural and lending requirements and higher transactional costs for project developers.
Limited data on CE market size and profitable investment opportunities and data
on wind or small hydropower resource. National assessments have been conducted for
wind, solar, geothermal, and bioenergy in Central America, but many have not been
comprehensive. After key resources zones are identified through country-wide assessments,
46 A Special Purpose Vehicle is a legal entity created to fulfil narrow, specific or temporary objectives. They are typically used by
companies to isolate the firm from financial risk.
47 Project finance is the long-term financing of infrastructure projects based on projected cash flows from the project rather
than assets of its equity investors, also called “project sponsors”. Debt and equity are repaid from cash flows, with the project’s
assets as collateral. Project finance is a form of “off balance sheet finance” as it does not show up on the sponsors’ balance
sheets.

USAID CEADIR Project ECAM Clean Energy Financing and LEDS: Initial Status Report 64
site-specific assessments and feasibility studies are still needed. In some cases, public utilities
possess detailed resource assessments for various renewable resources, but these are not made
available to other energy developers. The desirable restructuring processes undertaken in
several markets altered the perceived interests of major actors, limiting their willingness to
share information about potential projects.
Public-private partnerships for scoping renewable resource potential can bolster
joint development efforts such as tendering of renewable electricity capacity. The
amount and quality of information available about renewable energy resources in the region are
uneven, geographically and across sectors.
Lack of capacity for developing integrated technical solutions. Energy sector regulator
and utility development of renewable energy assets requires assessment of integrated solutions.
Hydro, solar, and wind power require careful planning to ensure that baseload demand are met
and overproduction is avoided. For large-scale, grid-connected renewables, regulators and grid
operators should consider integration within countries and the potential for trade across
countries. It is also important to continue to integrate renewable energy and energy efficiency
efforts. Utilities need to consider how different intermittent renewables can complement each
other and non-renewables.
Time-consuming procedures. The streamlining of procedures is often complicated by a lack
of capacity in lead institutions as well as the involvement of multiple agencies. In addition to
reducing the overall stages for project permitting, a “one-window stop” for project developers
can be a useful approach for making project approval less time-consuming and less costly.
Insufficient regulatory frameworks to promote the introduction of renewable
energy sources that require relatively high initial investment costs. Feed-in tariffs and
quota obligations—policies responsible for the majority of installed capacity around the world—
are largely lacking in the region. While most Central American countries have one or two of
these policies in place, in most cases these measures are either underdeveloped or not fully
implemented. One critical element that is missing in today’s regulatory framework is the
absence of significant economic incentives for the production of electricity from renewable
resources. The measures adopted have tended to feature fiscal incentives such as tax and
import-duty exemptions, as opposed to the feed-in tariff arrangements favored in many
European countries or the portfolio standards typically adopted in the United States, and these
incentives have been insufficient. Policymakers should seek advice on international best practices
when developing and reforming renewable energy policies.
Inadequate capacity in research, public awareness, and the private sector. Capacity-
building efforts are needed to expand research, education, and training of renewable energy
professionals, identified as a critical gap by CNE/JICA (2012). Public awareness campaigns are
also essential to educate Central Americans about renewable options and to strengthen political
support for a regional energy transition. In the private sector, greater awareness of renewable
energy potentials, technologies, and incentives is needed on the part of energy developers and
investors. The capacity of banks to understand the value proposition of different renewable
energy technologies needs to be improved; at the same time, renewable energy developers
should have greater understanding of the information that banks need to approve a loan.
Legal and financial frameworks that may be inadequate to accomplish CE targets. El
Salvador, Guatemala, and Honduras have adopted national and regional CE targets, yet it
remains unclear whether the existing legal and financial frameworks are adequate to achieve
them. To track progress toward these targets, qualitative and rigorous monitoring and
evaluation should be conducted on an annual basis.
Small market size. The limited size of the national power sectors of the seven countries is an
important constraint. While clearly this is true in numerous sectors throughout the region and
not just in renewable energy, this problem does tend to accentuate the challenges facing

USAID CEADIR Project ECAM Clean Energy Financing and LEDS: Initial Status Report 65
renewable energy projects on the basis of their cost relative to other generation technologies.
The challenge of small market size is also well understood, and increasing the size of the regional
market is an important element of the rationale behind the integration of a regional market.
Electricity markets designed for fossil fuels. In many countries the electricity markets
were developed during a period when only fossil fuels were available and thus are designed for
fossil fuels. For example, in Guatemala, the electricity services sold on the wholesale market
(mercado mayorista) are power and capacity. Intermittent resources such as wind would not
receive a capacity payment under the current system, while energy is priced at short-run
marginal cost. Hence, in the absence of any specific pricing arrangements for wind power, wind
cannot compete economically with other resources. There is also evidence that generators in
the country with conventional facilities are lobbying to open future tenders, such as one that has
been announced for the purchase of 700 MW of renewable energy generation, to the
participation of conventional technologies.
Inadequate planning and support and legal framework for geothermal energy. Like
most countries in the region, Guatemala has considerable geothermal potential. However, this
resource has been underutilized in the country because of a combination of legal and
administrative problems that compound the intrinsic financial challenges associated with
development geothermal resources. Indigenous communities often live in areas with geothermal
potential in Guatemala. Under the Constitution, the central government owns subsurface
resources. However, the risk of potential conflict over land property slows the pace of
development because INDE must take the lead in securing land in resource-rich areas (USAID,
2010).
5.2 DONOR ACTIVITY
The European Union and the Governments of Finland and Austria have funded a regional Energy and
Environment Partnership with Central America. Since its creation in 2002, this partnership has invested
nearly €14 million (US$ 18 million) in 284 projects, mostly small-scale and community organization led
(Dolezal, et al., 2013).
ARECA is a joint program funded through BCIE, UNDP, and the Global Environment Facility that
supports renewable energy investment through a series of market studies, guidelines, and other tools.
ARECA has established a Program of Partial Loan Guarantees for projects under 10 MW, which
reinforces guarantee coverage from BCIE’s intermediary financial institutions, the local banks that
disburse the loans to project developers. By early 2013, the program had supported the development of
ten projects, totaling 38.7 MW, and identified 30 potential projects to be included in its partial loan
guarantee program for 2013–14. Further efforts are needed to communicate how many loan guarantees
have been made through this program, at what amounts, and their success rates (Dolezal, et al., 2013).
USAID has been providing important assistance in the region in the areas of energy and low-emission
development strategies. The U.S. Government has supported renewable energy development in Central
America, including through Private Financing Advisory Network (PFAN), the Regional Clean Energy
Investment Initiative (RCEII) and the Regional Clean Energy Initiative (RCEI).
An important barrier to local lending in Central America for renewable energy is the lack of information
and knowledge. First, small power plant developers often lack the capacity to present bankable
proposals to financial institutions and bank officials may lack the technical knowledge to assess the value
proposition and risks. PFAN, begun in 2008, is a multilateral, public-private partnership initiated by the
Climate Technology Initiative (CTI), in cooperation with the Expert Group on Technology Transfer of
the United Nations Framework Convention on Climate Change. PFAN bridges the gap between

USAID CEADIR Project ECAM Clean Energy Financing and LEDS: Initial Status Report 66
investors and CE businesses. This network assists developers with mentoring and deal facilitation to
develop investment ready-projects. It then connects these developers with investors one-on-one and at
special investment forums. CTI-PFAN has helped dozens of projects to raise capital, resulting in over
$500 million of investments globally. In addition, regional operations such as ARECA and GIZ’s 4E
program are attempting to fill this gap.
In March 2012, USAID launched RCEI to build on PFAN’s experience, expanding coverage in Central
America. In fact, as part of RCEII in Central America, USAID co-financed the Central American Forum
for Clean Energy Financing (CAFCEF) in October of 2014, in Antigua, Guatemala. By bringing together
CE project developers and financial sector representatives, CAFCEF aimed to fill the so-called “missing
middle” between promising CE projects and the debt and/or equity capital financing needed.
RCEI has been helping Central American countries to improve the enabling environment for CE
development and to reduce energy consumption through energy efficiency measures in the region. RCEI
is a two-year base program with three option years that end in 2016. The purpose is to improve the
investment climate for CE development by
Harmonizing regional regulatory and trade policy to optimize the use of the SIEPAC [Sistema de
Interconexión Eléctrica de los Países de América Central/Central American Electrical Interconnection
System], mainly by strengthening procurement processes.
Designing and promoting financial incentives for energy efficiency investments and training
industry groups, government officials, and other stakeholders on energy efficiency.
In addition, the Development Credit Authority (DCA) has an agreement with Citibank in Central
America to reduce the risk of lending for CE projects.
The Deutsche Gesellschaft für Internationale Zusammenarbeit (GIZ) is implementing a Renewable
Energies and Energy Efficiency in Central America program. Its objective is to improve the investment
climate and the institutional and human resources prerequisites for the promotion of renewable energies
and energy efficiency, and for climate protection measures. The program is active in Costa Rica, El
Salvador, Guatemala, Honduras, Nicaragua, and Panama. It strengthens regional organizations and
platforms, in particular SICA, and promotes regional exchanges to improve conditions for renewable
energies and energy efficiency measures. In cooperation with the private sector, the program helps
increase the number of renewable energy and energy efficiency projects in the region. It also develops
education courses and dialogue processes for decision makers and managers from ministries and public
administration.48
The Inter-American Development Bank has provided important technical assistance and financing to El Salvador, Guatemala, and Honduras. In October of 2014, IADB’s project database showed eight projects
in preparation or implementation phases in the three countries (Table 19).
48 http://www.energias4e.com/elprograma.php
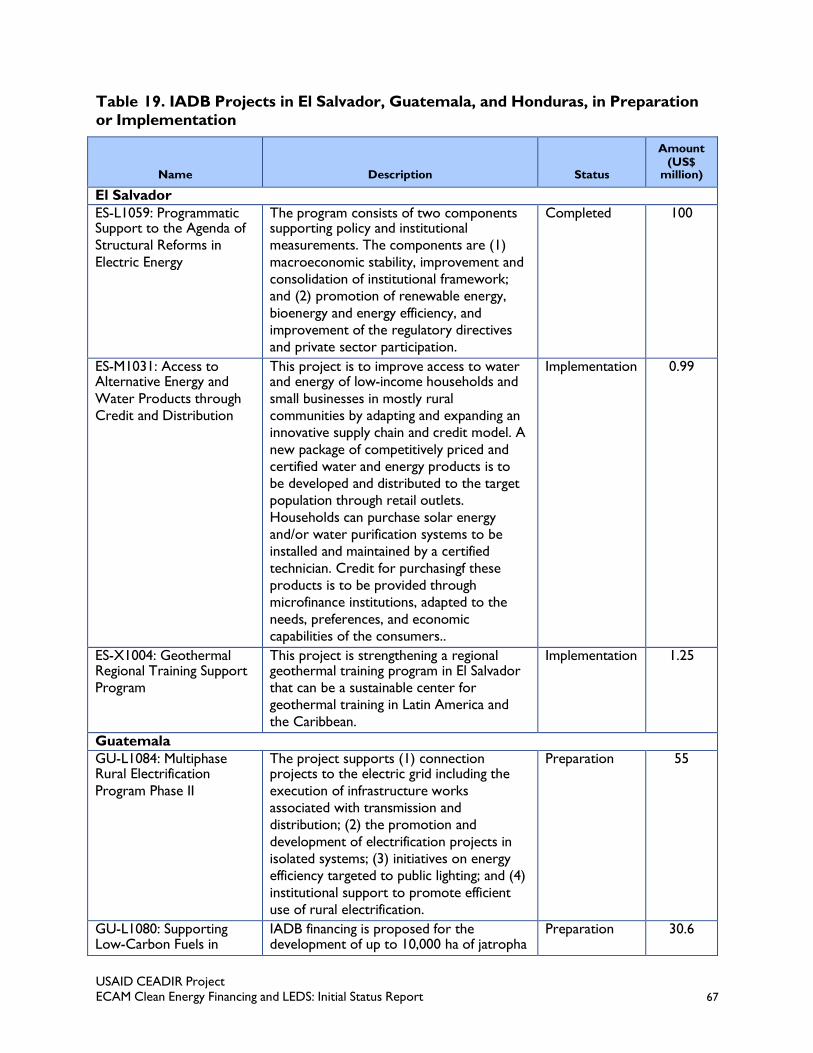
USAID CEADIR Project ECAM Clean Energy Financing and LEDS: Initial Status Report 67
Table 19. IADB Projects in El Salvador, Guatemala, and Honduras, in Preparation
or Implementation
Name
Description
Status
Amount (US$
million)
El Salvador
ES-L1059: Programmatic Support to the Agenda of
Structural Reforms in
Electric Energy
The program consists of two components supporting policy and institutional
measurements. The components are (1)
macroeconomic stability, improvement and
consolidation of institutional framework;
and (2) promotion of renewable energy,
bioenergy and energy efficiency, and
improvement of the regulatory directives
and private sector participation.
Completed 100
ES-M1031: Access to Alternative Energy and
Water Products through
Credit and Distribution
This project is to improve access to water and energy of low-income households and
small businesses in mostly rural
communities by adapting and expanding an
innovative supply chain and credit model. A
new package of competitively priced and
certified water and energy products is to
be developed and distributed to the target
population through retail outlets.
Households can purchase solar energy
and/or water purification systems to be
installed and maintained by a certified
technician. Credit for purchasingf these
products is to be provided through
microfinance institutions, adapted to the
needs, preferences, and economic
capabilities of the consumers..
Implementation 0.99
ES-X1004: Geothermal Regional Training Support
Program
This project is strengthening a regional geothermal training program in El Salvador
that can be a sustainable center for
geothermal training in Latin America and
the Caribbean.
Implementation 1.25
Guatemala
GU-L1084: Multiphase Rural Electrification
Program Phase II
The project supports (1) connection projects to the electric grid including the
execution of infrastructure works
associated with transmission and
distribution; (2) the promotion and
development of electrification projects in
isolated systems; (3) initiatives on energy
efficiency targeted to public lighting; and (4)
institutional support to promote efficient
use of rural electrification.
Preparation 55
GU-L1080: Supporting Low-Carbon Fuels in
IADB financing is proposed for the development of up to 10,000 ha of jatropha
Preparation 30.6
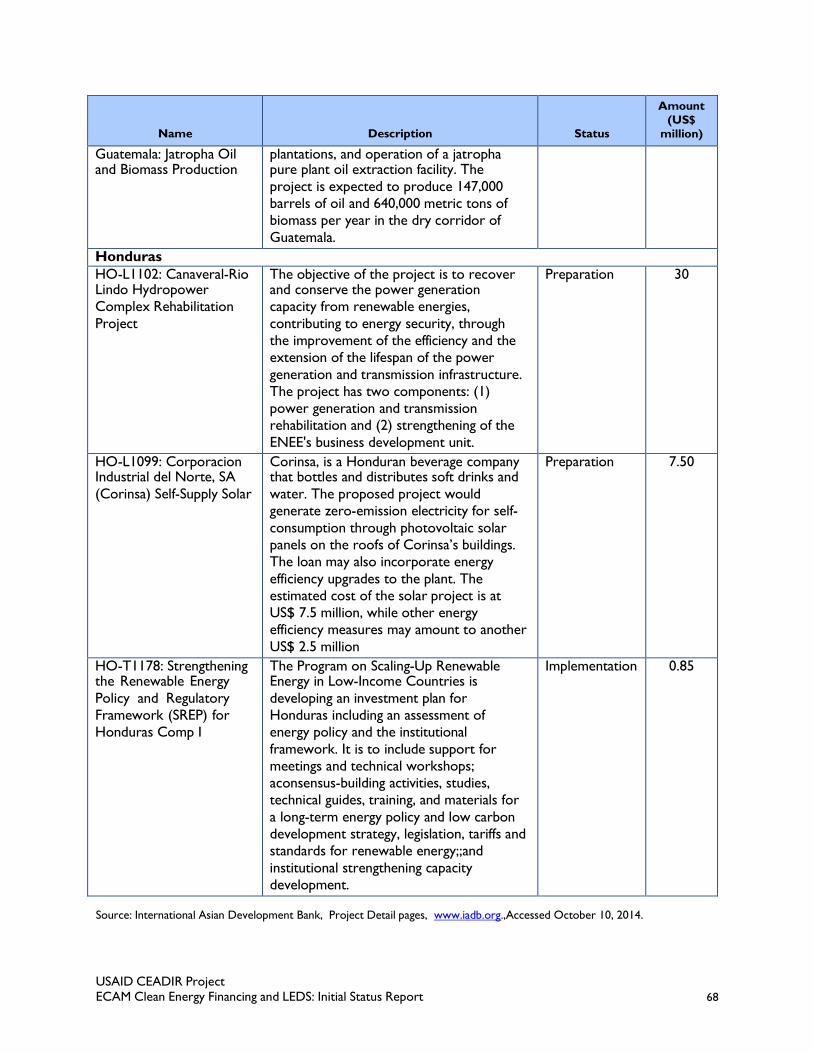
USAID CEADIR Project ECAM Clean Energy Financing and LEDS: Initial Status Report 68
Name
Description
Status
Amount
(US$
million)
Guatemala: Jatropha Oil and Biomass Production
plantations, and operation of a jatropha pure plant oil extraction facility. The
project is expected to produce 147,000
barrels of oil and 640,000 metric tons of
biomass per year in the dry corridor of
Guatemala.
Honduras
HO-L1102: Canaveral-Rio Lindo Hydropower
Complex Rehabilitation
Project
The objective of the project is to recover and conserve the power generation
capacity from renewable energies,
contributing to energy security, through
the improvement of the efficiency and the
extension of the lifespan of the power
generation and transmission infrastructure.
The project has two components: (1)
power generation and transmission
rehabilitation and (2) strengthening of the
ENEE's business development unit.
Preparation 30
HO-L1099: Corporacion Industrial del Norte, SA
(Corinsa) Self-Supply Solar
Corinsa, is a Honduran beverage company that bottles and distributes soft drinks and
water. The proposed project would
generate zero-emission electricity for self-
consumption through photovoltaic solar
panels on the roofs of Corinsa’s buildings.
The loan may also incorporate energy
efficiency upgrades to the plant. The
estimated cost of the solar project is at
US$ 7.5 million, while other energy
efficiency measures may amount to another
US$ 2.5 million
Preparation 7.50
HO-T1178: Strengthening the Renewable Energy
Policy and Regulatory
Framework (SREP) for
Honduras Comp I
The Program on Scaling-Up Renewable Energy in Low-Income Countries is
developing an investment plan for
Honduras including an assessment of
energy policy and the institutional
framework. It is to include support for
meetings and technical workshops;
aconsensus-building activities, studies,
technical guides, training, and materials for
a long-term energy policy and low carbon
development strategy, legislation, tariffs and
standards for renewable energy;;and
institutional strengthening capacity
development.
Implementation 0.85
Source: International Asian Development Bank, Project Detail pages, www.iadb.org.,Accessed October 10, 2014.

USAID CEADIR Project ECAM Clean Energy Financing and LEDS: Initial Status Report 69
MEM’s website listed two additional IADB-supported projects in Guatemala. The Environmental and
Social Management and Private Sector Participation Program for the Development of Renewable Energy
Sources in Guatemala has a US$ 0.5 million budget. It aims to support the preparation of Strategic
Environmental and Social Assessments of hydropower projects, support for policy development, and
support to MEM’s Geographic Information System and Communication and Dissemination Strategy. The
US$ 0.5 million Biofuels Action Plan consists of the development of studies to support decision making
for the development of a national biofuel production and consumption program.49
In October 2014, the World Bank’s project database lists only two projects in Honduras and no
projects in either Guatemala or El Salvador (Table 20).
The Japanese International Cooperation Agency finances the Promotion of Productive Activities with
the Use of Clean Energies in Northern Villages project. JICA provided a US$ 11 million grant to
Guatemala to increase incomes of more than 1,000 households through the construction of micro-
hydroelectric plants and distribution systems in high-poverty regions of the Alta Verapaz municipality.50
49 http://www.mem.gob.gt/viceministerio-del-area-energetica-2/proyectos/
50 http://www.mem.gob.gt/viceministerio-del-area-energetica-2/proyectos/

USAID CEADIR Project ECAM Clean Energy Financing and LEDS: Initial Status Report 70
Table 20. World Bank Active Projects in Honduras
Name Description Status Amount
Power Sector Efficiency
Enhancement
Project
The objective is to improve ENEE's operational and financial performance , for contributing to
the sustainability of power production and
distribution.
Active 42.3
La Esperanza Hydroelectric
Project
The objective is to support a small, 12MW hydroelectric project in La Esperanza through
purchasing GHG emission reductions. There are
two components to the project, the first
component being delivery of carbon emission
reductions as a byproduct of electricity
generation. La Esperanza is expected to reduce
annual GHG emissions by 39,000 tCO2
equivalent. The Community Development
Carbon Fund (CDCF) will purchase a total of
310,000 tCO2 emission reductions at ae price of
US$ 4.50. The minimum annual delivery will be
30,000 tCO2 per year, but CDCF will purchase
all annual emissios reductions up to a cumulative
total of 310,000 tCO2. The total payment for the
reduced emissions will be US$ 1.4 million. This
total does not include recovery of project
preparation expenses such as those related to the
baseline establishment, validation, monitoring,
verification, and certification. These will be
deducted annually up to the cumulative maximum
of US$ 125,000. The second component is the
delivery of environmental and social community
benefits. The payments for the emission
reductions are directly linked to the sponsor's
meeting the conditions set in the community
development plan. These include: (1) full-time
employment of at least 70 permanent residents of
La Esperanza and surrounding communities during
the construction phase; and (2) full-time
employment of at least 20 permanent residents of
La Esperanza and surrounding communities during
plant operation (through December 31, 2012).
Active 1.4
Source: International Asian Development Bank, Project Detail pages, www.iadb.org.,Accessed October 10, 2014.

USAID CEADIR Project ECAM Clean Energy Financing and LEDS: Initial Status Report 71
6. INITIAL NEEDS ASSESSMENT ISSUES The purpose of the desktop study is to provide a review of publicly available information on the capacity
of local financial institutions in Central America for and barriers to scaling up of CE lending. In addition,
the report provides background information on the enabling environments and LEDS planning that
supports CE lending. It also covers the potential for various forms of renewable energy, projects in the
pipeline, and the current sources of financing. With a review of barriers to CE lending and current
activities by donors we provide some ideas for potential additional support that contribute to the
mobilization of finance without duplicating other efforts.
There is information we were not able to find and thus intend to gather through direct conversations
with local financial institutions, project developers, and government officials. This information includes
the status of modeling capabilities for LEDS programming, gender impacts on utility scale energy, and
what local financial institutions, developers, and government officials perceive as the primary barriers to
CE financing. After the interviews with local financial institutions and other stakeholders we will have a
fuller understanding of the key barriers to CE lending and the work being done by other donors. We
are eager to get their perceptions of the assistance that would be most beneficial to them and
incorporate them into our analysis and recommendations.
Our investigation of the policy environment in El Salvador, Guatemala, and Honduras showed that a
great deal of effort has gone in to improving the enabling environment, with the possible of energy
efficiency. In each country there is legislation to promote energy efficiency written but not yet passed.
These three countries also have tremendous renewable energy resources and unexploited potential.
There are energy efficiency measures with negative costs. Central America’s energy intensity, however,
has fallen less than the global average.
Between the improvements in the enabling environment and the large renewable energy potential it is
unsurprising that investment in renewable energy investment has been significant. In examining the
project pipeline tracked by BNEF we have determined that there are many large scale renewable energy
projects being funded. BNEF tracks large investments that meet a size threshold of at least 1 MW or
US$ 1million. The vast majority of the lending involved is arranged by international or regional
development banks with the exception of Banco de Desarrollo de El Salvador, a public sector bank that
offers a specific credit line for renewable energy; Banco Lafise Honduras, which offers financial services
in the Central American and Caribbean region; and Banco Financiera Comercial Hondurena, offering
corporate and consumer banking products.
Based on the findings of this desktop study, we have identified the following areas that require further
investigation during the in-country Needs Assessment.
Solicit input from senior and operational managers at local financial institutions on the perceived
advantages, risks, and opportunities associated with CE lending and their needs;
Determine the FIs’ lending requirements (loan size, sectors, maximum of minimum lending
criteria), lending processes, and credit product development path(s);
Assess existing successful and identify potential financial instruments that would scale-up and/or
reduce perceived risks of CE lending;
USAID CEADIR Project ECAM Clean Energy Financing and LEDS: Initial Status Report 72
Analyze the perceived attitudes towards CE lending of the FIs about the current enabling
environments and explore recommendations for removal of any barriers;
Inquire about interest in lending to the geothermal sector;
Determine the short versus long-term capitalization requirements, debt securitization, available
loan guarantees, participation with other FIs (impact investors, micro-financing institutions,
development banks) that help mitigate lending risks;
Perform a cursory market diagnostic of the capability of local financial institutions on CE lending;
based on an existing bank-capacity CE lending survey tool developed by Enclude Solutions, Ltd.;
Analyze and incorporate into interviews involvement of vulnerable populations (indigenous
people, women) financial institution outreach and CE lending programs; and,
Interview national, regional, and international development bank representatives and
representatives of other actual or potential CE lenders to determine their current or planned
involvement in the market and with commercial lending institutions.
Discuss with USAID, host country governments, CE trade associations, project developers and
other CE market actors the current incentives and disincentives for increasing CE lending by the
commercial sectors;
Identify current and planned use of modeling for CE and LEDS planning at the national levels;
Solicit recommendations for linking LEDS planning to CE financing from policy makers and
financiers to ensure compatibility of market signals with national climate change goals; and,
Analyze the roles for vulnerable populations and women in local and national planning initiatives
and CE project development.
At the conclusion of the Needs Assessment, the CEADIR team will present options for technical
assistance in the form of knowledge dissemination, networking, and training to build capacity of financial
institutions for the purpose of facilitating the mobilization of private and public investment in CE in
Central America to reduce GHG emissions.
6.1 POTENTIAL INTERVENTIONS
Based on a review of the remaining barriers to CE investment and the activities underway by USAID and
other donors, we have developed preliminary ideas of potential interventions to assist in mobilizing
financing for CE activities to reduce GHG emissions and promote economic growth. These are initial
concepts to be explored with the mission and local stakeholders.
Potential interventions for CE financing and LEDS include:
Direct, hands-on, embedded capacity development for commercial lenders.
Embedded capacity, or technical assistance that is co-located with the commercial lenders and
exclusively dedicated to this area, allows “learning-by-doing” and allows the banks to understand
market opportunities, credit development needs of the CE markets, and how to properly
evaluate projects. Although this form of assistance is more expensive than training sessions, it
ensures that the assistance is available exactly when needed and increases confidence by lenders
in their analysis.
Capacity development tailored to commercial and potentially national
development banks’ and project developers’ needs to mobilize lending to this
emerging CE market.

USAID CEADIR Project ECAM Clean Energy Financing and LEDS: Initial Status Report 73
Information dissemination of CE market assessments to build a publicly available,
internet accessible repository of existing CE markets, including resource
assessments.
Support of development of standardized Purchase Power Agreements (PPAs) to
increase transparency and decrease transaction time and cost for all parties.
Internal market diagnostics of selected DCA approved financial institutions and
other interested lenders to assess capabilities and develop products for CE lending.
Roll out the USAID Clean Energy Lending Toolkit to interested lending institutions.
Development of a CE investor guide with project, financial lender, and bankable
policy needs toolbox.
Facilitate training for integrated technical solutions, electric power modeling,
economic analysis, and LEDS preparation.
Identification of good practices and assessments of tools such as quotas and feed-in tariffs.
Increase bank access to USAID/DCA guarantees as well as long-term financing to
increase their capacity to support CE project development.
Support the establishment of M&E frameworks. Mexico’s Special Program on Climate
Change developed an online system to track approximately 300 climate change mitigation and
adaptation goals. Establishment of a monitoring framework could help other countries learn
whether they are on target to meet their goals, and whether approaches should be replicated.
In terms of mobilizing finance for CE, there are three key areas of concern. First, it is unclear when the
legislation promoting energy efficiency will be passed and how the financial markets will respond to the
opportunity. Energy efficiency is typically an area of missed opportunities. Second, the financing is largely
taking place without the participation of local banks, reducing the local benefits of CE investments and
displaying a dependence on external development institutions rather than an integrated, competitive
private market. Finally, it is unclear whether the increased investment in CE will be sufficient to meet the
projected increases in energy demand without continued effort by external donors, or whether these
countries will turn to fossil fuels for new capacity, increasing GHG emissions. Fortunately, there is
donor activity in each of these activities. An exception is in providing hands-on, direct technical
assistance and capacity development to local financial institutions.
USAID Clean Energy Lending Toolkit Case Study
Under the USAID Analysis and Investment for Low-Emission Growth (AILEG) project, Enclude Solutions and Abt Associates prepared a Clean Energy Lending Toolkit that provides guidance to banks to loan to businesses seeking to
modify their existing energy matrix and move toward clean, renewable, viable, and efficient technologies. While clean
energy loans can be a profitable specialized financing area, financial institutions may need support in assessing the
profitability of clean energy opportunities in their service territories and developing the internal systems, credit products,
and resources needed to prudently serve this new market.
USAID launched the pilot-testing of the Clean Energy Lending Toolkit to its partner Liberian banks under the USAID
Development Credit Authority (DCA). With the International Bank of Liberia and Ecobank participating, USAID/Liberia
and Enclude/Abt worked to support the pilot testing of the Toolkit in Liberia, as well as to conduct a formal CE lending
workshop and renewable energy pipeline analysis for the banks in March/April 2014. The pilot test found strong interest
in continuing training and application in Liberia as well as developing CE loan products and a pipeline of loans.

USAID CEADIR Project ECAM Clean Energy Financing and LEDS: Initial Status Report 74
6.2 INITIAL LIST OF ORGANIZATIONS TO MEET WITH
DURING THE NEEDS ASSESSMENT
This section includes an initial list of organizations we hope to meet with during the Needs Assessment.
Additional local banks, institutions of higher education, and civil society groups will be identified when
the Needs Assessment trip is approved.
El Salvador
Banco de Desarrollo del El Salvador, national development bank
Consejo Nacional de Energía, energy regulator
Alianza en Energía y Ambiente con Centroamérica, organization to promote sustainable energy and
technology
Asociación Salvadoreña de Energías Renovables, association of renewable energy generators and
developers
UDP Neoen-Almaval, renewable energy developer
UDP Proyecto La Trinidad, renewable energy developer
Guatemala
Asociación de Combustibles Renovables, association for biomass developers
Asociación de Generadores con Energía Renovables, association for renewable enegy producers
Banco Centroamericano de Integración Económica, regional development bank
Inversiones Atenas, hydroelectric developer
Republica de Guatemala Ministerio de Energia y Minas, the ministry of energy and mines
Honduras
Banco Nacional de Desarrollo Agrícola, national development bank
Banco Atlántida, bank engaged in mid-scale renewable energy lending
Asociación Hondureña de Productores de Energía Renovable, association of renewable energy
developers
Soluz, PV installer

USAID CEADIR Project ECAM Clean Energy Financing and LEDS: Initial Status Report 75
Banco Financiera Comercial Hondurena, lead debt arranger for small hydro plant
Empresa Nacional de Energia Electrica, state owned commercial power company
Grupo Terra, family controlled company with three renewable energy projects permitted or in under
construction

USAID CEADIR Project ECAM Clean Energy Financing and LEDS: Initial Status Report 76
REFERENCES Alves, Lilian, Associate, Latin America, BNEF (Bloomberg New Energy Finance). January 5, 2015, private
communication with Gwendolyn Andersen, Abt Associates, January 5, 2015
BNEF (Bloomberg New Energy Finance). 2014. H2 2014 Mexico and Central America Market Outlook. In
the midst of transformation. 31 July 2014.
BNEF (Bloomberg New Energy Finance). 2014b. H2 2014 Geothermal Market Outlook. With a safety net,
will geo take a leap? 28 August 2014.
CEAC (Consejo de Electrificación de América Central). 2012. Plan Indicativo Regional de Expansión de la
Generación. Periodo 2012-2027. San Salvador: CEAC.
CEPAL (Comisión Económica para América Latina y el Caribe). 2007. Estrategia Energética Sustentable
Centroamericana 2020. México, D.F.: CEPAL.
CEPAL (Comisión Económica para América Latina y el Caribe). 2009. Análisis General de las Externalidades
Ambientales Derivadas de la Utilización de Combustibles Fósiles en la Industrial Eléctrica Centroamericana.
Chile: CEPAL.
CEPAL (Comisión Económica para América Latina y el Caribe). 2013. Centroamérica y República Dominicana:
Estadísticas de Hidrocarburos, 2012. Chile: CEPAL.
CEPAL (Comisión Económica para América Latina y el Caribe). 2014. Centroamérica: Estadísticas de Producción
del Subsector Eléctrico, 2013. Chile: CEPAL.
CEPAL (Comisión Económica para América Latina y el Caribe). 2014b. Energy Efficiency in Central America:
Progress and Action Towards the Fulfillment of the Goals of the Central American Sustainable Energy
Strategy, 2013. Chile: CEPAL.
CNE (Consejo Nacional de Energía, El Salvador). 2010. Política Energética Nacional. San Salvador: CNE.
CNE (Consejo Nacional de Energía, El Salvador). 2014. Plan Indicativo de la Expansión de la Generación
Eléctrica de El Salvador 2014–2024. San Salvador: CNE.
CNE/JICA (Consejo Nacional de Energía/Japanese International Cooperation Agency). 2012. Plan Maestro
para el Desarrollo de la Energía Renovable en El Salvador. San Salvador: CNE/JICA.
CNEE (Comisión Nacional de Energía Eléctrica). 2012. Resumen de Acciones en Materia de Eficiencia
Energética. Guatemala: CNEE.
Climate Policy Initiative, 2013. The Challenge of Institutional Investment in Renewable Energy. Available
online at http://climatepolicyinitiative.org/wp-content/uploads/ 2013/03/The-Challenge-of-
Institutional-Investment-in-Renewable-Energy.pdf. DGE (Dirección General de Energía). 2009. Balance Energético 2009. Tegucigalpa: DGE.

USAID CEADIR Project ECAM Clean Energy Financing and LEDS: Initial Status Report 77
Dolezal, A., Majano, A.M., Ochs, A., and Palencia, R. 2013. The Way Forward for Renewable Energy in
Central America. Washington, DC: Worldwatch Institute.
EENE (Empresa Nacional de Energía Eléctrica). 13 June 2014. Escenario Base Final Proyeccion de Demanda de
Energía Eléctrica 2014-2028 Sistema Interconectado Nacional: ENEE. Accessed October 9, 2014, from
http://www.enee.hn/planificacion/2014/resumen%20proyeccion%20demanda%20honduras.pdf
FOMIN and BNEF (Fondo Multilateral de Inversiones and Bloomberg New Energy Finance). 2013. Climascopio 2013. Nuevas Fronteras para las Inversiones en Energía de Bajas Emisiones de Carbono en
América Latina y el Caribe. Washington, DC: FOMIN.
International Monetary Fund. 2013. Energy Subsidy Reform: Lessons and Implications. Washington, DC:
International Monetary Fund.
MEM (Ministerio de Energía y Minas). 2013. Política Energética 2013–2027. Guatemala: MEM.
MEM (Ministerio de Energía y Minas). N.D. Estadísticas Energéticas Subsector Eléctrico 2013. Guatemala:
MEM.
NREL (National Renewable Energy Laboratory). N.D. Solar and Wind Energy Resource Assessment.
“Central America Wind Energy Resource Mapping Activity.” Accessed October 9, 2014, from
http://en.openei.org/datasets/files/713/pub/camwindreport_242.pdf.
Uclés, O., El Heraldo.hn. ENEE: Apagones serán de cuatro horas diarias en toda Honduras, 6 August 2014,
Accessed October 9, 2014, from http://www.elheraldo.hn/inicio/735674-331/enee-apagones-
ser%C3%A1n-de-cuatro-horas-diarias-en-toda-honduras
USAID (United States Agency for International Development). 2010. Promoting Sustainable Energy
Integration in Central America. Assessment for USAID/El Salvador and USAID Central America and
Mexico Regional Program. Washington, DC: Nexant, Inc.
World Bank. 2010. América Central: Estudio Programático para el Sector Energético, Módulo de Aspectos
Generales y Opciones. Energy Sector Management Assistance Program (ESMAP). Washington, D.C.:
The World Bank.
World Bank. 2012. Drilling Down on Geothermal Potential: An Assessment for Central America. Washington,
DC: The World Bank.