critical factors for bioenergy technology implementation
TRANSCRIPT

SE 9907V69SE9907469
Critical Factors for bioenergytechnology implementationFive case studies of bioenergy marketsin the United States, Sweden and Austria
3 1 / 40ER 30:1998
Swedish NationalEnergy Administration

Please be aware that all of the Missing Pages in this document wereoriginally blank pages

Critical Factors for bioenergytechnology implementation
Five case studies of bioenergy marketsin the United States, Sweden and Austria
Anders Roos
ER 30:1998
Swedish NationalEnergy Administration
Swedish National Energy AdministrationBox 310, SE-631 04 Eskilstuna, Sweden
Visitors: Kungsgatan 43Phone: +46 16 544 20 00. Fax: +46 16 544 20 99

Books and reports published by the SwedishNational Energy Administration may beordered from NUTEK Forlag.Order fax: +46-8-681 92 05Order phone: +46-8-681 92 98e-mail: [email protected]
© Swedish National Energy AdministrationPrint run: 1 000 copies
ER 30:1998
ISSN 1403-1892

DISCLAIMER
Portions of this document may be illegiblein electronic image products. Images areproduced from the best available originaldocument.

PrefaceThe work resulting in this report was initiated under the IEA Bioenergy Agreement,Task XII, Activity: System Studies. The financing of the work was partly by IEA,partly by the SIMS Department at the Swedish University of Agricultural Sciences.
The scope of the report is to describe and analyse bioenergy activities that are carriedout under market conditions. The reasons for that focus were observations that theactual performance of bioenergy project deviate substantially from what was assumedin the pre-planning of the projects, especially in cases when the projects were operatingunder competitive market conditions. The difference is due to the flexibility in theperformance activities that are possible to apply in practice in a market, but whichnormally is far beyond the imagination of planners at the pre-planning stage.
As most planning models for bioenergy deal with pre-planning of projects, it was feltthat also experience from market performance of bioenergy activities should beanalysed systematically. In practice, the method applied was to draw conclusions outof case studies. Five markets were identified, two in the USA, two in Sweden, and onein Austria.
The author, Anders Roos at SIMS, and the members of the IEA Activity XII:4, RobinL. Graham, Bo Hektor and Christian Rakos hope that the distribution of this report willcontribute to widen the planning paradigms with regard to bioenergy.
Uppsala, June 22 1998Bo HektorResearch Leader Bioenergy, SIMS

Contents
1 Introduction 91.1 Background and Objective 91.2 Theory and Method 101.3 Acknowledgement 11
2 Bioenergy technology implementation 132.1 Barriers and Drivers 132.2 Market Structure 172.3 Energy Policy 17
3 The energy sectors in the United States, Sweden and Austria 213.1 The Energy Sector in the United States 213.2 The Energy Sector in Sweden 313.3 The Energy Sector in Austria 40
4 The case studies 474.1 Pellets in New Hampshire - 474.2 Biomass Power in Maine 554.3 Pellets in Goteborg, Sweden 664.4 District Heating in Enkoping, Sweden 734.5 Biomass District Heating in Austria 77
5 Discussion 815.1 Critical Factors to Bioenergy Market Development 815.2 The Framework 815.3 Application of the Framework in Cases Studies of Existing Bioenergy
Markets 855.4 Recommendations 91
Literature 95

Abstract
This report analyses the driving forces of, and barriers to, biomass energy technologyimplementation with the objectives of defining the most important factors behind thegrowth of bioenergy markets and suggesting strategies for policymakers and investors.The approach is to describe the important factors for the development of real bio-energy markets at two levels: (1) Institutional, primarily policy, and (2) market struc-ture. Concepts from economic theory, primarily transaction cost theory and industrialorganization, are used in a qualitative way. The report is based on literature studies andfield studies of bioenergy markets in three countries: the United States of America,Austria, and Sweden. It is divided into five sections. After the introduction in sectionone, literature with relevance for this study is reviewed in section two. In section threethe energy policy and energy sectors of each country are described. The descriptionsinclude an overview of the biomass energy sectors. Five cases of developed bioenergymarkets in the three countries are presented in section four. The cases are residentialheating with wood pellets in New Hampshire, United States, biomass powerproduction in Maine, residential heating with pellets in Sweden, biomass districtheating in Sweden, and biomass district heating in Austria. All markets are describedin terms of the historical development, technical issues, economics, market structureand local policy influences. In the discussion in section five a number of key factorsbehind the success or failure of bioenergy are presented. Six factors are mostimportant: 1) Complementarities between the bioenergy operations and anotheractivity (for instance when the bioenergy production uses biomass waste products fromanother industry); (2) economies of scale within the bioenergy business through largerproduction series, standards, specialization etc.; (3) a competitive bioenergy market(Many sellers and buyers operate in the market and prices and contracting practices areallowed to vary) (4) competition from other energy forms, fossil, nuclear, electric (Thefeatures of this competition are also important whether through cost reductions,quality, the execution of market power, or influence on energy policy); (5) a positivetreatment by the national government that means that a market is created, and atechnological "pull" situation appears, and 6) the attitude from local governments andlocal opinion can play an important role by promoting the industry and introducingregulations and control mechanisms that prevent negative side-effects of the activity.Analysis of these six factors helps policymakers or investors to make realisticassumptions about a bioenergy market potential and to make sound investmentdecisions for public or private money.Key words: Bioenergy markets, nontechnical barriers, driving forces, energy policy.

1 Introduction1.1 Background and ObjectiveThe biomass energy industry has great growth potential. The fuel is often cheap andabundant; many known and proven bioenergy technologies have been developed; andthe idea of using wood and other biomass for energy is well known to the public atlarge. Compared with some fossil energy technologies (e.g. coal) biomass energyproduces small emissions to the air and is almost CO2-neutral. Bioenergy industriescan also bring jobs and economic activity to local communities.
However, bioenergy technologies often have problems establishing themselves theenergy market. Lately an awareness of "nontechnical barriers" to bioenergyimplementation has increased. The issue has been addressed in several workshops,conferences and projects (for examples see AFB-Nett 1995, Medhurst et al. 1997, andspecial sections of the, 7th National Bioenergy Conference in Nashville, Anon. 1996,and Proceedings from the 9th European Bioenergy Conference in Copenhagen 1996,Chartier et al. 1996) and a wide spectrum of different nontechnical barriers has beenpresented. Studies have also been conducted in order to identify the common featuresof successful bioenergy projects (Sanderson et al. 1996, Muehlenfeld et al. 1996).Important factors for energy investments by energy consumers have been investigatedin a series of papers (Sutherland 1991, Berry 1993, Howarth and Anderson 1993,Nichols 1994). However, it is hard to find studies that present a structured frameworkof different nontechnical barriers for bioenergy market growth and focus on policy andmanagement implications. There are also few examples of empirical investigations ofthe existing bioenergy markets.
A focused and comparative study of existing bioenergy markets could help to identifythe general driving forces and barriers to the deployment of bioenergy technologies.More of this knowledge would help policymakers, professionals, and investors localizeand, in some instances, remove these nontechnical barriers. It would increase under-standing of the critical requirements for a bioenergy market to grow and therebyprevent expensive bioenergy programmes where there is little chance of success. Suchknowledge could guide decision makers in putting money and effort where they aremost productive, be it for resource inventories, market surveys, information collectionor information to consumers. In order to meet all these needs and requirements, thestudy should be general in scope covering different aspects of the bioenergy business.It should also be structured and based on a comprehensive theory of markets and

production. And finally, it should provide a useful tool to analyse different bioenergymarkets.
In order to study the critical factors, drivers and barriers, behind bioenergy marketdevelopment, a number of cases of developed bionenergy markets in the United States,Sweden, and Austria were studied. We have chosen to analyse some bioenergy sectorsthat have reached a size that allows examination of both the "triggering factors" andthe barriers to the development of bioenergy markets.
1.2 Theory and MethodSeveral factors complicate the study of emerging bioenergy industries. Information isnormally asymmetric. There are significant transaction costs for market search,measurement, and contracting, and the market is far from perfect. This motivates us touse theoretical models of information economics, transaction cost economics, newinstitutional economics, and industrial organization in this study. However, as theobjective is not to be formal and rigorous but rather to contribute to a broaderunderstanding of the problem area for policymakers and others, the theories are used ina qualitative way. Formal presentations on these models can be found in economictextbooks. What we have done is to describe some real bioenergy sectors in differentcountries using economic theories to pinpoint some especially critical factors for theirgrowth and competitiveness. The focus has been to present a consistent and usefulmodel for decision makers.
Explanations on nontechnical barriers to bioenergy technology implementationoriginating from the fields of psychology, sociology, or decision theory are notfrequently used in this work, mainly because they are special aspects of bioenergymarket growth that provide good explanations only to some special aspects of theissue. It is recognized, though, that in some instances these models can be of greatimportance. This is especially the case when peoples' perceptions and basic valuesexplain their energy choices. However, these questions merit separate and focusedresearch efforts.
The report is divided into the following sections:
A review of some earlier works that have relevance for this study. This section israther a sample than a comprehensive literature review.A description of the general energy and bioenergy sectors of the three countries, theUnited States, Sweden and Austria.
10

• Description of case studies.• Discussion.
1.3 AcknowledgementThe project has been financed by IEA-Bioenergy Agreement.A special thanks to Robin L. Graham, Christian Rakos, and Bo Hektor who havefollowed my work and provided valuable input at various stages. This study could nothave been finished without the help from people in the bioenergy sectors in the threecountries; Eddi Johansson, Norwood H. Keeney, James F. Connors, N. MichaelVoorhies, and many more.
11

2 Bioenergy technology implementation
This section gives some short descriptions of earlier works that have inspired thisreport. They are structured in three parts dealing with barriers and drivers, marketstructure, and energy policy.
2.1 Barriers and Drivers2.1.1 AFB-NettThe European Agriculture and Forestry Biomass Network (AFB-Nett 1995) is aEuropean Union (EU) project under the Altener program with the task of findingsolutions to existing problems for bioenergy in Europe. One part of this task was toidentify barriers to the deployment of bioenergy systems. AFB-Nett presents a largenumber of barriers to biomass technology implementation. The most importantbarriers are:
• A lack of understanding: Key persons (e.g., creditors, local policymakers, andinvestors) often know little about bioenergy and show a low interest in thesetechnologies. This means that misconceptions about bioenergy systems can prevailand fair assessments of the technologies' advantages and disadvantages are neverconducted.
• Uncertainty regarding availability of biomass resources: Before a market emerges itis often hard to predict if sufficient feedstock production will take place. This riskaspect may often prevent bioenergy market growth at an early stage.
• Risk for fanners: Farmers and other producers of biomass feedstock may, on theother hand, doubt whether there will be a stable biofuel market in the future.
• Utilities prefer status quo: Utilities often have the responsibility of providing energyto all inhabitants and industrial facilities in the area for reasonable prices. Thereforethey are often risk-averse and prefer to make long-term contracts for standardenergy technologies.
• Positive externalities are not accounted for: The negative environmentalexternalities for fossil technologies are difficult to assess correctly. Therefore suchcomparisons are often left out, to the disadvantage of biomass technology.
• Low fossil prices: Low and decreasing fossil prices constitute the fundamentalbarrier to the large-scale introduction of biomass energy systems.
• Environmental risks: Some biomass production systems may contain real orperceived environmental risks
13

• Financial and regulatory mechanisms: Institutional factors or regulatory rules maystop expansion of bioenergy technologies into new markets.
• Inconsistence in policy: Policy instruments are not synchronized.
Many of these barriers are institutional factors that could be removed if the policieswere stable, farsighted, and consistent. According to the AFB-Nett report, however, itis not possible to prescribe one particular policy measure to remove all these barriers.Efforts have to be adapted to the situation and stage of development in each country orregion.
2.1.2 International Energy Agency (IEA) Bioenergy Agreement: Tackling theNon-Technical Barriers to the Production and Use of Bioenergy (IEABioenergy Agreement, 1993)
The objectives of this workshop were to identify the principal non-technical barriers tothe development and implementation of bioenergy and to compare differentapproaches to these problems. Furthermore, the aim was to propose a role for the IEAto tackle these barriers. The types of barriers that were discussed are essentially similarto those that were identified in the AFB-Nett documentation, lack of knowledge andunderstanding at different levels, risk, regulations, inconsistent policies etc.
The IEA workshop participants noted in particular that bioenergy systems generallyinclude a long chain of stages from the initial growing of the stock to the final energycustomer. There are also long time scales associated with activities necessary togrowing a bioenergy crop, harvesting, and operating a plant. These time lags make thistype of investment extra sensitive to changing policies.
2.1.3 Common elements of successful biomass projectsIn Muehlenfeld et al.(1996) the authors identify some common elements of successfulindividual biomass operations. The success factors the authors find are:
• Access to Low-Cost Biomass Fuels: The fuels are in some instances produced as by-products on site. Other operations have large quantities of material accessible fromlocal forestry and logging operations.
• Continous On-Site Thermal Energy Requirements: The operations are big industriesor institutions with substantial on-site thermal requirements.
• Access to Special Financing Arrangements: Some of the cases that was studied bythe authors could be financed internally and some had a natural special financing
14

party. Generally, however, it is hard to find financing by banking institutions forbioenergy investments.
• Special Circumstances That Precipitate Conversion to Biomass: Very often there aretriggering factors that help the managers decide to invest in bioenergy (e.g., oilchocks or the introduction of favourable tax treatments, etc.).
• Aggressive Farsighted Management: Biomass investments were often associatedwith an active management style.
The paper by Muehlenfeld et al. has an approach similar to that of our report. Thedifference is that they have focused on individual bioenergy projects whereas our studytreats the properties of whole bioenergy markets.
2.1.4 Successful Strategies for Biomass Energy ProjectsSanderson et al. (1996) present some practical considerations for successful biomassenergy projects. The factors that the authors find most important for successfulbioenergy implementations correspond to some degree to the list given byMuehlenfeld et al. The recipe for successful bioenergy projects includes the followingaspects:
• Feedstock Supply: The feedstock supply should be abundant and of low cost.• Captive Energy Customer: It is an advantage if there is a captive customer for the
heat or steam.• Equipment Specifications: The equipment should have a proven track record.• Tax incentives: The tax structure may also influence the technology choice.• Permitting: Permitting can be time-consuming and applications should be submitted
as early as possible in the planning process.• Operational Considerations: Trained and qualified personnel should be employed.• Joint Venture Considerations: Joint ventures may help to satisfy various needs of a
project. This help may include parties representing the feedstock supplier, energycustomer, equipment vendor or operator, or financing and energy trading parties.
As can be seen from the lists by Muehlenfeld et al. and by Sanderson et al., integra-tion, co-production, and know-how aspects are important success factors for bioenergyprojects.
15

2.1.4 Biofuels for Electricity and Heat and Local Bioenergy ProjectsTwo Swedish studies by Hjalmarsson et al.(1996a, and 1996b) identify the followingprincipal reasons behind the successful examples of biomass energy in local energyplanning in Sweden:• A high degree of interest and engagement exists among policymakers and techni-
cians in the energy companies.• There is a consensus among technicians and policy makers to the goals of escape
from the oil dependence and from its insecure price development.• Few alternatives to oil, other than biofuel, are available.• The main players (municipalities, utilities, and industry) manage to coordinate their
efforts.• There is a local ambition to create employment in the region.• Energy and environmental taxes on fossil fuels increase competitiveness for bio-
energy.• Subsidies and credit loans from the state have promoted the change towards more
bioenergy.
However, local environmental planning in Sweden (e.g., Agenda 21 plans) has not hadtime to influence local energy policy, including bioenergy efforts. The main con-clusion in the Swedish reports would be that supportive policies and local policy-makers and technicians who are positive towards biofuels are crucial to the success ofbioenergy investments.
2.1.5 Biomass Power Industry, Assessment of Key Players and Approachesfor DOE and Industry Interaction
This report, (NREL 1994) contains the assessment and recommendations of a 50-member review team in 1992,1993 concerning the biomass power industry in theUnited States. The team observed that the major share of the power that was suppliedby biomass to the domestic grid came from the forest industry or forestry woodresidues. Some conclusions concerning barriers and opportunities for bioenergy powerwere the following:
• Information and education are needed to correct common misconceptions among thepublic and decision makers.
• Environmental assessment and valuation should be conducted for biomass energy asfor all the alternative power-generating technologies.
• Measures should be taken to fully implement policies to encourage bioenergy.Intermediate technologies (e.g., co-firing) should be promoted as well.
16
• Co-firing is said to be the best near-term opportunity to increase the use of biomassfuels among American utilities.
• The availability of low-cost biofuels must be expanded.• Old biomass power plants should be repowered to the maximum efficiency.• The international technology market, especially in the developing world, is one
important field for the American bioenergy industry.
The proposals aim at a more positive policy treatment of bioenergy, and towards hori-zontal and vertical integration of the industry. There are also proposals to focus moreon equipment export efforts.
2.2 Market Structure2.2.1 Integration and Innovation in the Energy marketsTeece (1979) investigates the economic rationale for integration of the energy industry,the bioenergy branches not included. He finds out that vertical and horizontalintegration provide several cost advantages for energy industries and that verticalintegration also has a positive effect on R&D performance. He concludes thatintegration by an energy enterprise is not only a strategy to maintain hegemony butrather a means to decrease transaction costs and to pool resources for research anddevelopment.
Although Teece does not discuss the bioenergy sector, a comparison shows that thebioenergy industries of today are fragmented with several contracting problems atdifferent levels (e.g., between feedstock producers and plant owners). When thebioenergy industry grows, however, more integrated dedicated bioenergy technologieswould probably be developed.
One conclusion drawn from the paper by Teece could be that the productiontechnology of bioenergy and the fact that it has been developed after the fossil energysystems gives bioenergy a disadvantage on the market.
2.3 Energy Policy2.3.1 "U.S. energy policy at a crossroads?"Eikeland (1993) analyses the American energy policy, particularly the policy process,when the Energy Policy Act of 1992 was elaborated and debated in the House ofRepresentatives. Eikeland uses four dimensions when he explains the final outcome ofthis policy process.
17
• The relative bargaining strength of the interest groups: A variety of associations andinterest groups have a vital interest in how the American policy on energy is shaped,and therefore spend many resources to lobby in Washington DC. Powerfulassociations defend the interests of each of the fossil fuel types; others work for thebiomass industry, consumers, utilities, and for environmental issues.
• The institutional framework: Institutions define the framework for how fast, andhow much, policy can change. In the American case, lawmaking is complicated andgridlocks between the President and the House of Representatives often occur whencontroversial legislation is proposed. The political system in the United Statestherefore favours the status quo.
• Ideology: Eikeland observes that a strong ideological current in the United States, isthat of non-involvement by the government and that it is for the market to decidewhich energy sources should be used. This view was a particularly strong ideolo-gical belief of the Reagan administration. Nevertheless, the energy sector is stillvery regulated in the United States and to a high degree shaped by politicaldecisions.
• Cognitional changes: Finally Eikeland claims that cognitional changes are importantto the way policy is shaped. One example is the increasing knowledge and aware-ness about the environmental effects of fossil fuel combustion. Eikeland means thatthis new knowledge, and most recently the concern about global climate change, areinfluencing peoples' priorities and also energy policy.
Although the model by Eikeland is applied to a specific American situation, i.e. howthe final Energy Policy Act document was designed, it may be relevant to use in othersituations as well. The paper describes how non-technical barriers to bioenergy can bethe outcome of the policy process where powerful interests lobby for policy measuresand allocations according to their agendas.
2.3.2 A Theory of Competition Among Pressure Groups for Political InfluenceBecker (1983) uses here a more formalized economic model to present how pressuregroups and taxpayers influence a vote-maximizing policymaker in shaping the taxschedule and offering favours to specific groups. The outcome of the policy processwould be a structure of taxes, subsidies, and political favours that depends, partly onthe deadweight loss the tax- and subsidy-structure is creating, and partly on the successof the interest groups influencing policy and repressing free-riding within the group.
The model is general and applicable on any economic sector. However, it shows howthe energy policy process could be described and how it may influence the bioenergy
18
sector. For instance, as long as the biomass industry is fragmented and free-ridingbetween different individuals within the industry is likely, the policy influence of thebiomass industry is low. On the other hand, large homogenous industries, like thenuclear and oil industries, do have the potential to influence more policies in theirfavour because they can punish free-riding and they have a common agenda forlobbying. With this model in mind, the priority task for the bioenergy organizationswould be to create a more homogenous and united lobby association, such that nobodyin the industry would be allowed or have an interest in remaining outside.
2.3.3 Bioenergy policy: Predictable Problems from the Public SectorThe implementation issue of energy policies in the United States is also discussed in apaper by by Smith and Montjoy (1996). According to the authors, costs, lobbying, andfragmentation of bioenergy business could be a part of the answer to why there is noclear direction to the energy policy concerning renewables in the United States. Theinsufficient implementation of the energy policy may have different reasons. It candepend on a lack of resources accompanying the decision. There may also beconfusion about who is the responsible for the new task, and new conflicts within theadministration may emerge as the new policy measure is being introduced. Theunderlying problem, however, is often that the energy policy includes vague mandatesand provides little new funds. The authors also conclude that the interdependencyamong the different agencies leads to poor coordination and a competition for funds.
This weakness may be because bioenergy often is connected to other issues (e.g.,employment, regional development, environmental questions). This may lead to aninconsistent policy that is partly the result of the low degree of understanding of thewhole situation of the business by policymakers. Subsidies may be granted but withunnecessary requirements. Some examples are the closed-loop tax reduction in theUnited States that fail to support realistic bioenergy projects that do not meet the verystrict requirements, and the support system for biomass district heating in Austria thatfavoured farmers as managers/owners over other operators, with no regard for whowould be best suited to run the plant most efficiently.
2.3.4 Government Intervention and Innovation in Industry: A Policy FrameworkHow do governments stimulate a business to grow? How do they support the success-ful implementation and commercial use of new tachnologies? The two options areeither to apply "push" intervention in the form of technology creation actions or to"pull" effects (e.g. by creating a market). The push actions may consist of basic re-search, R&D programs, sponsoring of demonstration programs, or even the complete
19

responsibility of production. Technology pull actions can be deployed by direct pro-duct intervention through information and persuasion, product performance standards,or technical product standards. Alternatively, the market may be modified by manda-tory eco-labeling, selective taxing or government purchases. The two approaches ~pull or push — may also be used in combination in varying degrees and with variablefunding.
Abernathy and Chakravarthy (1979) compare the experience of the alternativeapproaches to promoting new technologies. Their main conclusion is that an indirecttechnology "pull" approach (where, first, a market for the new technology is created)combined with moderate push investment (e.g. financing R&D) generally leads tosuccessful innovation and implementation of new technologies. On the other extreme,high-intensity technology push actions have a more high-risk profile with a highfailure rate.
Because many bioenergy technologies are fully developed, the implications of thestudy would be that the incremental technology pull method promotes bioenergymarket growth the most. It is important here that the learning process and incrementalimprovements and innovations have the time to spread and create the cost-reductionsthat are needed. Experiences from the biomass energy markets in the United States(Maine) and in Sweden demonstrate that there are important sucessive improvementsto achieve.
20

3 The energy sectors in the United States,Sweden and Austria
3.1 The Energy Sector in the United States3.1.1 Energy supplyThe United States consumes the most energy in the world, 85 400 PJ (Total PrimaryEnergy Supply TPES,1994) and 727 GJ per person and year.
Energy use in the United States since 1994 is shown in Table 1.
Table 1. Energy use in the United States
TPES, PJ 85 400
TPES/population, GJ 327
Electricity use, TWh 3392
Electricity/population, MWh 131)
Source: IEA 1996
The electricity percentage of total fuel consumption is 17.2%.
The contribution of different primary energy sources in the total energy supply for1973 and 1994 are shown in Table 2.
21

Table 2. Primary energy sources in the United States (per cent ofTPES).
1973 1994
38.8
24.1
23.3
8.7
1.1
4.0
100
Fossil fuels still represent the major source of energy supply in the United States; Theyaccounted for 95% of the total supply in 1973 and still represent 86% in 1994. Oil has,however, decreased its percentage share in the total energy mix, whereas coal areincreasing. The share of natural gas has decreased slightly. Table 2 also shows that theUnited States experienced a relative increase in the use of the nuclear power and"other" fuels (e.g. renewables) in the 1970s and 1980s.
The TPES in The United States has increased by 29% since 1973, whereas energy useper capita has remained almost constant. Energy efficiency in the whole energy sectorhas increased, which is illustrated by figure 1 below of the consumption figures inrelation to Gross Domestic Product (GDP).
Oil
Gas
Coal
Nuclear
Hydro
Other
Total
Source: ffiA 1996.
47.0
29.9
18.1
1.3
1.3
2.4
100
22

Figure 1 Electricity Consumption/GDP and Energy Supply/GDPSource: BEA/OECD 1996
In the United States, TPES per GDP has decreased by 29% as the production successi-vely includes more technological knowledge and services. The development of electri-city use per GDP, however, is increasing, reflecting the fact that many new industrialprocesses and activities within the residential sector are becoming electrified.
Much energy is used for transport in The United States, mainly domestic roadtransport, as shown in Table 3.
Table 3: Energy consumption 1994, per cent
1973 1995
Industry 38 34
Transport 30 36
Other: Commercial, residential, and non-energy 32 30
Total 100 100
Total Final Consumption (TFC) after transfers and losses.Source: IEA 1996.
Export and import shares of the different energy types of total TPES are included inTable 4.
23
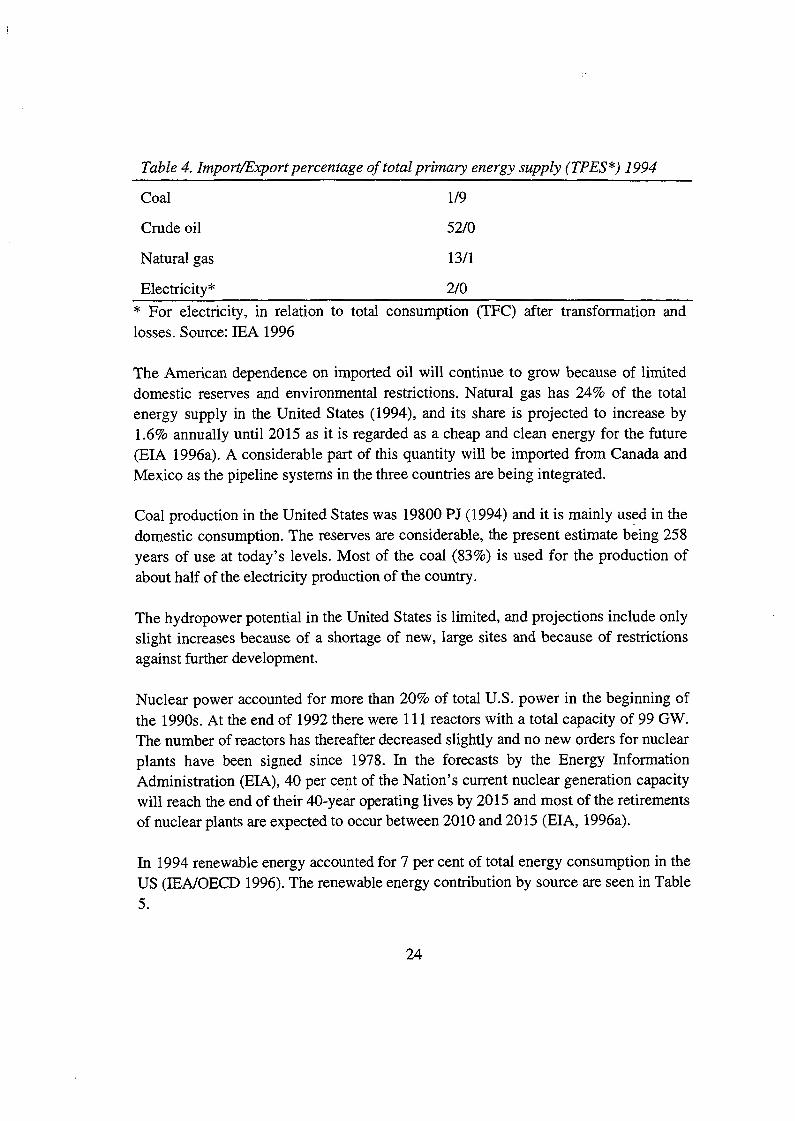
Table 4. Import/Export percentage of total primary energy supply (TPES*) 1994
Coal 1/9
Crude oil 52/0
Natural gas 13/1
Electricity* 2/0
* For electricity, in relation to total consumption (TFC) after transformation andlosses. Source: IEA 1996
The American dependence on imported oil will continue to grow because of limiteddomestic reserves and environmental restrictions. Natural gas has 24% of the totalenergy supply in the United States (1994), and its share is projected to increase by1.6% annually until 2015 as it is regarded as a cheap and clean energy for the future(EIA 1996a). A considerable part of this quantity will be imported from Canada andMexico as the pipeline systems in the three countries are being integrated.
Coal production in the United States was 19800 PJ (1994) and it is mainly used in thedomestic consumption. The reserves are considerable, the present estimate being 258years of use at today's levels. Most of the coal (83%) is used for the production ofabout half of the electricity production of the country.
The hydropower potential in the United States is limited, and projections include onlyslight increases because of a shortage of new, large sites and because of restrictionsagainst further development.
Nuclear power accounted for more than 20% of total U.S. power in the beginning ofthe 1990s. At the end of 1992 there were 111 reactors with a total capacity of 99 GW.The number of reactors has thereafter decreased slightly and no new orders for nuclearplants have been signed since 1978. In the forecasts by the Energy InformationAdministration (EIA), 40 per cent of the Nation's current nuclear generation capacitywill reach the end of their 40-year operating lives by 2015 and most of the retirementsof nuclear plants are expected to occur between 2010 and 2015 (EIA, 1996a).
In 1994 renewable energy accounted for 7 per cent of total energy consumption in theUS (IEA/OECD 1996). The renewable energy contribution by source are seen in Table5.
24

Table 5. Renewable energy contribution by source 1994
Electricityproduced
(GWh)
Heat (TJ)
Hydroelectric power
Geothermal Energy
Biomass (not wastes)
Wastes
Solar Energy
Wind Energy
Total renewable energy
262768
17479
45129
17839
784
3791
347790
629478
2365300
405673
2823
2997575
Source: (IEA, 1996)
Hydroelectric and biomass constitute 93% of the total renewable contribution in theUnited States. Hydroelectric power constitutes the bulk (77%) of the renewableelectricity quantity, and biomass (wood and wastes) contributes with only 18%. Thewaste-to-energy industry grew rapidly during the late 1980s and early 1990s.Geothermal electricity generating plants operate in California, Nevada, Utah, andHawaii. Although geothermal energy is a minor energy source, it is growing at a 2.2 %annualized rate. Wind energy increased 50% from 1990 to 1994 as a result of techno-logical improvements and cost reductions. Photovoltaics has also become cheaper overthe years and 85 utilities in the United States were testing grid-connected photovoltaicsystems in 1995.
3.1.2 The biomass energy sectorBioenergy accounts for 63% of the renewable total in the TPES and 3.2% of the wholeenergy supply (IEA 1996). Electricity generation from biomass increased by 7% peryear from 1990 to 1994. The biomass fuel consists of 79% wood, 17% wastes, and 3%alcoholic fuels. The consumption of the different bioenergy sources in the UnitedStates are presented in the Table 6.
25

103
103
567
47
2280
12
103
3009
Table 6. Biomass energy consumption in the United States by sector 1994 (PJ)
Wood Waste Ethanol Total
Residential 567
Commercial 47
Industrial 1765 515
Electric utility 12
Transport
Total 2391 515
Source: EIA, 1995.
Table 6 shows that the industrial sector accounts for two quarters of the total biomassenergy consumption. This consumption consists of both in-house wood consumptionin the forest industries and power production by independent power producers.
The geographical distribution of this consumption follows forest industry location,which explains why over 60% of wood energy consumption occurred in the south.
In 1994, 567 PJ of wood energy was used in the residential sector. This activityincreased after the first oil crisis in 1973 but has since then been decreasing as peopleare leaving wood heating for more convenient alternatives.
Pellets manufactured from finely ground wood fibre is a growing biomass niche in theresidential sector. Pellet stoves benefit from good combustion efficiency and emissioncharacteristics in comparison with ordinary woodstoves. Estimated wood fuel sales arepresently 600 000 tons per year. Approximately 350 000 pellet stoves have been soldin the United States (Pickering 1996). Presently the expansion is levelling off in thewest and is instead expanding in the east around the Great Lakes and in New England.
Many woody and herbaceous crops for energy use have been identified and tested inthe United States during the latest 10 to 15 years. The tests have shown that ShortRotation Woody Crops (SRWC) can yield 2 to 5 times the normal production ofnatural forest stands and conifer pulpwood plantations (Wright 1994). Even though thecosts in dedicated SRWC plantations of today are excessively high, production is
26

feasible and may become economical when the production costs are shared with ahigher valued use (e.g. wood production for pulp and paper industries).
Municipal solid waste (MSW) is an important energy source that mainly has anorganic origin. It includes total waste excluding industrial waste, agricultural waste,and sewage sludge. In October 1995, 116 Waste to Energy (WTE) facilities operatedin the United States with a total capacity of more than 100 thousand tons per day. Inthe late 1980s the industry grew rapidly as a result of increasing concerns overlandfilling as a safe disposal method, rising tipping fees, Public Utility RegulatoryPolicies Act (PURPA), and soon-to-expire investment tax credits. During the early1990s, however, the WTE industry encountered more difficulties. Several states andthe Environmental Protection Agency (EPA) promoted recycling rather thancombustion, and flow control legislation by several states came under review by theU.S. Supreme Court.
Ethanol is consumed in a fuel blend with gasoline. It allows a more completecombustion of the gasoline which limits the risk of carbon monoxide pollution.Ethanol receives a reduction of the Federal motor fuel excise tax rate.
The most serious barrier to further expansion of biomass energy in the United States isthe cost. Biomass cannot be competitive with homogenous and energy-rich energycarriers like oil and natural gas. New technologies for gas and oil exploration aredepressing their prices, and power production in combined-cycle power plants fuelledby gas represents an important technological advantage for this fuel compared withbiomass. Biofuels are bulky, which automatically makes them sensitive to storage andtransportation costs. They are furthermore diverse, variable and site-specific. Bio-energy therefore has less potential for the economies of scale that normally emerge in alarge market through technical standards and as large production reduces unit-costs.Both the technological characteristics and the market structure will, therefore, result inrelatively high capital costs for bioenergy systems. However, few alternative uses ofbiofuel will keep the prices on the feedstock low. Biofuels can therefore becompetitive in specific energy sectors, such as in the forest industry or as heatingsystems for rural households.
3.1.3 PolicyAn example of early legislation that influenced the energy sector was the Public UtilityHolding Company Act 1935 (PUHCA, Public Law 74-333) regulating power supplyand utility rules. The PUHCA gave the Securities and Exchange Commission (SEC)
27
the authority to break up trusts, and to limit the operation of utilities in many states.Because of the PUHCA law utilities not only have franchise rights of distribution butalso an obligation to serve an area with gas and electricity.
The oil embargo of 1973 - 74, which caused an inflation in the economy, also triggeredthe adoption of permanent mechanisms for developing and implementing a nationalenergy policy in the United States. The general objectives of the new laws were todevelop renewable and domestic energy sources and to reduce dependency on foreignoil.
The Public Utility Regulatory Policies Act of 1979 (PURPA, PL 95-617) had the aimof encouraging the efficient use of fossil fuels in electric production throughcogeneration, and of helping to increase the use of renewables among small powerproducers. The new legislation opened a window for independent power producers andfor renewables. The power producers had to meet certain ownership, operating, andefficiency criteria etsblished by the Federal Energy Regulatory Commission (FERC),an independent organisation within the Department of Energy (DOE) responsible forcertain regulatory functions in relation to electricity, natural gas, and, to a lesser extent,oil. The PURPA actually required that the utilities purchased power from any facilitymeeting the criteria for a Qualifying Facility (QF). Furthermore, it required that theprice of the power should be the utility's own incremental, or avoided, cost ofproduction. This meant that Congress ensured the QFs a guaranteed market for theirpower at a price equal to the avoided cost. These prices were the first in most states tobe decided administratively. But in 1984, the Maine Public Service Commissionbecame the first Public Utility Commission (PUC) to put competitive bidding intopractice. PURPA allowed a certain degree of competition in the power market, andnonutility power production in the United States increased from 3% in 1985 to 9% in1991.
Other important laws for the bioenergy business include the National Energy Act of1978, which materialized the authorities' increased concern with the energy sector, theNational Energy Conservation policy Act (PL 95-619), the Powerplant and IndustrialFuel Use Act (PL 95-620), and the National Gas policy Act (PL 95-621).
Public spending on bioenergy reached a maximum during the late 1970s. With the newReagan administration in 1980, the focus was changed towards a more market-orientedapproach which meant that new technologies had to prove their advantages in an openmarket. Federal price and allocation controls on oil were also eliminated. The staff at
28

the DOE working with renewables was reduced from 217 to 132 employed and theDOE's R&D funding on renewables decreased by 91% between 1979 and 1990. Thegeneral view in the administration was also more in favour of fossil and nuclear power.
In general, the Reagan administration reduced policy involvement dramatically. Noimportant energy policy declarations or policy goals were presented and spendingswere cut. The Tax Reform Act of 1986 also reduced the financial incentives forinvestments in municipal solid waste energy plants.
In 1992, however, comprehensive new energy legislation was introduced with theEnergy Policy Act (EPACT, PL102-486). The act covers many different aspects of theenergy sector, but the major objectives are to reduce oil imports by about 4.7 millionbbl/d and total energy demand by more than 7% by 2010. Important components of thenew legislation include tax credits for renewables and waste energy:• Tax credits and support for research development and demonstration (RD&D) and
commercialization of biomass energy systems• Tax incentives for ethanol-gasoline blenders• Tax credits for closed-loop biomass facilities• Extended subsidies for non-waste biomass power generation to utilities and coope-
ratives• Extended fuel tax credit qualifying period for biomass gasification facilities• A five-year program for government, private-enterprise commercialization of renew-
able energy projects.
Maybe the most important change that occurred with the Energy Policy Act is that itinitiated the deregulation of electricity markets in the United States. Production ofelectricity is now becoming less regulated and production for the wholesale marketwill become more competitive as the individual states begin the transition. The FERCwill possess more authority to compel utilities to admit wheeling of wholesale power.For the moment, the process of restructuring the power markets is under way in theindividual states, and the difficult issues are consideration of a utility's so-called"stranded costs," how misuse of a utily's market power should be prevented, and alsohow policies towards renewable technologies should be designed under the newinstitutional framework.
There are big differences in energy policy between the states in the United States.Individual states can apply laws differently or introduce their own support schemes forbiomass energy. On the state level, several tax incentives and subsidies for biomass
29

and other renewable energy investments can include income tax credits, alternativefuels vehicle deductions, tax-exempt financing for biomass projects, etc.
The examples above of energy policy measures do not cover the whole spectrum ofinstitutional aspects on the bioenergy sector. The DOE also mentions a number ofother programs that could help the growth of biomass technologies: Information andeducation, external environmental valuation promotion of co-firing partnerships withthe industry, and repowering.
Other types of legislation that directly or indirectly influence energy projects includeforestry policies, land use and agricultural policies, utility regulation, and air emissionpolicy.
The environmental question is becoming more highlighted in policy-making. The mostimportant policy measure for the environmental effects of energy production is theClean Air Act Amendments of 1990. Its goal is to reduce sulfur dioxide (SO2) emis-sions from electric generating units, and the controlling agency is the EnvironmentProtection Agency (EPA). The bill introduced allowances for emissions that can betraded in the private market. The Acid Rain Program sets targets for future emissionsof SOX and NOX by the year 2000 compared with 1980 of 50% and 30%. The programcontains incentives for utilities to adopt efficiency measures. EPA also providessupport and advice to utilities, state public utility commissions, and others on pollutionprevention, energy efficiency, and renewable energy.
On 19 October 1993 President Clinton signed the Climate Change Action Plan. TheUnited States and over 160 other states negotiated the Kyoto Protocol about green-house gas reductions on December 11 1997.
3.1.4 The policy processWithin the federal government, lead responsibility for energy policy rests with theSecretary for Energy. Energy policies are administered through the Department ofEnergy (DOE). The Federal Energy Regulatory Commission (FERC) is an indepen-dent organisation within the DOE responsible for the regulation of the electricity,natural gas, and oil markets. The Nuclear Regulatory Commission (NRC) is respon-sible for licensing nuclear power plants. Other departments with responsibilities forenergy matters are the Department of State for international energy matters; theDepartment of the Interior which controls exploration of mineral resources on federalland and on the Outer Continental Shelf; the Department of Justice which monitors the
30

energy industries regarding anti-trust laws and finally the Environmental ProtectionAgency which sets environmental standards for the energy industries. Agencies andsub-agencies that are involved in bioenergy are also National Renewable EnergyLaboratory (NREL), Oak Ridge National Laboratory (ORNL), the U.S. Department ofAgriculture (USDA), the National Resource Conservation Service (NRCS), and theTennessee Valley Authority (TVA).
Energy policy is also shaped by the different interest groups, energy producers, utili-ties, consumers, environmental organizations. The biomass energy industry - althoughfragmented - is organized in different associations. The National Independent EnergyProducers (NIEP) represent many bioenergy members but their main goal is to protectall the independent non-utility power producers' interests against the utilities duringthe deregulation process. The Biomass Energy Alliance is "a broadbased coalition ofindustry, utilities, agriculture, and environmental groups." It cooperates with other or-ganisations like the National Resources Defense Council and the Union of ConcernedScientists. The National BioEnergy Industries Association includes members from thebioenergy industry, equipment developers, consultants, and other players in thebioenergy sector. Another potential supporter of the bioenergy industry is theAmerican farmer. On the other hand, there are important local interests supporting thecoal industry in the mining states of the South and the Midwest. Traditionally, andconsidering their contributions to the nation's economy, the energy lobbies for coal,oil, gas, and nuclear power are very powerful. The oil and gas companies are oftenintegrated and coordinate to protect the fossil fuels' interest when regulations aredebated and they oppose increased use of alternatives in vehicles and environmentalrestrictions against oil and gas exploitation.
Environmental issues have important representatives in American society (e.g., theSierra Club and the Audubon Society). These organisations often support renewableenergy, including bioenergy. Although their financial power is rather limited incomparison to that of the fossil fuel industries, they have a large membership base, thathelps them have an impact.
3.2 The Energy Sector in Sweden3.2.1 The energy sectorIn total figures, Swedish energy consumption, 2106 PJ (TPES 1994), is only 2.5% ofthe American total. Per person the Swedish figure is 239 GJ in 1994.
Energy use in Sweden since 1994 is shown in Table 7.
31

Table 7. Energy use in Sweden
TPES,PJ 2106
TPES/population, GJ 239
Electricity use, TWh 3 452
Electricity/population, MWh 16.2
The average Swede actually consumes more electricity than the average American,16.2 MWh, compared with 13.2 MWh in the United States (IEA 1996). Electricityaccounts for a higher percentage of total fuel consumption in Sweden, 31% comparedto 17.2% in the United States. This circumstance is the result of a traditionally cheaphydropower resource in Sweden and, since the 1970s, a fast expansion of low-pricenuclear power for heating purposes. Between 1970 and 1985 electricity use for heatingincreased fivefold.
The contribution in Sweden of different primary energy sources in the total energysupply for 1973 and 1994 can be seen in Table 8.
Table 8. Primary energy sources in Sweden (per cent ofTPES).
1973 1994
Oil 72.3 31.7
Gas 0 1.3
Coal 4.1 5.5
Nuclear 1.4 38.2
Hydro • 13.1 10.2
Other 9.0 13.2
Total 100 100
In contrast to the trend for electricity, the fossil proportion in Swedish energy con-sumption has decreased over the years, from 76% in 1973 to 38% in 1994. Fossil fuelshave been replaced by nuclear power and renewables whereas hydro has decreased itsshare.
32

Because of poor environmental performance and tight environmental and climatepolicies in Sweden, the importance of coal in the energy system is low and it will pro-bably continue to be so in the future.
Since 1979 oil consumption has been almost halved in Sweden. Most of the declinehas taken place in the use of oil for heating. The change is partly the result of energyefficiency measures and NOX and SOx restrictions. At the same time gasoline con-sumption has increased by about 15%. The transport sector consumes one-half of theoil while industry and other sectors use the other half. Most of the oil comes from theNorth Sea and has a low sulfur content.
Natural gas accounts for 1.3% of the TPES in Sweden. The network of gas pipelines isrestricted to the south and southwest of Sweden, including the big cities of Malmo andGoteborg. Industry consumes 35% of the natural gas imports while Combined Heatand Power (CHP) plants use 44%. Natural gas is seen as a potential competitor tobiofuels in power and CHP production.
Electricity consumption and TPES per GDP is shown in Figure 2.
Figure 2 Electricity Consumption/GDP and Energy Supply/GDPSource: ffiA/OECD 1996
From Figure 2 it can be seen that the electricity consumption/GDP has increased by38% between 1971 and 1994 while total energy production/GDP has been stable. Totalenergy use per capita has increased 27% in Sweden. The distribution of the energyconsumption from 1973 to 1995 in the different sectors is illustrated in Table 9.
33

Table 9. Energy consumption 1994, per cent
Industry
Transport
Other: Commercial, residential and non-energy
Total
1973
45
15
40
100
1995
40
22
38
100
Sweden does not have fossil resources of its own — almost all is imported. Electricityforeign trade is low, partly depending on the regulated European electricity market.The main exchange of electricity takes place between Sweden, Norway, and Finland.
Twelve nuclear units are in operation at four different sites built between 1972 and1985. Total installed nuclear capacity in Sweden amounts to 10GW, and nuclearpower contributes now about 50% of the electric production (in 1994, 70TWh), theother half is mainly provided by hydropower. This means that fossil fuels are rarelyused for electricity production in Sweden.
As a result of an agreement between the Social Democratic, Centre, and Left parties inFebruary 1997, the two reactors in Barseback are planned to be phased out before2001. The agreement also includes that the continued transformation of the Swedishenergy system, away from nuclear power towards more renewables, especiallybiomass.
In 1994 renewable energy accounted for 23 per cent of total energy consumption inSweden. The distribution of the renewable quantity is described in Table 10.
34

59 039
2 240
90
6
72
61447
260 910
15 042
22
13 273
289 250
Table 10. Renewable energy contribution by source 1994
Electricityproduced (GWh) Heat (TJ)
Hydroelectric power
Biomass (not wastes)
Wastes
Solar Energy
Wind Energy
Heat pumps
Total Renewable Energy
Source: Energy Balances of the OECD Countries 1993-1994, EIA, Paris.
Renewable sources in Sweden are in principle hydropower, biomass energy for theforest industry, biomass use for district heating and, finally, fuelwood for residentialheating. There are small solar, wind, and liquid fuel consumption components and nogeothermal energy is produced in Sweden.
Despite the high energy intensity in Sweden, emissions are low compared withcountries with a similar GDP and level of industrial development. Serious acidificationproblems have motivated the country to reduce its emissions of SO2 by 80% since1980. Nitrogen emissions, which are mainly caused by traffic, are still high in thecountry. However only 10% of Sweden's sulphur and nitrogen precipitation originatefrom sources within the country.
The Swedish emissions of CO2 have been reduced by 23% between 1970 and the1990s, mainly because of the development of nuclear power, but also because of theincreased use of biofuels. Parliament approved a Climate Bill in 1993 that includes atarget of stabilising CO2 emissions from fossil fuels at 1990 levels by 2000, with theaim of reducing them thereafter.
3.2.2 The biomass energy sectorIn Sweden the biomass energy sector accounts for 56% of the renewable total in theTPES and 13% of the whole energy supply (IEA 1996). An overview of energyconsumption in Sweden indicates that biofuels provide 284 PJ of energy. Digester
35

liquors remaining after chemical processing provides 108 PJ of energy. The celluloseindustry also uses other wood by-products in internal production of heat and energy,amounting to 30.6 PJ in 1994, and sawmills use an additional 26.6 PJ of wood energybiomass. The recorded total consumption of biomass in electricity or combined heatand power production is small in Sweden: only 2.4 TWh in 1995. However, theserecorded values are misleading as they emanate from values submitted in taxdeclarations. As fossil fuel use for electricity generation is tax free, fossil fuels tend tobe allocated to electricity generation. Most of this fossil fuel use took place incombined heat and power (CHP) plants in the forest industry although the electricityproduction in district heating has increased from 0.3 TWh in 1992 to 1.0 TWh in 1995.
The district heating sector is a very important biomass consumer in Sweden. Becauseof administrative classification, district heating plants pay taxes for fossil but not forbiofuels. This rule and a high potential for forest fuels in Sweden explains why thissector is an important biofuels consumer. Although biofuels consumption hasincreased for a long time, the policies regulating the district heating sector have beenvolatile, and fuel use has shifted from oil to coal, peat, electricity, and in the latest fiveyears to biomass. Municipal solid waste has been used for district heating since 1970with a current heat production around 14 PJ.
The residential sector uses 43 PJ of wood energy for heating single-family houses,predominantly in the rural areas. The pellet industry represent a new wood heatingsystem in Sweden.
Presently about 17 thousand hectares in Sweden are planted with willows for fuelproduction. The production is taking place on set-aside land and has been promoted byspecial subsidies and agricultural policy measures. However, its role in the wholeSwedish energy balance is still small.
The import flow of biofuels involves mainly wood residues and demolition wood fromcontinental Europe (the Baltic states, Germany, and the Netherlands). This trade issupported both by deposition fees in the case of Germany and by the fact that fossil,but not biomass, energy is taxed in Sweden. The annual import amounts to 800thousand cubic meters, which corresponds to 7% of the heating plants' total biofuelconsumption.
The estimates of potential biomass resources in Sweden also vary considerably. InHektor et al. (1995) the total potential of wood fuel amounts to 468 PJ of energy per
36

year, an increase compared with the 1995 quantity of 324 PJ. The greatest potential isthe volume of unused logging residues, amounting to 202 - 259 PJ.
As the biomass industry emerged in Sweden, there was resistence by the forestindustry to allowing this market to grow as a result of a fear of increased competitionfor wood. Another obstacle for the growth of the business was the fact that wood fuelswere aimed at a completely new market for the forest industry - the energy market.The forest sector lacked knowledge about this market and the idea of fuel productionhad not influenced forestry thinking since world war II.
Today this picture is changing. The harvesting and trading of forest biofuels isnowadays managed by the forest industry, and the trading organizations for forest fuelsnormally belong to the timber trade organizations of the forest companies and theforest owners' associations. In this way the new flows can use the existing fieldorganization and infrastructure that serves the timber trade and a high degree ofintegration exists between the forest sector and the new bioenergy industry.
Heating plants are normally natural monopolies owned by municipal utilities. Somerestructuring is now taking place in this sector as a result of the deregulation of thepower market, and big power companies have bought some district heating companiesin order to control existing or potential co-production capacity. Although the localmarkets are different in different parts of Sweden, little is known about the impact ofgeographical monopolies or monopsonies on the biofuels market, nor about positivenetwork effects and economies of scale as the market grows and technology improve.
3.2.3 PolicyThe first energy policy was issued in 1975 and focused on support to reduce energyconsumption. Biomass energy was at this time not of significant weight in the generalenergy picture except for forest fuels, which were already consumed in the forestindustry and in the residential sector. A further expansion was not considered likelybecause the general view was that wood fuels were in short supply. Some support forbiomass energy was however provided as one possible way to diversify the nationalenergy mix.
In 1981 increased subsidies were introduced for the commercialization of technologiesthat could reduce the oil dependency. Very firm actions were also implemented toswitch from oil import to other fuels. The Fastbranslelagen, ("Solid fuels Act," SFS
37

1981:599) compelled the owner of a new energy plant to design the boiler for solidfuels e.g., coal, peat, or biofuels.
Energy policy in Sweden has to an increasing degree used taxes to shape the energysystem. It is mainly fossils fuels that have been taxed and the most radical increaseconcerned coal in the 1990s. Coal was almost untaxed in 1983 and is now taxed withabout 0.071 ECU /MJ. Tax percentages on other fossil fuels have also increased duringthe late 1980s and early 1990s - while world market prices for these fuels havefollowed an opposite direction. Industrial energy consumer pays a considerably lowertax on energy than do other categories in order to maintain industry's internationalcompetitiveness in the world market. Biofuels are untaxed in the Swedish systemwhich gives them an advantage compared to fossils.
In order to promote biofuels for electricity production an investment support programwas introduced in 1991 (SFS 1992:1099). This incentive will help to increase thebiomass percentage in co-production of heat and electricity.
One regulation that directly influences biofuel use is the advice and regulations aboutthe removal of forest residues for energy purposes (SKSFS 1986:1). The textprescribes when and where it is possible to extract forest biomass and which soils andforest types should be left out of such activities.
Other laws that may have influenced biomass energy investments in the 1980s werethe laws and regulations on waste streams and siting laws. In the early 1970s thesearch for domestic alternatives to fossil fuels (e.g., forest fuels) happenedsimultaneously with a strong expansion of the forest industry sector. In 1975 anamendment (SFS 1975:1321) was added stating that the siting approval of aninstallation also could consider the supply situation of wood fibre. The underlyingreason was concern that an excess demand for wood fibre would damage the forestindustry sector. The paragraph remained until 1987 when it was replaced by the WoodFibre Act (SFS 1987:589). On the first of July 1993 the Wood Fibre Act was removed.Different restrictions on the siting of fossil installations, however, improve theconditions for biomass plants in comparison to their competitors. The Building Act(SFS 147:385) includes regulations about the authorities' approval of big buildingprojects (Hillring 1996).
Swedish energy research has been performed under different research programs. Thetotal amount for energy research occupies 5.5% of the country's total R&D-budget.
38

Different demonstration projects have also been implemented, especially in the early1980s. Some examples of these research incentives are the Project and DemonstrationSupport (SFS 1980:1085, SFS 1982:1230), Energy Technology Fund (SFA: 1988:805),the Oil Substitution Fund (SFS 1980:1085, SFS 1982:1230).
3.2.4 The policy processThe energy sector in Sweden is much influenced by government intervention. Thedominating official objective of the energy policy has been to create an efficient andsecure energy supply. Since the 1980s, the issue has been to achieve environmentalgoals, and at the same time consider the needs of the energy-consuming industries.Energy policies, especially the nuclear power issue, have been often debated in theparliament and by political parties since the 1980s.
Sweden can be characterized as a country with a high degree of coordination betweenthe political and industrial spheres. In the energy sector this has been shown by jointownership of energy enterprises by private and public sectors. Energy policies inSweden have been developed by the central government usually on the basis ofconsensus between the major parties. The main policies and programmes are approvedby the Parliament. Responsibility rests with the Minister of Industry and Commercebut the Minister of Environment is often also mvolved. The Swedish National EnergyAdministration (established in 1998 former NUTEK) is concerend with R&D andenergy policy implementation issues.
The history of Swedish policy implementation is from subsidies to taxes. Historicallythe energy sector was dominated by monopolies, and this fact may have caused earlyenergy policies to include mainy aspects of planning and regulations. Today the pricesystem and market mechanisms are used to a greater extent. There is furthermore agreater willingness to use taxes to promote renewables in the energy system than in theUnited States. The advantage with taxes is that they are easy to administer and thatthey have environmental rationales.
The biomass energy association SVEBIO is the main organization for the business.Many biomass energy producers furthermore belong to other organizations, e.g. forestindustries' and district heating associations. There are also organizations for specificbioenergy interests.
The Swedish environmental debate is animated by several powerful environmentalorganizations - Swedish Association for Natural Conservation, Greenpeace, and the
39

World Wildlife Fund. Their claims are reflected in increasingly tighter restrictions onair emissions.
3.3 The Energy Sector in Austria3.3.1 The energy sectorAustrian energy use is less intensive than that of the United States and Sweden, both intotal figures and per person. Energy use in Austria is shown in Table 11.
Table 11. Energy use in Austria
TPES, PJ 1 089
TPES/population, GJ 138
Electricity use, TWh 52
Electricity/population, MWh 5.9
The contribution of different primary energy sources in the total energy supply in 1973and 1994 can be seen in the Table 12.
Table 12. Primary energy sources in Austria (per cent of TPES).
1973 1994
Oil 56.0 43.2
Gas 15.2 22.0
Coal 18.1 11.3
Nuclear 0 0
Hydro 7.4 11.6
Other 3.3 11.9
Total 100 100
Natural gas, hydro, and renewables have increased during the period while oil and coalhave reduced their shares of the TPES. Total energy use has increased steadily inAustria between 1971 and 1994.
40

The energy intensity is also illustrated by Figure 3 showing the energy figures inrelation to GDP.
Figure 3 Electricity Consumption/GDP and Energy Supply/GDPSource: IEA/OECD 1996
Energy use per GDP output is decreasing, as in most other industrial countries, asproduction successively includes more technological knowledge and services. InAustria TPES per GDP has decreased from 1973 to 1994 by 27%, while electricityconsumption intensily is slowly increasing.
The distribution of energy consumption from 1973 to 1995, after transfers and losses(Total Final Consumption, TFC), on the different sectors is illustrated in the Table 13.
Table 13. Energy consumption inAustria!994, per cent
Industry
Transport
Other: Commercial, residential and non-energy
Total
1973
41
22
37
100
1995
32
26
42
100
Industry use in Austria is decreasing as a result of the closure of energy-consumingunits. In Austria, as in the United States and Sweden, transport has increased itsrelative share most over the 22 years.
41

The export and import shares of the different energy types of total TPES are presentedin Table 14.
Table 14. Import/Export percentage of total primary energy supply (TPES) 1994
Coal 84/0
Crude oil 88/0
Natural gas 73/0
Electricity* 18/20* In relation to total consumption (TFC) after transformation and losses.
Austria imports about two-thirds of its energy needs. There is a domestic productionfor most energy carriers: coal, oil, natural gas, hydro, and biomass. The domestichydropower production is considerable amounting to about 36 TWh. Austrian energyexport is marginal including primarily some hydropower export to neighbouringcountries. Major import fuels are oil, coal, and natural gas.
The Austrian state owns all the rights to the oil in the ground. Licenses can however begranted to private enterprises for exploration and production. OMV Aktiengesellschaft,which is owned by the state to 70%, holds 80% of the country's oil production. Thebulk of the Austrian oil (about 90%) is, however, imported. Exploration and develop-ment of Austrian oil is declining and OMV is restructuring and privatizing its opera-tions.
The domestic production of natural gas is expected to decline. OMV is responsible formost indigenous production and imports, and it owns and operates the principal trans-mission lines and most storage facilities. Local distribution is conducted by utilitiesowned by the individual Lander1. Most import quantities today come from Russia anda smaller volume is imported from the Norwegian Troll fields. The natural gas industrydisplays a structure similar to that of the oil sector when it comes to exploration andproduction. Gas use is now increasing in Austria since the system of pipelines areexpanding in Europe, connecting the large continental market with the big existingsources in the North Sea, Russia, and Northern Africa. The gas distribution system in
1 Austria has nine Bundeslander each with their own government and far-reaching rights to form their own policies.
42

Austria is currently being built and promoted by the gas industry for increased gasconsumption.
Brown coal is extracted from three mines in Austria and the industry is presentlyreceiving financial support. Production is, however, declining and by the year 2000only one mine is expected to still be in operation. The electricity sector in Austria iscontrolled by the Osterrichische Elektrizitatswirtschafts AG (National Company),partially privatized in 1988. The hydropower stations, providing 65 to 70% of totalelectricity production are operated by Sondergesellschaften, Landergesellschaften andby private and municipal utilities. There is a small external trade of electricity, bothexport and import. The energy produced is distributed to the nine regional utilities,Austrian Railways, and to some large industrial customers and there is also a smallinternal consumption.
Many towns have district heating systems. The plants, operated by electric utilities,produce both heat and power for the grid. The district heating companies are owned bymunicipalities, oil companies, and private investors. Prices and production are regu-lated by the state and by the individual Lander governments.
The distribution of the renewable quantity is shown in Table 15.
Table 15. Renewable energy contribution in Austria by source 1994
Hydroelectric power
Biomass (not wastes)
Wastes
Heat pumps
Total Renewable Energy
Electricity produced(GWh)
35 706
201
1284
37 191
Heat (TJ)
124 691
5111
2 515
132 320
Source: Energy Balances of the OECD Countries 1993-1994, El A, Paris.
The aim of Austrian energy policy is to increase the share of domestic renewables inenergy production. Renewables supply 27% of the country's total energy consumptionmaking Austria together with Sweden and Finland the top countries in Europe in their
43

renewable shares. The corresponding figure for the EU15 is only 5%. During the latestyears, renewable energy sources have grown in importance and are now dominatingdomestic Austrian energy production. The percentage of biomass in the TPES hasincreased from 3.3% in 1973 to 11% in 1992 and 12 % in 1995. The biggest increasehas been recorded for the use of firewood for residential heating, but industrial wastesand wood waste also constitute important energy sources.
Standards exist for emissions from power plants of SO2, NOX, and particulate matter aswell as the most dangerous air pollutants. However, over 90% of the SO2 deposition inAustria originates from outside the country and pollution-reducing programmes in theCzech Republic, Slovakia, Hungary, Poland, and Slovenia, are therefore being fundedpartly by the Austrian government. Programs are also being implemented to reduce theemissions of ozone and volatile organic compounds (VOC).
Austria has signed the Framework Convention on Climate Change and the Kyotoprotocol. A target has also been set to reduce the CO2 emissions to 8% below 1990levels by by 20% of 1988 levels in 2012.
3.3.2 The biomass energy sectorSubsidies are used by the federal government and by the Lander to support theincreased use of biomass for energy production. Investments in biomass districtheating and biogas facilities are subsidised and other programmes have regionalobjectives to provide additional incomes in less favoured agricultural areas.
The District Heating Promotion programme, sponsored by the federal government andthe Lander, has supported almost 1000 projects of renewable-based district-heatingprojects fueled with biomass, waste, geothermal energy, or industrial waste heat. Sincethe early 1980s there has been spectacular growth in the number of small districtheating plants in Austria.
The composition of the different biomass energy sources in 1994 are shown in Table16.
44
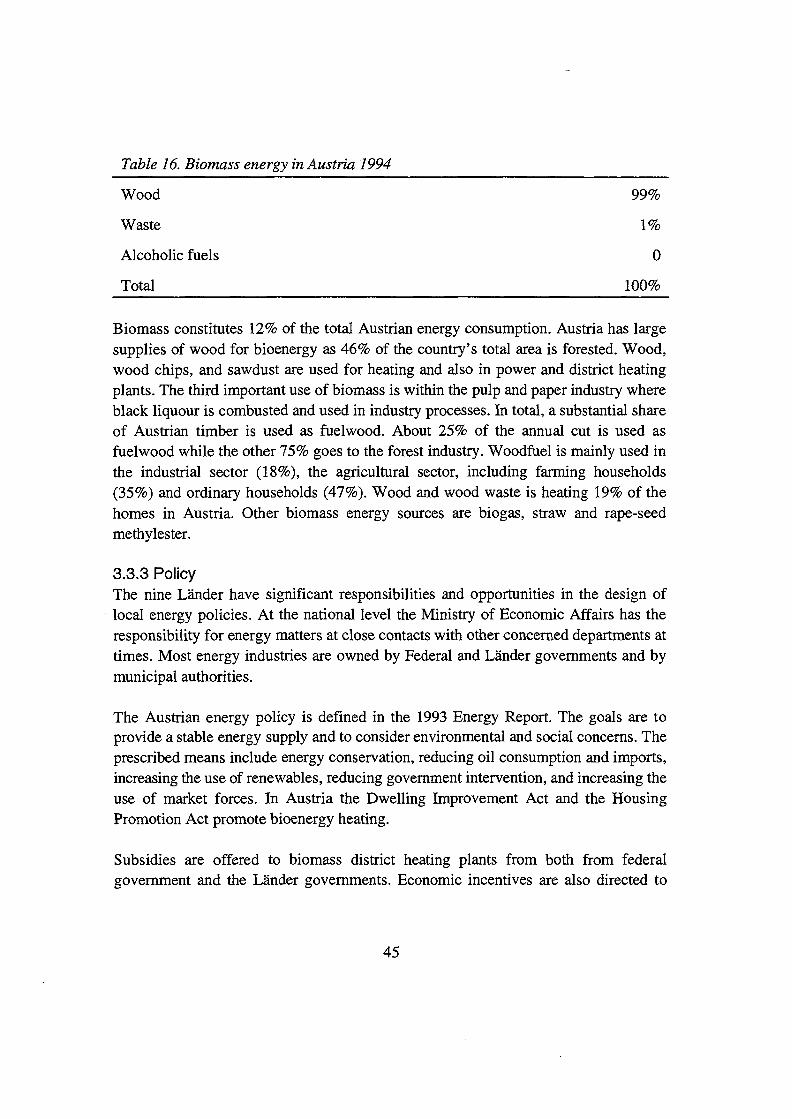
Table 16. Biomass energy in Austria 1994
Wood 99%
Waste 1%
Alcoholic fuels 0
Total 100%
Biomass constitutes 12% of the total Austrian energy consumption. Austria has largesupplies of wood for bioenergy as 46% of the country's total area is forested. Wood,wood chips, and sawdust are used for heating and also in power and district heatingplants. The third important use of biomass is within the pulp and paper industry whereblack liquour is combusted and used in industry processes. In total, a substantial shareof Austrian timber is used as fuelwood. About 25% of the annual cut is used asfuel wood while the other 75% goes to the forest industry. Woodfuel is mainly used inthe industrial sector (18%), the agricultural sector, including farming households(35%) and ordinary households (47%). Wood and wood waste is heating 19% of thehomes in Austria. Other biomass energy sources are biogas, straw and rape-seedmethylester.
3.3.3 PolicyThe nine Lander have significant responsibilities and opportunities in the design oflocal energy policies. At the national level the Ministry of Economic Affairs has theresponsibility for energy matters at close contacts with other concerned departments attimes. Most energy industries are owned by Federal and Lander governments and bymunicipal authorities.
The Austrian energy policy is defined in the 1993 Energy Report. The goals are toprovide a stable energy supply and to consider environmental and social concerns. Theprescribed means include energy conservation, reducing oil consumption and imports,increasing the use of renewables, reducing government intervention, and increasing theuse of market forces. In Austria the Dwelling Improvement Act and the HousingPromotion Act promote bioenergy heating.
Subsidies are offered to biomass district heating plants from both from federalgovernment and the Lander governments. Economic incentives are also directed to
45

smaller wood-fired furnaces for heating and to enterprises that will invest in biomasssystems.
The government acknowledges the positive effects of biomass energy: That it is adomestic energy source, that it contributes less to global climate change than fossilfuels, and that it provides employment and economic benefits to local communities.Therefore the government intends to support bioenergy by administrative and econo-mic incentives. Most Lander also implement their own schemes for promotion ofbiomass energy. In many cities the local utility that runs the district heating facility isowned by the municipality. The municipalities also design local energy plans whereenvironmental concerns often are very important.
Austrian research about biomass energy is mainly conducted with short-term applica-bility. Interest is focused on direct combustion technologies and small- and medium-scale applications. Non-technical questions are also investigated. Considerable advan-ces have been achieved with this research, primarily in the areas of combustion techno-logy and the reduction of emissions.
46

4 The case studies4.1 Pellets in New Hampshire4.1.1 Starting pointNew Hampshire is a small state. It covers only 24,200 square kilometres and has 1.1million inhabitants. The capital Concord has 37 thousand inhabitants. The state econo-my consists of mainly small enterprises in the electronic industry and in the productionof paper, plastic, rubber, and metal. Forestry and tourism are also part of the economyof the state.
The biggest energy consumers in New Hampshire are within the transportation sector(31.3%) whereas 29.1% is consumed in the residential sector, 22.6% in the industrialsector, and 17% in the commercial sector. In New Hampshire primary energy useincreased by 30% between 1980 and 1993. Electricity increased the most whilepetroleum, coal, and natural gas are increasing more moderately.
People in the state are aware that New Hampshire is very dependent on oil and thegeneral perception is that New England is at the "end of the pipeline," and thatincreases in oil prices could have strong negative effects in the state. The risk of realoil shortages over the winter are sometimes expressed. The background is the oil crisisin 1979 and 1980 when the price boomed from $ 0.50 per gallon to almost $ 1.30 agallon. A short peak in the oil price was also noted during the Kuwait crisis in 1990,when the price quickly reached $ 1.50 from $ 0.80 a gallon. Despite these peaks andthe slight price increase that normally happens in the beginning of each winter, the realretail price of heating oil has actually been decreasing since the early 1980s. The mostfrequently used heating fuel is oil. It has 56% of the market, less households usenatural gas, propane, wood, or electric heating according to the New HamspshireEnergy Data and Wood Heating survey of the Governor's office (figure 4).
The annual residential wood heat survey of New Hampshire shows that 9.5% of thehouseholds used wood as their primary heating fuel during the 1995/1996 heatingseason. An additional 15.6% used wood as a secondary heating source. The total sumof households in New Hampshire using wood would then amount to about 112thousand, mostly in single-family dwellings. However, the potential for increasedwood-fuel use is much larger because 38% of those who said they normally did not usewood to heat their homes had access to a wood burning appliance if they needed it.
47

Electric heating
Wood10%
7%
Propane10%
Natural gas13%
Figure 4 Heating methods in New HampshireSource: New Hampshire energy survey
The use of wood as a primary source for heating is slowly decreasing in the statebecause wood-handling takes too much time and that it is inconvenient. The increasingheating methods are natural gas and oil, because of decreasing oil and gas prices andconvenience. Over 50% of the families who use wood purchase their fuelwood, 26%cut their own wood, and the remainder combine purchased and personally cut wood.For water heating electricity becomes more important, 39% used electricity for thispurpose in 1994/1995, whereas 34% used oil. Electricity for cooking was used by 75%of the households. Almost half of the wood burners (44.7%) said that they had heard ofwood pellet stoves.
A comparison of heating fuel prices show that electricity is the most expensive of theheating alternatives (in 1995), 3.35 ECU per GJ. Propane costed 1.34 ECU and oil andwood were the cheapest alternatives with costs of 0.65 and 0.67 ECU per GJ,respectively.
4.1.2 The storyA pellet industry in the United States existed already in the 1970s. The pellets werenormally sold to large customers (e.g., institutions and schools). This first-generationpellet industry, however, did not "take off and some factories had to close.
48

The first pellet stoves for the residential market came in 1981-1982 and the businessgrew rapidly in the western states, Washington, Oregon, and Colorado. This expansionwas partly the result of the technical development of the stove and partly because localemission-restrictions in the mountain area favoured the clean pellet- burningtechniques. Since the mid 1980s the pellet market has been growing and expandingtowards the east, and today the fastest growth of the market is to be seen in NewEngland and around the Great Lakes, whereas it is slowing down in the northwest. Intotal, there are now about 350 thousand pellet stoves all over the United States(Pickering 1996).
The current interest for pellet stoves in New Hampshire is noticeable although theyhave only a limited share of the market when compared with alternatives. Furthermore,when pellets are introduced in the state the hen-and-egg problem occurs. People do notbuy the stoves when there are no pellet factories nearby. And factories need a bigconsumer base to invest in production capacity. However, the market graduallyexpanded into neighbouring states and the stove became more quiet and reliable. Andthe increased consumer base reduced pellet production and distribution costs.
The only pellet producer in New Hampshire started production in 1995. There isanother factory in Massachusetts and one big producer in Quebec, just across theCanadian border. The manager/owner of the new pellet factory in New Hampshire is atechnician and a typical entrepreneur with no particular experience in the energy orforestry businesses. He buys wood residues from many small secondary forest pro-ducts plants in the area. The feedstock is transported by a truck-owner in the samevillage. About 2 to 3 people work in the factory. The wood pellets are then transportedin sacks to stove dealers in the area.
The pellet stove market is expanding in New Hampshire, Vermont, and Massachusetts,although reliable statistics are difficult to obtain. The stoves are demonstrated atagricultural fairs and advertised in newspapers and TV ads. The marketing argumentsare more about "convenience" and "ambience" rather than about an environmentallyfriendly product. People in New Hampshire - a very Republican state - are not too con-cerned about the greenhouse effect and they do certainly not expect any carbon tax intheir state. Nor are there any local regulations about wood-burning stoves.
So what is the future for pellets in New Hampshire and in New England? Right nowthere are 20 to 30 thousand pellet stove owners in New England. There is still a needin the industry to increase this figure in order to have the infrastructure well esta-
49

blished and to get the product better known among the public. The toughest com-petition comes from gas stoves, which are more convenient. The pellet business inNew England is therefore now trying to coordinate its efforts to get pellet stoves betterknown. This is a necessary step for a "niche-within-a-niche" industry, like the pelletbusiness with many small players with limited resources.
4.1.3 TechnologyThe pellet stove is a more convenient and clean bioenergy appliance than the woodstove. It has an automated fuel delivery. In the typical appliance the operator adjuststhe desired heating level which controls an auger that delivers fuel from the hopper tothe fire. In top-feed stoves the pellets are delivered from a tube or a chute above thefire, and bottom-feed stoves deliver pellets from behind or beside the burn pot directlyto the fire. A fan delivers air into the fire and blows the exhaust by-products out of avent pipe that is typically less expensive than a regular chimney.
There are different types and sizes of pellet appliances in The United States. The free-standing pellet stove is supported by a pedestal or legs and is placed on a noncom-bustible floor protector. The vent pipe leads the exhaust gases to the outside. This typeof stove is flexible because it can be placed in almost any living area of the house aslong it is at a specified distance from combustible surfaces. Another pellet appliance isthe fireplace insert, which is placed in an existing, working fireplace. Pellet furnacesdo exist but are not common in the United States
Naturally there is a wide range of sizes of stoves to choose from depending on thepurpose of the stove, house size, and house characteristics. Other qualities that differbetween different brands and price levels are hopper capacity, adjusting controls, fuelcompatibility (whether many pellet types and qualities can be burned with minimaladjustments) and ash-handling system. Some stoves also have such conveniencefeatures as automatic ignition, remote thermostatic control, and large glass view. Animportant extra is the backup power source, which automatically switches on at poweroutages. Another quality of the stove is the blower quietness. The noise-level hasdecreased with the newer brands and is highly and negatively correlated with price.Because the stove normally is placed in a living area the design of the appliance is yetanother important selling issue.
The installation of the stove is often made by the seller. Operation and maintenance -check of burn pot, emptying of ash drawer, cleaning of ash traps, and glass, andinspection of hopper - are generally done by the owner. Pellets are often bought in sacs
50

from the local stove dealer or sometimes from big discount houses ( e.g., Wal-Mart).Official rules and standards have been developed for the safety and performance ofpellet equipment and installations.
When the business experienced its first increase in the western states in the mid-1980s,technical development was rapid. The stoves became more robust and quieter, andself-igniters became standard. Sometimes, however, research, development, andtesting were not thorough and the products were introduced too quickly. Anotherproblem during this period was the bad coordination between the stove manufacturersand the pellet producers. However, after some years cooperation has improved. Peoplein the business have realized the need for joint efforts to communicate with customers,both to educate and increase awareness. Awareness of the product among the public ishowever still low today. The success of the business depend very much on the dealers,and on their interest and efforts in marketing the stove. Where the dealer is dynamicand likes to display the pellet stove, one can see a growth in pellet consumption.
This description illustrates the rather local and fragmented nature of the business.There are efforts to increase cooperation and coordination in the industry, althoughinterest is still low from small and local players. The Pellet Fuels Institute do,however, monitor market development and standards have been established for thepellet qualities which shows that the market is becoming more integrated.
The pellet producer generally works on a local basis producing pellets from woodresidues from different primary and secondary wood processors within a certain radius(about 80 kilometres) of the plant. The feedstock can be both dried and fresh (it needsdrying down to 12% moisture content). The pellets are made mainly of sawdust that isground, dried, compressed, and delivered in bags. The pressing of the sawdust throughsmall holes in a steel die heats and bonds the newly formed pellets. The lignin pre-sence holds the material together so there is generally no need for an additive. ThePellet Fuels Institute has set quality aspects pellets concerning density, dimensions,fines, chlorides, and ash content. The standard-grade pellet contains up to 3% ash con-tent while premium grade fuel has less than 1 % ash content.
The production of a pellet plant is from 0.75 tons per hour (TPH) to 15 TPH. Themajor investment costs include the pellet mill itself, the dryer, the grinding system, andthe boiler heater. The biggest operation costs of the plant are the costs for feedstock,labour, electric power, and bagging (pellets and bags).
51

4.1.4 MarketPellet stoves are more expensive than woodstoves. However, the pellet stove savestime and effort and the heat is clean and comfortable. The important factors about theeconomy and satisfaction of the pellet stove that the presumptive customer normallywill ask are: price of stove and pellets, security of supply of pellets, maintenance,comfort, and available alternatives.
It is important to consider alternative heating options as well. Heating with natural gas,oil, and wood is generally cheaper than heating with pellets. This means that the pelletindustry cannot always provide the most cost-effective heating option and that otherarguments must be employed to boost sales figures, such as convenience when com-pared with wood stoves; or environmental issues and protection of the atmospherewhen compared with oil heating.
One special feature of the pellet business, compared with other biomass energy sectors,is that it is relatively independent of policy actions and represents a new bioenergytechnology in a rather established consumer market. It is therefore interesting toanalyse the different stages in the market introduction of pellet heating and how thedifferent important players think and behave.
The pellets are sold via local stove dealers. The dealers are key persons in theintroduction of pellet stoves in New Hampshire because they have direct and personalcontact with the customer. The dealer can give advice and provide maintenanceinstructions and help the customer to find a professional person for the installation.Buying from a stove dealer often guarantees better customer satisfaction. Pelletproducers do also often prefer to sell the pellets through the specialized stove dealersthan to mass-marketers, such as Wal-Mart or hardware store chains. The latter do notprovide any extra services to customers, and a contract with these mass-marketerswould probably mean a considerably lower profit margin for the pellet producer.
There are very few specialized pellet stove dealers in New Hampshire; the person maysell all types of stoves and boilers and other hardware as well - or he may combine apellet stove business with other activities, e.g. swimming pool installations, etc. InNew Hampshire the degree of market penetration varied in different parts of the state.There aree examples of very successful dealers who even organize courses andinformation evenings for potential stove owners. In other towns, however, the dealermay endure little interest in the pellet business.
52
It is also important for the pellet producer to have a good knowledge about the typicalcustomer, different types of pellet users, and the competing heating options. Onetypical buyer category is a house owner who uses a wood stove and is looking forsomething more convenient. But the stove buyer can also be an older couple with astable income and the wish to keep some of the atmosphere that the wood stoveprovides. There are customers of different types. For some house owners, the directelectric heating system may be replaced or complemented with a pellet stove forpurely economical reasons. Owners of vacation houses may also prefer the pellet stovebecause it is clean and convenient.
From the dealer's point of view some local advertising are sometimes conducted. Thenormal way to market the product, however, is to rely on less mass-focused ways forcommunication (e.g., local radio commercials, demonstrations at fairs, and communi-cation with the customer in the shop).
In general, customers are satisfied with the pellet heating system. Some complainabout noise and dust. As pellet heating is entering the northeast, dealers with someexperience claim that the product they are marketing today has improved considerablyover the last ten years. The noise is much lower now and the feeding mechanisms areimproved.
Pellets for heating in New Hampshire is an example of a small but growing business.The product is beginning to become known among the key players, house owners andheating appliance dealers.
4.1.5 PolicyIn 1993 and 1994 a conference and action plan to promote pellets in the northeast wasinitiated. The activities were co-sponsored by the Department of Energy, the North-eastern Forest Alliance, The Northeast Hearth Products Association, and the PelletFuels Institute. The planned actions included improved cooperation and promotion.
For a period one employed person was employed to promote pellet heating in NewHampshire. However, no substantial state funds have been directed towards anincreased pellet use. Generally, however, the state does not interfer in the residentialheating sector.
53

4.1.6 Local factorsThe approach to energy policy in the state of New Hampshire is very market oriented,and the general ideology is that each system should prove its advantages in a freemarket. There is little public support for renewables, and the introduction of environ-mental taxes is politically impossible. The pellet industry mentions its environmentalfriendliness, but this selling argument is not as important as the convenience aspect.Pellets are marketed as a high-tech version of a cosy wood stove for the modern familywith limited time resources. Furthermore, the advantage of pellets in comparison withoil is that it reduces dependency on foreign oil and builds on a local resource.
The policy approach within the Northeastern Regional Biomass Program is to informthe public about a new and promising heating option as one means of improving thecitizen's ability to secure efficient heating. The second argument for program involve-ment would be that the pellet sector has the potential to draw new employment andbusiness into the state. One important task for the personnel working on this activitywithin the state administration was to persuade and help the pellet manufacturer tostart a production facility in the state. This would mean a higher value use of the forestindustries' waste, some new employment, and more local taxes.
The degree of local competition creates different business opportunities for the pelletsector in different parts of the state. In the rural parts of the state where wood is cheapand the distance to a pellet dealer may be long, stove sales figures will probably staylow. The average income is also generally low in these regions, and therefore it is lesslikely that a pellet marketing effort will bring much success. On the other hand, thereare more opportunities in the southern more populated and affluent areas of NewHampshire. In some locations of these areas, however, an existing gas infrastructuremay make this a less persuasive alternative. Farther south, in Massachusetts, the en-vironmental arguments may begin to be a more important selling argument for pellets.Here, where there will be a higher density of pellet users, maintenance can be moreefficiently organized by the local dealer, and in some areas the pellet sacks can even bedistributed on a regular basis to the customers' homes.
Indicators of a potential market in an arae include many users of wood heat, a highpopulation density, no important competition from natural gas, many households withgood incomes, and down the lane an increased environmental awareness. Otherconditions in New England that can promote the pellet market are that power is ratherexpensive and that nuclear power plants are in disrepute for high costs and badreliability.
54
In brief, the pellet market in New England is fresh, promising but unstable. Somepellet dealers are enthusiastic and others are more prudent. There is much to gain if thepellet market would grow because this would reduce risk for the business and it wouldbecome more stable with a reliable fuel supply and network of dealers and servicepeople. Unit distribution costs would decrease, knowledge about the product wouldspread, transaction costs decrease, and other synergy effects of a bigger market wouldbring benefits to customers.
4.2 Biomass Power in Maine4.2.1 Starting pointThe population in Maine amounts to 1.2 million inhabitants, and in the capital Augusta25 thousand. The population is expected to grow only marginally over the next 20years, according to projections. The state's area is around 80 thousand square kilo-metres. The forest industry is very important for the state together with the foodindustry, fisheries and the tourism business. In the late 1980s and early 1990s the statesuffered a severe economic slowdown. Even during the strong year of 1995 the growthwas only 2% and the jobless rate is 6%, compared with the national average of 5.2%.The expected annual GDP growth, 2.3%, is below the estimation for the United Statesas a whole. Manufacturing employment is decreasing or stable while services areincreasing. Compared with New Hampshire, average incomes are low in the state.
Maine is situated in the Canadian boreal forest. The Northeastern Hardwood Forestcontains birch, sugar maple, and white pine. In Northern Maine the forest mix is 1/3spruce, 1/3 mixed spruce-fir and hardwoods, and 1/3 hardwoods. The land area is 89%forests , the highest percentage in the the United States of which 1.1 M acres are publiclands and 16.5 M acres private forest land owned by 180 thousand forest owners. Inthe southern parts of the state, the owners are small woodlot owners with an averageparcel size of 40 acres whereas a few large forest companies hold the forest land in thenorth.
Primary energy consumption in Maine grew by 37% between 1980 and 1989. Maine istoday in the top in the United States in the use of renewables in the energy mix.Indigenous hydro and wood supply more than 30% of Maine's primary energy needs.Nuclear generation of the Maine Yankee Nuclear Plant built in 1971 is also importantin the electric balance. In Maine firewood has always accounted for an important shareof residential energy use for heating, 22%, while oil has 48% and electricity 20%.
55

Until the 1970s energy planning in Maine was uncontroversial. "..power supplyplanning was accomplished by electric utilities and regulators under the assumption oflittle competition, with relative certainty of demand and cost recovery." (Lee and Hill1995). The change started when the oil prices increased fivefold in the early 1970striggering a high activity among policymakers and planners to introduce alternativefuels. After these price shocks projections expected that the price of energy wouldcontinue to increase, because of continued OPEC sanctions and decreasing oil suppliesin the world.
Power supply decisions had been routinely approved by the Maine Public UtilitiesCommission (MPUC). From 1979, however, the state became more involved in theenergy planning process when it rejected a new proposal for a coal-fired power station.The state wanted instead to investigate other energy alternatives (e.g., biomass power)before any decision was taken.
4.2.2 The storyAfter the Public Utility Regulatory Policies Act (PURPA) and the stateimplementation legislation, The Maine Small Power Production Act of 1979 (MRS A33,§3302), the state authority, the Maine Public Utility Commission (MPUC),demanded that the utilities had to investigate the possibility of contracts withindependent power producers at avoided costs before they invested in any newconventional technology. Maine developed determined policies to implement theintentions of PURPA. The rules for how the PURPA should be implemented in thestate were adopted in 1984 stating that the utilities, and not the state, should signcontracts with the independent power producers. The role of the MPUC would be toset the rules, establish avoided costs, and guide the utilities in negotiating powerpurchase agreements. The new Qualifying Facilities (QFs) were small plants thateither generated and supplied steam in addition to electricity or were fuelled withrenewable resources. These QFs had a rather favoured position because (1) the utilitymust purchase all electricity offered; (2) at a price based on full avoided cost; (3)avoided cost data were public information, available to any QF; and (4) utilities maynot refuse to enter into long-term contracts with QFs.
The utilities started to take bids for new capacity and it became evident that biomasswas very competitive. As a result, many PURPA contracts were signed with differenttypes of non-utility producers: some pulp and paper industries that could put somesurplus electricity on the grid, small-scale producers of hydro and biomass power andindependently owned biomass power plants.
56
The activity grew very fast. In 1982, 0.3 TWh of electricity was produced frombiomass and in 1991 it had grown to 3 TWh. In 1992, 4 million tons of woodfuelswere consumed providing 25% of the state's electricity needs. Together with the hydrocapacity, this makes Maine the state with the highest percentage of renewable energyin the power production. Since 1980 biomass power generation has increased from afew steam and co-production units to 18 co-generation and freestanding plantsproviding 520 MW; 22.8 MW from agricultural waste, 59.3 MW from municipal solidwaste (MSW) and 437.9 MW from wood (Adams and Connors 1995). Between 1985and 1990, oil dependency for electricity production in the state dropped from 50% to10%. The bulk of the contracts were held by the Central Maine Power Company, thedominating utility in the state. A favourable tax treatment for renewable energyprojects between 1981 and 1987 also helped to create a good environment for the newenergy business. The Economic Recovery Tax Act of 1981 provided investment taxcredits and accelerated depreciation schedules for renewable energy projects.However, this ended with the Tax Reform Act of 1986.
The independent power plants are owned either by small- or medium-sized specialisedenterprises or they can be joint ventures. In one case, an experienced forestentrepreneur with good knowledge about forestry operation and timber trade joinedwith an investor from Boston. The contracts are long-term, up to 30 years containingserious penalties if the power producer fails to produce electricity.
The Biomass harvesting is integrated with forest operations. The entrepreneurs are inseveral cases ordinary forest loggers who have invested in chippers for biomassharvesting. The main part of the biomass for the power plants comes from the fellingof trees, that are not demanded by the forest industries, and from wood residues fromforest industries. The trees (and branches) are chipped at the site and directlytransported to the power plant.
In the early 1990s the expansion of biomass power has halted and the debate about thebiomass power producers in Maine can be summarized in the following two aspects:
• High costs: The PURPA contracts were written in the early 1980s. At that time fossilfuel prices were expected to stay high and even increase at a steady pace. Instead oilprices have decreased and the price for electricity from biomass is now very highcompared with the price for state-of-the art electricity production from gas. Thebuying utilities turned to the state administration and to the media in order to bereleased from the contracts. The independent power producers, IPPs, on their side,
57

claimed that the contracts must be honoured - that this is a question of principles.This situation was the background of the demands by the Central Maine PowerCompany to the Governor and the Legislature to consider imposing "excess profits"taxes on the nonutility power producers. Local authorities were trapped in a policydilemma "..finding a strategy that reduced the rate impacts of power purchaseagreements, retained existing economic benefits at some level while not foreclosingfuture viability of NUGs (Non-Utility Generators)". At the same time, during the late1980s and early 1990s, the economic recession contributed to a weak demand andlow tolerance towards increased electricity bills.
• Restructuring of the electricity market: One novelty in the Energy Policy Act of1992 was that a new class of non-utility generators was allowed to operate and thatutilities could be ordered to provide wholesale transmission access. The restructuringof the electricity sector is now in process in several states in the United States.California and New York are in the forefront but there are plans to deregulate inMaine as well. The Maine legislature has required the Maine Public UtilityCommission (MPUC) to make pre-studies of how to design the transition to a morecompetitive power sector in Maine. In these discussions the utilities claim that theymust be compensated for investment in infrastructure, so called "stranded costs."The IPPs however believe that the utilities are exaggerating these "stranded costs."The IPPs also believe that the outcome must guarantee a fair market and that theutilities cannot own both production units and the distribution infrastructure. Inprinciple, however, the IPPs are positive towards the change and towards a moreopen electricity market.
Because of the changed conditions of the electricity market some wood-fuelled powerplants were cancelled in the early 1990s and two other dispatchable contracts weretemporarily taken out of production. Other long-term power contracts with small-scaleproducers were bought out by the utilities. As a result the small-scale power on linewas reduced from 500MW in 1992 to 450 MW in 1995. However, the most importantbiomass power agreements with the paper mills and the independent producers remain.
The answer to this challenge to the policymakers was to design and sign an ElectricRate Stabilization Act (ERSA), that would provide low-interest loans to utilities tofinance electric rate stabilization projects. The requirements for any project supportedby state funds included that it would provide near-term benefits to the ratepayers andthat it would not result in the discontinuation of the operation of any major powerplant of a capacity of more than 50 MW.
58

According to Connors (1995) the important driving forces behind the development ofthe wood energy industry in Maine depend on a set of factors:• Burning wood in Maine is a tradition. This is the case not only in the residential
sector but also in the pulp and paper industries. The use of wood and bark for energypurposes has always been well known and practised.
• There is an established wood procurement system. The business was not built fromscratch. There was a well-established infrastructure of loggers and transporters thatswiftly could assure the flow of woody biomass from the forests to the power plants.
• Maine naturally provided ample opportunities for cogeneration projects. The scopefor cogeneration was promising in the 16 pulp and paper mills, a dozen largesawmills, and approximately 500 other wood processing plants.
• The PURPA opportunity appealed to native Maine entrepreneurial experience. Thegeneral experience of wood-based products and the spirit to take advantage of theopportunities in this business lead to the creation of new independent powerenterprises.
• Maine had a well-developed knowledge of the forest resource. As a result of theforest industry and logging activities there were adequate data available about theforest resource. The fuel supply to the new facilities could hence be planned by thedevelopers.
• Public policy. The public policy strongly supported and assisted the new industry asan indigenous energy source to start up and develop.
Several of the factors are aspects of the fact that the biomass energy industry in thestate is a good complement to the existing forest industry.
The future of biomass is uncertain. It will be hard to compete on an open market whereprice is the most important selling argument. However, the true answer to how com-petitive the bioenergy option may be in Maine is yet unanswered since the contractsthat were signed with the utilities apparently were too uniform and not flexible enoughto account for a changing environment.
4.2.3 TechnologyTable 17 shows the different types of qualifying facilities (QFs)in Maine in 1992,which was about the time when the biomass power production in Maine peaked.
59

Table 17. Biomass power in Maine 1992
Fadlity Type
Small Cogenerators
Large Cogenerators
Small Power
Totals
No. of Plants
5
5
10
20
Contract Capacity
5MW
274 MW
212 MW
491 MW
Source: Connors, 1995.
The greatest contract capacity, is with the cogeneration facilities at the pulp and papermills. This situation is not a surprise because these facilities already have a transportinfrastructure in operation. The pulp and paper mills can furthermore provide greatwood fuel resources together with economies of scope combining in-house consump-tion with contract sales to the grid. The small cogenerators facilities consist of saw-mills that before the PURPA were unable to sell electricity to the grid because ofutility disinterest. The overall size of this production is insignificant, however.
The contractual capacity is mainly distributed among the three biggest utilities. Thedeals with the utilities are generally production contracts with fixed prices andquantities, and high penalties if these amounts are not delivered. Over the years thecontract prices for the new plants have decreased.
Fuel procurementThe nature of the wood supply reflects the connection with the forest industry. Muchof the wood is harvested as residues from timber fellings and the other major sourcesare residues from wood and forest-related industries. The woodfuel is bought fromcontractors and the plant managers are eager to maintain stable relations with thesuppliers. Contractors' records are followed concerning accuracy and also accordingthe environmental considerations.
Important fuel resources are also whole tree chips and mill residues, consisting ofshavings, edgings, trimmings, bark, and chips produced in 500 primary and secondarywood-processing plants in the state. A survey in 1989 showed that, of a totalproduction of mill residues of 3.4 million tons, approximately 27% was used for on-site energy production while 32% were sold for fuel and 32% were sold for some otheruse, animal bedding, and horticultural mulch.
60
The increased biomass power capacity induced a quick adaptation of the wood fuelbusiness. The number of chip harvesting firms increased from 5 in 1980 to 74 in 1990.These contractors normally have evolved from conventional logging firms by addingbiofuel handling equipment (harvesters and chippers) to the machinery. The con-tractors made these investments in order to diversify and to provide more services tothe forest owners. Some contractors chose to switch completely from forest harvestingto wood fuel harvesting.
Normally, the trees and branches are transported to a forest road where they arechipped and transported to the power plant. A total of 80 thousand acres is subjected totree biomass harvesting annually, which is approximately 30% of the total harvestedarea. The biomass comes from white pine saw log management programs, plantationthinnings, timber-stand improvement cuttings, and saw log harvesting. Many forestowners are positive about the new development because they appreciate that low-valuetrees and logging residues are removed from the tracts. In adition to income, cull andpoor quality trees are pulled out, and stand quality and regeneration conditionsimproves. Some forest owners also appreciate the neat looking result.
Over the years the price for chips has stayed rather stable: $22/green ton.Mechanization and the growth of the market has increased productivity. There is alarge physical supply and most plants have a sufficient supply within a distance of 50miles.
The new development opened up new opportunities for silvicultural practices. Theremoval of biomass species in thinning and stand-improvement operations canincrease the value of the standing forests. Information and demonstration projects onwood fuel harvesting can promote the silvicultural benefits from biomass harvesting.In this way fears of the negative effects on the forest of biomass harvesting can bepartly avoided and appropriate practices can be demonstrated.
The issue of nutrient depletion from bioenergy harvesting have been raised in the state.Critics have claimed that this threat increases when the nutrient-rich branches andneedles are removed from the site. However, at the present scale this effect has not yetbeen detected, and various processes may slow down the process (deposition,weathering, etc.). The recommendation by researchers is that where there is a poornutrient situation, biomass harvesting should not be executed. Moreover, the high level
61
of stem damage on remaining trees that occurred during the early 1980s was the resultof poor practices. Good planning and careful operations can reduce these problemsconsiderably.
CombustionIn the early stages of development, the utilities raised concerns about the reliability offorest fuel based energy plants. Biomass power has, however, proven to be veryreliable, compared with nuclear and hydro alternatives. The new technology has alsoproven to be relatively clean; emission numbers are satisfactory. The biomass powerplants are, furthermore, subject to air emission regulation and license requirements,and the ashes are used for soil improvement.
The environmental problems cited are connected to air emissions. Wood combustionreleases particulate matter (PM), oxides of nitrogen (NOX), carbon monoxide (CO),and volatile organic compounds (VOCs). Regulations under the Clean Air Act andrelated state laws restrict the emissions of the "criteria" pollutants SOx, NOX, CO, lead,and VOCs. Air emissions licenses are required for any boiler almost the 10 GJ perhour range. Monitoring is concerned with opacity, SO2 and, in some cases, CO. At oneplant the regulations included limits of 0.6 pound of CO per MBtu; particulate, opacity5% or less, since 1995 and NOX must not exceed 0.3 pound/MBtu. Most plants usemulti-cyclone and electrostatic precipitators for emission control. In the future,emission regulations will probably become even tighter.
Ash is produced both as fly ash from the exhaust steam and as bottom ash from thecombustion chamber. It is used for liming and fertilizing agricultural land. Smallamounts of heavy metals and of cadmium do not cause any particular concern, and theregulations of the state approve land application of wood ash that has been tested forheavy metals and cadmium. The Maine legislature has also authorized the creation ofthe Sludge and Residuals Utilization Research Foundation in 1988 with the objectiveof conducting and funding research on controlled land application of sludge andresiduals.
Biomass power is a reliable energy technology. It is not very sophisticated, and ismostly based on off-the-shelf hardware. Several equipment producers wanted toparticipate in the fast growing business but after some years fewer realistic choices ofequipment were available and few machinery producers remained in the market. Manyplants also faced practical problems in the beginning. As one plant owner put it: "It'snot a science, it's an art" to run a biomass power plant where the fuel may vary with
62
charges and in suppliers at different times of the year. Some plant managers are formermariners from the Maine shipping industry. These persons often appreciate theopportunity for a job in the state, and they are popular to hire because they are used tokeeping engines working and solving problems quickly.
4.2.4 Economy and MarketThe biomass power industry produces electricity for 6 to 13 cents/KWh (1996) andthey generate over two thousand jobs. The power contracts are mostly for 15 to 30years; 80% of them are signed between power producers and the most powerful utility,Central Maine Power Company (CMP). Purchased power from independents repre-sents 46% of the CMP sales (1994). Although the power is produced in an efficientway, there are cheaper alternatives for power production on the market today,especially natural gas.
The socioeconomic impacts of the wood power industry can be described in severalways: they can be direct or indirect, or through taxes. It is very complicated to conducta true socioeconomic comparison between different kinds of energy systems. Oneestimate in 1990 assessed the direct and indirect employment generated by the biomassbusiness to 2700 people employed. More than 40% of those jobs were directly linkedto the direct operation of the power plants.
Wood energy extraction and transport is managed by independent logging contractorsand transporters. Chip harvesting contractors typically invest over a million dollars infelling and skidding equipment, chippers, etc. In 1980 there were five chip harvestingfirms in the state, and in 1990 there were 74 logging contractors active producingwhole tree chips for energy and clean chips for the paper market. Contacts betweenpower producers and contractors have a long-term character where reliability andenvironmental considerations by the contractor are important.
Chip harvesting contractors evolved from conventional logging firms by adding spe-cialized equipment. Forest owners, contractors, resource management professionals,and consulting and public foresters are also important players in the business.
The major competitor for the moment is the natural gas industry. "If we don't doanything, gas will take over" is one statement from the bioenergy sector. The naturalgas market was beginning to get deregulated five years ago, and new pipelines arepresently planned to run through Maine. Because of these developments the fuel willprobably be more aggressively marketed in the coming years.
63

4.2.5 PolicyThe state policy in Maine was not only essential for the initial growth of the biomasspower industry but policymakers have also implemented measures to avoid thenegative effects of the new industry (e.g., through environmental damage). In 1991 theLegislature established a Commission on Comprehensive Energy Planning. ThisCommission issued a final report in May 1992 that for the first time explicitly includedissues related to environmental impacts in the development of Maine's energy plan-ning and policy. In 1993 the "Study Group on Energy and the Environment" wasformed. One issue for the group was to look at the full-cycle costs of different energyoptions.
In 1987 the environmental law "An Act To Ensure Sound Management of BiomassFuel Wood Harvesting Operations" was enacted. This act was later replaced by a"Forest Practices Act" that applies to all commercial forest product harvesting,including biomass harvesting. An Act To Prevent Overutilization of Forest Resourceswas also passed. This law is an amendment to the Site Location Law and the Land UseRegulation Commission and adds a wood supply adequacy review-requirement as anadditional criterion of approval.
Laws and regulations in Maine that influence aspects of the siting and operation ofpower plants are:• Site law: Approval for building is required with many aspects, including
environmental, considered.• Air law: Both federal and state. Licenses limit the discharges.• Zoning laws• Shoreland zoning and Natural Resources Protection Act: Limits cuttings on
shoreland and in certain areas.• Solid Waste regulation: Ashes.• Transport and Public Safety regulations.• Municipal Powers: Municipal planning.• Forest Practices Act: A new law concerning clearcutting and regeneration.
An important policy issue at present is also the future deregulation of the electricitymarket discussed above.
4.2.6 Local factorsThe fact that the development of the biomass power business was so rapid in Maine isnot a coincidence. Several factors provided the conditions for this independent busi-
64

ness to grow. Of course, the PURPA legislation paved the way for the development,but the thorough implementation of the law in Maine is probably explained by thegreat awareness among the policymakers of the potentials of biomass power businessin the state.
One important factor in this development was the tradition of forestry and the presenceof the forest business infrastructure. This meant that there was already a good generalawareness about forest utilization among the local business, population, and policy-makers of large biomass-based industries. Forestry management and harvestingmethods were known, and the policymakers saw the importance of the forest sector forthe local economy.
The extensive area of forestland in the state and the existing forest sector also meantthat there were significant supplies of wood fuel at a low cost. These quantities areboth in the forms of forest industry wood-waste and logging residues and low-valuespecies in the forest.
There was furthermore a good infrastructure for biomass business already in place.The machinery and trucks could quickly be adapted to the new handling systems. Roadnetworks had been established by the forest owners.
The existing forest sector also provided good know-how about biomass transport andprocessing. The logging contractors could easily assimilate the new assortment. Andwithin the forest industry some initial R&D efforts were conducted before the largeinvestments were decided upon. The industry possessed basic knowledge about bio-mass combustion because logging residues had long been burnt in the plants for energyor disposal. In addition some knowledge of burners and their safe operation originatedin the shipping sector in Maine.
Good knowledge and a positive attitude guided local authorities to apply reasonablerestrictions and investigations on the effects of biomass energy use. Therefore majorenvironmental problems could be avoided without unnecessary restrictions on theactivity.
The problems with the long-run and expensive contracts with the utility industry wereunlucky for the biomass sector. Biomass power came into disrepute and an inflameddebate emerged. One explanation for this furor was that there were few buyers - withthe CMP as the dominating one - and therefore contracting practices stayed unflexible
65

and uniform. Maybe this problem could have been avoided if there had been morebuyers of the biomass power?
4.3 Pellets in Goteborg, Sweden4.3.1 Starting pointGoteborg is Sweden's second city after Stockholm and traditionally it has been thecountry's most important seaport. With population around 430 thousand, Goteborg isnow an industrial town with important export industries. Trading and shipping are stillimportant as are banking and insurance.
Goteborg is not a typical city for Sweden in its energy use because the use of biofuelsis low and Goteborg furthermore has access to natural gas. Total consumption ofnatural gas is low in Sweden. About 25% of the city's energy use is from electricity ofwhich half is nuclear and the other half is hydro power; 31% is from oil and oilproducts which are mainly used in the transport system. Natural gas and butanerepresenting 9% of the total energy consumption are used in the residential sector andin industry. Total energy use in Goteborg amounts to 56.6 PJ (1991) (Johansson 1996).In the residential sector, the main energy sources are electricity and oil. The use ofnatural gas and district heating is much more limited. The renewable share includes thefuelling with municipal solid waste (MSW) and some use of wood powder and olivehusks in the district heating plants. Some ten wind-power plants are situated along theshore, and wood is used in some houses for residential heating. No exact accountexists of the total use of wood, or pellets, for residential heating. Most space heatingwithin this sector is by electricity or with oil furnaces.
The theoretical supply of biofuels within a radius of 150 kilometres from Goteborg is8907 GWh/year, or 56% of the total energy consumption in 1991, consideringtechnical and ecological restrictions. Logging residues and short-rotation woody cropscould theoretically constitute the bulk of the biomass quantity (Johansson 1996). Inthis scenario pellets and district heating with biomass would represent a highproportion of the residential heating quantity.
The connection between Goteborg and wood pellet heating lies in the fact that themarket leading firm in pellet equipment technology is situated there. A distributionsystem for pellets is also being introduced in the area where the fuel is transported tothe customers from the pellet factories. However, pellet utilization for residentialheating is being developed in different parts of Sweden. Presently, Sweden is thesecond pellet producer in the world, after the United States. The production in 1996
66

was 500 thousand tons distributed from 16 different factories all over the country. Themost important buyer category for the moment is home-owners who use wood forheating and want to change to something more convenient. Pellets also need lessstorage space and have a better emission performance compared with traditional woodheating systems.
Pellet heating has many advantages for the Swedish customer, more than that it isenvironmentally better than wood heating systems and that it produces less CO2-thanmost fossil fuels. In the Swedish environment pellet heating is also economicallyadvantageous because pellets are exempted from the various taxes placed on other fueltypes. It may very likely pay to switch from electricity or oil to pellets.
In a few seasons, the pellet market in Goteborg has increased manyfold. Pellet systemsdo, however, have the image of being a novelty that is mostly purchased by "early-adopters." In order to reach the larger consumer categories, equipment manufacturersare making efforts to develop the system and make it more user-friendly.
4.3.2 The storyThe pellet users of today are not representative of all home-owners. They are normallypersons who have a certain technical curiosity and a particular reasons to switch topellets, in addition to the fact that they have chosen pellet systems for economicreasons. Most pellet users in the Goteborg area bought their equipment from a localmanufacturer who also is a market-leader. The pellets are produced in factories inUlricehamn or Vaggeryd within a 150-kilometre distance.
One example of a pellet user is a retired couple that live in a big house (300 squaremetres) in the countryside south of Goteborg. The husband is a carpenter and isconsequently experienced in working with his hands. The couple used oil until the1970s. Then they started to use wood for heating, combined with electric heating.However, the work to buy, transport, chop, and store the fuel wood becamesuccessively more strenuous. In 1994, they heard about pellet heating at a localinformation meeting and also read about different technical solutions in "Rad ochRon," a consumer-interest paper. This convinced the couple to buy a pellet burner tothe house. Apparently the husband also had a professional curiosity about the newtechnique.
The experience from two winters with pellet heating is mainly positive. However, thefirst burner was too weak for the big house and had to be replaced. Some initial
67

problems required more supervision in the beginning, and the couple still complainsabout dust in the pellets. Heating cost has however been drastically reduced, and thesystem works well. Another advantage is that the smoke has become cleaner. In thebeginning, and under bad weather conditions, the smoke could stay for a long time inthe lower areas close to the house. The husband has, however, had to put much work inbuilding containers for pellet storage and the pellet transport mechanisms. He does notbelieve that a person without his practical skills would have managed to solve theseveral minor problems without considerably higher costs.
The second pellet system owner is a younger family with small children. They haverepaired an old house with the ambition to make it environmentally sound by usingrenewable energy and reducing the use of synthetic materials and paints. The earliersystem, direct electric heating, has been replaced by a new central heating systemheated with wood and pellets. An alternative to pellets would have been to use heatpumps, but this alternative soon appeared to be too expensive. Sun-energy equipmentfor water-heating was also installed. Different housing experts and an advisor at thelocal municipality were available with advice during the decision process. Theexperience with the new system is mainly positive. Pellet heating works well whereasthe solar heating installation was according to the houseowner not worth the price.Pellet deliveries and combustion do not cause serious problems. As was the case in theexample of the retired couple, some individual solutions had to be invented for pelletstorage and transport. One more important observation is that the regulating equipmentdoes not integrate the whole "renewable" system. The solar and pellet systems areparallel, which makes the whole system more expensive.
A third pellet user is a shop-owner outside Goteborg. He uses oil heating in the shopand electric central heating in the residence. The decision to use pellets was economic- the aim was to reduce the energy bills. The pellet burners were installed in theexisting central heating systems simultaneously in the shop and in the residence in1994.
During the first year there were problems in adjusting the pellet feeding mechanism,especially when the pellets were dusty and the shopowner had some doubt concerningthe quality of the fuel. The new pellet heating system have, however, saved money.
The general conclusion by the new pellet heating customers is that the pellet systemsare efficient and cost-saving. But the Swedish pellet industry is a business in its in-
68

fancy and first-generation buyers have had to invest both time and effort in order to beable to reap the full advantage of the pellet-heating option.
4.3.3 TechnologyConsumer aspectsCompared with wood heating, the pellet system is very convenient. However, once aday the user should control the combustion and transport function of the burner. Inaddition it is recommended that the equipment be cleaned once or twice a week and amore thorough cleaning is appropriate when the ashes are removed. Finally, the wholesystem should be serviced at least once a year. Ashes are disposed of in the forest or ingardens, but not where edible plants are grown because they can contain heavy metalsand cadmium.
The pellet distribution method varies. The buyer can fetch pellets at the factory orreceive pellets in bulk deliveries. When the number of users increase, the alternative touse bulk transport becomes more profitable. Pellet producers are testing thisdistribution method and are prepared to apply it more generally as soon as theconsumer base is large enough.
In the consumer's house, pellets are stored in special containers that can be bought or,depending on the space available, the house owner can construct his own container.One important positive aspect with pellets is that the fuel is too dry to be consumed bymicroorganisms.
The pellets can be burned in special furnaces designed for pellets, in burners retrofittedin existing furnaces, or in pellet stoves. The combustion parameters can be optimizedso that low quantities of emissions are generated and there is little ash left. It is alsopossible to burn pellets at a low intensity. Good pellet burning equipment shouldinclude a small intermediate container for pellets, automatic monitoring of operation,and safety equipment against fire. It should furthermore produce few emissions, beeasy to clean and remove ashes from, and have an automatic starter.
There are currently no specific marketing efforts by the business in cooperation. Theknowledge of pellets is spreading through rumour and official information.
PelletsPellets are produced in some 16 pellet factories all over the country with producingcapacities from five to 130 thousand tonnes per year. The total production in Sweden
69

is 500 thousand tonnes. The raw material in pellet production is dry wood residuesfrom sawmills and other forest industries. The pellets are from 5 to 12 mm, with thebiggest diameter for the industrial customers (i.e., district heating plants).
EquipmentThe pellet burner market in Goteborg is dominated by one firm. The firm has grownvery fast. The market has now passed through some sort of a pioneer stage and theindustry now has to reach a much broader market, not only persons with specialinterest. The system must become more convenient and it is important to attractcustomers who now use oil. When the market grows, the needs of buyer groups whomay not be confident with improvised solutions to new problems will have to be met.
StandardsAll heating appliances are tested for emissions, efficiency of the burner, and safetyaspects. Tests of performance are also carried out under realistic circumstances.Technically the pellet burners are already of good quality. Practical problems remain,however concerning disturbances in the feeding or too much dust. Sometimes thepellet consumption in the burner is too high.
The producers of pellet burners are discussing voluntary product testing. The aim is tocreate a greater confidence in the product among the public and to avoid that low-quality products will harm market development. There are 12 to 14 manufacturersparticipating in this work. Common EU requirements for efficiency, emissions, andsafety are also in progress.
Product control is easy to apply to new products. There is, however, not much that canbe done to improve old products that are already being used. Standards for pellets,such as those that already exist in the United States, are also being discussed. Thiscould eventually be coordinated with Austrian and German standards. The qualityvariables under consideration are ash content, pellet diameter, length, density, fines,strength, net calorific value, moisture content, sulphur content, chlorides, andadditives. The applied standards will, however, probably include fewer parameters.Pellet quality testing will be one means to diversifying the market, where high-diameter and low-grade fuel go to the big heating plants and higher quality and smallerdimensions are directed towards the residential market.
70

EmissionsThe best available burning technique for pellets performs at least as well as oil burnersregarding emissions. Significant difference can however be suspected betweenlaboratory tests and the performance of pellet heating systems in field operation. Thereare also possibilities to improve pellet appliances further in order to attain a morecombustion and hence less emissions. The conclusions of the tests are that althoughthe burners perform well at full capacity, they should be more independent ofcombustion intensity and of the operator.
4.3.4 EconomyThe price of a pellet burner is between $1800 and $2500. The stove is generally moreexpensive, between $2500 and 3000. And a new chimney will cost about $120. Withthe fuel costs of today this investment will generally pay back after 3 to 10 years. Thefuel costs for pellet heating are now 30% lower than for oil and 50% lower comparedwith electric heating.
The price of pellets are stable to slightly decreasing in Sweden. At the retail level theprice for pellets is about $146 per ton or 0.8 0 per MJ. There exists today a network ofabout 60 retailers whose number is constantly increasing.
4.3.5 Market structureThe pellet-producing factories are integrated upstream with a sawmill or other forestindustry. One pellet factory 150 kilometers from Goteborg, the Vaggeryd factory, isowned by the main sawmills in the area which guarantees a stable supply of wood fuelto the factory. About 90% of the raw material used is sawdust from sawing mills andthe rest is shavings.
The Vaggeryd pellet factory collects the raw material within 100 to 150 kilometresfrom about 15 big sawmills. Theoretically almost any biomass material could betransformed into pellets (e.g., green wood as well). The bulk of the production is fordistrict heating plants and about 25% goes to smaller customers. Single-family housesrepresent only 2% of the market. But the small customers are expected to increase theirshare whereas the district heating plants maintain their present consumption level. Thefactory is also trying to promote pellet use in various ways. They have, for instance, atoll-free number where would be customers can learn more about the pellet heatingtechnology.
71

The potential future market will diversify and sell high-quality pellets to house-ownersand less expensive and lower quality pellets to the industrial customers. Today thepellet market is in its infancy, and the volumes and infrastructures for pellet delivery toindividual residential customers are not yet very stable. If tighter environmentalpolicies are introduced in Denmark, it could become a new large market for thefactory.
The appliance market for the pellet burners is also in its infancy. The market aroundGoteborg, and in Sweden, is dominated by one firm and there is not very muchmarketing or coordination going on. It appears that the market for heating appliancesin Sweden like that in the United States is built on personal contact and trust. Marketintroduction takes time because it concerns one-time investments where the asym-metric information between the seller and the buyer must be compensated by a trust-creating strategy by the former.
4.3.6 PolicyThere are few regulations in Sweden on pellet use except regarding the installation of apellet-burning appliance, safety regulations, and municipal permitting.
In 1997 a law was passed allowing subsidies for the change of heating systems fromelectric heating to such alternatives as district heating or pellets. This will improve theconditions for further growth of the pellet business. The decisive driving factor,however, is that biofuels are untaxed in the Swedish economy.
4.3.7 Local factorsGoteborg has a favourable situation for pellet market growth. The major equipmentmanufacturer is situated in Goteborg, and there is also a high population, many ofwhom live in single-family houses. From the inland there is a large supply of forestfuels from the county of Smaland, which also has a high concentration of forestindustries.
Early adopters play an important role in this early stage of the expansion of pelletheating technology. They find a satisfaction in learning about the new technology andat the same time display a good technical competence and a willingness to participatein the further development of the product. To succeed, the pellet industry must reachthe potential early adopters and maintain good relations with them. If these personsfeel that the equipment producer is interested in their experiences and advice, it is verypossible that the novelty will spread.
72

4.4 District Heating in Enkoping, Sweden4.4.1 Starting pointEnkoping is situated at the lake of Malaren only some 70 kilometres from Stockholm.Its total area is 1185 square kilometres and the municipality has 36 thousand inhabi-tants, around 20 thousand of whom live in the town centre. The population is expectedto increase in the coming decades. There is important industrial production of ventila-tion equipment and tools. Military units are also based in Enkoping and thesurroundings are dominated by agriculture, mainly cereal production, and forestry.
The energy consumption In Enkoping (1995) is shown in figure 5.
Electricity ^ ^ H35% ^^M•W
Gasol N. •2% ^
Unrefined biofuels
flBl^ 25%
•Ri lxHHHlk•HlIIl^ ^ ^ S j PelletsW ^ ^ ^ ^ 3%
VOil products
35%
Figure 5 Energy consumption in EnkopingSource: Municipal energy plan
The total energy consumption in Enkoping is 4.6 PJ. About 30% of this quantity is fortransporting, 35% for heating and 28% for electricity in households and industry.About 28% of the total energy supply is provided by biofuels, 25% of which comesfrom unrefined woodfuels and 3% from pellets. The district heating plant uses biofuelsfor 80% of its heat production. Enkoping has a comparatively large biomass energysector and plans to keep the fossil share as low as possible. The Energy Plan ofEnkoping states that it is difficult to reach any considerable reductions of CO2
emissions from the present, already low level (see figure 5 on energy use inEnkoping).
73

4.4.2 The storyEnkoping has a long history of district heating. The expansion of the system that tookplace from 1969 to 1980 was aiming at a more efficient heating system and an im-proved emission control. The development followed three stages: First oil-fueledmobile centrals were established; then a number of stationary stations were added; andfinally, a main power plant was built in 1977. During the expansion, the activity wastransformed into a municipal utility in 1972.
In 1980 the plant started to use biofuels. The initiative came from the military base inthe city as it believed that the use of biofuels would improve fuel supply security.Later, it was also realized that biofuels could be a reliable and economical energysource for the plant. During the 1970s and 1980s, policy shifts motivated the plantmanagers to change fuel policy many times. A fast nuclear expansion in the 1980screated an oversupply of power in the country, and in 1985 the Enkoping plantacquired an electric boiler and electricity began to dominate the energy mix. At othertimes different fuels have been used depending on the current energy policy measuresand on the tax structure.
In the late 1980s it was realized that the town of Enkoping had to increase the heatproduction and that neighbouring Vasteras (100 thousand inhabitants) also neededmore power. The two towns decided, therefore, to construct a bio-fueled co-productionfacility at the site of the heating plant in Enkoping, and a separate power company wascreated, EN A Kraft AB, jointly owned by the municipal utilities of Enkoping andVasteras. The Swedish state contributed with 9 million ECU. Construction workstarted in 1992 and coproduction started in 1995. The unit has a capacity of 22.5 MWof electricity for Enkoping and Vasteras and 45 MW of heat to Enkoping. The totalinvestment amounted to 36 million ECU.
Most of the biofuels are bought from the large local fuel-dealing company,Malarbransle. The manager of the central heat and power plant finds it crucial to havea large and important counterpart for the supplies because he depends on reliablebiofuel deliveries. On the other hand, he also wishes to have a more diversified marketand more sellers of biofuels in the future.
4.4.3 TechnologyFuelThere is no specific wood energy harvesting technology yet developed in Sweden. Theequipment is mostly modified forest machines, and the operating personnel for biofuel
74

collection also come from the forest sector. Special equipment is developing as themarket continues to grow. Most of the wood is taken from final fellings, but in thefuture, thinnings may be made for energy purposes, although this quantity isuneconomical today.
The local forest owners' coop, Malarskog has one person responsible for the loggingoperations in Uppland and Vastmanland. The same person also organizes the woodfuel transports of logging residues and branches. The tops and branches are transportedto the roadside where they are chipped and transported to the power plants. Althoughthe activity has improved the margins are still small. Low fuel prices and an unstablepolitical situation are the main problems for the business.
All wood fuel deliveries are made according to plans in the contracts. There are somelocal contractors who collect the forest fuels, and the residues from final fellings are indemand except for those on extremely unaccessible tracts (long distance to road, wetland etc.). It is important that the deliveries in the contracts are made on schedulebecause the buyers are very sensitive to disruptions in the supply.
The percentage of forest owners who offer wood fuels is between 40 and 60%. Ifprices increase, more forest owners will start to sell woodfuels and wood will be cut onmarginal land along fields, etc. The entrepreneurs have received education in environ-mental issues connected to wood fuel collection. And the contracts include sectionsabout environmental concerns and protection of soil and the trees left standing.
ConversionThe Enkoping plant uses a dedicated furnace for biofuels. Many district heating plantsin Sweden, however, use more flexible fluidized bed furnaces to be prepared for policyshifts. The manager of the Enkoping plant thinks that in the future more refined forestfuels pellets will be available which will allow purchases from greater distances.
Theoretically, the city of Enkoping could be self-sufficient in electricity from the co-production if electric heating in many houses was replaced by by wood pellet heatingor district heating.
There are now plans to expand the district heating system. At the current electricityprices it is, however, not profitable for many houses without water systems to connectto the district heating system.
75

4.4.4 Economy and MarketMalarbransle AB is the dominating biofuel dealer in the region. The wood fuel comesboth from forest industries and from logging operations. Malarbransle AB buys thefuel from the forest owners in the region and cooperates with the forest owners'cooperative, Malarskog. Another important wood fuel source is marginal quantities ofpoor quality roundwood that otherwise would be transported to pulp and paper mills.A small but increasing percentage of the wood fuel quantity is harvested willows.
Initially, the wood fuel market emerged in 1976 when policy efforts were directedtowards an increased use of alternatives to oil. However, the big increase in biofueltrade came when fossil fuel taxes were levied in 1991. The company was created in1992 and has grown quickly, from 1.4 PJ in 1992 to 4 PJ in 1996. The office is small(five people) and their job is to act as middlemen between the forest owners and theconsumers (mainly district heatmg plants).
Competitors in the local wood fuel market are SYDVED, SABI, and STORA, who alloperate in the area and in neighbouring counties.
The margins are thin on the fuel-handling activity of the biofuel market. Prices aredecreasing and there is a constant policy risk e.g., that a tax on biofuels could changetheir competitive advantage. Therefore only old machinery is used for collecting forestwood fuels and reinvestments are low. One contractor on average collects 80 to 90thousand cubic meters per year. Profits are 0.60 to 0.70 ECU per cubic meter of chipsin 1995/96 and 0.90 ECU in 1996/97. For the landowner wood fuel is of a marginaleconomic importance of the total income from a final felling 1 to 2%. Furthermore,there are risks of damaged roads and trees as a result of the operation. The positiveside of woodfuel collection is that the land will be tidy and easy to regenerate after thetops and branches have been removed.
One other alternative considered by the heating company is to promote the growth ofwillows by farmers. The power plant company in Enkoping is prepared to make long-term commitments to purchase this fuel in order to start the production. The farmers,on the other hand, are hesitant to commit to the growth of tree species on theirfarmland.
76

4.4.5 PolicyEnergy policy of Sweden has been very volatile, and as a consequence, fuel choices fordistrict heating have varied over time. In 1985 an electric boiler was the main choicefor a heating plant because Swedish energy policies had promoted the construction of alarge nuclear capacity. At the same time forest fuels were regulated to be used by theforest industries. In the late 1980s energy policy promoted coal as one means ofreplacing oil. Today, however, coal is heavily taxed and cannot therefore compete withbiofuels. The history of policy changes have created an ambition among the districtheating plants in Sweden to be flexible and to adapt fuel consumption to changingpolicy schemes.
The most important policy measures for the Enkoping combined heat and power plantare the taxes on fossil fuels that have improved biomass competitiveness and theinvestment subsidy to the coproduction unit.
4.5 Biomass District Heating in Austria4.5.1 Starting pointBiomass, primarily wood, has a strong position as an important energy source forresidential heating in Austria. Its importance has increased since the oil crisis in the1970s, and biomass now accounts for 13% of Austria's primary energy demand. Usingwood for heating has furthermore always been natural in Austria.
The underlying factors behind the development of biomass district heating (BMDH) inAustria are the good supply of biomass for energy originating from the forest, forestindustry, or agricultural sector; the federal and Lander government's subsidies forbiomass district heating investments; the villages' geographical compactness suitablefor district heating installations; and a social determination in the villages to investtime and effort for a common district heating project (Rakos 1995).
4.5.2 The storyThe first biomass district heating plant was established in 1979. In the beginning,sawmills ran the plants using wood residue from sawmilling operations. Latermunicipalities and farmers' cooperatives became more active, and in some cases, localutilities started BMDH projects. The development was fast. The rate of growth was onaverage 25% since 1987, and in 1997, 300 biomass district heating plants had beenbuilt. The activity was often supported by subsidies from federal authorities and fromthe Lander. The activities have been subject to local political situations. In Lander thathave a strong energy utility with strong connections with the political institutions it
77

was difficult to assemble political support for BMDHs. In parts of the country wherethe utilities did not have a total hegemony of the market and where the farmers'interest had strong support, the BMDSs gained a more determined support. The naturalgas industry has strongly opposed the support to the BMDHs.
One underlying purpose for supporting BMDHs was to improve economic conditionsfor farmers. Therefore agricultural cooperatives had an easier task than othersacquiring favourable financial conditions and subsidies.
4.5.3 TechnologyThe BMDH plants in Austria are mostly rural installations of a rather small size,between some hundred KW up to 8 MW. The technology comes from the woodindustries which had been burning wood residues for a long period. Burningtechnology was developed by some small enterprises and few public funds has beendirected towards this R&D area.
The government has mainly supported R&D for emmision control and safety. Intoday's plants equipment like continuous power control, electronic combustioncontrol, and flue gas condensation can be found. Less R&D effort has been spent onimproving the overall technical performance of the plants. Heat losses caused by poorinstallation and inappropriatene sizes of pipes, vents and electric pumps are oftenencountered in the BMDH plants. The problem is largely the result of poor knowledgeamong plant managers, planners, and plumbers.
The BMDH plants also display some unexpected technical deficiences. For instance,the average specific investment costs show clear diseconomies of scale by increasingcosts per installed power effect. Furthermore, there does not seem to have been anylearning within the industry as costs for newer plants are not less compared to theplants that were built during the first years.
4.5.4 EconomyImportant subsidies was one driving force behind the BMDH plants. Plants run byfarmers' cooperatives were the most favoured and could receive up to 50% of costs indifferent contributions from local and federal governments. Other operators (e.g.,sawmills, municipalities, and utilities) usually received 10 to 30% (Rakos 1995).
The economic performance of the plants varies very much. It has been found thatprofitability depends on heat sales and heat costs and to a lesser degree on investment
78

and fuel prices. It appears that the best recipes for success included recruitment ofmany subscribers and avoidance of conflicts in the village during the initial buildingphase. Fuel price may be a hidden cost in the calculations because wood fuel issometimes extracted at high cost and without proper compensation by some of thevillagers themselves. In other places the fuel is fetched from nearby forest oragricultural industries and forest wood fuel is only used as a backup fuel. Hence, thefuelwood is normally supplied locally and not on a national or regional woodfuelmarket.
Evaluations of existing projects revealed that heating costs have not generally beenreduced. This was, however, in many cases compensated by greater comfort. A fewBMDHs have had serious economic problems. The underlying reasons may have beenthat the site was unsuitable for a BMDH, that the size was incorrect, or that manage-ment was ineffective. How these almost bankrupt enterprises should be treated by theauthorities is a complicated political issue.
4.5.5 Local factorsThe community dimension has been very important in the development of theBMDHs. The positive local effects of the projects have included the following:
• The BMDH have been perceived as a contributor to the local economicdevelopment.
• The extraction of low-quality wood has been seen as a method to improve forestconditions.
• The new project has brought economic profits and prestige to the village.
The important motives for the consumers to connect to the district heating plant werethat:
• They have wanted to make a contribution to the environment.• They wanted to support regional development and local farmers.• They appreciate the comfort of BMDH: Continuous heat supply and savings in
terms of time and work when compared with the old heating system.
An investigation found that one important driving force behind the development inindividual villages was that there was some type of social cohesion and a willingnessto work for common goals (Rakos 1995).
79

The major barrier at local level was that some villagers distrusted the new technology.This distrust for the novelty did even create conflicts in the village between peoplewho expected the project to bring new dynamics and hope for the community, andothers who saw the proposed plans as strange and potentially dangerous. In generalconflicts during the planning and establishment of the district heating plant seriouslyincreased the costs for the project.
80

5 Discussion5.1 Critical Factors to Bioenergy Market DevelopmentIt is difficult to list nontechnical barriers to the implementation of bioenergy marketswithout, at the same time, discussing the driving forces for the business. These arerather two complementary perspectives on the same reality. It is, for instance, oftenstated that a low potential supply of biomass is identified as one important barrier to afurther development of a bioenergy business. If, however, the nontechnical barrier isremoved (e.g., access to cheap feedstock is arranged) this achievement may become adriving force for the continuing bioenergy development. Consequently, barriers ordrivers to the implementation of bioenergy could be labelled something more neutral,like critical factors. These critical factors should not be regarded as a once-for-allchecklist to be used without reflection but rather as a framework for the analysis ofbioenergy potential.
Because bioenergy often creates jobs in the region and activates the local economy,local authorities have an interest in helping these industries to start up. This help mayinclude real economic incentives or it can be through information and promotion. It isalso important that local governments have the competence to prevent any negativeside effects from the bioenergy industry. Without a considerable local support, it isvery likely that a bioenergy business will fail.
5.2 The FrameworkFor a bioenergy enterprise [e.g., a Combined Heat and Power (CHP) plant thatproduces heat and power from biomass] the key to achieving competitiveness is, ofcourse, to increase productivity from all factors of production, to reduce costs, andsucceed in the marketing efforts. A particularly important type of cost at the earlystages, when the business still is defining itself and the market is generally thin, are thetransaction costs (i.e., the costs for market search, measurement, negotiation,contracting and contract enforcement). As the business grows, innovative technical andorganizational solutions are normally found that increase productivity and reducecosts, including transaction costs. In the example of the CHP plant, cheap feedstockmay be obtained in the form of biomass waste from some other industry (e.g., a forestindustry); contracting practicies and standards may improve market efficiency;feedstock deliveries may be better coordinated; innovation will take place; etc. Thesuccess of a bioenergy technology will also depend on the degree and kind ofcompetition in the production factor markets and in consumer market. Policy
81

measures, finally, both on national level and in the regional or local community, mayalso influence the final outcome of the bioenergy business.
Table 18 contains the most important barriers and drivers for bioenergy marketgrowth, according to our focus on production structure and market structure. Theframework of the table must not be seen as a simple checklist but rather as a tool forstructuring an analysis of an existing, or projected, bioenergy activity. Each factordescribes one aspect that influences productivity, production costs, or transaction costswithin the business, and in the end determines whether or not the bioenergytechnology can grow in competition with other energy forms.
82

Table 18. Critical factors for bioenergy implementation, drivers and barriers
Factor
Integration
Scale effects
Competition in bioenergysector
Competition with otherbusiness
National policy
Local policy and opinion
Description
Bioenergy business cooperates with other activities (e.g., forestry oragriculture), synergy effects are exploited.Integration can be vertical or horizontal.Integration can be formal or informal.Integration can concern feedstock, equipment, infrastructure,knowledge, or other production factors.
Larger production series reduce unit costs.Positive network externalities are acquired.Standards are introduced that reduce transaction costs.Specialists (e.g., brokers, and consultants) enter the market andimprove market performance.Learning and R&D create a growing market which trigger more R&Detc. (positive loop).
Competition in bioenergy equipment or fuel market improvesinnovation and productivity.Competition requires an unregulated market with several players.
Bioenergy market growth depends on a business's competitivestrength compared with that of other businesses in feedstock,equipment market, and consumer market.Competition can be in price, quality, services, or through "barriers toentry."
Policy may favour or disfavour bioenergy in competition with otherenergy forms.Policy may be market regulations, R&D funding, subsidies, taxes,information.Trade organization and other groups try to influence policy accordingto their program (lobbying).
Support from policymakers and public opinion makes the introductionof bioenergy business easier. This support depends on the generalpopulation's knowledge and awareness about bioenergy systems.
By integration is meant both formal mergers and acquisitions of different businessesand more informal but stable business relations. Most current bioenergy activities areintegrated with other industries by using the other industry's waste as fuel. Thisbiofuel may be residues from forest industries, or from agricultural processes ormunicipal solid waste. The use of existing structures may also involve machines, forest
83

roads, or know-how. Integration can be used both as a means of acquiring cheap inputfactors and reducing transaction costs and risk. Actually, where the bioenergy marketshave been able to grow, the positive complementarity effects between businesses (e.g.,a forest sector and the bioenergy producer are as important as the competition for thebiomass fuel between the sectors, discussed in Sedjo (1997).
The bioenergy industry can also take advantage of scale effects. The growth of abioenergy business creates markets for specialists - consultants, fuel dealers, andbrokers - who will improve the market's overall performance. Bigger series ofmachinery and equipment and larger volumes of biofuels contribute to reducedproduction costs. Growing markets also create incentives for more money being spenton R&D, standards, and marketing. Therefore, a growing market may lead to reducedcosts at different stages and a positive loop may be created.
For a new bioenergy technology, competition is essential for technical development.The basic criteria for a competitive market are that there are many sellers and manybuyers and that there are few restrictions to entering the business. If the market iscompetitive both in technology and in contracting, a gradual learning and innovationwill take place and a variety of technical solutions and contracting practices will betested in the race for shares of the growing market. However, there is a potentialcontradiction between the scale effects described above and competition. In order toexploit certain scale effects (e.g., marketing, standardization, etc.), the market playershave to cooperate and reduce competition in certain areas. Sometimes, however,especially when a small bioenergy industry with limited resources is threatened bytough competition from other energy forms - (e.g., oil, natural gas, coal) - , the beststrategy for the individual bioenergy enterprise may instead be to put cooperation withother bioenergy businesses before internal competition in order to meet the biggerthreat of the competing energy technology.
The two means to improvements, integration and scale effects, may in some situationsrepresent two incompatible strategies. Integration often requires local adaptation to alocal counterpart. But in order to profit from scale effects, the bioenergy businessneeds on the other hand, to create a set of standards that are especially designed for theindustry.
Competition with other business is maybe the most important factor to consider for aprospective bioenergy investor. This competition may take place both on the marketfor inputs, primarily the feedstock market where a bioenergy plant competes with
84

another biomass buyer (e.g., a pulp-and-paper plant or a particle board industry), andin the consumer markets, where competition may come from oil, gas, or electricity.Competition will, of course, be in price and quality. An established energy industrycould also try to introduce barriers to entry for bioenergy competitors by strategicmoves in the market or by influencing energy policy.
It is not always easy to determine if a country's energy policy favours or disfavoursbioenergy development. Often incentives and disincentives are in place simul-taneously. It is, however, clear that most bioenergy markets today depend on energypolicy support (e.g., through subsidies, taxes, or other incentives). Key issues in thisrespect are whether energy policies can be expected to remain stable and how muchthe bioenergy promoters can influence the policy design.
One final factor for the success of the bioenergy industry is the support by localpolicymakers and the local population. A favourable attitude in the local communityhelps the bioenergy industry in several ways: expediting permits, anhancing publicrelations, increasing local demand, etc.
5.3 Application of the Framework in Cases Studies of Existing Bio-energy Markets
5.3.1 Pellet heating in New HampshireThe application of Table 18, Critical factors for bioenergy implementation to the pelletheating sector in New Hampshire is shown in Table 19. Several important criteria forpellet market growth are highlighted. The sector integrates upstream with the woodindustry, which provides the raw material for the pellet production, and downstreamwith the stove dealer network. Cooperation within the business (e.g., for marketmg,etc.) is an important success factor that is recognized by the industry. Quality standardsfor pellets have already been introduced in the United States and efforts are now beingmade to increase joint marketing efforts of pellets in the nation with the objective ofincreasing the competitive strength of the industry in relation to the other energytechnologies.
85

Table 19 Critical Factors for Bioenergy Implementation: Pellets in New Hampshire
Factor
Integration
Scale effects
Competition in bioenergysector
Competition with otherbusiness
National policy and policyinfluence
Local policy and opinion
Description
Pellet stoves are coproduced with other stoves.Pellet factories use wood industry residues and contract with localtransporters. Pelletizing equipment is comanufactured with agriculturalequipment.Pellet and stove dealers also sell other stoves, equipment for swimming pools,etc.
The stove market is homogenous and integrated all over the United States.Standards, large market, and national business organization create scaleeconomies for the whole market.Learning has taken place and the growing market has supported technicaldevelopment.Joint marketing of the pellet technology is needed to expand the pelletbusiness.
The market is competitive. Many stove manufacturers, pellet producers,dealers and consumers are in the market. Competition helps to improve thestoves and pellets.It is in principle an unregulated market.
Little competition on feedstock market: some forest industries compete for thefuel.Tough competition with natural gas, oil, wood, and electricity in heatingmarket.
Few regulations for the pellet market.Small federal support has been given to information and coordination projectsfor pellets.
Favourable attitude by local population and by the state authorities but nosubsidies have been given.Pellets is a local fuel that creates local employment.Oil is regarded as unreliable and pellet has the advantage of being a local fuel.
Table 19 helps the reader to make some conclusions about the strengths and weak-nesses of the pellet business. Further success of the pellet sector in New Hampshiredepends on how well the business can perform regarding each of these factors. Theremust be a continuing supply of cheap wood residues from the forest industry and may-be the coordination with the sawmills and secondary wood industries could improve.One critical issue is whether the business manages to grow and improve cooperation tobe able to reach customers and market pellet heating without disturbing the ongoingcompetition between different stove brands and pellet manufacturers. The lowdependency on energy policies makes the pellet heating business less vulnerable to
86

policy changes. On the other hand, the pellet sector has not received many benefits andthe members in the industry do not have the experience to influence policymakers.Finally, the local connection is a strength that could be better used by the wood pelletbusiness.
5.3.2 Biomass power in MaineCritical factors for the biomass power industry in Maine is shown in table 20.
Table 20 Critical Factors For Bioenergy Implementation: Biomass Power In Maine
Factor
Integration
Scale effects
Competition inbioenergy sector
Competition with otherbusiness
National policy andpolicy influence
Local policy and opinion
Description
High degree of integration with forest industry regarding logging, forest roads,contractors, knowledge, infrastructure, equipment.Forest industries coproduces power for the grid and internal heat in industrialprocesses.
Fuel prices are stable or decreasing which indicates a process of learning, andpositive network effects on wood fuel market.
Competition existed between power producers in the initial bidding phase forcontracts - but not afterwards due to long contacts.Competition exists between equipment manufacturers, between sellers of woodfuel (forest owners and forest industries), and between contractors.Imperfect competition between utilities (before the restructuring of the powermarket); Central Maine Power has dominated the market.
Little competition for wood residues (e.g. from board industry).Tough competition from other fuels (oil, natural gas, and coal) in electricitymarket. And the competition will increase even more after the deregulation.
Public Utility Regulatory Policies Act of 1979.Tax subsidies for biomass in the 1980s.Deregulation of power market from 1995 will mean increased competition forbioenergy power.
Positive local opinion: Biomass brings employment, business, and silviculturalbenefits.There is, however, an environmental opinion against biomass power and againstclearcutting.Consumer complaints of high electricity prices.The implementation in Maine of PURPA was determined.The state of Maine has monitored and regulated the bioenergy sector to restrictnegative environmental externalities of bioenergy.
87

Bioenergy power production in Maine is successful, in part because it integrates withthe state's forest industry. Furthermore, it managed to exploit scale effects as theindustry grew. In addition biomass power is a cost-efficient reliable energy option withfew competitors on the wood-fuel market. However, the design of the power contracts,with long time spans, may have reduced the competition and innovation and deve-lopment activities. The major problem for the industry now is to adapt to an environ-ment where it is less protected by energy policies and where it must do even more todemonstrate its usefulness to the local economy. The example of biomass power inMaine provides a lesson to policymakers on creating a diversity in contracting andadapting more flexible policy measures to more ressemble real markets.
5.3.3 Pellets in SwedenTable 21 presents the situation of the residential pellet heating sector in Sweden. Thebusiness is integrated in a natural way with the forest sector as sawdust is used for thepellet production. The pellet industry is, however, different from the forest industry ina fundamental way in its focus on the consumer market. Therefore, pellet producersand equipment manufacturers have to coordinate efforts to compete with other heatingsystems. Establishment of standards and testing norms is one way to achieve some ofthese benefits. The table also illustrates the most competing energy types and how thebusiness interacts with policymakers and local opinion.
88
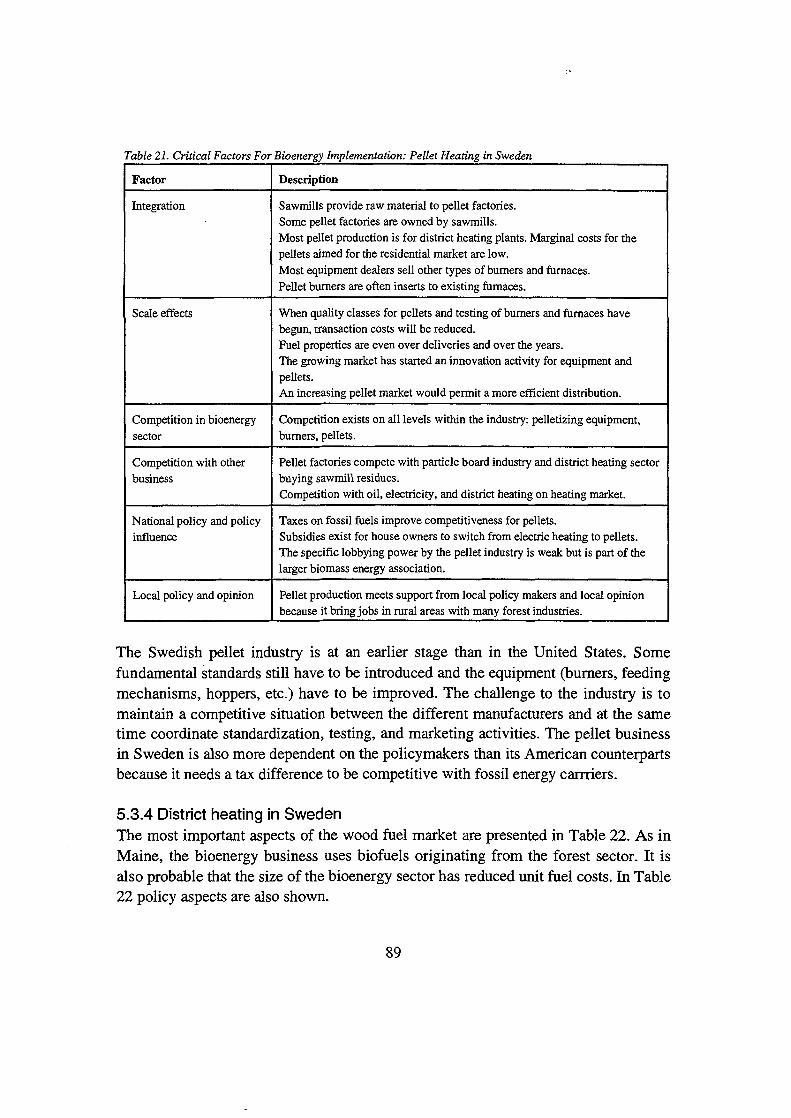
Table 21. Critical Factors For Bioenergy Implementation: Pellet Heating in Sweden
Factor
Integration
Scale effects
Competition in bioenergysector
Competition with otherbusiness
National policy and policyinfluence
Local policy and opinion
Description
Sawmills provide raw material to pellet factories.Some pellet factories are owned by sawmills.Most pellet production is for district heating plants. Marginal costs for thepellets aimed for the residential market are low.Most equipment dealers sell other types of burners and furnaces.Pellet burners are often inserts to existing furnaces.
When quality classes for pellets and testing of burners and furnaces havebegun, transaction costs will be reduced.Fuel properties are even over deliveries and over the years.The growing market has started an innovation activity for equipment andpellets.An increasing pellet market would permit a more efficient distribution.
Competition exists on all levels within the industry: pelletizing equipment,burners, pellets.
Pellet factories compete with particle board industry and district heating sectorbuying sawmill residues.Competition with oil, electricity, and district heating on heating market.
Taxes on fossil fuels improve competitiveness for pellets.Subsidies exist for house owners to switch from electric heating to pellets.The specific lobbying power by the pellet industry is weak but is part of thelarger biomass energy association.
Pellet production meets support from local policy makers and local opinionbecause it bring jobs in rural areas with many forest industries.
The Swedish pellet industry is at an earlier stage than in the United States. Somefundamental standards still have to be introduced and the equipment (burners, feedingmechanisms, hoppers, etc.) have to be improved. The challenge to the industry is tomaintain a competitive situation between the different manufacturers and at the sametime coordinate standardization, testing, and marketing activities. The pellet businessin Sweden is also more dependent on the policymakers than its American counterpartsbecause it needs a tax difference to be competitive with fossil energy carrriers.
5.3.4 District heating in SwedenThe most important aspects of the wood fuel market are presented in Table 22. As inMaine, the bioenergy business uses biofuels originating from the forest sector. It isalso probable that the size of the bioenergy sector has reduced unit fuel costs. In Table22 policy aspects are also shown.
89

Table 22. Critical Factors For Bioenergy Implementation: Biomass District Heating In Sweden
Factor
Integration
Scale effects
Competition inbioenergy sector
Competition withother business
National policyand policyinfluence
Local policy andopinion
Description
Wood fuel comes from forestry and forest industry indicating positive scale effects onthe market.The fuel dealers are generally connected with forest companies and the biofuels trade isintegrated with roundwood trade.Biomass is often used together with other fuels (oil, electricity, coal) in the heatingplants.
Fuel prices have decreased as volumes have increased.Learning and technical development are taking place in the industry.Large market allows for coordination of deliveries.Specialized biomass harvesting contractors have appeared in the business.
The degree of competition emong suppliers and buyers varies geographically.District heating plants are natural monopolies in the area.
The heating plants are competing for wood fuels with the board industry.There is a competition with oil, electricity, pellets, natural gas, and coal on energyconsumer market.The competitiveness of district heating is low for single family houses.
Fossil fuels taxes support growth of biomass sector.Investment subsidies are granted to CHP plants using biomass
Often good local support because biomass energy has a good reputation.Biomass in general is considered to bring more local jobs than other fuels.
The wood fuel market is very integrated with the forest sector. However, it has alsoreached a volume sufficient to allow for positive scale effects. The problem forbioenergy district heating is that it depends on the implementation of favourablepolicies. The bioenergy interests are able to influence both the national and localpolicymakers. The industry also has a good reputation at the local level because itprovides jobs and local economic activity.
5.3.5 District Heating in AustriaThe most important critical factors for biomass district heating in Austria is shown intable 23. One important success factor for the village heating plants is that the projectsoften have broad support in the village community. The problems include a lack ofpositive scale effects and few competitive markets for the inputs, biofuels, equipment,and services. Table 23 also indicates the high policy dependency of the business.
90

Table 23. Critical Factors For Bioenergy Implementation: Biomass District Heating In Austria
Factor
Integration
Scale effects
Competition inbioenergy sector
Competition withother business
National policy
Local policy andopinion
Description
Some district heating equipment can be coproduced with other district heating equipment.Fuel is often waste from wood or agricultural processing industry.Local informal fuel supply by forest-owning farmers can be combined with forestmanagement.BMDH project is integrated in village community activities.
No positive scale effects for investment and operation.Small scale effects for the whole sector through learning and network externalities.Some specialized consultants have entered the market.
Competition ought to exist in equipment market but does not seem to have worked.Small official biofuel market increases risk.Little competition in fuel market.
Little competition in the feedstock market - local integration often sought for instead (e.g.,wastes from nearby factory are bought).However, some competition is found between heating plants and other buyers of biomasswaste.Competition with individual oil heating and with natural gas in some places.
National and state subsidies to investments.Rural and farming interests have political support.Natural gas industry has a strong lobby.
Biomass district heating is often seen as positive for rural farming interests.Some villages have strong solidarity and spirit for common projects.Conflicts in some villages, however.
5.4 RecommendationsIn this paper we have presented a framework for the identification of drivers of andbarriers to bioenergy technology implementation particularly concerning commercialmarket introduction. The framework is robust and suitable for the analysis of differenttypes of bioenergy sectors. This advantage is because it is based on recognizedeconomic concepts. It is general in scope without being too rigid. Table 24 shows theframework with an extended set of questions that may be relevant for differentprojected or existing bioenergy markets.
The framework can be used in many circumstances, mainly when a preliminaryassessment of the potential for bioenergy investments is being investigated. However,for a final investment decision or before a policy scheme is decided, more elaboratecalculations do of course have to be carried out.
91
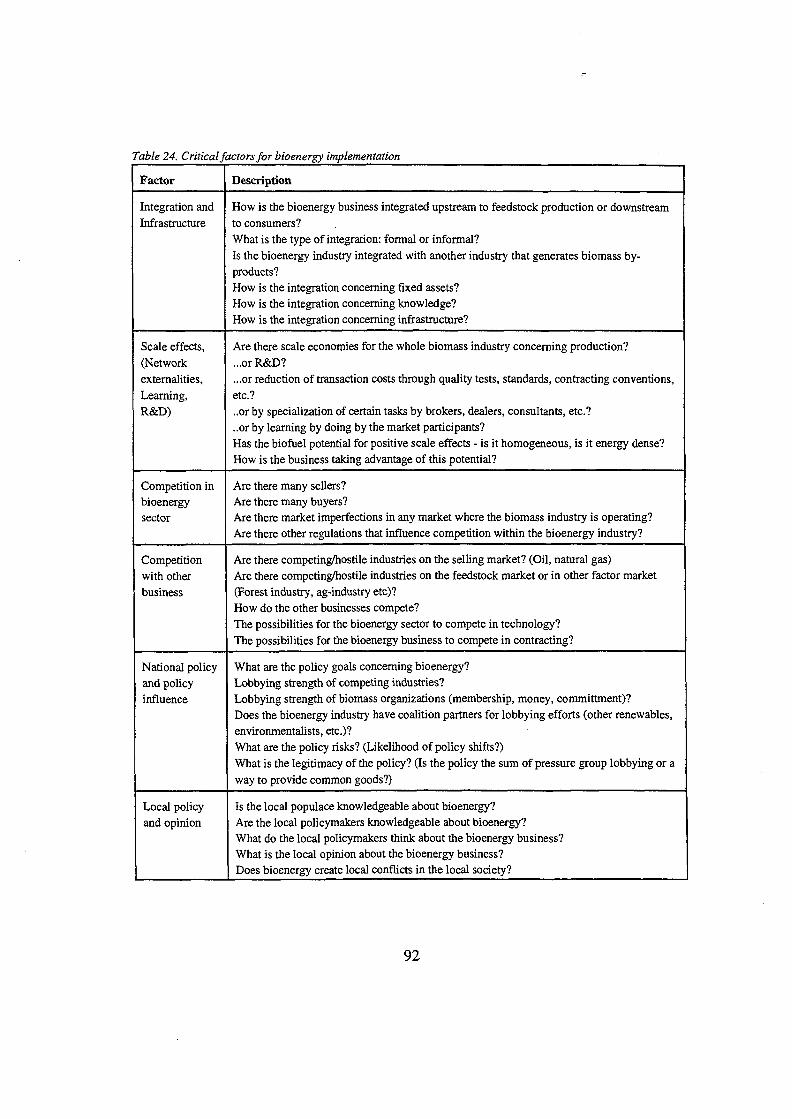
Table 24. Critical factors for bioenergy implementation
Factor
Integration andInfrastructure
Scale effects,(Networkexternalities,Learning,R&D)
Competition inbioenergysector
Competitionwith otherbusiness
National policyand policyinfluence
Local policyand opinion
Description
How is the bioenergy business integrated upstream to feedstock production or downstreamto consumers?What is the type of integration: formal or informal?Is the bioenergy industry integrated with another industry that generates biomass by-products?How is the integration concerning fixed assets?How is the integration concerning knowledge?How is the integration concerning infrastructure?
Are there scale economies for the whole biomass industry concerning production?...or R&D?...or reduction of transaction costs through quality tests, standards, contracting conventions,etc.?..or by specialization of certain tasks by brokers, dealers, consultants, etc.?..or by learning by doing by the market participants?Has the biofuel potential for positive scale effects - is it homogeneous, is it energy dense?How is the business taking advantage of this potential?
Are there many sellers?Are there many buyers?Are there market imperfections in any market where the biomass industry is operating?Are there other regulations that influence competition within the bioenergy industry?
Are there competing/hostile industries on the selling market? (Oil, natural gas)Are there competing/hostile industries on the feedstock market or in other factor market(Forest industry, ag-industry etc)?How do the other businesses compete?The possibilities for the bioenergy sector to compete in technology?The possibilities for the bioenergy business to compete in contracting?
What are the policy goals concerning bioenergy?Lobbying strength of competing industries?Lobbying strength of biomass organizations (membership, money, committment)?Does the bioenergy industry have coalition partners for lobbying efforts (other renewables,environmentalists, etc.)?What are the policy risks? (Likelihood of policy shifts?)What is the legitimacy of the policy? (Is the policy the sum of pressure group lobbying or away to provide common goods?)
Is the local populace knowledgeable about bioenergy?Are the local policymakers knowledgeable about bioenergy?What do the local policymakers think about the bioenergy business?What is the local opinion about the bioenergy business?Does bioenergy create local conflicts in the local society?
92

The application of this framework can provide a first test and a preliminary informa-tion about the bioenergy market potential in a region. It can be used in the followingcontexts:
National policy : When the policymaker wants to find the most promising potential forbioenergy and has to attain maximum market growth for a certain sum of publicspending.Choosing policy means: A good appraisal of the bioenergy market can help thepolicymaker apply the appropriate policy means (e.g., subsidies, information, ortesting).Local policy: The characterization of local bioenergy markets can help the localpolicymakers spot realistic bioenergy potentials.Investment: It may help an investor spot the possibilities and threats for an investment.Credit: The risks and potentials for the technology can be identified. A risk profile canbe described.Business cooperation: Bioenergy business organizations will find the right issues forcommon action, be it lobbying, standardization, or joint marketing.
Further developments of the model would include a higher degree of detail (under thesame principal structure) of aspects that in certain cases could be relevant for theprospects of a bioenergy business. The advantage of the framework is that it can beapplied for many different purposes and in different environments while stillmaintaining theoretical structure of the relationships to be investigated.
Further development could also include use of the framework for the assessment of anew or emerging bioenergy market. So far the demonstrations of the framework haveonly involved the case studies that were used in its development. A proper test wouldbe to apply the framework in the assessment real problem where actual drivers andbarriers for the future development have to be identified and discussed.
Because large sums may be focused on different support policies for bioenergyimplementation, a quick tool to identify barriers and drivers is needed. This frameworkhelps people to spot critical factors for bioenergy growth, and it is hoped that, it maythus save money.
93
Literature
Abernathy, W. J., and B. S. Chakravarthy. 1979. Government Intervention andInnovation in Industry: A policy Framework. Sloan Management Review, Spring 3-18
Adams S. J., and J. F. Connors. 1995. In the Aftermath of PURPA: The future of theBiomass Energy Industry in Maine, pp. 1302 - 1308. In Proceedings from the SecondBiomass Conference of the Americas. National Renewable Energy Laboratory,Golden, Colorado.
AFB-Nett. (European Agriculture and Forestry Biomass Network). 1995. To Establisha European Network to Co-ordinate Information Exchange Between National BiomassEnergy Programmes on Agricultural and Forestry Biomass (AFB-Nett). Phase 1 FinalReport. EU ALTENER. ETSU, Harwell, Didcot, UK.
Anon. 1994. Principles and Guidelines for the Development of Biomass EnergySystems. A Report from the National Biofuels Roundtable. Washington, D.C.
Anon. 1995. Economic and Environmental Opportunities Through Biomass Develop-ment. Report of the CONEG Governors' Biomass Policy Roundtable. Washington,D.C.
Anon. 1996. Bioenergy '96. Proceedings of the Seventh National BioenergyConference. September 15-20, 1996, in Nashville, Tennessee. Hosted by the South-eastern Regional Biomass Energy Program. USA.
Becker, G. 1983. A theory of competition among pressure groups for politicalinfluence. Quarterly Journal of Economics 48(3):271-400.
Berry, L. 1993. A review of the market penetration of U.S. residential and commercialdemand-side management programmes. Energy Policy (January 1993):53-67.
Chartier P., G. L. Ferrero, U. M. Henius, S. Hultberg, J. Sachau, M. Wiinblad. 1996.Biomass for Energy and the Environment. Proceedings of the 9th European BioenergyConference in Copenhagen 24 - 27 June 1996. Pergamon Press, Oxford. U.K.
95

Connors, J. F. 1995. The Wood Fired Electric Generating Industry in Maine. Un-published document. Maine State Planning Office, Augusta, Maine.
EIA (Energy Information Administration). 1996. Annual Energy Outlook 1996 WithProjections to 2015. U. S. Department of Energy, Washington, D.C.
EIA (Energy Information Administration). 1995. Renewable Energy Annual. U.S.Department of Energy, Washington, D.C.
EIA (Energy Information Administration). 1993. Renewable Resources in the U.S.Electricity Supply. U.S. Department of Energy, Washington, D.C.
Eikeland, P. O. 1993. U.S. energy policy at a crossroads? Energy Policy 21 (Octo-ber):987 - 999.
Hamrin, J., and N. Rader. 1993. Investing in the Future. A Regulator's Guide toRenewables. The National Association of Regulatory Utility Commissioners,Washington, D.C.
Hektor B., 1990. Aktorsystem for Biobrdnslen — Manga medverkande men fakarnintressenter. Department of Forest Industry Market Studies, Swedish Universityof Agricultural Sciences, Uppsala, Sweden.
Hektor B., G. Lonner, M. Parikka. 1995. Tradbranslepotential i Sverige pa 2000-talet.Department of Forest Industry Market Studies, Swedish University of AgriculturalSciences. Utredning 17. Uppsala, Sweden.
Hillring, B. 1996. Administrativa styrmedel pa biobrdnsle-marknaden - byggnadslagoch lag om trdfiberrdvara. Report 44. Department of Forest Industry Market Studies.Report 44. Swedish University of Agricultural Sciences, Uppsala, Sweden.
Hjalmarsson, A. K., K. Hedin, L. Eriksson L., and L.-A Cronholm. 1996a. Biobrdnslefor el och vdrme. Report 4670. Naturvardsverket, Stockholm.
Hjalmarsson, A. K., K. Hedin, L. Eriksson L., and L.-A Cronholm. 1996b. Lokalasatsningar pa biobrdnslen. Report 4671. Naturvardsverket, Stockholm.
96

Howarth, R.B., and B. Anderson. 1993. Market barriers to energy efficiency. EnergyPolicy 21: 262-272.
IEA (International Energy Agency). 1996. Energy Balances ofOECD Countries 1993-1994. OECD, Paris.
IEA (International Energy Agency) Bioenergy Agreement 1993. Tackling the Non-Technical Barriers to the Production and Use of Bioenergy. OECD, Paris.
Jackson, T. 1992. Renewable energy - Summary paper for the renewables series.Energy Policy 20:861 - 883.
Jenkins, A. F., R. A. Chapman, and H. E. Reilly. 1996. Tax barriers to biomass andother renewable generation technologies, pp. 665 - 670. In 1996. Bioenergy '96.Proceedings of the Seventh National Bioenergy Conference. September 15-20, 1996, inNashville, Tennessee. Hosted by the Southeastern Regional Biomass Energy Program.USA.
Johansson, J. 1996. Energisystem for Goteborgs kommun helt baserat pa fornybarenergi. Institute of Physical Resource Theory, Chalmers University of Technology,Goteborg, Sweden.
Klass D. L. 1995. Biomass energy in North American policies. Energy Policy23(12): 1035-48.
Lee, C. R., and R. C. Hill. 1995. Evolution of Maine's electric utility industry, 1975 -1995. Maine Policy Review (October): 17 - 27.
Maurice, S. C , and C. W. Smithson. The assimilation of new technology: Economicvs. technological feasibility, pp. 173-197. In Advances in the Economics of Energy andResources. Vol 3.
Medhurst, W.H., V. Pollard, J. Hainsworth, D. Hogg. 1997. The Implementation ofNew Energy Technologies: Non-Technical Barriers and Policy Responses. Publishablefinal report, EU-JOULE contract J0S3 CT95 0001. Priestley House, Birmingham,U.K.
97

Moskovitz, D. 1993. Renewable Energy: Barriers and Opportunities, Walls andBridges. The Regulatory Assistance Project, Gardiner, Maine.
Muehlenfeld, K. J.; D. I. Bransby, P. C. Badger. 1996. Common elements of sucessfulbiomass projects, pp. 415 - 421. 1996. In Bioenergy '96. Proceedings of the SeventhNational Bioenergy Conference. September 15-20, 1996, in Nashville, Tennessee.Hosted by the Southeastern Regional Biomass Energy Program. USA.
NREL (National Renewable Energy Laboratory). 1994. Biomass Power Industry -Assessment of Key Players and Approaches for DOE and Industry Interaction. NREL,Department of Energy, Washington, DC.
Nichols, A. L. 1994. Demand-side management - Overcoming market barriers orobscuring real costs? Energy Policy 22(10):840 - 47.
Rakos, C. 1995. The Diffusion of Biomass District Heating in Austria. Express path.CEC Contract No. EV5V-CT92-0086. Institute of Technology Assessment, Vienna.
Rollins, M. L., D. T. Bradshaw. 1996. Wood waste co-firing: Some policy conside-rations, pp. 578 - 581. In 1996. Bioenergy '96. Proceedings of the Seventh NationalBioenergy Conference. September 15-20, 1996, in Nashville, Tennessee. Hosted by theSoutheastern Regional Biomass Energy Program. USA.
Sanderson, G. A., R. A. Harris, and S. A. Segrest. 1996. Successful strategies for bio-mass energy projects, pp. 105 - 112 In 1996. Bioenergy '96. Proceedings of theSeventh National Bioenergy Conference. September 15-20, 1996, in Nashville,Tennessee. Hosted by the Southeastern Regional Biomass Energy Program. USA.
Sedjo R.A. 1997. The economics of forest-based biomass supply. Energy Policy25(6):559-566.
Skog, K. E, and H. N. Rosen. 1997. United States wood biomass for energy andchemicals: Possible changes in supply, end uses, and environmental impacts. ForestProducts Journal 47(2):63-69.
98
Smith, C. L., and R. S. Montjoy. 1996. Bioenergy policy: Predictable problems fromthe public sector, pp. 687 - 694. In 1996. Bioenergy '96. Proceedings of the SeventhNational Bioenergy Conference. September 15-20, 1996, in Nashville, Tennessee.Hosted by the Southeastern Regional Biomass Energy Program. USA.
Stern, P. C. 1986. Blind spots in policy analysis: What economics doesn't say aboutenergy use. Journal of policy Analysis and Management. 5:200 - 227.
Sutherland, R. J. 1991. Market barriers to energy-efficient investments. The EnergyJournal 12:15-34.
Teece, D. 1979. Integration and Innovation in the energy markets, pp 163 - 212. InAdvances in the Economics of Energy and Resources, R. S. Pindyck (ed.), Greenwich,Connecticutt.
Turhollow; A. 1994. The economics of energy crop production. Biomass and Bio-energy 6(3):229-241.
99

Böcker och rapporterCumulative list of publications Energimyndigheten
Statens energimyndighet har publicerat följande utredningar i bokserien (EB)The Swedish National Energy Administration has published ffie following reports from the book list (EB}
EB 1:1998 Värmeförsörjning vid långa elavbrottEB 2:1998 Miljöanpassade lokala energiplaner. ExempelsamlingEB 3:1998 Videi piemerotas vietejas energosistemas (på lettiska)EB 4:1998 IEA Alternative Motor Fuels. Annual Report 1997EB 7:1998 Environmentally-Adapted Local Energy SystemsEB 8:1998 Miljöanpassad effektiv uppvärmning och elanvändningEB 9:1998 Lokala UppvärmningsStrategier (LUS)EB 10:1998 Keskkonnasöbralikud piirkondlikud energiasüsteemid (på estniska)EB 11:1998 Vietines energetikos sistemos, atitinkancios gamtosaugos reikalavimus (på litauiska)
Statens energimyndighet har publicerat följande utredningar i rapportserien (ER)The Swedish National Energy Administration has published the following reports from the report list (ER)
ER 1:1998 Råd inför ansökan om stöd från EU-programmet SAVE IIClimate Report 1997Utvärdering av demonstrationsanläggningar avseende konvertering av direktelvärmda småhus tillfjärrvärmeDriftuppföljning av vindkraftverkTillförsel av aska och kalk till skogsmark i södra Sverige. Ramprogram askåterföring.Utveckling av nät- och elhandelspriser 1996-1998Askor från sameldning av träbränslen med kol, torv och olja - innehåll och egenskaper.Ramprogram askåterföring.Fördelning av spårämnen mellan olika askfraktioner från förbränning av trädbränslen.Ramprogram askåterföring.Krossaska - Teknik för att omvandla skogsbränsleaska till skogsvitaliseringsmedel.Ramprogram askåterföring.
ER 10:1998 Vedaska och kalk - effekter på upptag av näringsämnen och tungmetaller i blåbär.Ramprogram askåterföring.
ER 11:1998 Spridning av aska från Falu kraftvärmeverk - Fullskaleförsök 1995-1996.Ramprogram askåterföring.
ER 12:1998 Mekanisk bearbetning av bioaskor. Ramprogram askåterföringER 14:1998 Handbok för ansökningar till AltenerER 15:1998 Procurement for Market Transformation for Energy-Efficient ProductsER 16:1998 Energimyndighetens arbete med omställningen av energisystemet. Första halvåret 1998ER 17:1998 Elda pellets direkt i vanliga vedpannor.
Projektrapport från programmet Småskalig förbränning av biobränslenER 18:1998 Miljön och småskalig pelletseldning
Projektrapport från programmet Småskalig förbränning av biobränslenER 19:1998 Analys av dagens bästa teknik för biobränsleeldade pannor mellan 0,5 och 10 MW
Projektrapport från programmet Småskalig förbränning av biobränslenER 20:1998 Analys av dagens bästa teknik för vedeldade villapannor
Projektrapport från programmet Småskalig förbränning av biobränslenER 21:1998 Försöksrigg för parameterstudier och studier av konstruktionselement i vedeldade villapannor
Projektrapport från programmet Småskalig förbränning av biobränslenER 22:1998 P-märkning av pelletsbrännare - utveckling av ett kvalitetsmärkningssystem
Projektrapport från programmet Småskalig förbränning av biobränslenER 23:1998 Katalytisk reduktion av emissioner från småskalig förbränning av biobränsle
Projektrapport från programmet Småskalig förbränning av biobränslen
Försäljning: NUTEK Förlag, 117 86 Stockholm. Fax 08-681 92 05. e-post: [email protected]: NUTEK Förlag, S-l 17 86 Stockholm. Fax +46 8 681 92 05. e-mail: [email protected]
ERER
ERERERER
ER
2:19983:1998
4:19985:19986:19987:1998
8:1998
ER 9:1998

ER 24:1998 Katalytiska metoder för begränsning av skadliga utsläpp från förbränning av biobränsleProjektrapport från programmet Småskalig förbränning av biobränslen •-
ER 25:1998 NUTEKs forskningsprogram Småskalig förbränning av biobränslen. Sammanfattning och utvärde-ring. Projektrapport från programmet Småskalig förbränning av biobränslen
ER 26:1998 Provning av rökgaskanaler till pelletskaminerProjektrapport från programmet Småskalig förbränning av biobränslen
ER 27:1998 Partikelstorlekens inverkan på upplösningen av härdad träaska. -Simulering i laboratorieförsöksamt modellering av kinetiken för upplösningen. Ramprogram askåterföring
ER 28:1998 Kol-98ER 29:1998 Utvecklingen på elmarknaden 1998ER 30:1998 Critical Factors for bioenergy technology implementation. Five case studies of bioenergy markets
in the United States, Sweden and Austria
Böcker och rapporter om energi utgivna av NUTEK 1996-1997Books and reports on energy issues published by ibeSwedish National Board for Industrial and Technical Development 7 996-1997
B 1996:1 IEA Bioenergy Annual Report 1995B 1996:3 Co-operative Procurement. Market Acceptance for Innovative Energy-Efficient TechnologiesB 1996:4 Miljöanpassad effektiv uppvärmning. 20° - men hur?B 1996:5 Lagar för lokala energisystem - en översiktB 1996:9 IEA Alternative Motor Fuels. Annual Report 1995B 1997:1 IEA Bioenergi Annual Report 1996B 1997:5 Environmentally-Adapted Local Energy SystemsB 1997:6 IEA Alternative Motor Fuels. Annual Report 1996R 1996:2 Bergskyddad lagring av oljeprodukter och råolja. Från 30-tal till 90-tal.R 1996:5 Uppföljning efter 2,5 år av genomförd försöksverksamhet.
Utvärderingsrapport 7 - Bättre energiräkningarR 1996:6 Informationsmetoder vid köp av villavärmepumparR 1996:7 Hushållens krav på elräkningen och annan energiinformation. En sammanfattning av tre delstudierR 1996:8 Marknadsplan för föreningen Sveriges EnergirådgivareR 1996:9 Effektiv kommunikation för en rationellare användning av energiR 1996:13 Effekter av askspridning i skogen. Askåterföring till skogsmarkR 1996:14 Kartläggning och syntes av teknik- och logistiksystem. Askåterföring till skogsmarkR 1996:15 Karaktärisering och behandling av träaska. Askåterföring till skogsmarkR 1996:16 Funktionen Energiförsörjning. Programplan 1997-2001R 1996:18 Biofuels for Transportation. From R&D to MarketR 1996:19 International Evaluation of Swedish Research Projects in the
Field of Short Rotation Forestry for EnergyR 1996:22 Aktörsanalys energiteknik. Sammanfattning och slutsatserR 1996:27 Karaktärisering av förgasningsaskor från skogsbränslen. Ramprogram askåterföringR 1996:28 Biobränsleaskors innehåll och härdningsegenskaper. Ramprogram askåterföringR 1996:29 Wood ash or dolomite treatment of catchment areas -effects on mercury in runoff waterR 1996:31 Sammanfattande utvärdering av teknik och logistik vid salixskörd.R 1996:37 Effekter av ökad biobränsleanvändning. En sammanställning av kunskapslägetR 1996:49 Upptag av tungmetaller i svamp och bär samt förändringar i florans sammansättning efter tillförsel
av aska till skogsmarkR 1996:50 Härdade vedaskors upplösning i skogsjord. Ramprogram askåterföringR 1996:56 Kol-96R 1996:57 Internationellt klimatarbete - Ur ett svenskt perspektivR 1996:58 Informativa energiräkningar i Norden.
Sammmanställning av försöksprojekt genomförda i Danmark, FinlandR 1996:59 Klimatstrategier i OECD-länderna - En kartläggningR 1996:62 Tekniker för blandning av aska. Kartläggning av projekt i Sverige och till viss del i utlandetR 1996:68 Utvärdering av NUTEKs program för effektivare energianvändning. SlutrapportR 1996:69 International Evaluation of the programme on Fluid Bed Combustion and GasificationR 1996:83 Elmarknaderna runt Östersjön 1996
Försäljning: NUTEK Förlag, 117 86 Stockholm. Fax 08-681 92 05. e-post: [email protected]: NUTEK Förlag, S-117 86 Stockholm. Fax +46 8 681 92 05. e-mail: [email protected]
R 1996:85 Aska till skog på torvmark. Ramprogram AskåterföringR 1997:2 Gas Research Programme in Sweden 1994-1996. Evalution reportR 1997:3 Ramprogram Energiskog 1992-1995. Slutrapport genom
"Samordningsprojekt för Ramprogram Energiskog"R 1997:29 Klimatrapport 1997R 1997:30 Storskalig askåterföring - förutsättning och hinderR 1997:31 Återföring av biobränsleaska - företagsekonomiska och samhällsekonomiska beräkningarR 1997:36 Effekter av biobränsleanvändning - med fokus på säker energiförsörjningR 1997:39 Styrmedlens inverkan på koldioxidutsläppen. Beräkningar med MARKAL-MARCO modellenR 1997:43 Miljöanpassad kommunal energiplanering
- miljökonsekvensbeskrivning av energiplaner och energiprojektR 1997:45 Effektreserver på nya elmarknaden - En konsultstudieR 1997:49 TrädbränsleR 1997:51 The NUTEK Ethanol Development programme. International EvaluationR 1997:57 Vindenergikartering för södra Sverige. Länsrapport 1 : Gotlands länR 1997:58 Vindenergikartering för södra Sverige. Länsrapport 2: Blekinge länR 1997:59 Vindenergikartering för södra Sverige. Länsrapport 3: Kalmar länR 1997:60 Vindenergikartering för södra Sverige. Länsrapport 4: Hallands länR 1997:61 Vindenergikartering för södra Sverige. Länsrapport 5: Östergötlands länR 1997:62 Vindenergikartering för södra Sverige. Länsrapport 6: Göteborgs och Bohus länR 1997:63 Vindenergikartering för södra Sverige. Länsrapport 7: Södermanlands länR 1997:64 Vindenergikartering för södra Sverige. Länsrapport 8: Stockholms länR 1997:65 Vindenergikartering för södra Sverige. Länsrapport 9: Uppsala länR 1997:66 Vindenergikartering för södra Sverige. Länsrapport 10: Jönköpings länR 1997:67 Vindenergikartering för södra Sverige. Länsrapport 11 : Skåne länR 1997:68 Vindenergikartering för södra Sverige. Länsrapport 12: Skaraborgs länR 1997:69 Vindenergikartering för södra Sverige. Länsrapport 13: Västmanlands länR 1997:70 Vindenergikartering för södra Sverige. Länsrapport 14: Örebro länR 1997:71 Vindenergikartering för södra Sverige. Länsrapport 15: Älvsborgs länR 1997:72 Vindenergikartering för södra Sverige. Länsrapport 16: Värmlands länR 1997:73 Vindenergikartering för södra Sverige. Länsrapport 17: Gävleborgs länR 1997:74 Kemisk stabilitet hos restprodukter från förbränning av biobränslenR 1997:75 Vedaska och kalk - effekter på kvävemineralisering och nitrifikation i en skogsjordR 1997:77 Energin, välfärden och jobbenR 1997:79 Kol 1997R 1997:80 Climate report 1997R 1997:81 Elmarknaderna runt Östersjön
Försäljning: NUTEK Förlag, 117 86 Stockholm. Fax 08-681 92 05. e-post: [email protected]: NUTEK Förlag, S-117 86 Stockholm. Fax +46 8 681 92 05. e-mail: [email protected]

ISSN 1403-1892
Swedish National
Energy Administration
Address:
Box 310, SE-631 04 Eskilstuna
Sweden
Visitors:
Kungsgatan 43
Phone:+46 16 544 20 00
Fax:+46 16 544 20 99
www.stem.se
Swedish NationalEnergy Administration