criteria and process for evaluation of surface
TRANSCRIPT

1
CRITERIA AND PROCESS FOR EVALUATION OF SURFACE TRANSPORTATION BLOCK GRANT PROGRAM URBANIZED AREA (STP-UZA) PROJECTS
AS AMENDED BY THE ITPC
October 27, 2016
Background On October 27, 2016, the ACOG Intermodal Transportation Policy Committee (ITPC) approved, and the ACOG Board of Directors endorsed, an amended version of the Surface Transportation Block Grant Program Procedures for the Oklahoma City Urbanized Area Funds1. Current federal surface transportation legislation, known as the Fixing America’s Surface Transportation Act (FAST Act), was signed into law on December 4, 2015. The FAST Act retained the Surface Transportation Program, renaming it the Surface Transportation Block Grant Program. The ACOG Surface Transportation Block Grant Program Procedures for the Oklahoma City Urbanized Area Funds (STP-UZA Procedures) call for this evaluation criteria to be used when the requests for STP-UZA funds2 for a given federal fiscal year exceed the funds available for planning purposes. Purpose The purpose of the Evaluation Criteria and Process is to assist the Intermodal Transportation Technical and Policy Committees in assessing regional project priorities and in developing a financially reasonable program of STP-UZA projects. Implementation Guidance from the Federal Highway Administration (FHWA) and Federal Transit Administration (FTA) stresses financial constraint and regional prioritization of projects as two of the basic requirements for Metropolitan Planning Organizations (MPOs) developing the Transportation Improvement Program (TIP). Additionally, the evaluation criteria are recommended as a means of addressing the following FAST Act priorities: preserving existing transportation facilities, relieving and preventing congestion, providing for various mode choices, and increasing the safety of the traveling public. Relationship to TIP Development The evaluation criteria will be used when the requests for STP-UZA funds for a given federal fiscal year exceed the amount of funds available for planning purposes. Each November, entities in the Oklahoma City Area Regional Transportation Study (OCARTS) area will be requested to submit projects 1 The Surface Transportation Program Urbanized Area (STP-UZA) funds were originally made available as a part of the Intermodal Surface Transportation Efficiency Act of 1991 (ISTEA). ISTEA was replaced by the Transportation Equity Act for the 21st Century (TEA-21) on June 9, 1998, TEA-21 was replaced by the Safe, Accountable, Flexible, Efficient Transportation Equity Act: A Legacy for Users (SAFETEA-LU) on August 10, 2005, and SAFETEA-LU was replaced by Moving Ahead for Progress in the 21st Century (MAP-21) on July 6, 2012. The STP-UZA Procedures were originally adopted by the ITPC on May 28, 1992 following passage of ISTEA, and subsequently amended to reflect changes resulting from TEA-21, SAFETEA-LU, MAP-21, the FAST Act, and as desired by the ITPC. 2 The term STP-UZA refers to the Surface Transportation Block Grant Program funds suballocated to the Oklahoma City Urbanized Area called for by the FAST Act.

2
to ACOG for consideration of inclusion in the TIP. The TIP will cover a four-year period, and a new TIP will be prepared biennially. Each entity will be limited to a maximum of 20 total STP-UZA project applications over the TIP timeframe. Each project submitted for inclusion in the first year of the TIP proposing STP-UZA funding must be programmed through ACOG and ODOT prior to final approval of the new TIP by the MPO. Amendments to add projects to the first year of an existing TIP should be programmed or in the process of being programmed by the project sponsor’s governing body during its next regular meeting. Projects proposing STP-UZA funding for any year of a new TIP must be accompanied by the documentation required by this Criteria in order to receive consideration. In accordance with 23 CFR and O.S.47, governing all federal-aid projects, each proposed project must meet the state and federal minimum standards and the most recent edition of the FHWA Manual on Uniform Traffic Control Devices (MUTCD) in order to be considered for STP-UZA funding. In addition, projects proposed for STP-UZA funding, must comply with the following items (as stated in the STP-UZA Procedures): (1) The proposed project must be included in, or be consistent with, the Metropolitan Transportation
Plan adopted by the Intermodal Transportation Policy Committee (ITPC). (2) The requesting entity must initiate consideration of the project for inclusion in the
Transportation Improvement Program through completion of a TIP application form which includes a brief explanation of the project location, description of improvement, proposed funding sources, estimated cost of project by funding source, and total project cost. Eligible entities must select projects for which local match funds and other local expenses associated with the projects will be available, and environmental clearance, right-of-way acquisition, and utility and encroachment clearance (for construction projects) have been, or will be, accomplished within the federal fiscal year that the STP-UZA funds are made available for obligation (approved by ODOT and FHWA) by the federal government.
(3) The requesting entity must provide the MPO with a preliminary cost estimate for each STP-UZA
project, prepared by an appropriate professional for the type of project proposed. Preliminary cost estimates for construction projects must be prepared by a registered professional engineer licensed in the State of Oklahoma, and shall include information on materials, quantities, unit prices, etc. Cost estimates must be current within 6 months of the date of submission in order for the project to be considered for inclusion in the TIP. The amount of STP-UZA funds authorized per project shall be capped at $7,500,000. The obligation of federal funds that exceed the TIP estimate by more than 20 percent will not be approved by the Federal Highway Administration (FHWA). Costs that exceed the federal share listed in the TIP by more than 20 percent will be borne by the sponsoring entity(ies), or will require an amendment to the TIP to reflect the updated federal share, subject to federal fiscal constraint requirements of the TIP.
Once the proposed projects are submitted by the entities for inclusion in the TIP, ACOG staff will compare the total amount of STP-UZA funds requested for each federal fiscal year to the total amount available for planning purposes. The Evaluation Criteria and Process will be utilized to arrive at a prioritized list of projects consistent with the area's anticipated federal STP-UZA funding. Following project submissions, an entity shall not substitute a lower scoring project(s) into the list of ranked projects for a higher

3
scoring project(s). Funds associated with a project that is removed from the list will be made available to other projects on the list using the ranking order. It will be the applicant entity's responsibility to prepare the essential information (e.g. ADT, accident severity rates, surface condition, etc.), and to submit the necessary documentation for each project being submitted for inclusion in each year of the TIP. TIP Amendments Each year of the TIP must remain financially constrained as required by federal regulation 23 CFR 450.325(j). Any request for amendment to the TIP that raises the federal share beyond the current or anticipated annual STP-UZA funds for the region will not be approved. Projects may be added to the current year of the TIP as long as the TIP remains financially constrained. When this is not possible, local governments may request that the ITPC approve subsequent year TIP projects (either already listed in the TIP or as an amendment) for potential federal authorization during the current year. Such authorization would occur only if adequate federal funds become available. (Amendment to add a project may also require deletion of a project in order to maintain the financial constraint of the TIP.) It will be the responsibility of the sponsoring entity to initiate all such requests. Requests for ITPC approval to fund projects from subsequent years of the TIP will be prioritized according to their scores, using the adopted Criteria and Process for Evaluation of Surface Transportation Program Urbanized Area (STP-UZA) Projects. The project scores will be reviewed and updated, as needed, to reflect current readiness points at the time of the request. Following authorization of all current year projects that have received ODOT clearance, subsequent year TIP projects will be authorized as they are cleared by ODOT (i.e. first ready, first authorized). If two or more projects are cleared simultaneously, then project scores, availability of federal funds and local match will determine the order of federal authorization until all anticipated STP-UZA funds are obligated. Components of Evaluation Process In order to evaluate the projects proposed for STP-UZA funding in the Transportation Improvement Program (TIP) when the requests for funds exceed the funds available for planning purposes, the following evaluation process will be used. The evaluation process is comprised of four major components: 1) evaluation criteria, 2) project categories, 3) criteria weighting, and 4) project rating. Evaluation Criteria The seven evaluation criteria are as follows: 1. Average Daily Traffic 5. Surface Condition 2. Volume/Capacity Ratio 6. CMP Congestion Corridor 3. Crash Severity Rate 7. Project Readiness 4. Air Quality
4
These criteria were chosen to represent the mobility, environmental, and social factors important to the development of an efficient transportation system and the ability of a project to be ready for letting during the federal fiscal year of the TIP for which it is submitted. All of the evaluation criteria refer to the existing conditions at the time projects are submitted. In the event the readiness of a project has progressed between the time of project submission and the ranking of the proposed projects for inclusion in the TIP, the project score will be updated so an accurate score for project readiness is reflected. In addition to the above seven evaluation criteria which are applicable to most project categories, the following additional criteria apply to certain improvements, as noted below: Bridge Improvements:
a. Bridge Sufficiency Rating (applies only to bridge projects not associated with adjacent roadway widening, new construction, or resurfacing - See Attachment I - Description of Project Categories).
b. Waterway Adequacy (from the Bridge Sufficiency Rating) c. Structural Deficiency (from the Bridge Sufficiency Rating)
Independent Bicycle and Pedestrian Improvements: a. Comprehensive Trail Planning (applies to both bicycle and pedestrian facilities) b. Intermodal Connectivity (applies to both bicycle and pedestrian facilities)
Safety Improvements (See Attachment III):
a. Safety Improvement Index (applies to all safety projects – See Attachment I for description of safety improvements eligible for 100 percent STP-UZA funds).
b. Functional Classification (applies only to school zone improvement projects – See Attachment III).
Widening and New Construction:
a. Multiple Modes (applies to both roadway and intersection capacity projects) Project Categories The categories of projects included in this evaluation are: 1. Widening, including Railroad/Highway
Grade Separations 2. New Construction 3. Intersection/Safety Improvements 4. Resurfacing, Reconstruction, Rehabilitation,
Restoration 5. Bridge Improvements
6. Transit, Park-and-Ride, High Occupancy
Vehicle (HOV) Lanes 7. Independent Bicycle and Pedestrian
Facilities/Projects 8. Carpool/Vanpool Administration, Other 9. Safety Projects (100% Federal)
5
Detailed descriptions for each of the project categories are listed in Attachment I. A full list of eligible activities within the OCARTS area is provided in the STP-UZA Procedures. Criteria Weighting The evaluation process utilizes a system of weights to establish the relative importance of the different criteria for the project categories. The most important criteria are assigned a weight of three, while less important criteria have values of two, one, or zero, depending on their relative significance. Table I shows an array of the relative importance of the criteria to the categories of projects. For example, when comparing the relative importance of the criteria for a widening project (see the column entitled widening in Table I), the volume-to-capacity (V/C) ratio is considered a dominant criterion; hence, it is weighted three. The current surface condition is considered the least important, and it is therefore weighted one. Project Rating In applying the criteria to each project, a rating guide is used to assess how well a project measures against each criterion. A decimal value between three and zero (between six and zero for project readiness) is assigned to each of the evaluation criteria. Please see Attachment II for the Rating Guide and Attachment III for the Rating Guide for Safety Improvements (100% STP-UZA). For example, consider the evaluation criterion “V/C ratio.” When a widening project has an existing V/C ratio of 1.30 or above, that project rates three points. This is the point that traffic flow is approaching unstable conditions such that speed and ability to maneuver are severely restricted. Projects with Multiple Aspects If a project has multiple aspects such as widening and intersection improvements, the project cost estimate should be itemized by the appropriate categories. Then the project scores from each category will be factored on a percentage basis (e.g. 40% widening, 60% intersection improvement) to allow the project scoring to reflect the blend of the two aspects. For the purpose of determining if a project involves multiple aspects, an intersection shall be defined as extending 500 feet from the intersecting centerlines or 450 feet from the stop bars for each leg of the intersection, whichever is greater. Widening projects which extend significantly beyond this distance will be considered a separate aspect, and not a part of the typical widening at an intersection for turn lanes. Project sponsors are encouraged to construct bicycle and/or pedestrian improvements as incidental features of roadway, intersection and bridge projects. Such projects will be scored based on the evaluation criteria and weights applicable to the appropriate roadway category, and all improvements will be funded at the federal share applicable to the roadway improvement.

6
Projects in Multiple Locations For projects that have multiple aspects in multiple locations (i.e. Safety projects that involve striping or improvements at multiple intersections around a city), all supporting documentation, including counts and accidents, shall be clearly delineated and subdivided by location. Project Scoring Once all the data are available, each project will be evaluated by determining how well the project rates on each of the applicable criteria. These rates will be multiplied times the appropriate weights, and summed to determine the project’s points. A special ITTC meeting will be called to review data submitted for project evaluation, and to assist ACOG staff in verifying the scoring process. In the event that the project scoring does not truly reflect the merits of a proposed project or does not fit within one of the project categories described in these criteria, the requesting entity may provide information about a project by way of narrative commentary. The ITTC may consider such commentary as part of the project prioritization process for a project that scores either too high or too low as a result of the quantitative analysis alone or involves an eligible activity that does not represent a physical improvement to the transportation system. For example, a local government sponsor may submit a narrative commentary alone for an Advanced Truck Stop Electrification System, since this activity does not represent an improvement to the transportation system, and therefore, cannot be scored according to all seven evaluation criteria listed above. The scoring will be done for all projects included in the Project Categories on Attachment I which are proposed for funding through the STP-UZA allocation. The projects submitted for each year of the new or updated TIP, with their associated points, will be listed in decreasing prioritization. Then, the ITTC will prepare an STP-UZA project priority list for each year under consideration (recommended for inclusion in the TIP) for the ITPC, based on the ITTC’s technical review of the projects and the associated scoring and narrative commentary. The total amount of STP-UZA funds anticipated to be available for each year will be considered in determining the cut-off point for fundable projects.

7
Safety Projects Eligible safety projects (see Attachment I) may be submitted to compete against other safety projects for 100 percent STP-UZA funding based on a separate Rating Guide (see Attachment III). The amount of STP-UZA Safety funds, which will be spent at 100 percent, is limited to 10 percent of the STP distribution received by the UZA. Thus, any other safety improvements included in the TIP that cannot be let with 100 percent federal funds, will be funded at an 80 percent federal/20 percent local ratio. No single entity shall be permitted to obligate more than 56 percent of the UZA’s safety funds within a single federal fiscal year, unless there are not sufficient projects proposed by other entities that can be obligated within the year. If the location of a proposed safety project has not experienced any preventable accidents during the previous three-year period, the project shall not be eligible to compete for 100% STP-UZA Safety funds, except for school zone improvement projects. School zone improvements will be permitted to compete for 100% STP-UZA Safety funds regardless of the location’s history of preventable accidents. Federal Share Construction costs for the project categories described in Attachment I are eligible for funding with 80 percent STP-UZA funds. However, federal law allows certain safety projects to be constructed with 100 percent federal funds, and these specific Safety Projects are listed at the bottom of Attachment I. Any project that consists of a combination of 80 percent eligible and 100 percent eligible safety improvements, shall be submitted at an overall 80 percent federal / 20 percent local funding ratio. Otherwise, such safety improvement(s) shall be submitted and scored as separate project(s) in accordance with Attachment III of these Criteria. Bicycle and/or pedestrian improvements constructed independently or as incidental features of an 80 percent eligible roadway project shall be constructed at an 80 percent federal share with 20 percent local match. The federal share requested for a proposed STP-UZA project shall be maintained throughout the project development process and federal authorization. Any request to modify a project in order to separate it into two or more projects, with varying funding ratios, shall require an amendment of the TIP and submittal of a new project ranking worksheet, supporting documentation and programming resolution for each new separate project.

8
ATTACHMENT I DESCRIPTION OF PROJECT CATEGORIES
Widening - The addition of travel lanes, turn lanes, or widening of existing travel lanes to an existing facility, thus resulting in an increase in vehicle capacity, including the widening of any bridges associated with the roadway improvement and railroad/highway grade separations associated with a widening project.
New Construction - New construction of a roadway on a new alignment, or on an existing
alignment on which no road surface (other than dirt or gravel) has previously existed, including new bridge and intersection construction, if applicable.
Intersection3/Safety - Widening at an intersection for turning lanes, installation of traffic signals
(including school zone signals), improving sight distances, signal synchronization, improvements on approaches to intersections, and installation of barrier curbs.
Resurfacing - Includes resurfacing, reconstruction, rehabilitation, or restoration; Overlays
with a minimum of an 8-year life as required by ODOT on existing pavements plus addition of material to bring shoulders to grade. Also includes bridge resurfacing, reconstruction, rehabilitation, or restoration associated with a roadway improvement, or intersection resurfacing.
Bridges - Replacement of a structurally deficient or functionally obsolete bridge or
rehabilitation of an existing bridge to restore its structural integrity or to correct major safety defects, not associated with a roadway widening, new construction, or resurfacing project.
Independent Bicycle and Pedestrian Facilities / Projects
Includes bikeways, bike paths, bike routes and pedestrian walkways that are physically separated from motorized vehicular traffic by an open space or barrier, located within the roadway right-of-way or separate right-of-way, and intended principally for transportation rather than recreational use. An independent bicycle project may include construction of bicycle facilities, signage, pavement markings, and bicycle parking facilities. This category does not include bikeway or walkway maintenance or any administrative costs.
Transit, Park-and-Ride Facilities, HOV Lanes
- Procurement of transit vehicles, exclusive lanes for transit/HOV, park-and-ride lots, signal preemptions for transit/HOV, and bus shelters.
Carpool/Vanpool - Carpool/Vanpool Administration, Other.
3 An intersection is defined as extending 500 feet from the intersection of the centerlines or 450 feet from the stop bars for each leg of the intersection, whichever is greater.

9
Safety Projects (100% STP-UZA)
- Traffic control signalization, traffic circles (also known as roundabouts), safety rest areas, pavement marking, commuter carpooling and vanpooling, rail-highway crossing closure, installation of traffic signs, traffic lights, guardrails, impact attenuators, concrete barrier end treatments, breakaway utility poles, and priority control systems for emergency vehicles or transit vehicles at signalized intersections.

10
TABLE I
CRITERIA WEIGHTS
TYPE OF PROJECT
EVALUATION CRITERIA Wid
enin
g in
clud
ing
Rail/
High
way
Gra
de
Sepa
ratio
ns
New
Con
stru
ctio
n
Inte
rsec
tion/
Safe
ty Im
prov
emen
ts
Resu
rfaci
ng, R
econ
stru
ctio
n, R
ehab
ilita
tion,
Re
stor
atio
n
Brid
ges
Inde
pend
ent B
icyc
le a
nd P
edes
tria
n Fa
cilit
ies/
Proj
ects
Tran
sit,
Park
-and
-Rid
e Fa
cilit
ies,
Hig
h Oc
cupa
ncy
Vehi
cle
(HOV
) Lan
es
Carp
ool/V
anpo
ol A
dmin
istr
atio
n, O
ther
Safe
ty P
roje
cts
(100
% ST
P-UZ
A)
1. Average Daily Traffic 3 3 2 3 2 NA 2 0 NA
2. Volume/Capacity Ratio 3 3 3 2 2 NA 2 0 NA 3. Accident Severity Rate 3 0 3 2 3 NA 1 2 NA 4. Air Quality 2 2 2 3 1 3 3 2 NA 5. Surface Condition 1 0 2 3 1 NA 0 2 NA 6. CMP Congestion Corridor 1 0 1 1 1 1 1 0 1 7. Project Readiness 3 3 3 3 3 3 3 3 2
SPECIAL CRITERIA FORCERTAIN PROJECT TYPES a. Bridge Sufficiency Rating – see pg. 23 NA NA NA NA 3 NA NA NA NA
b. Bridge Waterway Adequacy – see pg. 24 N/A N/A N/A N/A 2 N/A N/A N/A N/A c. Bridge Structural Deficiency – see pg. 25 N/A N/A N/A N/A 1 N/A N/A N/A N/A d. Comprehensive Trail Planning – see pg. 26 NA NA NA NA NA 3 NA NA NA e. Intermodal Connectivity – see pg. 26 NA NA NA NA NA 1 NA NA NA f. Multiple Modes - Sidewalks – see pg. 28 3 3 3 NA NA NA NA NA NA g. Multiple Modes - Bike Facilities – see pg. 28 3 3 3 NA NA NA NA NA NA
h. Safety Improvement Index (SII) * NA NA NA NA NA NA NA NA 1
i. Functional Class. (SZ Safety Impr. Only) * NA NA NA NA NA NA NA NA 3 * See Attachment III – see pgs. 29-35 NA = Not Applicable

11
ATTACHMENT II PROJECT RATING GUIDE 1. Average Daily Traffic (ADT) Measure of the average daily vehicular traffic using a roadway on all lanes in both directions. For route specific projects, use statistics from the specific facility. If a project is greater than one mile in length, an ADT count shall be taken for every mile for surface improvement projects (i.e. widening, reconstruction, resurfacing) and at each signal for signal coordination projects. The average of these ADTs shall be submitted for the purpose of STP-UZA project ranking. For a project one mile or less in length or an intersection project, the applicant entity may submit the highest ADT for the purpose of STP-UZA project ranking. For bridge projects, use the ADT closest to the bridge location. For projects encompassing a subarea, use the average ADT per mile for the applicable facilities in the subareas (served by the transit routes or park-and-ride lots). For intersection projects, use approach volumes of major legs. If two different functional classifications are involved, use the statistics that demonstrate the strongest need and therefore correspond to the highest rank. For projects located on frontage roads classified as part of the interstate system, use the Minor Arterial functional classification for the purposes of scoring this criterion. For new construction projects, use the model simulation data. RANK DEFINITION 3 Principal Arterial 20,000+ 3 Minor Arterial 12,000+ 3 Collector/Local4 7,000+ The ADT rating for projects will be based on the percent of points a given project merits within the functional classification of the facility involved. If a proposed project has volumes lower than those shown above, it will be evaluated based on using the ratio of the ADT on the proposed facility to the related ADT on the table above. That percentage will be multiplied by 3 to determine the rating points. The rating points will be rounded to the third decimal place.
4 Federal law allows bridge improvements to be made on any public road, using eligible federal funding categories, regardless of functional classification.

12
E.g. Proposed Principal Arterial Project has an ADT of 19,900. 19,900/20,000 = .995 .995 X 3 = 2.985 rating points
Proposed Minor Arterial Project has an ADT of 3,000. 3,000/12,000 = .25 .25 X 3 = .750 rating points
Proposed Collector Project has an ADT of 5,000. 5,000/7,000 = .714 .714 X 3 = 2.142 rating points
The documentation required to be submitted for the ADT evaluation measure is:
- Location of each ADT and their related counts - Functional classification(s) - Date of ADT count(s)
13
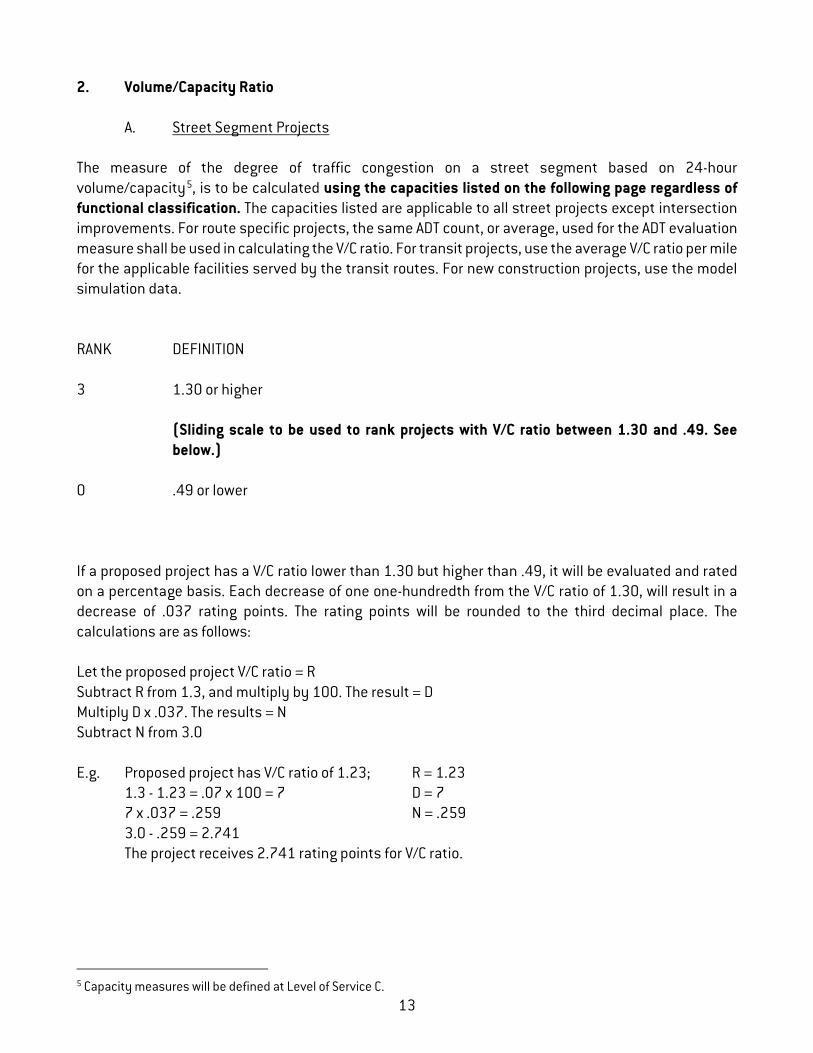
2. Volume/Capacity Ratio
A. Street Segment Projects The measure of the degree of traffic congestion on a street segment based on 24-hour volume/capacity5, is to be calculated using the capacities listed on the following page regardless of functional classification. The capacities listed are applicable to all street projects except intersection improvements. For route specific projects, the same ADT count, or average, used for the ADT evaluation measure shall be used in calculating the V/C ratio. For transit projects, use the average V/C ratio per mile for the applicable facilities served by the transit routes. For new construction projects, use the model simulation data. RANK DEFINITION 3 1.30 or higher
(Sliding scale to be used to rank projects with V/C ratio between 1.30 and .49. See below.)
0 .49 or lower If a proposed project has a V/C ratio lower than 1.30 but higher than .49, it will be evaluated and rated on a percentage basis. Each decrease of one one-hundredth from the V/C ratio of 1.30, will result in a decrease of .037 rating points. The rating points will be rounded to the third decimal place. The calculations are as follows: Let the proposed project V/C ratio = R Subtract R from 1.3, and multiply by 100. The result = D Multiply D x .037. The results = N Subtract N from 3.0 E.g. Proposed project has V/C ratio of 1.23; R = 1.23
1.3 - 1.23 = .07 x 100 = 7 D = 7 7 x .037 = .259 N = .259 3.0 - .259 = 2.741 The project receives 2.741 rating points for V/C ratio.
5 Capacity measures will be defined at Level of Service C.

14
NON-ACCESS CONTROLLED FACILITY CAPACITIES (LEVEL OF SERVICE C) TWO WAY STREETS:
Total Travel Lanes
Through Lanes per Direction
of Travel Undivided
Plus Continuous Center Turn
Lane
Divided With
Median 2 1 10,000 12,000 14,000 3 2 & 1 16,000 18,000 20,000 4 2 22,000 24,000 26,000 5 2 & 3 28,000 30,000 33,000 6 3 32,000 36,000 40,000
ONE WAY STREETS:
Total No. of Lanes Total Capacity
2 12,000 3 18,000 4 24,000 5 30,000 6 36,000
Notes: Use of this chart assumes that the project being evaluated meets STP-UZA functional classification requirements. Capacities for the above facilities are estimated according to total number of lanes for a 24-hour period (including continuous left turn lane, if present).

15
B. Intersection Projects The measure of the degree of peak hour traffic congestion at an intersection will be based on the Transportation Research Board's latest edition of the Highway Capacity Manual or other recognized computer program for calculations of volume/capacity6. Peak hour is typically defined as the one hour between 4:00 p.m. and 6:00 p.m. with the highest traffic volume. Data should be provided in 15 minute increments. The assumptions and/or variables used in estimating intersection volume/capacity ratios must be documented. If two different V/C ratios are involved at an intersection, use the statistics that demonstrate the strongest need and therefore correspond to be highest rank. RANK DEFINITION 3 1.30 or higher
(Sliding scale to be used to rank projects with V/C ratio between 1.30 and .49. See below.)
0 .49 or lower If the proposed project has a V/C ratio lower than 1.30 but higher than .49, it will be evaluated and rated on a percentage basis. Each decrease of one one-hundredth from the V/C ratio of 1.30, will result in a decrease of .037 rating points. The rating points will be rounded to the third decimal place. The calculations are as follows: Let the proposed project V/C ratio = R Subtract R from 1.3, and multiply by 100. The result = D Multiply D x .037. The result = N Subtract N from 3.0 E.g. Proposed project has V/C ratio of 1.23; R = 1.23
1.3 - 1.23 = .07 x 100 = 7 D = 7 7 x .037 = .259 N = .259 3.0 - .259 = 2.741 The project receives 2.741 rating points for V/C ratio.
6 Capacity measures will be defined at Level of Service C.

16
The documentation to be submitted for the V/C ratio evaluation measure is: For segment projects: 1. The 24-hour ADTs for the area that the project covers 2. The existing number of lanes 3. V/C ratio For intersection projects: 1. One-hour peak hour (typically between 4:00 p.m. and 6:00 p.m., although a different peak hour
may be applicable to certain locations) turning movement volumes for individual legs. 2. Geometry of the intersection: number of lanes and lane widths in feet for individual lanes. 3. Adjustment factors: grade, percentage of heavy vehicles, parking, number of buses which stop
at the intersection per hour, peak hour factor, number of pedestrians, pedestrian buttons, and traffic arrival types as described in the Highway Capacity Manual.
4. Signal settings: green/yellow/red times in seconds. 5. Signal phase plan. For entities which do not have access to the Highway Capacity Manual or Software for determining the V/C ratio for intersection projects, ACOG can provide technical assistance if the above intersection requirement data is submitted in its entirety with sufficient lead time.

17
3. Crash Severity Rate The crash severity rate on a facility averaged over the past three year period based on the accident data provided by the appropriate City Police Department or the Oklahoma Department of Transportation, and the ADT data provided by the appropriate city or ODOT. (The use of cumulative crash data is intended to avoid the crashes which occurred due to random chance. The previous three year period shall cover the most recent consecutive 36-month period for which accident data is available.) The same ADT count, or average, used in the ADT and V/C ratio evaluation measures shall be used in the calculation of the crash severity rate. Crash rates at intersections are defined as annual crashes per million vehicles annually. Crash rates for street segments are defined as annual crashes per million vehicle miles of travel annually. The crash severity rate is weighted according to severity of crashes per annual traffic volume. The ODOT severity index system will be used to weight different types of accidents (fatality accident = 4, injury accident = 4, property damage accident = 2). The formulas for crash severity rate are listed as follows: Intersection Formula: Mid-Block Formula: Severity Index X One Million Severity Index X One Million 365 X (24-hour Intersectional 365 X (Vehicle Miles of Travel) Entering Volumes) For intersection improvements, use intersection crashes. For street improvements, use mid-block crashes and any intersection crashes located within the limits of the proposed project. For applicant entities that choose to use their own City Police Department data, intersection crashes are defined as those occurring within 500 feet of the intersecting centerlines or 450 feet from the stop bars for each leg of the intersection, whichever is greater. Crashes beyond these limits will be considered mid-block crashes. The ODOT crash report defines each crash as intersection or mid-block related. For signal interconnect projects, both intersection and mid-block crashes may be used for the length of the proposed project. Mid-block crashes shall only be counted along the street segment to be improved. Intersection crashes, based on the above definition, shall only be counted for the intersections to be included in the signal coordination project, excluding all other intersections with side streets and driveways. For bridge projects, crashes within 500 feet from the bridge abutments and/or crashes documented as bridge-related, may be used. RANK DEFINITION 3 The crash severity rate is 12.0 or greater.
(Sliding scale to be used to rank projects with severity rate between 12.0 and 3.0. See below.)
0 The crash severity rate is 3.0 or less.

18
If a proposed project has a crash severity rate lower than 12.0 or higher than 3.0, it will be evaluated on a percentage basis. Each decrease of one-tenth from the Crash Severity Rate of 12.0 will result in a decrease of .033 rating points. The calculations are as follows: Determine the proposed project's Crash Severity Rate. Subtract that Rate from 12.0. Multiply by 10. The result is A. Multiply A by .033 and subtract from 3.000 to determine the Crash Severity Rate points for the project. E.g. Proposed project has a Crash Severity Rate of 9.1.
12.0 - 9.1 = 2.9 2.9 x 10 = 29 29 x .033 = 0.957 3.000 - 0.957 = 2.043 The project receives 2.043 rating points for the Crash Severity Rate.
The documentation to be submitted for the crash severity rate evaluation measure is: 1. Police department's crash record printouts showing the severity (property damage and
injuries/fatalities), dates, and clearly labeled, unique locations (with proper distances measured in feet from a known point/location (see definition of an intersection accident above),
OR ODOT's intersection and mid-block crash listings showing the severity, locations, and dates. (The information from the ODOT database is available at ACOG for assistance to any member entity.)
2. The sum of severity index. 3. The total intersection entering volumes or mid-block volumes, or both for signal interconnect
projects.

19
4. Air Quality Evaluation of project's impact on ambient air quality. RANK DEFINITION 3 High Project has a high impact on the improvement of air quality in the immediate vicinity of
the facility (TSM, transit vehicles, park and ride lots, pedestrian and bicycle facilities, signal improvements, and intersection improvements).
2 Moderate Project has a moderate impact on the improvement of air quality (resurfacing for streets
or bridges with poor surface condition). 1 Low Project makes a small contribution to improving air quality (new construction, widening,
resurfacing for streets or bridges with fair or good surface condition, carpool/vanpool administration, other).
0 Neutral Project has no significant impact on improving or decreasing air quality (resurfacing for
streets or bridges with very good surface condition, administrative and maintenance activities, non-construction bicycle projects to enhance the safe use of bicycles for transportation purposes).

20
5. Surface Condition The quality of pavement condition as it relates to ride, comfort, and safety. Surface condition should be evaluated based on FHWA's Distress Identification Manual for the Long-Term Pavement Performance Project7. RANK DEFINITION 2 Poor Surface condition of the roadway has deteriorated to such a point that it is in need of
resurfacing or reconstruction including sub-base. Surface condition of a bridge has deteriorated to such a point that it is in need of resurfacing or reconstruction to correct safety or structural defects.
1 Fair Pavement of the roadway or bridge shows signs of surface deterioration; inferior ride
quality; may be barely tolerable for high speed traffic; extensive patching, joint failures, etc.
0 Good Pavement of the roadway or bridge is predominantly smooth, few signs of surface
deterioration, minor rutting and/or cracking. 0 Very Good Roadway or bridge has new or sufficiently new pavements which are smooth and free
of cracks and patches. The documentation to be submitted for the surface condition evaluation measure is: Photograph(s) of the surface condition of the project location for projects with a rank of poor or fair. Photos shall be no older than 6 months prior to the date of the application and date stamped, and include a significant portion of the project area, including street name sign(s).
7 Distress Identification Manual for the Long-Term Pavement Performance Project, Publication No. FHWA-HRT-13-092, Revised May 2014.

21
6. CMP Congestion Corridor Projects must be located on the OCARTS Congestion Management Process (CMP) Focus Network as defined by the Congestion Management Process Update, approved by the MPO on August 11, 2016. Federal law requires that Transportation Management Areas (TMAs) address congestion through a process that provides for safe and effective integrated management and operation of the multimodal transportation system. Special attention will be given to strategies that manage demand, improve operation, increase safety and/or reduce single occupant vehicle travel. Rank 2 High Project will help alleviate congestion by improving safety, reducing demand, improving
operation and/or reducing single occupant vehicle travel on the congested corridor (intersection/safety improvements, safety projects (100%), independent bicycle and pedestrian facilities, park and ride lots, HOV lanes, signal preemption for transit vehicles, bus pullout lanes).
1 Low Project will have some impact on reducing congestion by improving roadway capacity
and safety, but will not reduce demand or single occupant vehicle travel on the congested corridor (widening, resurfacing and bridge projects).
0 Neutral Project is not on a congested corridor or will not directly benefit a congested corridor
(new construction, transit vehicles, carpool/vanpool administration).

22
7. Project Readiness Project readiness is a measure of the ability of a project to be ready for obligation of federal funds during the TIP year for which it has been submitted for consideration. For construction projects, points will be assigned based on the submittal of design plans, right-of-way plans and cost estimates to ODOT by the entity and receipt of clearances and plan approval from ODOT, as listed below. For non-construction eligible activities (i.e. procurement of transit vehicles, carpool/vanpool administration, etc.), six (6) points will be assigned. RANK DEFINITION
6 Entity has received clearance for letting from ODOT’s Right-of-way Division and has a valid NEPA (less than 3 years old) clearance; Non-construction eligible activity.
5.5 All right-of-way documents have been submitted and ROW clearance from ODOT is on
hold, pending NEPA clearance
5 Entity has submitted preliminary plans and updated cost estimate* to ODOT 4 Entity has submitted right-of-way plans and easements to ODOT and a) project has received environmental clearance; or b) ODOT has provided a letter stating that all required NEPA studies are complete and
60% plans are within the study footprint (NEPA on hold)
3 Plan-in-hand meeting has been held 2 Entity has submitted plan-in-hand plans to ODOT 1 Project has been programmed prior to the TIP application deadline (Job piece
number assigned by ODOT)
0 Project has not been programmed *An updated cost estimate must accompany the preliminary plan submittal to ODOT. Each cost estimate must be
prepared by the project engineer, and shall include information on materials, quantities, unit prices, etc.

23
SPECIAL CRITERIA Special Criteria for Bridge Projects Bridge Sufficiency Rating (Applies only to bridge projects not associated with adjacent roadway work) The numerical rating of a bridge based on its structural adequacy and safety, essentiality for public use, and its serviceability and functional obsolescence. Bridge replacement and rehabilitation projects which will not be performed in conjunction with an adjacent roadway project for widening, new construction, or resurfacing shall also receive rating points based on the bridge's most recent sufficiency rating under the National Bridge Inspection Standards (NBIS) requirements. In the event a bridge's condition has significantly deteriorated since the last approved sufficiency rating was assigned, a narrative commentary may be included to describe the reasons for and extent of the increased deterioration. RANK DEFINITION
3 Bridge sufficiency rating of 50 or below
(Sliding scale to be used to rank projects with a bridge sufficiency rating between 50 and 81)
0 Sufficiency rating of 81 or above
If the current bridge has a sufficiency rating (BSR) lower than 81 or higher than 50, it will be evaluated and rated on a percentage basis. Each increase of one point from a BSR of 50, will result in a decrease of .097 rating points. The rating points will be rounded to the third decimal place. The calculations are as follows: Let the bridge's current BSR = B Subtract 50 from B, and multiply by .097. The result is C. Subtract C from 3. The result is D; this is the number of rating points the project receives for its BSR. E.g. Current bridge has a BSR of 66 B = 66
66 - 50 = 16 X .097 = 1.552 C = 1.552 3 - 1.552 = 1.448
The proposed bridge project with a current BSR of 66 receives 1.448 rating points.
The documentation to be submitted for the above evaluation measures is:
NBI Bridge Inspection Report for bridge location

24
Special Criteria for Bridge Projects (Cont.) Waterway Adequacy Waterway Adequacy is Item 71 in the National Bridge Inspection (NBI) Report, which is considered in the overall Bridge Sufficiency Rating. This item appraises the waterway opening with respect to passage of flow through the bridge. The appraisal considers the functional classification of the roadway, overtopping frequency (remote, slight, occasional or frequent), and resulting traffic delay (insignificant, significant, severe or bridge closed). Waterway adequacy utilizes a scale of 0 (worst condition – bridge closed) to 9 (best condition – bridge not over a waterway). For the purposes of this criterion, waterway adequacy will be ranked as follows: RANK DEFINITION 3 Waterway adequacy rating of 0, 1, 2 2 Waterway adequacy rating of 3, 4, 5 1 Waterway adequacy rating of 6, 7, 8 0 Waterway adequacy rating of 9 The documentation to be submitted for the above evaluation measures is: NBI Bridge Inspection Report for bridge location

25
Special Criteria for Bridge Projects (Cont.) Structural Deficiency Bridges are considered structurally deficient if significant load carrying elements are found to be in poor condition due to deterioration and/or damage, or the adequacy of the waterway opening provided by the bridge is determined to be extremely insufficient to the point of causing overtopping with intolerable traffic interruptions. For a structure to be considered Structurally Deficient, one of the following criteria must be true:
NBI GENERAL CONDITION RATINGS APPRAISAL RATINGS NBI Item# 58 59 60 62 67 71
Deck Superstructure Substructure Culvert Structural Evaluation
Waterway Adequacy
Code <= 4 <=4 <=4 <=4 <=2 <=2 For the purposes of this criterion, structural deficiency will be ranked as follows: RANK DEFINITION 3 Bridge is considered Structurally Deficient 0 Bridge is not considered Structurally Deficient The documentation to be submitted for the above evaluation measure is: NBI Bridge Inspection Report for bridge location

26
Special Criteria for Independent Bicycle and Pedestrian Facilities The safe accommodation of pedestrians and bicyclists should be given full consideration during the development and construction of bicycle and pedestrian facilities. The design of such facilities must be consistent with the American Association of State Highway and Transportation Officials (AASHTO) standards and the Americans with Disabilities Act (ADA). Bicycle and pedestrian projects must be principally for transportation, rather than recreational purposes. Pedestrian and/or bicycle facilities located solely within an existing right-of-way of a roadway that is functionally classified as Local, according to the latest Federal Functional Classification Plan, will not be approved for funding as such location is not considered to serve a regional transportation purpose. Comprehensive Trail Planning RANK DEFINITION
3 The proposed project is included in a Comprehensive Trails Plan or other Comprehensive Plan with a trails component adopted by the governing body of the project sponsor. Non-construction bicycle project to enhance the safe use of bicycles for transportation purposes.
2 The proposed project is not included in an adopted Comprehensive Trails Plan or trails
component of a Comprehensive Plan, but will physically connect to an existing pedestrian walkway or bikeway.
1 The proposed project is not included in a Comprehensive Trails Plan or other Comprehensive
Plan and will not connect to other existing pedestrian or bicycle facilities. Intermodal Connectivity RANK DEFINITION
3 The proposed project connects to an existing transit stop (bench, shelter, station, transit center or park-and-ride lot) or to a bikeway or walkway that connects to an existing transit stop (bench, shelter, station, transit center or park-and-ride lot).
2 The proposed project is within a ¼ mile radius of an existing transit stop (bench, shelter,
station, transit center or park-and-ride lot) or to a bikeway or walkway that connects to an existing transit stop (bench, shelter, station, transit center or park-and-ride lot).
1 The proposed project is within a ½ mile radius of an existing transit stop (bench, shelter,
station, transit center or park-and-ride lot) or to a bikeway or walkway that connects to an existing transit stop (bench, shelter, station, transit center or park-and-ride lot).
The documentation to be submitted for the above evaluation measures is:

27
1. Location map of the proposed project to scale 2. An adopted Comprehensive Trails Plan or Comprehensive Plan that includes the proposed
project 3. Aerial photograph of nearby existing transit station, park-and-ride lot, pedestrian walkway
and/or bikeway 4. Copy of current transit route map (from COTPA, CART or Citylink) showing nearby transit route(s)

28
Special Criteria for Encouraging Multimodal (MM) Features with Widening and New Construction Projects Sidewalks Projects to construct new roadways or new intersections, and widening projects to add lanes to existing roadways or intersections must include sidewalks if ADA-compliant sidewalks do not already exist. All sidewalks shall meet the construction standards adopted by the Oklahoma Department of Transportation and must comply with the Americans with Disabilities Act (ADA). Where feasible, sidewalks should be constructed on both sides of the street. If a widening or new construction project does not include a sidewalk(s), points will be deducted, unless the project location already contains a compliant sidewalk(s). In addition, the sponsoring entity may provide a narrative to describe why a sidewalk is inappropriate for a particular project location in order to request that the ITTC consider an exception to the point deduction. RANK DEFINITION
1 Project will include new sidewalks on both sides of the street 0 Project will include a new sidewalk on one side of the street, or a compliant sidewalk
already exists on one or both sides of the street -1 Project will not include sidewalks, and compliant sidewalks to do not already exist
Bicycle Facilities Projects to construct new roadways or new intersections, and widening projects to add lanes to existing roadways or intersections are eligible to receive extra points if they include an on-street bicycle lane or an adjacent bicycle path on at least one side of the street. This is intended to reward projects that will provide multiple transportation options. RANK DEFINITION 1 Project will include a new bicycle lane or bike path 0 Project will not include a new bicycle lane or bike path

29
ATTACHMENT III PROJECT RATING GUIDE FOR SAFETY IMPROVEMENTS (100% STP-UZA) Safety projects submitted to request 100 percent federal funding will compete among themselves for use of the 10 percent STP-Safety set-aside established for the Urban Area. With the exception of school zone improvement projects, these projects will use only three evaluation measures to determine the prioritization of STP-Safety projects: Safety Improvement Index, CMP Congestion Corridor and Project Readiness. School zone improvement projects will use four evaluation measures: Safety Improvement Index, CMP Congestion Corridor, Project Readiness, and Functional Classification. The scores for the evaluation measures will be added together to determine an overall project score for each proposed safety improvement. With the exception of school zone improvement projects, if the location of a proposed safety project has not experienced any preventable accidents (as defined in Table 1 of Attachment III) during the previous three-year period, the project shall not be eligible to compete for 100% STP-UZA Safety funds. School zone improvements will be permitted to compete for 100% STP-UZA Safety funds regardless of the location's history of preventable accidents. 1. Safety Improvement Index (SII) Measure of the Benefit/Cost (B/C) ratio based on annual preventable accident costs before and after the improvement (an average of the preventable accident costs over the previous 36 consecutive months for which accident data is available), a traffic volume factor, construction cost of the proposed improvement, and a capital recovery factor. Eligibility for STP-Safety funding will require that a project's B/C ratio is equal to or greater than 1.0. The Safety Improvement Index formula is as follows:
SII = (A1-A2)(V1) C x CRF
A1 - ANNUAL BEFORE ACCIDENT COST
# Fatality x $1,500,000 # Injuries x $ 11,000 = Three Year Total Accident Cost # PDO x $ 3,000
(Fatalities should be counted as actual number of persons killed; Injuries should be counted as actual number of persons injured; and PDO (Property Damage Only) should be counted as number of accidents--not number of vehicles involved. If an accident involves a combination of PDO, injury(ies) and fatality(ies), the costs associated with each should be summed.)

30
Three Year Total Accident Cost = A1
3 Use preventable accidents only (see Table 1).
A2 - ANNUAL AFTER ACCIDENT COST
A1 x (1-Reduction Factor) = A2 Reduction Factor - Estimated percent reduction in accident cost by the proposed
improvements (see Table 1). V1 - TRAFFIC VOLUME FACTOR
1 + Future ADT – Current ADT Current Capacity Future year is the last year of the project's service life (see Table 1). Use 2% annual compounding rate to project the future year's ADT (see Table 2).
C - CONSTRUCTION COST OF PROJECT
Does not include engineering, right-of-way acquisition, and utility relocation costs. CRF - CAPITAL RECOVERY FACTOR (see Table 3) For multi-location projects, use the total (three year average) of the annual preventable accidents at all locations and the average of the ADTs for all locations. For multi-aspect projects at a single location, use the total (three year average) of the annual preventable accidents for each type of improvement proposed, the average reduction factor of the proposed improvements, and the longest service life of the proposed improvements. (Preventable accidents which apply to more than one aspect should only be counted once). For multi-aspect projects at multiple locations, use the total (three year average) of the annual preventable accidents at all locations for all types of improvements proposed, the average of the ADTs for all locations, the average reduction factor of the proposed improvements, and the longest service life of the proposed improvements. (Preventable accidents which apply to more than one aspect should only be counted once).

31
TABLE 1
PROPOSED SAFETY IMPROVEMENT
SERVICE LIFE ESTIMATES
REDUCTION FACTOR %
PREVENTABLE ACCIDENTS
Install warning/guide signs
6 Years
20
Two motor vehicles - going same direction Both going straight - rear end, sideswipe Roadway related - run off the road on shoulder, run off the road beyond shoulder
Install traffic signals Upgrade traffic signals Signal timing and interconnection (use intersection and mid-block accidents)
10 Years
10 Years
10 Years
28
22
10
All intersection/intersection related accidents Vehicle movement/manner of collision: Two motor vehicles approaching at an angle - both going straight, 1 straight 2 backing, 1 straight 2 stopped, 1 straight 2 rt. turn or lt. turn, both turn rt., 1 rt. turn 2 lt. turn or stopped, both lt. turn, 1 lt. turn 2 stopped Two motor vehicles - going same direction - rear end, sideswipe, 1 straight 2 rt. or lt. turn, both rt. turn, 1 rt. or lt. turn 2 stopped, both lt. turn Two motor vehicles - going opposite directions - both going straight, 1 straight 2 backing, 1 straight 2 stopped, 1 straight 2 rt. or lt. turn, 1 backing 2 stopped, 1 rt. turn 2 lt. turn, 1 rt. or lt. turn 2 stopped, both lt. turn. First harmful event collision of a motor vehicle with a pedestrian or pedalcyclist
Add left turn signal phase
10 Years
25
Two motor vehicles going opposite directions - 1 straight 2 lt. turn, 1 rt. turn 2 lt. turn
Install pedestrian signal
10 Years
15
Collision of a motor vehicle with a pedestrian
Install stop signs
6 Years
20
All intersection/intersection related accidents

32
TABLE 1 – Continued
PROPOSED SAFETY IMPROVEMENT
SERVICE LIFE ESTIMATES
REDUCTION FACTOR %
PREVENTABLE ACCIDENTS
Install pavement markings Install edge markings
2 Years
20
Roadway related - off roadway on shoulder or beyond shoulder Two motor vehicles going same direction - sideswipe Two motor vehicles going opposite direction - head on
Install pedestrian crosswalk/ school zone markings
2 Years
10
First harmful event - collision of a motor vehicle with a pedestrian
Install raised reflective pavement markers
2 Years
20
Surface condition - wet light condition - dark, not lighted or lighted
Install guardrail or concrete traffic barrier
10 Years Guardrail
15 Years Concrete
Barrier
30
Roadway related - off roadway on shoulder or beyond shoulder Object struck - vehicle hit highway sign, curb, culvert headwall or marker post, railroad signal pole, traffic signal pole, luminaire pole, utility pole, other fixed object, end of bridge pier, or support
Install impact attenuator
10 Years
60
Object struck - vehicle hit highway sign, utility pole, end of bridge, (abutment or rail end) pier or support, or concrete barrier
Safety treat utility poles Install breakaway utility poles
10 Years
35
Roadway related - off roadway on shoulder or beyond shoulder Object struck - fixed object
Traffic (safety) lighting
15 Years
25
Light condition - darkness not lighted or darkness lighted
Priority control systems at signalized intersections
10 Years
10
To be justified on a project by project basis

33
TABLE 2
GROWTH FACTORS FOR AVERAGE DAILY TRAFFIC
PROJECT SERVICE LIFE:
GROWTH FACTOR:
2 YEARS
1.040
6 YEARS
1.126
10 YEARS
1.219
15 YEARS
1.349
FUTURE ADT = CURRENT ADT X GROWTH FACTOR OF THE SERVICE LIFE (Future ADT is the ADT at end of service life)

34
TABLE 3 CAPITAL RECOVERY FACTORS
Project Life T (Years)
Discount Rate (at 5.0 percent interest)
1 1.050
2 0.538
3 0.367
4 0.282
5 0.231
6 0.197
7 0.173
8 0.155
9 0.141
10 0.130
11 0.120
12 0.113
13 0.106
14 0.101
15 0.096
16 0.092
17 0.089
18 0.086
19 0.083
20 0.080
21 0.078
22 0.076
23 0.074
24 0.072
25 0.071
26 0.070
27 0.068
28 0.067
29 0.066
30 0.065

35
2. Project Readiness The Project Readiness evaluation measure described in Attachment II shall also apply to all safety projects. The only exception being that a weight of 2 shall be applied to arrive at the Project Readiness score for safety projects seeking 100% STP-UZA funds (see Attachment I, Table 1- Criteria Weights matrix). Special Criteria for School Zone Improvements Functional Classification The functional classification evaluation measure shall apply only to proposed school zone improvement projects, and is based on the premise that streets with a higher functional classification generally carry more vehicular traffic, and are therefore a greater barrier to pedestrian traffic. The use of this additional measure is intended to allow school zone projects to compete favorably with other safety projects. For the purposes of this evaluation measure, functional classification shall mean the functional classification included on the 2004 Federal Functional Classification Plan (local classification systems may vary). The functional classification of the street being evaluated shall be scored as follows:
RANK DEFINITION
3 Principal Arterial 2 Minor Arterial 1 Urban Collector and Rural Major Collector