crime situation in rsa twelve months 01 april 2017 to …
TRANSCRIPT

ON A JOURNEY TO A SAFER SOUTH AFRICACreating a safe and secure, crime free environment, that is conducive for
social & economic stability, supporting a better life for all.
#Patriotic & Selfless Service
CRIME SITUATION IN RSA
TWELVE MONTHS 01 APRIL
2017 TO 31 MARCH 2018
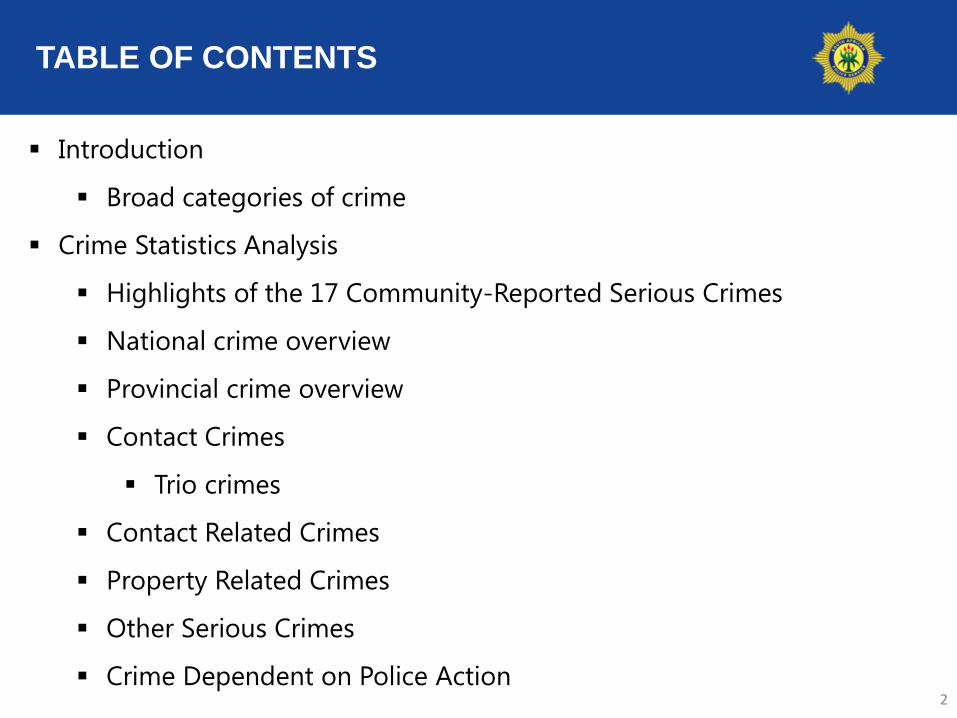
TABLE OF CONTENTS
2
Introduction
Broad categories of crime
Crime Statistics Analysis
Highlights of the 17 Community-Reported Serious Crimes
National crime overview
Provincial crime overview
Contact Crimes
Trio crimes
Contact Related Crimes
Property Related Crimes
Other Serious Crimes
Crime Dependent on Police Action

BROAD CATEGORIES OF CRIME
17 Community-Reported Serious Crimes
Contact Crimes
• Murder• Sexual Offences• Attempted Murder• Assault GBH• Common Assault• Common Robbery• Robbery Aggravated including
the following TRIO Crimes: Carjacking Robbery – Residential Robbery – Non -Residential
Contact Related Crimes
• Arson• Malicious damage
to property
Property Related Crimes
• Burglary at residential premises
• Burglary at non-residential premises
• Theft of motor vehicle and motor cycle
• Theft out of or from motor vehicle
• Stock theft
Other Serious Crimes
• Other Theft• Commercial
Crime• Shoplifting
3
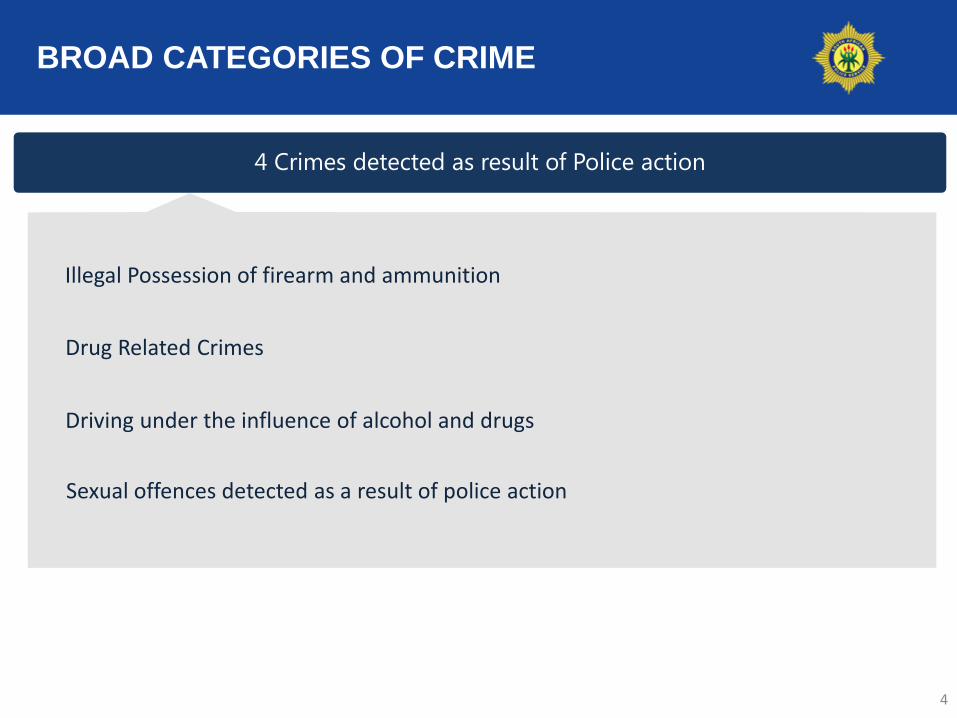
BROAD CATEGORIES OF CRIME
4
4 Crimes detected as result of Police action
Illegal Possession of firearm and ammunition
Drug Related Crimes
Driving under the influence of alcohol and drugs
Sexual offences detected as a result of police action
Crime Analysis

6
PROPORTIONAL CONTRIBUTION OF THE 21
SERIOUS CRIMES

THE 17 COMMUNITY-REPORTED SERIOUS CRIME
TREND OVER 10-YEAR PERIOD
8

9
OVERVIEW OF 17 COMMUNITY-REPORTED SERIOUS
CRIMES CATEGORIES: TWO YEAR COMPARISON

10
THE 17 COMMUNITY-REPORTED SERIOUS CRIMES:
PROVINCIAL OVERVIEW

11
Contact CrimesContact crime refers to those crimes in which the victims themselves are the targets of
violence or property is targeted and the victims in the vicinity during the commission of
the crime are subjected to threats of violence or the use of such violence.• Murder
• Rape
• Attempted Murder
• Assault GBH
• Common Assault
• Common Robbery
• Robbery aggravating
• Sexual assault

12
CONTACT CRIME: TREND OVER 10-YEAR PERIOD

CONTACT CRIMES: PROVINCIAL OVERVIEW
13

14
CONTACT CRIMES : TWO YEAR COMPARISON

15
MURDER CRIME: TREND OVER 10-YEAR PERIOD

16
MURDER : TOP 30 STATIONS
Position Station ProvinceApril 2013 to March 2014
April 2014 to March 2015
April 2015 to March 2016
April 2016 to March 2017
April 2017 to March 2018
Case Diff % Change
1 Nyanga Western Cape 305 300 279 281 308 27 9,6%
2 Umlazi Kwazulu/Natal 133 170 155 187 223 36 19,3%
3 Philippi East Western Cape 73 87 122 150 205 55 36,7%
4 Inanda Kwazulu/Natal 164 179 169 207 203 -4 -1,9%
5 Delft Western Cape 144 163 143 183 195 12 6,6%
6 Khayelitsha Western Cape 146 146 161 179 192 13 7,3%
7 Kraaifontein Western Cape 112 141 152 142 186 44 31,0%
8 Gugulethu Western Cape 149 165 184 136 182 46 33,8%
9 Mthatha Eastern Cape 40 92 122 127 160 33 26,0%
10 Mfuleni Western Cape 118 154 139 125 157 32 25,6%
11 Harare Western Cape 164 141 166 174 142 -32 -18,4%
12 Mitchells Plain Western Cape 156 141 119 103 140 37 35,9%
13 Bethelsdorp Eastern Cape 68 89 137 117 127 10 8,5%
14 Jeppe Gauteng 79 72 80 88 125 37 42,0%
15 Kwamashu E Kwazulu/Natal 128 107 128 129 123 -6 -4,7%
16 Ivory Park Gauteng 80 98 81 122 108 -14 -11,5%
17 Kwazakele Eastern Cape 83 66 105 103 104 1 1,0%
18 Plessislaer Kwazulu/Natal 92 87 94 129 104 -25 -19,4%
19 Kagiso Gauteng 58 63 79 97 101 4 4,1%
20 Hillbrow Gauteng 67 58 103 89 98 9 10,1%
21 Bishop Lavis Western Cape 73 82 77 97 98 1 1,0%
22 Lusikisiki Eastern Cape 112 102 110 115 97 -18 -15,7%
23 Moroka Gauteng 51 47 70 50 97 47 94,0%
24 Tembisa Gauteng 89 79 94 79 97 18 22,8%
25 Mariannhill Kwazulu/Natal 45 64 60 64 96 32 50,0%
26 Orange Farms Gauteng 60 68 65 79 95 16 20,3%
27 Jhb Central Gauteng 65 84 75 88 91 3 3,4%
28 Ngqeleni Eastern Cape 49 70 72 73 90 17 23,3%
29 Alexandra Gauteng 78 68 65 71 90 19 26,8%
30 Mpumalanga Kzn Kwazulu/Natal 92 64 73 93 90 -3 -3,2%
WC had 10 stations in the top 30 murder
stations, followed by GP
with 9, then KZN with 6 and
EC with 5 stations in the top 30 murder
stations. In total these
stations contributed
4 124 or 20% of the murders to the national
total

17
TABLE 1: MULTIPLE MURDERS
PROVINCE NUMBER OF VICTIMS TOTAL NO
DOCKETS
TOTAL NO
VICTIMS
2 3 4 5 6 7 11
Eastern Cape 46 3 1 1 1 0 0 52 115
Free State 11 2 1 0 0 0 0 14 32
Gauteng 72 13 1 0 0 1 0 87 194
KwaZulu-Natal 149 46 21 6 1 0 0 223 556
Limpopo 2 0 0 0 0 0 0 8 16
Mpumalanga 15 0 0 1 0 0 0 16 35
Northern Cape 1 0 0 0 0 0 0 1 2
North West 25 7 1 0 1 0 0 34 81
Western Cape 91 13 1 1 0 0 1 107 241
RSA 412 84 26 10 2 1 1 542 1 260

18
TABLE 2: CRIMINAL BEHAVIOUR MOTIVES MURDER
Murder Gang-related Taxi-related Illicit mining Farm murders Police Officials Mob justice Political related
Eastern cape 87 39 0 3 13 72 0
Free State 46 1 65 8 8 10 0
Gauteng 14 110 23 12 28* 264 0
KwaZulu-Natal 2 36 0 7 19 145 30
Limpopo 0 1 0 9 3 95 0
Mpumalanga 3 4 6 8 6 83 0
Northern Cape 0 0 0 3 0 0 0
North West 13 1 0 9 2 7 0
Western Cape 808 45 0 3 6 173 2
RSA 973 237 94 62 85 849 32
* Includes 10 officers based at head office

19
MURDER OF MEMBERS OF THE POLICE SERVICE

20
MURDER RESULTING FROM VIOLENCE ON FARMS AND
SMALLHOLDINGSCRIME AT FARMS AND SMALLHOLDINGS: PROVINCIAL OVERVIEW
21
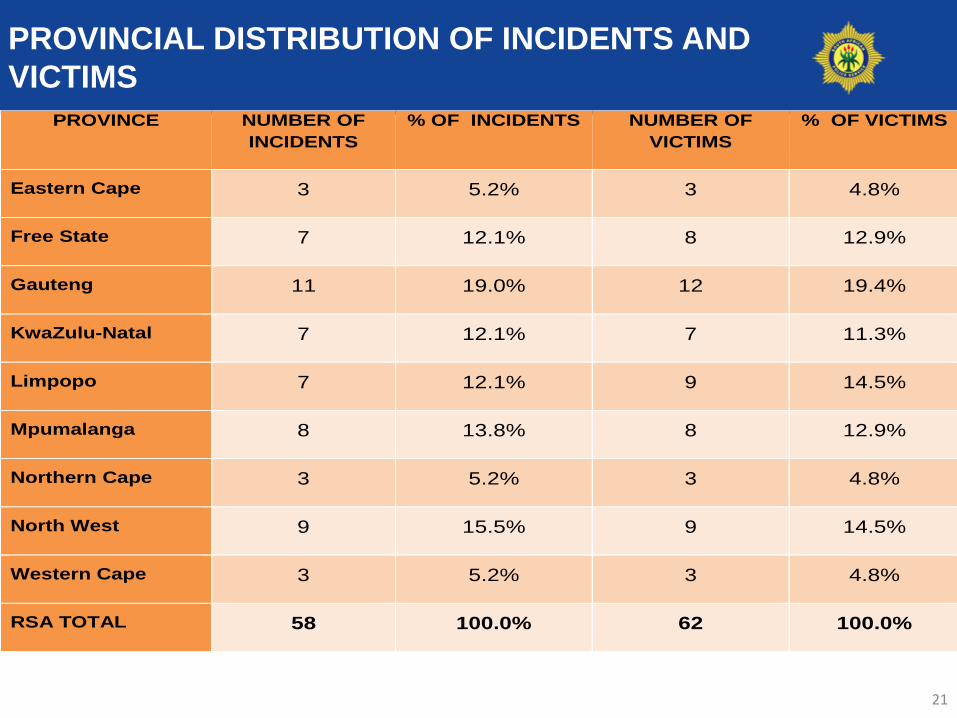
PROVINCIAL DISTRIBUTION OF INCIDENTS AND
VICTIMS
PROVINCE NUMBER OF
INCIDENTS
% OF INCIDENTS NUMBER OF
VICTIMS
% OF VICTIMS
Eastern Cape 3 5.2% 3 4.8%
Free State 7 12.1% 8 12.9%
Gauteng 11 19.0% 12 19.4%
KwaZulu-Natal 7 12.1% 7 11.3%
Limpopo 7 12.1% 9 14.5%
Mpumalanga 8 13.8% 8 12.9%
Northern Cape 3 5.2% 3 4.8%
North West 9 15.5% 9 14.5%
Western Cape 3 5.2% 3 4.8%
RSA TOTAL 58 100.0% 62 100.0%

22
WOMEN AND CHILDREN AS A VICTIMS OF MURDER: FINANCIAL
YEAR COMPARISON

23
PROVINCIAL OVERVIEW: MURDERS OF WOMEN AND CHILDREN
2017/2018
Province Women
Children Total
Children
(Girls+
Boys)
Total
(Women
+Children)
Women and
Children
Murders : %
contribution
Provincial
Murders : %
contribution
Total RSA
Murders : %
contribution Girls Boys
EC 550 43 137 180 730 18,6% 19,1% 3,6%
FS 202 21 31 52 254 6,5% 24,1% 1,2%
GP 549 31 77 108 657 16,8% 15,5% 3,2%
KZN 665 91 130 221 886 22,6% 20,2% 4,4%
LP 184 14 17 31 215 5,5% 23,6% 1,1%
MP 171 16 30 46 217 5,5% 23,5% 1,1%
NW 182 13 36 49 231 5,9% 24,3% 1,1%
NC 57 5 14 19 76 1,9% 22,4% 0,4%
WC 370 60 219 279 649 16,6% 17,4% 3,2%
RSA 2 930 294 691 985 3 915* 100,0% 19,3% 19,3%

24
INSTRUMENT USED TO COMMIT MURDERTEN MOST COMMON INSTRUMENTS USED NATIONALLY TO COMMIT MURDER

MURDER: PROVINCIAL OVERVIEW
25

MURDER: PROVINCIAL OVERVIEW
Percentage contribution vs ratio
26

27
ATTEPTED MURDER : TREND OVER 10-YEAR
PERIOD

28
WEAPON USEDFIREARMS VS KNIVES USED TO COMMIT ATTEMPTED MURDER: PROVINCIAL
OVERVIEW

29
ATTEMPTED MURDER: PROVINCIAL OVERVIEW

30
ATTEPTED MURDER : TOP 30 STATIONS
8 8
Position Station ProvinceApril 2013 to March 2014
April 2014 to March 2015
April 2015 to March 2016
April 2016 to March 2017
April 2017 to March 2018
Case Diff % Change
1 Gelvandale Eastern Cape 131 174 215 225 265 40 17,8%
2 Mitchells Plain Western Cape 251 231 208 144 246 102 70,8%
3 Umlazi Kwazulu/Natal 202 245 227 198 214 16 8,1%
4 Bethelsdorp Eastern Cape 126 91 127 133 201 68 51,1%
5 Delft Western Cape 138 186 151 178 192 14 7,9%
6 Khayelitsha Western Cape 144 170 183 256 181 -75 -29,3%
7 Nyanga Western Cape 173 178 198 183 172 -11 -6,0%
8 Bishop Lavis Western Cape 165 192 122 143 156 13 9,1%
9 Kwazakele Eastern Cape 105 101 91 103 129 26 25,2%
10 Elsies River Western Cape 178 225 163 156 129 -27 -17,3%
11 Empangeni Kwazulu/Natal 141 116 132 112 127 15 13,4%
12 Jeppe Gauteng 96 80 122 139 125 -14 -10,1%
13 Kwamashu E Kwazulu/Natal 125 105 94 107 125 18 16,8%
14 Manenberg Western Cape 165 161 130 114 125 11 9,6%
15 Mfuleni Western Cape 141 186 130 109 123 14 12,8%
16 Inanda Kwazulu/Natal 103 97 144 131 122 -9 -6,9%
17 Plessislaer Kwazulu/Natal 57 39 67 77 119 42 54,5%
18 Philippi East Western Cape 33 59 68 98 118 20 20,4%
19 Chatsworth Kwazulu/Natal 67 87 101 103 116 13 12,6%
20 Tembisa Gauteng 70 106 127 125 114 -11 -8,8%
21 Ivory Park Gauteng 72 115 127 168 111 -57 -33,9%
22 Steenberg Western Cape 39 79 122 102 110 8 7,8%
23 Ntuzuma Kwazulu/Natal 100 67 108 118 108 -10 -8,5%
24 New Brighton Eastern Cape 84 67 63 78 105 27 34,6%
25 Kraaifontein Western Cape 137 127 134 160 103 -57 -35,6%
26 Ravensmead Western Cape 75 87 71 111 102 -9 -8,1%
27 Mariannhill Kwazulu/Natal 50 61 105 91 99 8 8,8%
28 Atteridgeville Gauteng 47 84 92 90 98 8 8,9%
29 Rustenburg North West 58 84 78 94 98 4 4,3%
30 Kagiso Gauteng 95 86 99 119 94 -25 -21,0%

31
ASSAULT GBH : TREND OVER 10-YEAR PERIOD

32
ASSAULT GBH: PROVINCIAL OVERVIEW

33
ASSAULT GBH : TOP 30 STATIONS
Position Station ProvinceApril 2013 to March 2014
April 2014 to March 2015
April 2015 to March 2016
April 2016 to March 2017
April 2017 to March 2018
Case Diff % Change
1 Inanda Kwazulu/Natal 1079 1001 1039 997 1176 179 18,0%
2 Dobsonville Gauteng 737 846 968 817 994 177 21,7%
3 Temba Gauteng 1189 1034 1101 1047 958 -89 -8,5%
4 Umlazi Kwazulu/Natal 1246 1269 1265 1037 935 -102 -9,8%
5 Nyanga Western Cape 918 878 1053 1071 870 -201 -18,8%
6 Hillbrow Gauteng 1026 1010 1069 974 864 -110 -11,3%
7 Ntuzuma Kwazulu/Natal 773 768 787 796 846 50 6,3%
8 Jhb Central Gauteng 791 689 680 726 834 108 14,9%
9 Moroka Gauteng 946 959 886 913 826 -87 -9,5%
10 Ivory Park Gauteng 581 689 842 765 820 55 7,2%
11 Kagiso Gauteng 580 630 886 817 813 -4 -0,5%
12 Orange Farms Gauteng 727 750 864 739 786 47 6,4%
13 Evaton Gauteng 647 845 807 669 780 111 16,6%
14 Ikageng North West 830 766 831 742 772 30 4,0%
15 Rietgat Gauteng 843 825 811 725 768 43 5,9%
16 Seshego Limpopo 566 645 745 747 760 13 1,7%
17 Vosman Mpumalanga 727 711 773 787 759 -28 -3,6%
18 Mamelodi East Gauteng 664 766 732 691 758 67 9,7%
19 Diepsloot Gauteng 612 528 776 814 754 -60 -7,4%
20 Boitekong North West 541 597 629 655 748 93 14,2%
21 Randfontein Gauteng 629 645 701 743 736 -7 -0,9%
22 Plessislaer Kwazulu/Natal 712 791 867 755 726 -29 -3,8%
23 Mankweng Limpopo 607 758 713 654 669 15 2,3%
24 Delft Western Cape 519 605 574 578 666 88 15,2%
25 Madadeni Kwazulu/Natal 612 677 671 619 661 42 6,8%
26 Tembisa Gauteng 694 703 585 514 656 142 27,6%
27 Galeshewe Northern Cape 712 859 704 683 645 -38 -5,6%
28 Tsakane Gauteng 725 747 774 671 637 -34 -5,1%
29 Honeydew Gauteng 582 675 676 656 627 -29 -4,4%
30 Eldorado Park Gauteng 664 685 653 644 605 -39 -6,1%

34
COMMON ASSAULT : TREND OVER 10-YEAR
PERIOD

35
COMMON ASSAULT : PROVINCIAL OVERVIEW

36
COMMON ASSAULT : TOP 30 STATIONS
Position Station ProvinceApril 2013 to March 2014
April 2014 to March 2015
April 2015 to March 2016
April 2016 to March 2017
April 2017 to March 2018
Case Diff % Change
1 Mitchells Plain Western Cape 2185 1847 2079 1992 1574 -418 -21,0%
2 Kagiso Gauteng 1017 955 1286 1162 1297 135 11,6%
3 Worcester Western Cape 1589 1737 1543 1357 1178 -179 -13,2%
4 Phoenix Kwazulu/Natal 1464 1401 1426 950 1096 146 15,4%
5 Dobsonville Gauteng 638 830 985 940 1092 152 16,2%
6 Nyanga Western Cape 588 756 1011 1111 1040 -71 -6,4%
7 Alexandra Gauteng 807 723 809 818 999 181 22,1%
8 Randfontein Gauteng 730 721 794 816 960 144 17,6%
9 Kraaifontein Western Cape 912 843 880 985 933 -52 -5,3%
10 Hillbrow Gauteng 1425 1212 1170 1009 922 -87 -8,6%
11 Khayelitsha Western Cape 773 866 912 826 896 70 8,5%
12 Plessislaer Kwazulu/Natal 907 800 868 889 894 5 0,6%
13 Chatsworth Kwazulu/Natal 1169 953 1098 945 882 -63 -6,7%
14 Delft Western Cape 613 648 652 603 850 247 41,0%
15 Kleinvlei Western Cape 866 847 786 809 821 12 1,5%
16 Honeydew Gauteng 748 795 861 835 805 -30 -3,6%
17 Harare Western Cape 799 901 890 811 801 -10 -1,2%
18 Jhb Central Gauteng 1130 991 907 747 795 48 6,4%
19 Park Road Free State 986 925 885 804 790 -14 -1,7%
20 Atlantis Western Cape 482 558 619 675 785 110 16,3%
21 Mfuleni Western Cape 672 697 716 741 768 27 3,6%
22 Mamelodi East Gauteng 504 554 598 694 755 61 8,8%
23 Oudtshoorn Western Cape 696 728 834 805 746 -59 -7,3%
24 Moroka Gauteng 1168 1140 1171 1032 738 -294 -28,5%
25 Bishop Lavis Western Cape 581 579 735 652 689 37 5,7%
26 Eldorado Park Gauteng 880 881 786 711 681 -30 -4,2%
27 Thabong Free State 939 829 860 689 675 -14 -2,0%
28 Umlazi Kwazulu/Natal 746 720 651 851 675 -176 -20,7%
29 Sunnyside Gauteng 726 751 641 623 670 47 7,5%
30 Witbank Mpumalanga 712 707 673 689 668 -21 -3,0%

37
CRIMES COMMITTED AGAINST WOMEN AND CHILDRENREPORTED CRIME AGAINST WOMEN AND CHILDREN
Crimes committed against women
Crime Category 2017/2018 2017/2018 Count
difference
%
change Murder 2 639 2 930 291 11,0%
Total sexual offences 37 392 36 731 -661 -1,7%
Attempted murder 3 328 3 554 226 6,7%
Assault with the intent to inflict
grievous bodily harm
51 956 53 263 1 307 2,5%
Common assault 78 090 81 142 3 052 3,9%
Total 173 405 177 620 4 215 2,4%
Crimes committed against children
Murder 839 985 146 17,4%
Sexual Offences 24 677 23 488 -1 189 -4,8%
Attempted murder 936 1 059 123 13,1%
Assault with the intent to inflict
grievous bodily harm
7 589 7 562 -27 -0,3%
Common assault 10 211 10 446 235 2,3%
Total 44 252 43 540 -712 -1,6% *Figures includes unfounded counts

KIDNAPPING CRIME
38

39
DOMESTIC-RELATED CRIMEDOMESTIC-RELATED CRIME: PROVINCIAL OVERVIEW

40
DOMESTIC-RELATED CRIMETYPES OF DOMESTIC VIOLENCE-RELATED ABUSE
TYPE OF ABUSE NUMBER PERCENTAGE
Physical abuse 762 67.3%
Emotional, verbal and psychological abuse 220 19.4%
Damage to property 193 17.0%
Economic abuse 140 12.4%
Intimidation 96 8.5%
Sexual abuse 31 2.7%
Unauthorised entry into the victim's residence 21 1.9%
Stalking 13 1.1%
Other forms of controlling behaviour 10 0.9%
Harassment 5 0.4%

41
COMMON ROBBERY : TREND OVER 10-YEAR
PERIOD

42
COMMON ROBBERY : PROVINCIAL OVERVIEW

43
COMMON ROBBERY : TOP 30 STATIONS
Position Station ProvinceApril 2013 to March 2014
April 2014 to March 2015
April 2015 to March 2016
April 2016 to March 2017
April 2017 to March 2018
Case Diff % Change
1 Jhb Central Gauteng 1272 1681 1322 1283 1309 26 2,0%
2 Cape Town Central Western Cape 954 991 931 1143 1179 36 3,1%
3 Pretoria Central Gauteng 1047 1038 937 951 955 4 0,4%
4 Hillbrow Gauteng 511 673 815 846 833 -13 -1,5%
5 Mitchells Plain Western Cape 929 897 754 710 662 -48 -6,8%
6 Park Road Free State 606 681 533 471 634 163 34,6%
7 Parow Western Cape 552 679 493 414 504 90 21,7%
8 Sunnyside Gauteng 299 358 429 459 473 14 3,1%
9 Nyanga Western Cape 441 391 429 459 440 -19 -4,1%
10 Durban Central Kwazulu/Natal 445 429 533 542 424 -118 -21,8%
11 Rustenburg North West 338 349 346 364 414 50 13,7%
12 Bellville Western Cape 482 485 400 371 389 18 4,9%
13 Pinetown Kwazulu/Natal 449 460 380 455 387 -68 -14,9%
14 Witbank Mpumalanga 563 581 463 430 365 -65 -15,1%
15 Kimberley Northern Cape 394 310 339 526 363 -163 -31,0%
16 Kempton Park Gauteng 291 403 318 362 332 -30 -8,3%
17 Kagiso Gauteng 192 255 321 291 308 17 5,8%
18 Pietermaritzburg Kwazulu/Natal 501 479 348 275 301 26 9,5%
19 Honeydew Gauteng 234 300 286 284 297 13 4,6%
20 Ivory Park Gauteng 96 150 188 261 295 34 13,0%
21 Tembisa Gauteng 212 226 240 201 286 85 42,3%
22 Elsies River Western Cape 226 275 240 294 283 -11 -3,7%
23 Bishop Lavis Western Cape 328 334 279 295 271 -24 -8,1%
24 Midrand Gauteng 210 202 248 294 270 -24 -8,2%
25 Akasia Gauteng 189 142 216 212 267 55 25,9%
26 Point Kwazulu/Natal 293 238 266 243 265 22 9,1%
27 Woodstock Western Cape 238 228 220 244 249 5 2,0%
28 Temba Gauteng 322 263 298 256 242 -14 -5,5%
29 Kraaifontein Western Cape 308 271 251 245 237 -8 -3,3%
30 Seshego Limpopo 280 286 264 241 232 -9 -3,7%

ROBBERY WITH AGGRAVATING CIRCUMSTANCES :
TREND OVER 10-YEAR PERIOD
120 920
113 200
101 039 100 769
105 488
118 963
129 045
132 527
140 956
138 364
90 000
100 000
110 000
120 000
130 000
140 000
150 000
-1,8%
-2592 Count(s)
44

45
ROBBERY WITH AGGRAVATING CIRCUMSTANCES:
PROVINCIAL OVERVIEW

46
ROBBERY WITH AGGRAVATING CIRCUMSTANCES: TOP 30
STATIONS
Position Station ProvinceApril 2013 to March 2014
April 2014 to March 2015
April 2015 to March 2016
April 2016 to March 2017
April 2017 to March 2018
Case Diff % Change
1 Jhb Central Gauteng 1117 1233 1694 2187 1954 -233 -10,7%
2 Nyanga Western Cape 983 1242 1503 1498 1646 148 9,9%
3 Hillbrow Gauteng 835 1089 1187 1308 1358 50 3,8%
4 Khayelitsha Western Cape 1185 1421 1226 1529 1294 -235 -15,4%
5 Durban Central Kwazulu/Natal 951 982 1024 1120 1170 50 4,5%
6 Jeppe Gauteng 641 778 947 1058 1143 85 8,0%
7 Pinetown Kwazulu/Natal 1035 1013 1019 1346 1030 -316 -23,5%
8 Honeydew Gauteng 1008 1050 1076 1183 1017 -166 -14,0%
9 Ivory Park Gauteng 404 711 824 1042 958 -84 -8,1%
10 Mitchells Plain Western Cape 1300 1303 1347 1018 946 -72 -7,1%
11 Kempton Park Gauteng 632 731 714 834 890 56 6,7%
12 Delft Western Cape 383 536 617 758 869 111 14,6%
13 Midrand Gauteng 577 676 744 882 839 -43 -4,9%
14 Rustenburg North West 544 623 672 909 838 -71 -7,8%
15 Mfuleni Western Cape 596 657 779 686 827 141 20,6%
16 Sandton Gauteng 690 646 766 812 826 14 1,7%
17 Witbank Mpumalanga 572 638 627 771 821 50 6,5%
18 Pretoria Central Gauteng 1097 1007 763 778 812 34 4,4%
19 Temba Gauteng 687 724 863 908 802 -106 -11,7%
20 Philippi East Western Cape 262 365 473 619 789 170 27,5%
21 Tembisa Gauteng 586 649 694 698 787 89 12,8%
22 Umlazi Kwazulu/Natal 597 716 732 788 781 -7 -0,9%
23 Kwazakele Eastern Cape 941 820 745 837 768 -69 -8,2%
24 Kraaifontein Western Cape 675 695 708 761 749 -12 -1,6%
25 Kagiso Gauteng 519 605 839 836 738 -98 -11,7%
26 Moroka Gauteng 627 582 610 737 737 0 0,0%
27 Booysens Gauteng 634 702 668 726 718 -8 -1,1%
28 Rietgat Gauteng 673 669 645 702 713 11 1,6%
29 Harare Western Cape 839 867 924 902 709 -193 -21,4%
30 Alexandra Gauteng 643 715 649 600 702 102 17,0%

47
INSTRUMENTS MOST FREQUENTLY USED IN AGRAVATED
ROBBERY

48
ASSOCIATED ROBBERY: FOLLOWING FROM OR TO BANK ASSOCIATED ROBBERY: FOLLOWING FROM BANK “: PROVINCIAL OVERVIEW

11
Some Categories of Robbery Aggravating Circumstances
Consist of the following crime types:
Carjacking
Truck-Hijacking
Bank-Robbery
Robbery – Residential
Robbery – Non –Residential

50
CARJACKING : TREND OVER 10-YEAR PERIOD

51
CARJACKING: PROVINCIAL OVERVIEW

52
CARJACKING: TOP 30 STATIONS
Position Station ProvinceApril 2013 to March 2014
April 2014 to March 2015
April 2015 to March 2016
April 2016 to March 2017
April 2017 to March 2018
Case Diff % Change
1 Nyanga Western Cape 102 137 238 257 276 19 7,4%2 Jeppe Gauteng 103 178 192 238 262 24 10,1%3 Booysens Gauteng 224 220 207 250 198 -52 -20,8%4 Honeydew Gauteng 56 61 98 149 184 35 23,5%5 Moffatview Gauteng 157 164 97 155 183 28 18,1%6 Delft Western Cape 18 82 128 164 175 11 6,7%7 Jhb Central Gauteng 65 95 131 151 169 18 11,9%8 Kempton Park Gauteng 77 79 97 146 168 22 15,1%9 Vosloorus Gauteng 53 51 71 86 158 72 83,7%10 Tembisa Gauteng 95 142 98 118 156 38 32,2%11 Umlazi Kwazulu/Natal 85 85 124 153 150 -3 -2,0%12 Khayelitsha Western Cape 59 73 80 145 144 -1 -0,7%13 Cleveland Gauteng 56 110 94 116 143 27 23,3%14 Dobsonville Gauteng 118 113 126 155 142 -13 -8,4%15 Kwazakele Eastern Cape 104 88 135 152 139 -13 -8,6%16 Moroka Gauteng 87 89 103 115 131 16 13,9%17 Mfuleni Western Cape 31 49 101 103 126 23 22,3%18 Roodepoort Gauteng 138 129 101 92 124 32 34,8%19 Harare Western Cape 76 86 119 173 124 -49 -28,3%20 Bramley Gauteng 79 86 100 96 123 27 28,1%21 Mamelodi East Gauteng 62 79 112 122 123 1 0,8%22 New Brighton Eastern Cape 80 71 86 119 122 3 2,5%23 Mondeor Gauteng 103 91 95 133 121 -12 -9,0%24 Alexandra Gauteng 86 143 106 107 120 13 12,1%25 Soshanguve Gauteng 72 116 169 192 120 -72 -37,5%26 Pinetown Kwazulu/Natal 202 147 146 238 117 -121 -50,8%27 Atteridgeville Gauteng 41 74 89 94 113 19 20,2%28 Ivory Park Gauteng 72 127 128 163 112 -51 -31,3%29 Florida Gauteng 73 119 116 90 109 19 21,1%30 Rietgat Gauteng 121 133 117 156 108 -48 -30,8%

53
TRUCK HIJACKING : TREND OVER 10-YEAR PERIOD

54
TRUCK HIJACKING: PROVINCIAL OVERVIEW

55
TRUCK HIJACKING: TOP 30 STATIONS
Position Station ProvinceApril 2013 to March 2014
April 2014 to March 2015
April 2015 to March 2016
April 2016 to March 2017
April 2017 to March 2018
Case Diff
1 Heidelberg (Gp) Gauteng 40 99 73 31 43 12
2 Kempton Park Gauteng 18 29 41 38 36 -2
3 Alberton Gauteng 34 44 26 43 34 -9
4 Vosloorus Gauteng 27 21 32 14 27 13
5 Olifantsfontein Gauteng 5 32 21 27 23 -4
6 Delmas Mpumalanga 23 28 27 36 23 -13
7 Bedfordview Gauteng 9 12 28 29 21 -8
8 Nyanga Western Cape 3 11 5 5 21 16
9 Lyttelton Gauteng 3 10 8 19 20 1
10 Kliprivier Gauteng 10 13 9 15 16 1
11 Zonkizizwe Gauteng 26 23 9 17 16 -1
12 Witbank Mpumalanga 18 23 20 34 16 -18
13 Boksburg North Gauteng 11 16 20 17 14 -3
14 Germiston Gauteng 12 19 15 16 14 -2
15 Middelburg Mpumalang Mpumalanga 9 6 20 9 145
16 Atteridgeville Gauteng 0 1 8 3 13 10
17 Benoni Gauteng 16 16 7 9 13 4
18 Brackendowns Gauteng 15 15 9 6 13 7
19 Mondeor Gauteng 11 8 10 13 13 0
20 Swartkops Eastern Cape 3 2 1 11 12 1
21 Bekkersdal Gauteng 7 15 13 12 12 0
22 Springs Gauteng 12 16 15 8 12 4
23 Brooklyn Gauteng 1 0 6 6 11 5
24 Sinoville Gauteng 5 9 4 7 11 4
25 Mount Road Eastern Cape 3 0 4 10 10 0
26 Cleveland Gauteng 3 7 5 7 10 3
27 Dobsonville Gauteng 1 0 0 1 10 9
28 Meyerton Gauteng 6 16 6 5 10 5
29 Philippi East Western Cape 0 0 3 3 10 7
30 Kwazakele Eastern Cape 1 2 2 1 9 8

56
BANK ROBBERY : TREND OVER 10-YEAR PERIOD
102
93
39 35
7
21 17
6 3
13
-
20
40
60
80
100
120
10 Count(s)

BANK ROBBERY : PROVINCIAL OVERVIEW
57
NW GP KZN FS MP EC WC NC LP
2016/17 - 1 1 - - 1 - - -
2017/18 1 6 3 2 - - 1 - -
Case Diff 1 5 2 2 0 -1 1 0 0
-
1
2
3
4
5
6
7
8

58
ROBBERY RESIDENTIAL : TREND OVER 10-YEAR
PERIOD
59
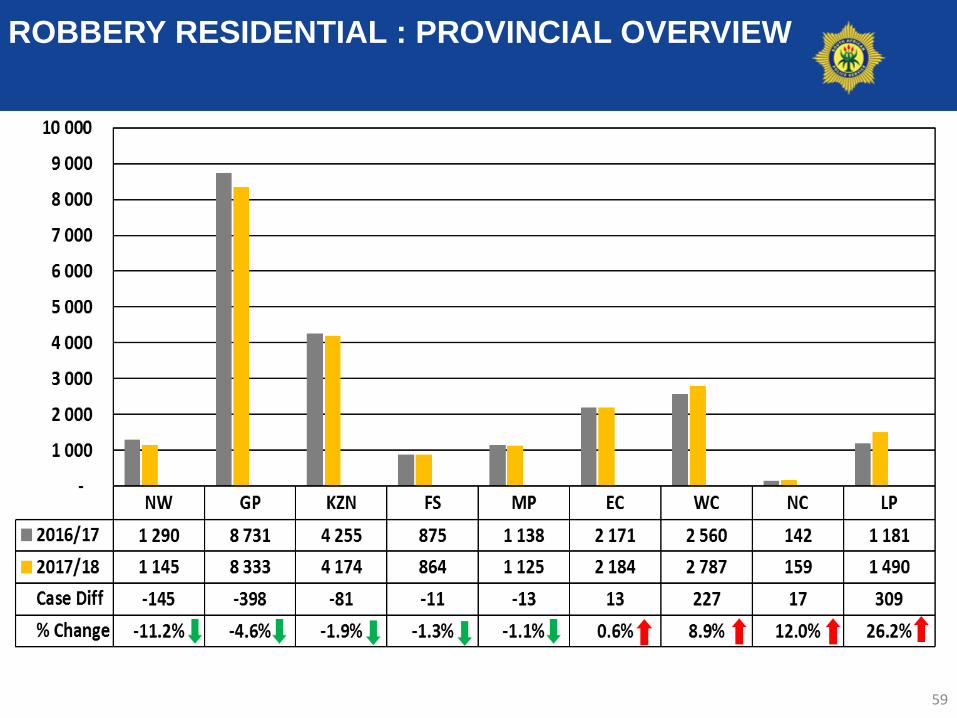
ROBBERY RESIDENTIAL : PROVINCIAL OVERVIEW
60
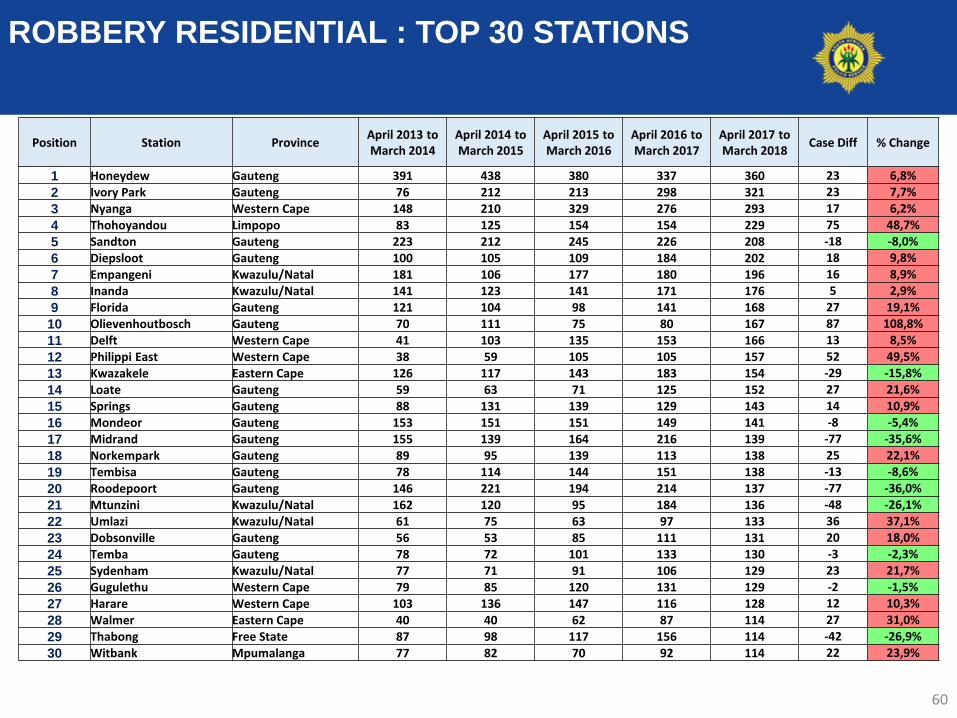
ROBBERY RESIDENTIAL : TOP 30 STATIONS
Position Station ProvinceApril 2013 to March 2014
April 2014 to March 2015
April 2015 to March 2016
April 2016 to March 2017
April 2017 to March 2018
Case Diff % Change
1 Honeydew Gauteng 391 438 380 337 360 23 6,8%
2 Ivory Park Gauteng 76 212 213 298 321 23 7,7%
3 Nyanga Western Cape 148 210 329 276 293 17 6,2%
4 Thohoyandou Limpopo 83 125 154 154 229 75 48,7%
5 Sandton Gauteng 223 212 245 226 208 -18 -8,0%
6 Diepsloot Gauteng 100 105 109 184 202 18 9,8%
7 Empangeni Kwazulu/Natal 181 106 177 180 196 16 8,9%
8 Inanda Kwazulu/Natal 141 123 141 171 176 5 2,9%
9 Florida Gauteng 121 104 98 141 168 27 19,1%
10 Olievenhoutbosch Gauteng 70 111 75 80 167 87 108,8%
11 Delft Western Cape 41 103 135 153 166 13 8,5%
12 Philippi East Western Cape 38 59 105 105 157 52 49,5%
13 Kwazakele Eastern Cape 126 117 143 183 154 -29 -15,8%
14 Loate Gauteng 59 63 71 125 152 27 21,6%
15 Springs Gauteng 88 131 139 129 143 14 10,9%
16 Mondeor Gauteng 153 151 151 149 141 -8 -5,4%
17 Midrand Gauteng 155 139 164 216 139 -77 -35,6%
18 Norkempark Gauteng 89 95 139 113 138 25 22,1%
19 Tembisa Gauteng 78 114 144 151 138 -13 -8,6%
20 Roodepoort Gauteng 146 221 194 214 137 -77 -36,0%
21 Mtunzini Kwazulu/Natal 162 120 95 184 136 -48 -26,1%
22 Umlazi Kwazulu/Natal 61 75 63 97 133 36 37,1%
23 Dobsonville Gauteng 56 53 85 111 131 20 18,0%
24 Temba Gauteng 78 72 101 133 130 -3 -2,3%
25 Sydenham Kwazulu/Natal 77 71 91 106 129 23 21,7%
26 Gugulethu Western Cape 79 85 120 131 129 -2 -1,5%
27 Harare Western Cape 103 136 147 116 128 12 10,3%
28 Walmer Eastern Cape 40 40 62 87 114 27 31,0%
29 Thabong Free State 87 98 117 156 114 -42 -26,9%
30 Witbank Mpumalanga 77 82 70 92 114 22 23,9%

61
ROBBERY-NON-RESIDENTIAL : TREND OVER
10-YEAR PERIOD

62
ROBBERY-NON-RESIDENTIAL: PROVINCIAL
OVERVIEW

63
ROBBERY-NON-RESIDENTIAL: TOP 30 STATIONS
Position Station ProvinceApril 2013 to March 2014
April 2014 to March 2015
April 2015 to March 2016
April 2016 to March 2017
April 2017 to March 2018
Case Diff % Change
1 Jhb Central Gauteng 214 214 165 225 205 -20 -8,9%2 Durban Central Kwazulu/Natal 67 95 97 149 197 48 32,2%3 Witbank Mpumalanga 73 82 110 170 161 -9 -5,3%4 Evaton Gauteng 56 110 131 170 138 -32 -18,8%5 Temba Gauteng 122 141 181 168 138 -30 -17,9%6 Jeppe Gauteng 100 101 105 143 137 -6 -4,2%7 East London Eastern Cape 64 74 60 63 136 73 115,9%8 Pinetown Kwazulu/Natal 96 79 82 119 127 8 6,7%9 Hillbrow Gauteng 92 116 88 135 125 -10 -7,4%10 Kempton Park Gauteng 122 116 135 129 124 -5 -3,9%11 Thohoyandou Limpopo 73 82 118 80 121 41 51,3%12 Plessislaer Kwazulu/Natal 42 79 54 88 118 30 34,1%13 Vosman Mpumalanga 82 94 141 111 117 6 5,4%14 Khayelitsha Western Cape 121 115 86 115 116 1 0,9%15 Olievenhoutbosch Gauteng 84 63 64 109 113 4 3,7%16 Tembisa Gauteng 102 110 112 91 108 17 18,7%17 Rustenburg North West 76 97 90 122 107 -15 -12,3%18 Ivory Park Gauteng 82 66 132 156 106 -50 -32,1%19 Umbilo Kwazulu/Natal 30 35 41 59 102 43 72,9%20 Mfuleni Western Cape 61 81 83 65 101 36 55,4%21 Orange Farms Gauteng 51 117 93 110 100 -10 -9,1%22 Kagiso Gauteng 105 108 136 89 93 4 4,5%23 Midrand Gauteng 72 98 72 93 93 0 0,0%24 Moffatview Gauteng 52 66 50 85 91 6 7,1%25 Greenwood Park Kwazulu/Natal 77 70 77 88 90 2 2,3%26 Motherwell Eastern Cape 83 79 78 49 89 40 81,6%27 Benoni Gauteng 88 88 95 87 89 2 2,3%28 Vanderbijlpark Gauteng 62 81 73 117 89 -28 -23,9%29 Brakpan Gauteng 64 46 54 62 88 26 41,9%30 Springs Gauteng 94 111 128 91 86 -5 -5,5%
ROBBERY NON-RESIDENTIAL PLACE OF OCCURANCE
64
Province
Liq
uo
r o
utl
ets
Sc
ho
ol
Ch
urc
h
Sp
aza
/ Tu
ck
sh
op
Str
ee
t ve
nd
ors
/
ha
wk
ers
Po
st
off
ice
Po
lic
e s
tati
on
Go
ve
rnm
en
t
bu
ild
ing
s
Res
tau
ran
t /
Fa
st
Fo
od
Ro
bb
eri
es
at
Ma
ll's
/ S
ho
pp
ing
Cen
tre
/ P
laza
Co
nve
nie
nc
e
sto
re
Eastern Cape 171 61 2 936 0 9 2* 0 45 38 279
Free State 47 2 0 69 0 2 1 3 23 57 16
Gauteng 190 178 97 568 3 9 0 10 26 256 200
KwaZulu-Natal 67 11 3 323 0 0 1* 7 86 9 150
Limpopo 84 46 12 1 142 17 1 0 0 5 10 67
Mpumalanga 94 27 8 951 33 0 0 18 8 114 116
Northwest 53 39 3 748 1 1 0 3 18 24 52
Northern Cape 0 1 0 235 0 1 0 1 0 0 19
Western Cape 98 13 0 799 6 0 1 5 70 117 180
TOTAL 804 378 125 5 771 60 23 5 47 281 625 1 079
* The single case at police stations in KwaZulu-Natal and one of the cases in the Eastern Cape
refers to attempted robbery

65
ROBBERY OF CASH IN TRANSIT : TREND OVER
10-YEAR PERIOD

66
ROBBERY OF CASH-IN-TRANSIT: DAYS AND
TIMES OF THE WEEK

67
ROBBERY OF CASH-IN-TRANSIT: DATE OF THE
CALENDAR
68
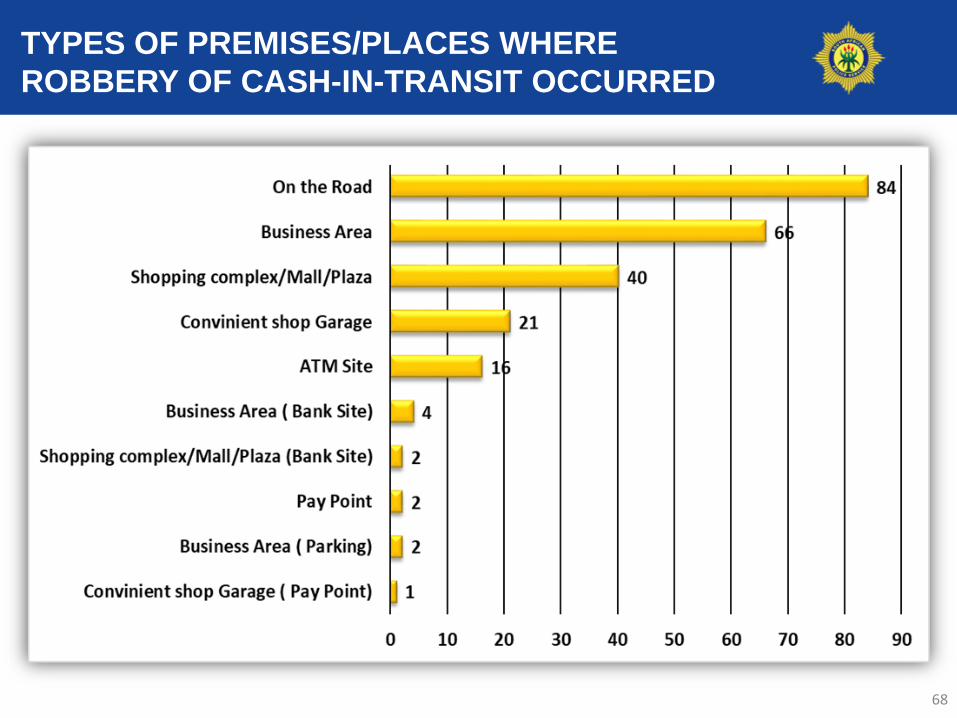
TYPES OF PREMISES/PLACES WHERE
ROBBERY OF CASH-IN-TRANSIT OCCURRED

69
TYPES OF ROBBERY OF CASH-IN-TRANSIT VS
INSTRUMENT USED

70
FIREARM OF THE SECURITY OFFICERS WERE
ROBBED IN THE PROCESS OF ROBBERIES
Firearm robbed AV on the
Road
Cross
pavement
Inside
store
Static
AV
stationery
AV
Total
1 Pistol 9mm 9x19 39 51 26 14 1 131
1 Revolver 38
Special
8 4 4 1
17
1 Rifle 223 2 2
1
5
1 short gun Girsan 1 1
2
2 Pistol 9mm 9x19 3 1 1
5
2 Revolver 38
Special
1
1
2 Rifle 223 1
1
3 Pistol 9mm 9x19 1
1
Total 55 60 31 16 1 163

71
ROBBERY OF CASH-IN-TRANSIT: FATALITIES

ROBBERY OF CASH IN TRANSIT : PROVINCIAL
OVERVIEW
NW GP KZN FS MP EC WC NC LP
2016/17 4 33 25 12 22 11 35 - 10
2017/18 23 80 30 18 23 23 26 1 14
Case Diff 19 47 5 6 1 12 -9 1 4
% Change 475.0% 142.4% 20.0% 50.0% 4.5% 109.1% -25.7% 0.0% 40.0%
-
10
20
30
40
50
60
70
80
90
72

ROBBERY OF CASH IN TRANSIT : PROVINCIAL
OVERVIEW
73
Position Station ProvinceApril 2013 to March 2014
April 2014 to March 2015
April 2015 to March 2016
April 2016 to March 2017
April 2017 to March 2018
Case Diff
1 Witbank Mpumalanga 3 1 2 4 5 1
2 Phuthaditjhaba Free State 0 0 1 1 4 3
3 Evaton Gauteng 1 0 1 2 4 2
4 Temba Gauteng 0 0 0 0 4 4
5 Jouberton North West 0 1 1 1 4 3
6 Phokeng North West 0 0 0 1 4 3
7 Rustenburg North West 0 0 0 0 4 4
8 Mthatha Eastern Cape 0 0 0 0 3 3
9 Park Road Free State 1 0 0 2 3 1
10 Akasia Gauteng 0 1 0 1 3 2
11 Hillbrow Gauteng 2 0 1 0 3 3
12 Jabulani Gauteng 1 0 0 0 3 3
13 Kempton Park Gauteng 7 2 2 5 3 -2
14 Pretoria Central Gauteng 0 0 0 1 3 2
15 Rietgat Gauteng 0 1 1 1 3 2
16 Sebokeng Gauteng 1 0 2 1 3 2
17 Kwamashu E Kwazulu/Natal 2 0 0 2 3 1
18 Madadeni Kwazulu/Natal 0 0 0 0 3 3
19 Lentegeur Western Cape 0 1 1 0 3 3
20 Parow Western Cape 1 0 0 2 3 1
21 Swartkops Eastern Cape 0 0 0 0 2 2
22 Uitenhage Eastern Cape 0 0 1 0 2 2
23 Bethlehem Free State 0 2 0 1 2 1
24 Kestell Free State 0 0 0 0 2 2
25 Navalsig Free State 0 0 0 1 2 1
26 Brakpan Gauteng 1 0 0 0 2 2
27 Diepkloof Gauteng 2 2 0 0 2 2
28 Dobsonville Gauteng 0 1 0 0 2 2
29 Germiston Gauteng 1 0 2 1 2 1
30 Jhb Central Gauteng 10 5 0 3 2 -1

11
TRIO CRIMESConsist of the following crime types:
Carjacking
Robbery – Residential
Robbery – Non –Residential

TRIO CRIME : TREND OVER 10-YEAR PERIOD
47 179 47 142
42 067 42 095
44 224
49 037
52 224
55 120
59 740 58 612
30 000
35 000
40 000
45 000
50 000
55 000
60 000
65 000
70 000
-1,9%
-1128 Count(s)
75

76
TRIO CRIME : TWO YEAR COMPARISON

TRIO CRIME : PROVINCIAL OVERVIEW
NW GP KZN FS MP EC WC NC LP
2016/17 3 173 24 528 10 235 2 082 3 712 5 495 6 650 475 3 390
2017/18 2 833 23 262 9 919 1 985 3 645 5 578 7 001 495 3 894
Case Diff -340 -1 266 -316 -97 -67 83 351 20 504
% Change -10.7% -5.2% -3.1% -4.7% -1.8% 1.5% 5.3% 4.2% 14.9%
-
2 500
5 000
7 500
10 000
12 500
15 000
17 500
20 000
22 500
25 000
77

TRIO CRIME : TOP 30 STATIONS
78
Position Station ProvinceApril 2013 to March 2014
April 2014 to March 2015
April 2015 to March 2016
April 2016 to March 2017
April 2017 to March 2018
Case Diff % Change
1 Nyanga Western Cape 337 406 619 573 627 54 9,4%
2 Honeydew Gauteng 549 585 600 638 615 -23 -3,6%
3 Ivory Park Gauteng 230 405 473 617 539 -78 -12,6%
4 Jeppe Gauteng 281 333 394 475 479 4 0,8%
5 Thohoyandou Limpopo 161 214 297 249 403 154 61,8%
6 Tembisa Gauteng 275 366 354 360 402 42 11,7%
7 Jhb Central Gauteng 291 321 307 401 393 -8 -2,0%
8 Delft Western Cape 109 217 304 356 389 33 9,3%
9 Khayelitsha Western Cape 263 272 293 376 372 -4 -1,1%
10 Temba Gauteng 255 298 397 436 365 -71 -16,3%
11 Umlazi Kwazulu/Natal 212 247 287 317 363 46 14,5%
12 Witbank Mpumalanga 170 199 247 352 363 11 3,1%
13 Moffatview Gauteng 257 294 216 347 362 15 4,3%
14 Olievenhoutbosch Gauteng 184 225 191 316 362 46 14,6%
15 Booysens Gauteng 383 426 361 436 361 -75 -17,2%
16 Sandton Gauteng 366 315 376 368 357 -11 -3,0%
17 Dobsonville Gauteng 304 266 289 387 356 -31 -8,0%
18 Kempton Park Gauteng 283 308 308 342 351 9 2,6%
19 Pinetown Kwazulu/Natal 447 322 337 482 351 -131 -27,2%
20 Florida Gauteng 243 262 252 295 348 53 18,0%
21 Inanda Kwazulu/Natal 302 279 322 337 342 5 1,5%
22 Empangeni Kwazulu/Natal 329 210 376 341 341 0 0,0%
23 Kwazakele Eastern Cape 282 274 361 391 336 -55 -14,1%
24 Philippi East Western Cape 118 156 254 309 336 27 8,7%
25 Evaton Gauteng 201 261 308 351 333 -18 -5,1%
26 Mfuleni Western Cape 158 188 314 270 332 62 23,0%
27 Midrand Gauteng 303 314 333 411 328 -83 -20,2%
28 Harare Western Cape 298 325 360 382 328 -54 -14,1%
29 Roodepoort Gauteng 433 439 355 393 325 -68 -17,3%
30 Cleveland Gauteng 223 267 247 271 324 53 19,6%

11
SEXUAL OFFENCESConsist of the following crime types:
Rape
Sexual Assault
Attempted Sexual Offences
Contact Sexual Offences

SEXUAL OFFENCE : TREND OVER 10-YEAR PERIOD
69 197
66 992
64 921
60 539 60 888
56 680
53 617
51 895 49 660 50 108
40 000
45 000
50 000
55 000
60 000
65 000
70 000
75 000
0,9%
448 Count(s)
80

SEXUAL OFFENCE : PROVINCIAL OVERVIEW
81

SEXUAL OFFENCE : TOP 30 STATIONS
82
Position Station ProvinceApril 2013 to March 2014
April 2014 to March 2015
April 2015 to March 2016
April 2016 to March 2017
April 2017 to March 2018
Case Diff % Change
1 Inanda Kwazulu/Natal 347 313 316 348 330 -18 -5,2%
2 Nyanga Western Cape 321 292 351 356 308 -48 -13,5%
3 Umlazi Kwazulu/Natal 338 340 319 295 290 -5 -1,7%
4 Thohoyandou Limpopo 277 299 248 198 250 52 26,3%
5 Mthatha Eastern Cape 50 250 243 246 236 -10 -4,1%
6 Delft Western Cape 214 225 207 219 236 17 7,8%
7 Kagiso Gauteng 173 188 178 215 229 14 6,5%
8 Gugulethu Western Cape 236 229 243 238 223 -15 -6,3%
9 Jouberton North West 322 304 225 265 215 -50 -18,9%
10 Lusikisiki Eastern Cape 171 155 161 156 210 54 34,6%
11 Empangeni Kwazulu/Natal 263 240 219 226 208 -18 -8,0%
12 Dobsonville Gauteng 203 182 184 227 206 -21 -9,3%
13 Temba Gauteng 265 228 211 211 204 -7 -3,3%
14 Plessislaer Kwazulu/Natal 234 245 281 200 204 4 2,0%
15 Mitchells Plain Western Cape 257 213 179 193 200 7 3,6%
16 Mankweng Limpopo 262 236 249 220 196 -24 -10,9%
17 Ivory Park Gauteng 161 220 212 207 195 -12 -5,8%
18 Orange Farms Gauteng 156 180 163 184 195 11 6,0%
19 Harare Western Cape 234 235 211 204 192 -12 -5,9%
20 Alexandra Gauteng 258 219 179 164 191 27 16,5%
21 Seshego Limpopo 216 214 200 178 190 12 6,7%
22 Kraaifontein Western Cape 161 182 180 172 189 17 9,9%
23 Khayelitsha Western Cape 230 229 223 156 186 30 19,2%
24 Tsakane Gauteng 201 176 195 194 185 -9 -4,6%
25 Bloemspruit Free State 323 265 221 161 181 20 12,4%
26 Kwadukuza Kwazulu/Natal 218 197 171 161 180 19 11,8%
27 Rustenburg North West 142 166 204 156 180 24 15,4%
28 Jhb Central Gauteng 131 141 138 148 179 31 20,9%
29 Thabong Free State 316 254 225 223 178 -45 -20,2%
30 Moroka Gauteng 215 198 162 201 177 -24 -11,9%

83
RAPE : TREND OVER 10-YEAR PERIOD

RAPE : PROVINCIAL OVERVIEW
NW GP KZN FS MP EC WC NC LP
2016/17 3 615 7 700 7 032 2 702 2 708 6 836 4 771 1 143 3 321
2017/18 3 479 8 062 7 243 2 573 2 712 6 821 4 744 1 100 3 301
Case Diff -136 362 211 -129 4 -15 -27 -43 -20
% Change -3.8% 4.7% 3.0% -4.8% 0.1% -0.2% -0.6% -3.8% -0.6%
-
1 500
3 000
4 500
6 000
7 500
9 000
84

RAPE : TOP 30 STATIONS
85
Position Station ProvinceApril 2013 to March 2014
April 2014 to March 2015
April 2015 to March 2016
April 2016 to March 2017
April 2017 to March 2018
Case Diff % Change
1 Inanda Kwazulu/Natal 297 274 272 309 278 -31 -10,0%
2 Umlazi Kwazulu/Natal 298 305 284 262 252 -10 -3,8%
3 Thohoyandou Limpopo 246 269 230 183 225 42 23,0%
4 Mthatha Eastern Cape 46 222 217 227 222 -5 -2,2%
5 Kagiso Gauteng 144 171 161 195 210 15 7,7%
6 Nyanga Western Cape 230 202 247 256 210 -46 -18,0%
7 Delft Western Cape 164 174 164 158 196 38 24,1%
8 Lusikisiki Eastern Cape 155 137 138 139 191 52 37,4%
9 Empangeni Kwazulu/Natal 227 210 185 195 186 -9 -4,6%
10 Dobsonville Gauteng 165 156 157 200 182 -18 -9,0%
11 Jouberton North West 291 248 176 203 178 -25 -12,3%
12 Temba Gauteng 231 182 175 194 177 -17 -8,8%
13 Plessislaer Kwazulu/Natal 212 219 234 179 177 -2 -1,1%
14 Orange Farms Gauteng 138 159 150 173 176 3 1,7%
15 Ivory Park Gauteng 150 205 196 182 169 -13 -7,1%
16 Tsakane Gauteng 168 146 166 164 167 3 1,8%
17 Mankweng Limpopo 225 207 211 200 166 -34 -17,0%
18 Gugulethu Western Cape 161 157 167 173 166 -7 -4,0%
19 Alexandra Gauteng 211 184 142 142 162 20 14,1%
20 Harare Western Cape 196 174 164 162 156 -6 -3,7%
21 Khayelitsha Western Cape 172 186 191 139 156 17 12,2%
22 Thabong Free State 282 227 198 195 155 -40 -20,5%
23 Kraaifontein Western Cape 124 145 139 122 154 32 26,2%
24 Bloemspruit Free State 286 243 195 132 152 20 15,2%
25 Kwadukuza Kwazulu/Natal 175 157 142 126 152 26 20,6%
26 Seshego Limpopo 171 174 166 144 151 7 4,9%
27 Tembisa Gauteng 224 139 179 103 150 47 45,6%
28 Diepsloot Gauteng 163 115 133 154 149 -5 -3,2%
29 Calcutta Mpumalanga 149 148 165 108 149 41 38,0%
30 Mamelodi East Gauteng 107 103 115 115 148 33 28,7%

86
RAPE : RATIO vs % CONTRIBUTION

87
SEXUAL ASSAULT : TREND OVER 10-YEAR PERIOD

88
SEXUAL ASSAULT : PROVINCIAL OVERVIEW
89
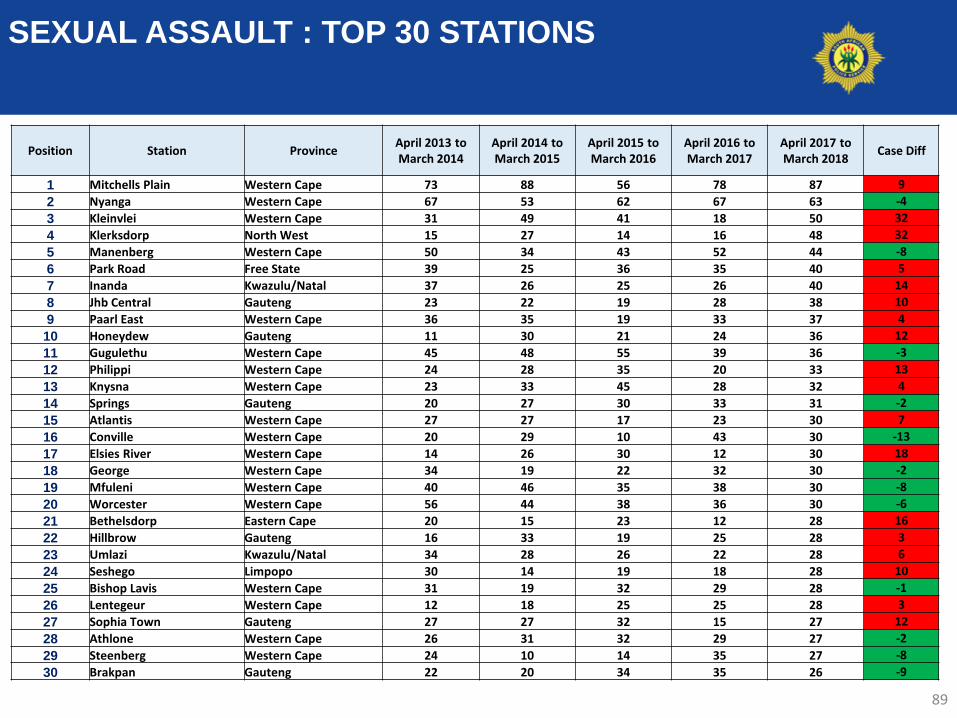
SEXUAL ASSAULT : TOP 30 STATIONS
Position Station ProvinceApril 2013 to March 2014
April 2014 to March 2015
April 2015 to March 2016
April 2016 to March 2017
April 2017 to March 2018
Case Diff
1 Mitchells Plain Western Cape 73 88 56 78 87 9
2 Nyanga Western Cape 67 53 62 67 63 -4
3 Kleinvlei Western Cape 31 49 41 18 50 32
4 Klerksdorp North West 15 27 14 16 48 32
5 Manenberg Western Cape 50 34 43 52 44 -8
6 Park Road Free State 39 25 36 35 40 5
7 Inanda Kwazulu/Natal 37 26 25 26 40 14
8 Jhb Central Gauteng 23 22 19 28 38 10
9 Paarl East Western Cape 36 35 19 33 37 4
10 Honeydew Gauteng 11 30 21 24 36 12
11 Gugulethu Western Cape 45 48 55 39 36 -3
12 Philippi Western Cape 24 28 35 20 33 13
13 Knysna Western Cape 23 33 45 28 32 4
14 Springs Gauteng 20 27 30 33 31 -2
15 Atlantis Western Cape 27 27 17 23 30 7
16 Conville Western Cape 20 29 10 43 30 -13
17 Elsies River Western Cape 14 26 30 12 30 18
18 George Western Cape 34 19 22 32 30 -2
19 Mfuleni Western Cape 40 46 35 38 30 -8
20 Worcester Western Cape 56 44 38 36 30 -6
21 Bethelsdorp Eastern Cape 20 15 23 12 28 16
22 Hillbrow Gauteng 16 33 19 25 28 3
23 Umlazi Kwazulu/Natal 34 28 26 22 28 6
24 Seshego Limpopo 30 14 19 18 28 10
25 Bishop Lavis Western Cape 31 19 32 29 28 -1
26 Lentegeur Western Cape 12 18 25 25 28 3
27 Sophia Town Gauteng 27 27 32 15 27 12
28 Athlone Western Cape 26 31 32 29 27 -2
29 Steenberg Western Cape 24 10 14 35 27 -8
30 Brakpan Gauteng 22 20 34 35 26 -9

90
SEXUAL ASSAULT : RATIO vs % CONTRIBUTION

ATTEMPTED SEXUAL OFFENCES: TREND OVER 10-
YEAR PERIOD
3 808 3 811 3 599 3 535
3 293
2 913
2 641 2 573
2 073 2 066
7.7 7.6 7.1 6.86.3 5.5 4.9 4.7
3.7 3.6 0.0
1.0
2.0
3.0
4.0
5.0
-
1 000
2 000
3 000
4 000
5 000
Attempted Sexual Offences Ratio
-0,3%-7 Count(s)
Act
ual
: A
tte
mp
ted
Se
xual
Off
en
ces
Rat
io :
Att
em
pte
d S
exu
al O
ffe
nce
s
91

ATTEMPTED SEXUAL OFFENCES : PROVINCIAL
OVERVIEW
NW GP KZN FS MP EC WC NC LP
2016/17 246 286 226 154 146 301 365 154 195
2017/18 261 314 204 153 119 318 372 130 195
Case Diff 15 28 -22 -1 -27 17 7 -24 0
% Change 6.1% 9.8% -9.7% -0.6% -18.5% 5.6% 1.9% -15.6% 0.0%
-
50
100
150
200
250
300
350
400
92

ATTEMPTED SEXUAL OFFENCES : TOP 30 STATIONS
93
Position Station ProvinceApril 2013 to March 2014
April 2014 to March 2015
April 2015 to March 2016
April 2016 to March 2017
April 2017 to March 2018
Case Diff
1 Nyanga Western Cape 15 20 22 21 25 4
2 Mankweng Limpopo 21 21 21 15 18 3
3 Taung North West 20 14 13 6 17 11
4 Boitekong North West 17 8 7 17 15 -2
5 Gugulethu Western Cape 10 14 10 12 15 3
6 Wolmaransstad North West 8 6 4 5 14 9
7 Rustenburg North West 11 18 11 8 13 5
8 Mothibistad Northern Cape 8 6 5 10 13 3
9 Maluti Eastern Cape 5 14 15 17 12 -5
10 Galeshewe Northern Cape 15 9 11 9 12 3
11 Harare Western Cape 10 20 15 10 12 2
12 Park Road Free State 16 5 8 3 11 8
13 Mmabatho North West 14 17 14 9 11 2
14 Mogwase North West 20 16 14 8 11 3
15 Philippi East Western Cape 2 11 13 5 11 6
16 Diepkloof Gauteng 6 8 3 6 10 4
17 Diepsloot Gauteng 5 6 8 11 10 -1
18 Verulam Kwazulu/Natal 1 1 0 6 10 4
19 Letsitele Limpopo 6 10 15 8 10 2
20 Pienaar Mpumalanga 1 6 6 5 10 5
21 Kanana North West 12 10 4 8 10 2
22 Kagisho Northern Cape 7 9 10 1 10 9
23 Kimberley Northern Cape 11 10 13 12 10 -2
24 Delft Western Cape 18 7 7 13 10 -3
25 George Western Cape 8 12 9 5 10 5
26 Katlehong Gauteng 7 6 3 10 9 -1
27 Moroka Gauteng 2 3 7 2 9 7
28 Vosman Mpumalanga 9 10 11 9 9 0
29 Tlhabane North West 3 8 2 3 9 6
30 Vryburg North West 9 5 4 6 9 3

CONTACT SEXUAL OFFENCE : TREND OVER 10-
YEAR PERIOD
12 346
8 293
6 158
2 741 2 220 1 821 1 694 1 607 1 488 1 221
24.9
16.5
12.1
5.34.2
3.4 3.1 2.9 2.7 2.1
0.0
0.4
0.8
1.2
1.6
2.0
2.4
2.8
-
4 000
8 000
12 000
16 000
20 000
24 000
28 000
Contact Sexual Offences Ratio
-17,9%
-267 Count(s)
Act
ual
: C
on
tact
Se
xual
Off
en
ces
Rat
io :
Co
nta
ct S
exu
al O
ffe
nce
s
94

CONTACT SEXUAL OFFENCE : PROVINCIAL
OVERVIEW
NW GP KZN FS MP EC WC NC LP
2016/17 146 303 187 158 98 160 309 55 72
2017/18 95 229 164 123 85 150 249 63 63
Case Diff -51 -74 -23 -35 -13 -10 -60 8 -9
% Change -34.9% -24.4% -12.3% -22.2% -13.3% -6.3% -19.4% 14.5% -12.5%
-
50
100
150
200
250
300
350
95

CONTACT SEXUAL OFFENCE : TOP 30 STATIONS
OVERVIEW
96
Position Station ProvinceApril 2013 to March 2014
April 2014 to March 2015
April 2015 to March 2016
April 2016 to March 2017
April 2017 to March 2018
Case Diff
1 Kleinvlei Western Cape 6 12 10 2 15 13
2 Park Road Free State 29 15 23 17 12 -5
3 Nyanga Western Cape 9 17 20 12 10 -2
4 Reddersburg Free State 1 1 0 13 9 -4
5 Knysna Western Cape 1 12 3 6 9 3
6 Ngangelizwe Eastern Cape 11 2 4 6 8 2
7 Witbank Mpumalanga 3 4 8 5 8 3
8 Klerksdorp North West 4 13 13 6 8 2
9 Galeshewe Northern Cape 3 2 6 5 8 3
10 Kimberley Northern Cape 6 4 4 7 8 1
11 Mfuleni Western Cape 3 5 11 4 8 4
12 Graaff-Reinet Eastern Cape 1 1 1 3 7 4
13 Motherwell Eastern Cape 0 3 4 2 7 5
14 Bloemspruit Free State 5 6 5 10 7 -3
15 Kagisanong Free State 5 6 1 5 7 2
16 Welkom Free State 12 11 15 11 7 -4
17 Phoenix Kwazulu/Natal 5 10 2 2 7 5
18 Thembalethu Western Cape 8 8 6 3 7 4
19 Jeffreys Bay Eastern Cape 5 3 4 2 6 4
20 Hillbrow Gauteng 2 7 5 1 6 5
21 Sandton Gauteng 5 12 6 3 6 3
22 Vanderbijlpark Gauteng 5 2 2 9 6 -3
23 Hluhluwe Kwazulu/Natal 0 0 1 0 6 6
24 Jouberton North West 6 25 23 25 6 -19
25 Khuma North West 4 12 9 13 6 -7
26 Gugulethu Western Cape 20 10 11 14 6 -8
27 Malmesbury Western Cape 2 2 5 4 6 2
28 Paarl Western Cape 4 3 2 2 6 4
29 Table View Western Cape 2 2 0 4 6 2
30 Heidedal Free State 1 6 4 3 5 2
11
CONTACT-RELATED CRIMEContact-related crime includes arson and malicious damage to property. These two
crimes are closely related and involve damage to or the destruction of the property of
another (often in order to punish such a person or entity) - or to damage one’s own
property for the purpose of insurance claims.
• Arson
• Malicious damage to property

CONTACT-RELATED CRIME: TREND OVER 10-YEAR
PERIOD
137 914 135 647
128 971
125 903 124 691 123 441
125 789 124 804
120 730
115 361
100 000
105 000
110 000
115 000
120 000
125 000
130 000
135 000
140 000
145 000
150 000
April to March
-4,4%
-5369 Count(s)
99
100
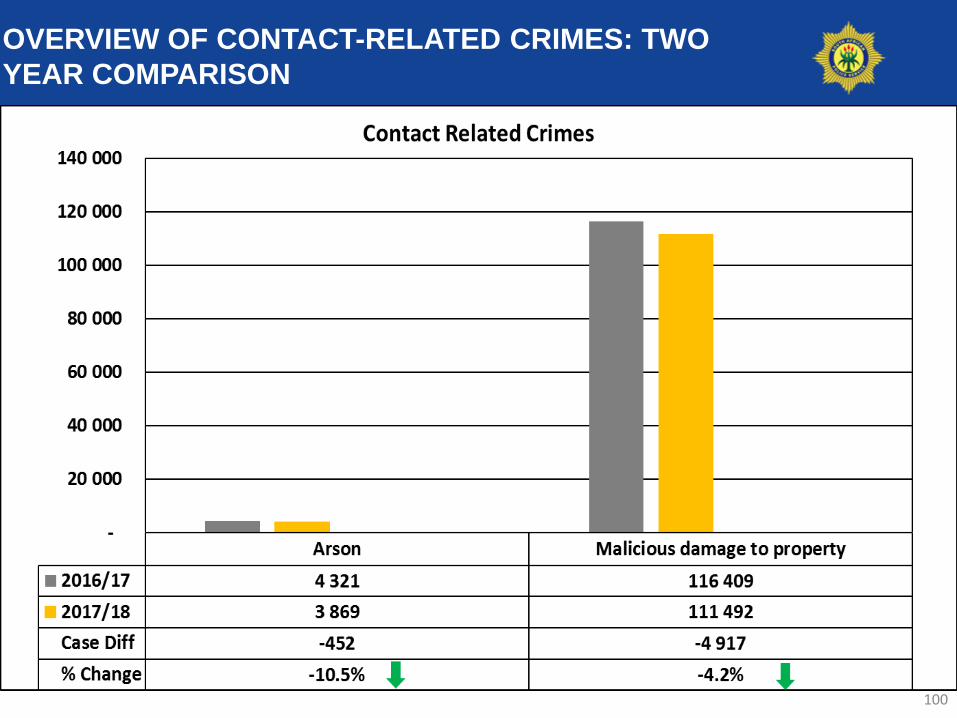
OVERVIEW OF CONTACT-RELATED CRIMES: TWO
YEAR COMPARISON
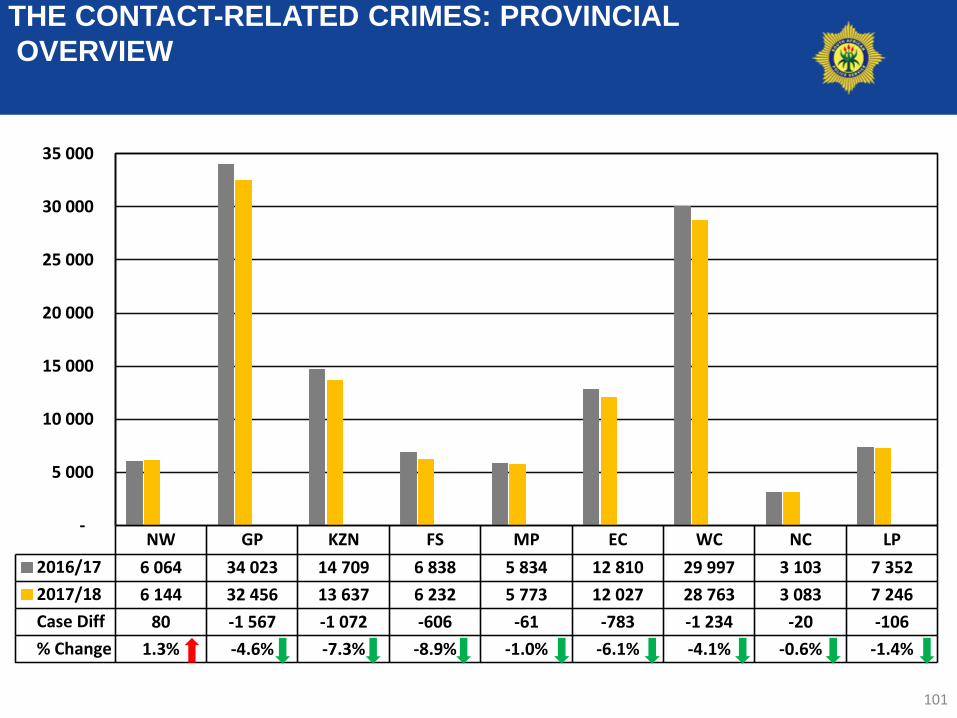
THE CONTACT-RELATED CRIMES: PROVINCIAL
OVERVIEW
NW GP KZN FS MP EC WC NC LP
2016/17 6 064 34 023 14 709 6 838 5 834 12 810 29 997 3 103 7 352
2017/18 6 144 32 456 13 637 6 232 5 773 12 027 28 763 3 083 7 246
Case Diff 80 -1 567 -1 072 -606 -61 -783 -1 234 -20 -106
% Change 1.3% -4.6% -7.3% -8.9% -1.0% -6.1% -4.1% -0.6% -1.4%
-
5 000
10 000
15 000
20 000
25 000
30 000
35 000
101

THE CONTACT-RELATED CRIMES: TOP 30 STATIONS
102
Position Station ProvinceApril 2013 to March 2014
April 2014 to March 2015
April 2015 to March 2016
April 2016 to March 2017
April 2017 to March 2018
Case Diff % Change
1 Mitchells Plain Western Cape 1435 1377 1337 1246 1055 -191 -15,3%
2 Nyanga Western Cape 623 831 901 954 1029 75 7,9%
3 Honeydew Gauteng 842 782 755 827 891 64 7,7%
4 Delft Western Cape 468 563 627 735 834 99 13,5%
5 Worcester Western Cape 867 966 962 949 834 -115 -12,1%
6 Kagiso Gauteng 565 603 745 704 781 77 10,9%
7 Bishop Lavis Western Cape 624 722 744 817 732 -85 -10,4%
8 Elsies River Western Cape 601 847 770 690 724 34 4,9%
9 Dobsonville Gauteng 486 600 678 632 682 50 7,9%
10 Kraaifontein Western Cape 495 549 600 617 672 55 8,9%
11 Eldorado Park Gauteng 616 580 648 609 645 36 5,9%
12 Mfuleni Western Cape 543 649 612 573 637 64 11,2%
13 Hillbrow Gauteng 612 619 644 832 604 -228 -27,4%
14 Temba Gauteng 654 595 592 549 603 54 9,8%
15 Kleinvlei Western Cape 625 596 600 660 602 -58 -8,8%
16 Paarl East Western Cape 525 544 713 710 583 -127 -17,9%
17 Randfontein Gauteng 504 535 522 555 582 27 4,9%
18 Sunnyside Gauteng 579 632 604 610 575 -35 -5,7%
19 Bethelsdorp Eastern Cape 646 612 528 609 572 -37 -6,1%
20 Jhb Central Gauteng 499 652 648 574 557 -17 -3,0%
21 Pretoria Central Gauteng 448 483 457 511 555 44 8,6%
22 Khayelitsha Western Cape 516 638 559 511 555 44 8,6%
23 Mamelodi East Gauteng 403 458 385 457 547 90 19,7%
24 Plessislaer Kwazulu/Natal 425 409 417 461 533 72 15,6%
25 Moroka Gauteng 568 557 488 534 521 -13 -2,4%
26 Athlone Western Cape 509 562 534 522 515 -7 -1,3%
27 Atlantis Western Cape 336 383 437 467 513 46 9,9%
28 Manenberg Western Cape 433 547 491 570 512 -58 -10,2%
29 Krugersdorp Gauteng 601 492 548 503 507 4 0,8%
30 Harare Western Cape 469 588 506 600 500 -100 -16,7%

103
ARSON : TREND OVER 10-YEAR PERIOD

ARSON : PROVINCIAL OVERVIEW
NW GP KZN FS MP EC WC NC LP
2016/17 290 724 699 186 260 748 781 149 484
2017/18 323 495 679 164 254 605 762 156 431
Case Diff 33 -229 -20 -22 -6 -143 -19 7 -53
% Change 11.4% -31.6% -2.9% -11.8% -2.3% -19.1% -2.4% 4.7% -11.0%
-
150
300
450
600
750
900
104

ARSON : TOP 30 STATIONS
105
Position Station ProvinceApril 2013 to March 2014
April 2014 to March 2015
April 2015 to March 2016
April 2016 to March 2017
April 2017 to March 2018
Case Diff % Change
1 Umlazi Kwazulu/Natal 33 39 45 26 35 9 34,6%
2 Thohoyandou Limpopo 34 46 33 29 31 2 6,9%
3 Worcester Western Cape 18 19 26 20 30 10 50,0%
4 Nyanga Western Cape 22 31 23 24 29 5 20,8%
5 Mfuleni Western Cape 15 28 22 33 27 -6 -18,2%
6 Mitchells Plain Western Cape 29 14 29 31 27 -4 -12,9%
7 Inanda Kwazulu/Natal 27 15 35 22 25 3 13,6%
8 Delft Western Cape 16 32 26 23 25 2 8,7%
9 Ntuzuma Kwazulu/Natal 25 19 21 15 24 9 60,0%
10 Bethelsdorp Eastern Cape 19 25 19 27 23 -4 -14,8%
11 Rustenburg North West 25 17 14 1 23 22 2200,0%
12 Harare Western Cape 22 23 37 25 23 -2 -8,0%
13 Mthatha Eastern Cape 8 19 16 16 22 6 37,5%
14 Ntabankulu Eastern Cape 20 15 19 36 22 -14 -38,9%
15 Eshowe Kwazulu/Natal 14 10 13 7 22 15 214,3%
16 Nongoma Kwazulu/Natal 11 15 9 9 21 12 133,3%
17 Knysna Western Cape 15 21 19 14 21 7 50,0%
18 Plessislaer Kwazulu/Natal 20 10 17 6 19 13 216,7%
19 Chatsworth Kwazulu/Natal 18 24 21 15 18 3 20,0%
20 Boitekong North West 18 15 13 25 18 -7 -28,0%
21 Conville Western Cape 5 7 7 14 18 4 28,6%
22 Gugulethu Western Cape 20 18 17 15 18 3 20,0%
23 Giyani Limpopo 41 33 29 16 17 1 6,3%
24 Kuilsrivier Western Cape 1 9 10 12 17 5 41,7%
25 Sterkspruit Eastern Cape 17 10 9 16 16 0 0,0%
26 Mankweng Limpopo 21 26 26 22 16 -6 -27,3%
27 Khayelitsha Western Cape 13 25 17 15 16 1 6,7%
28 Lingelethu-West Western Cape 8 17 13 21 16 -5 -23,8%
29 Mount Ayliff Eastern Cape 10 15 8 20 15 -5 -25,0%
30 Park Road Free State 2 9 5 8 15 7 87,5%

MALICIOUS DAMAGE TO PROPERTY : TREND OVER
10-YEAR PERIOD
131 469
129 343
122 814
119 907 119 026
117 983
120 662 119 901
116 409
111 492
105 000
109 000
113 000
117 000
121 000
125 000
129 000
133 000
137 000
-4,2%
-4917 Count(s)
106
107
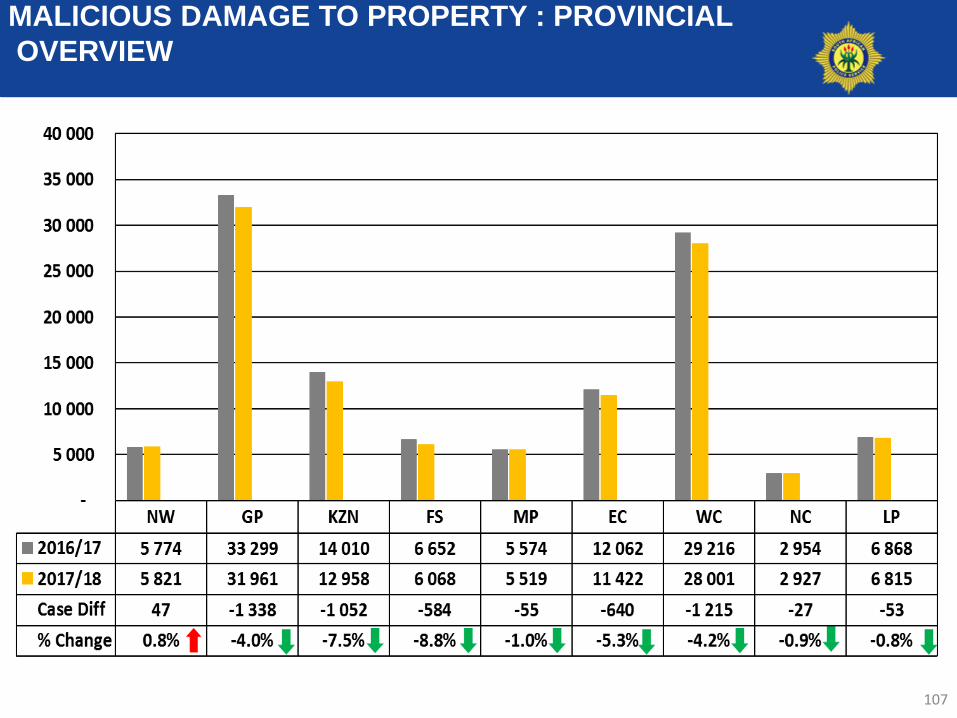
MALICIOUS DAMAGE TO PROPERTY : PROVINCIAL
OVERVIEW

108
MALICIOUS DAMAGE TO PROPERTY :TOP 30 STATIONS
Position Station ProvinceApril 2013 to March 2014
April 2014 to March 2015
April 2015 to March 2016
April 2016 to March 2017
April 2017 to March 2018
Case Diff % Change
1 Mitchells Plain Western Cape 1406 1363 1308 1215 1028 -187 -15,4%
2 Nyanga Western Cape 601 800 878 930 1000 70 7,5%
3 Honeydew Gauteng 829 773 742 824 889 65 7,9%
4 Delft Western Cape 452 531 601 712 809 97 13,6%
5 Worcester Western Cape 849 947 936 929 804 -125 -13,5%
6 Kagiso Gauteng 549 583 723 679 766 87 12,8%
7 Bishop Lavis Western Cape 605 704 728 804 720 -84 -10,4%
8 Elsies River Western Cape 592 828 757 681 710 29 4,3%
9 Dobsonville Gauteng 481 595 673 623 680 57 9,1%
10 Kraaifontein Western Cape 482 522 578 606 659 53 8,7%
11 Eldorado Park Gauteng 603 572 634 604 637 33 5,5%
12 Mfuleni Western Cape 528 621 590 540 610 70 13,0%
13 Hillbrow Gauteng 610 616 638 809 603 -206 -25,5%
14 Temba Gauteng 633 576 576 527 590 63 12,0%
15 Kleinvlei Western Cape 606 580 582 648 587 -61 -9,4%
16 Paarl East Western Cape 514 534 700 701 580 -121 -17,3%
17 Sunnyside Gauteng 579 632 603 609 575 -34 -5,6%
18 Randfontein Gauteng 494 519 514 540 574 34 6,3%
19 Jhb Central Gauteng 496 650 644 573 557 -16 -2,8%
20 Bethelsdorp Eastern Cape 627 587 509 582 549 -33 -5,7%
21 Pretoria Central Gauteng 443 472 446 501 549 48 9,6%
22 Khayelitsha Western Cape 503 613 542 496 539 43 8,7%
23 Mamelodi East Gauteng 375 427 365 443 533 90 20,3%
24 Moroka Gauteng 554 549 483 527 517 -10 -1,9%
25 Plessislaer Kwazulu/Natal 405 399 400 455 514 59 13,0%
26 Athlone Western Cape 496 549 529 515 509 -6 -1,2%
27 Atlantis Western Cape 320 371 431 458 504 46 10,0%
28 Manenberg Western Cape 420 537 484 559 502 -57 -10,2%
29 Krugersdorp Gauteng 580 484 540 494 500 6 1,2%
30 Harare Western Cape 447 565 469 575 477 -98 -17,0%

11
PROPERTY-RELATED CRIMEProperty-related crime refers to crimes during which tangible property of an individual
or institution is taken by criminal elements without permission and in the absence of the
owner or custodian of such property. This type of crime includes burglary at both
residential and non-residential premises, theft of motor vehicles and motorcycles, theft
out of or from motor vehicles and stock-theft.
• Burglary at Residential premises
• Burglary at Non-Residential premises
• Theft of motor vehicle and motor cycle
• Theft out of or from motor vehicle
• Stock theft

PROPERTY-RELATED CRIME: TREND OVER 10-
YEAR PERIOD
527 088
547 753
528 957 530 624
558 334
557 640
553 488
543 524
540 653
507 975
460 000
480 000
500 000
520 000
540 000
560 000
580 000
600 000
-6,0%
-32678 Count(s)
110

111
OVERVIEW OF PROPERTY-RELATED CRIME : TWO
YEAR COMPARISON

112
PROPERTY-RELATED CRIME : PROVINCIAL
OVERVIEW

113
PROPERTY-RELATED CRIME : TOP 30 STATIONS
Position Station ProvinceApril 2013 to March 2014
April 2014 to March 2015
April 2015 to March 2016
April 2016 to March 2017
April 2017 to March 2018
Case Diff % Change
1 Cape Town Central Western Cape 5097 4706 4635 4994 5083 89 1,8%
2 Honeydew Gauteng 4084 4342 3751 3655 3417 -238 -6,5%
3 Stellenbosch Western Cape 3686 3341 4432 3960 3376 -584 -14,7%
4 Witbank Mpumalanga 3659 3749 3514 3567 3317 -250 -7,0%
5 Park Road Free State 4726 4309 3312 2789 3133 344 12,3%
6 Rustenburg North West 3050 3101 3286 3229 2984 -245 -7,6%
7 Durban Central Kwazulu/Natal 2638 2454 2652 2874 2870 -4 -0,1%
8 Brooklyn Gauteng 2811 2838 2591 3146 2724 -422 -13,4%
9 Sunnyside Gauteng 2922 3248 2681 2668 2712 44 1,6%
10 Nelspruit Mpumalanga 2556 2661 2629 2558 2623 65 2,5%
11 Lyttelton Gauteng 2963 2708 2553 2525 2535 10 0,4%
12 Pinetown Kwazulu/Natal 2664 2625 2877 2924 2525 -399 -13,6%
13 Wierdabrug Gauteng 2990 2581 2543 2771 2467 -304 -11,0%
14 Mitchells Plain Western Cape 3852 3227 3109 2656 2438 -218 -8,2%
15 Umbilo Kwazulu/Natal 2390 2106 2010 2246 2342 96 4,3%
16 Jhb Central Gauteng 2151 2448 2435 2566 2310 -256 -10,0%
17 Midrand Gauteng 2179 2269 2206 2778 2279 -499 -18,0%
18 Roodepoort Gauteng 2965 2759 2373 2338 2276 -62 -2,7%
19 Kempton Park Gauteng 2361 2310 2445 2456 2267 -189 -7,7%
20 Middelburg Mpumalang Mpumalanga 2880 2643 2589 2276 2248 -28 -1,2%
21 Humewood Eastern Cape 2067 2102 1923 2225 2198 -27 -1,2%
22 Potchefstroom North West 1935 2123 2238 2330 2190 -140 -6,0%
23 Vanderbijlpark Gauteng 2018 1864 1960 2377 2161 -216 -9,1%
24 Bellville Western Cape 3651 3691 3070 2694 2159 -535 -19,9%
25 East London Eastern Cape 2133 1640 1653 1932 2110 178 9,2%
26 Vereeniging Gauteng 1865 2061 2232 2129 2108 -21 -1,0%
27 Mount Road Eastern Cape 2125 2306 2029 2229 2064 -165 -7,4%
28 Pretoria Central Gauteng 2307 2600 2129 2169 2054 -115 -5,3%
29 Springs Gauteng 2097 2089 2132 2097 2034 -63 -3,0%
30 Krugersdorp Gauteng 2608 2364 2217 2275 2015 -260 -11,4%

BURGLARY AT NON-RESIDENTIAL PREMISES:
TREND OVER 10-YEAR PERIOD
69 829
71 544
68 907 69 902
73 492
73 464
74 358 75 008
75 618
71 195
64 000
66 000
68 000
70 000
72 000
74 000
76 000
78 000
80 000
-5,8%
-4423 Count(s)
114

BURGLARY AT NON-RESIDENTIAL PREMESES: PROVINCIAL
OVERVIEW
NW GP KZN FS MP EC WC NC LP
2016/17 6 042 17 173 11 253 5 011 6 158 7 755 12 535 2 403 7 288
2017/18 5 563 16 220 10 756 4 963 5 980 7 446 11 379 2 172 6 716
Case Diff -479 -953 -497 -48 -178 -309 -1 156 -231 -572
% Change -7.9% -5.5% -4.4% -1.0% -2.9% -4.0% -9.2% -9.6% -7.8%
-
4 000
8 000
12 000
16 000
20 000
115
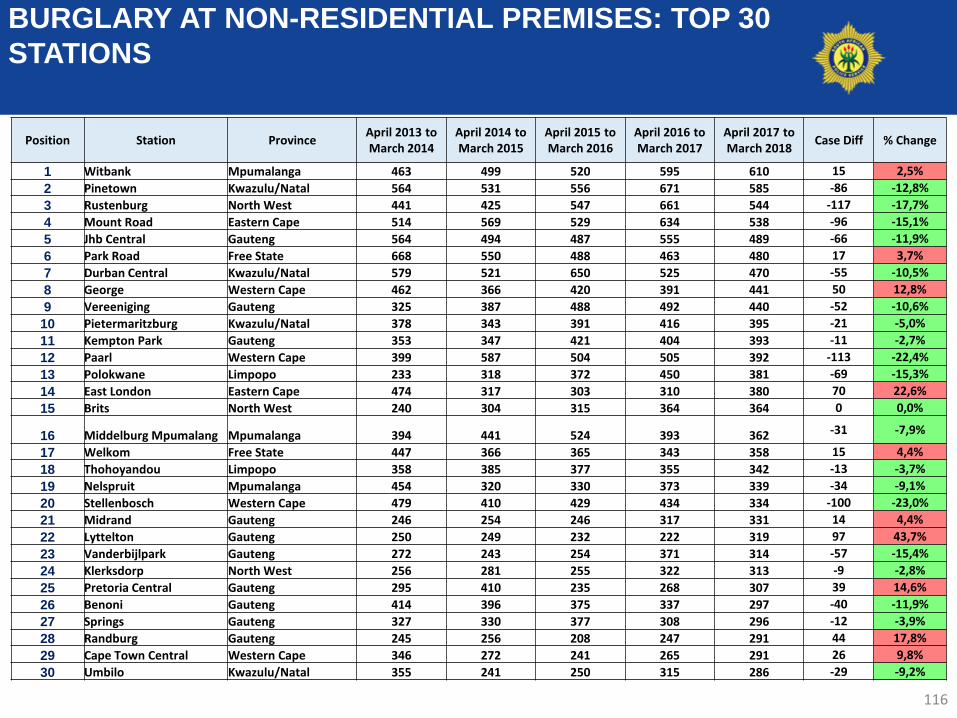
BURGLARY AT NON-RESIDENTIAL PREMISES: TOP 30
STATIONS
116
Position Station ProvinceApril 2013 to March 2014
April 2014 to March 2015
April 2015 to March 2016
April 2016 to March 2017
April 2017 to March 2018
Case Diff % Change
1 Witbank Mpumalanga 463 499 520 595 610 15 2,5%
2 Pinetown Kwazulu/Natal 564 531 556 671 585 -86 -12,8%
3 Rustenburg North West 441 425 547 661 544 -117 -17,7%
4 Mount Road Eastern Cape 514 569 529 634 538 -96 -15,1%
5 Jhb Central Gauteng 564 494 487 555 489 -66 -11,9%
6 Park Road Free State 668 550 488 463 480 17 3,7%
7 Durban Central Kwazulu/Natal 579 521 650 525 470 -55 -10,5%
8 George Western Cape 462 366 420 391 441 50 12,8%
9 Vereeniging Gauteng 325 387 488 492 440 -52 -10,6%
10 Pietermaritzburg Kwazulu/Natal 378 343 391 416 395 -21 -5,0%
11 Kempton Park Gauteng 353 347 421 404 393 -11 -2,7%
12 Paarl Western Cape 399 587 504 505 392 -113 -22,4%
13 Polokwane Limpopo 233 318 372 450 381 -69 -15,3%
14 East London Eastern Cape 474 317 303 310 380 70 22,6%
15 Brits North West 240 304 315 364 364 0 0,0%
16 Middelburg Mpumalang Mpumalanga 394 441 524 393 362 -31 -7,9%
17 Welkom Free State 447 366 365 343 358 15 4,4%
18 Thohoyandou Limpopo 358 385 377 355 342 -13 -3,7%
19 Nelspruit Mpumalanga 454 320 330 373 339 -34 -9,1%
20 Stellenbosch Western Cape 479 410 429 434 334 -100 -23,0%
21 Midrand Gauteng 246 254 246 317 331 14 4,4%
22 Lyttelton Gauteng 250 249 232 222 319 97 43,7%
23 Vanderbijlpark Gauteng 272 243 254 371 314 -57 -15,4%
24 Klerksdorp North West 256 281 255 322 313 -9 -2,8%
25 Pretoria Central Gauteng 295 410 235 268 307 39 14,6%
26 Benoni Gauteng 414 396 375 337 297 -40 -11,9%
27 Springs Gauteng 327 330 377 308 296 -12 -3,9%
28 Randburg Gauteng 245 256 208 247 291 44 17,8%
29 Cape Town Central Western Cape 346 272 241 265 291 26 9,8%
30 Umbilo Kwazulu/Natal 355 241 250 315 286 -29 -9,2%

BURGLARY AT RESIDENTIAL PREMISES: TREND
OVER 10-YEAR PERIOD
245 465
255 278
246 612
244 667
261 319 259 784
253 716 250 606
246 654
228 094
210 000
220 000
230 000
240 000
250 000
260 000
270 000
-7,5%
-18560 Count(s)
117
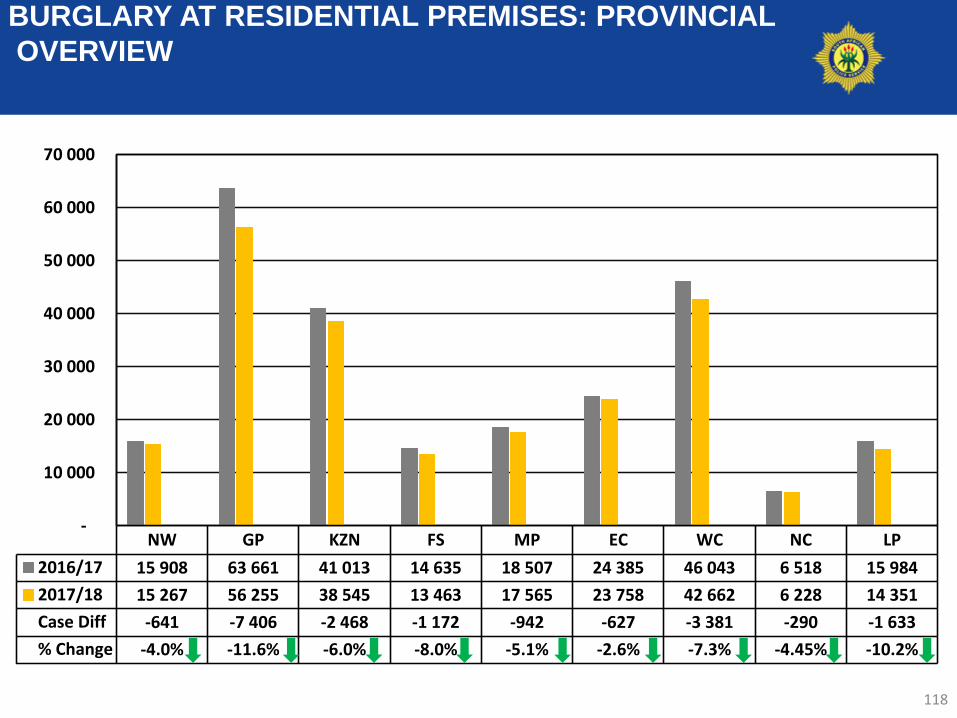
BURGLARY AT RESIDENTIAL PREMISES: PROVINCIAL
OVERVIEW
NW GP KZN FS MP EC WC NC LP
2016/17 15 908 63 661 41 013 14 635 18 507 24 385 46 043 6 518 15 984
2017/18 15 267 56 255 38 545 13 463 17 565 23 758 42 662 6 228 14 351
Case Diff -641 -7 406 -2 468 -1 172 -942 -627 -3 381 -290 -1 633
% Change -4.0% -11.6% -6.0% -8.0% -5.1% -2.6% -7.3% -4.45% -10.2%
-
10 000
20 000
30 000
40 000
50 000
60 000
70 000
118

BURGLARY AT RESIDENTIAL PREMISES:TOP 30 STATIONS
119
Position Station ProvinceApril 2013 to March 2014
April 2014 to March 2015
April 2015 to March 2016
April 2016 to March 2017
April 2017 to March 2018
Case Diff % Change
1 Witbank Mpumalanga 1546 1532 1551 1616 1460 -156 -9,7%
2 Park Road Free State 1890 1923 1397 1014 1288 274 27,0%
3 Honeydew Gauteng 1753 1815 1530 1340 1260 -80 -6,0%
4 Plessislaer Kwazulu/Natal 1148 1136 1402 1291 1226 -65 -5,0%
5 Rustenburg North West 1270 1243 1363 1175 1176 1 0,1%
6 Margate Kwazulu/Natal 1191 1468 1364 1107 1101 -6 -0,5%
7 Inanda Kwazulu/Natal 1126 1146 1242 1054 1094 40 3,8%
8 Kraaifontein Western Cape 1247 1096 1175 1122 1068 -54 -4,8%
9 Roodepoort Gauteng 1457 1302 1165 1110 1029 -81 -7,3%
10 Stellenbosch Western Cape 1137 917 1069 1093 1023 -70 -6,4%
11 Seshego Limpopo 921 968 1158 1124 1012 -112 -10,0%
12 Kagiso Gauteng 707 819 1034 1059 982 -77 -7,3%
13 Mitchells Plain Western Cape 1417 1177 1086 1037 980 -57 -5,5%
14 Vanderbijlpark Gauteng 917 862 1041 1103 944 -159 -14,4%
15 Alexandra Road Kwazulu/Natal 566 670 842 853 943 90 10,6%
16 Kuilsrivier Western Cape 1050 1024 915 933 941 8 0,9%
17 Springs Gauteng 954 1002 916 1034 919 -115 -11,1%
18 Vereeniging Gauteng 782 828 737 768 914 146 19,0%
19 Mankweng Limpopo 864 951 818 1004 914 -90 -9,0%
20 Wierdabrug Gauteng 1140 1030 1050 987 913 -74 -7,5%
21 Middelburg Mpumalang Mpumalanga 943 810 888 929 905 -24 -2,6%
22 Empangeni Kwazulu/Natal 1064 988 1223 924 883 -41 -4,4%
23 Akasia Gauteng 1220 1058 906 1092 877 -215 -19,7%
24 Hermanus Western Cape 527 657 724 916 869 -47 -5,1%
25 Norkempark Gauteng 970 1021 1047 1065 863 -202 -19,0%
26 Worcester Western Cape 1192 1220 1031 864 858 -6 -0,7%
27 Knysna Western Cape 1081 973 941 866 856 -10 -1,2%
28 Dobsonville Gauteng 826 822 908 888 847 -41 -4,6%
29 Temba Gauteng 1079 1089 1060 1016 843 -173 -17,0%
30 Nelspruit Mpumalanga 924 994 916 907 843 -64 -7,1%

THEFT OF MOTOR VEHICLE AND MOTORCYCLE:
TREND OVER 10-YEAR PERIOD
75 630
71 449
64 162
58 800 58 102 56 645 55 091 53 809 53 307
50 663
-
15 000
30 000
45 000
60 000
75 000
90 000
-5,0%
-2644 Count(s)
120

THEFT OF MOTORVEHICLE AND MOTORCYCLE: PROVINCIAL
OVERVIEW
NW GP KZN FS MP EC WC NC LP
2016/17 2 068 27 674 8 413 1 588 2 208 2 739 7 381 219 1 017
2017/18 2 112 25 705 8 240 1 596 2 206 2 443 7 104 233 1 024
Case Diff 44 -1 969 -173 8 -2 -296 -277 14 7
% Change 2.1% -7.1% -2.1% 0.5% -0.1% -10.8% -3.8% 6.4% 0.7%
-
5 000
10 000
15 000
20 000
25 000
30 000
121

THEFT OF MOTORVEHICLE AND MOTORCYCLE: TOP 30
STATIONS
122
Position Station ProvinceApril 2013 to March 2014
April 2014 to March 2015
April 2015 to March 2016
April 2016 to March 2017
April 2017 to March 2018
Case Diff % Change
1 Brooklyn Gauteng 724 597 529 748 793 45 6,0%
2 Durban Central Kwazulu/Natal 620 570 618 727 643 -84 -11,6%
3 Honeydew Gauteng 645 764 835 719 622 -97 -13,5%
4 Linden Gauteng 322 445 554 559 577 18 3,2%
5 Krugersdorp Gauteng 503 475 521 497 554 57 11,5%
6 Vanderbijlpark Gauteng 503 420 400 527 548 21 4,0%
7 Berea Kwazulu/Natal 719 672 729 763 515 -248 -32,5%
8 Lyttelton Gauteng 570 442 461 572 508 -64 -11,2%
9 Umbilo Kwazulu/Natal 458 411 419 366 497 131 35,8%
10 Sunnyside Gauteng 484 490 424 450 495 45 10,0%
11 Wierdabrug Gauteng 573 465 416 561 489 -72 -12,8%
12 Roodepoort Gauteng 697 718 574 518 486 -32 -6,2%
13 Jhb Central Gauteng 572 547 406 505 466 -39 -7,7%
14 Florida Gauteng 507 499 453 425 461 36 8,5%
15 Booysens Gauteng 709 608 574 572 455 -117 -20,5%
16 Parkview Gauteng 428 450 429 408 432 24 5,9%
17 Randfontein Gauteng 382 290 354 390 419 29 7,4%
18 Boksburg North Gauteng 550 516 521 495 416 -79 -16,0%
19 Garsfontein Gauteng 301 262 237 379 407 28 7,4%
20 Pretoria Central Gauteng 343 412 409 411 397 -14 -3,4%
21 Hillbrow Gauteng 336 328 434 371 390 19 5,1%
22 Sinoville Gauteng 282 244 323 367 390 23 6,3%
23 Vereeniging Gauteng 387 421 512 475 388 -87 -18,3%
24 Sandton Gauteng 344 353 340 355 368 13 3,7%
25 Springs Gauteng 478 350 333 312 362 50 16,0%
26 Chatsworth Kwazulu/Natal 405 321 417 472 354 -118 -25,0%
27 Durban North Kwazulu/Natal 297 152 252 264 352 88 33,3%
28 Alberton Gauteng 448 553 478 422 349 -73 -17,3%
29 Phoenix Kwazulu/Natal 322 384 438 323 341 18 5,6%
30 Villieria Gauteng 366 296 289 319 337 18 5,6%

THEFT OUT OF OR FROM MOTOR VEHICLE AND
MOTORCYCLE: TREND OVER 10-YEAR PERIOD
108 909
120 054 122 334
129 644
138 956
143 801 145 358
139 386 138 172
129 174
90 000
100 000
110 000
120 000
130 000
140 000
150 000
-6,5%
-8998 Count(s)
123

124
THEFT OUT OF OR FROM MOTOR VEHICLE AND
MOTORCYCLE: PROVINCIAL OVERVIEW

125
THEFT OUT OF OR FROM MOTOR VEHICLE AND
MOTORCYCLE:TOP 30 STATIONS
Position Station ProvinceApril 2013 to March 2014
April 2014 to March 2015
April 2015 to March 2016
April 2016 to March 2017
April 2017 to March 2018
Case Diff % Change
1 Cape Town Central Western Cape 3612 3441 3509 3770 3956 186 4,9%
2 Stellenbosch Western Cape 1852 1819 2747 2253 1840 -413 -18,3%
3 Sunnyside Gauteng 1624 1943 1614 1606 1780 174 10,8%
4 Durban Central Kwazulu/Natal 1245 1171 1223 1451 1613 162 11,2%
5 Humewood Eastern Cape 931 1012 1046 1245 1318 73 5,9%
6 Jhb Central Gauteng 952 1361 1471 1416 1280 -136 -9,6%
7 Nelspruit Mpumalanga 1069 1216 1271 1150 1276 126 11,0%
8 Honeydew Gauteng 1450 1495 1104 1269 1263 -6 -0,5%
9 Pretoria Central Gauteng 1501 1617 1376 1361 1258 -103 -7,6%
10 Park Road Free State 1753 1522 1127 1039 1140 101 9,7%
11 Bellville Western Cape 1465 1732 1487 1454 1121 -333 -22,9%
12 Hillbrow Gauteng 1140 1326 1222 1471 1101 -370 -25,2%
13 Sea Point Western Cape 1099 1118 1177 1164 1096 -68 -5,8%
14 Kempton Park Gauteng 684 711 979 1134 1073 -61 -5,4%
15 Brooklyn Gauteng 1183 1251 1063 1271 1057 -214 -16,8%
16 Mitchells Plain Western Cape 1699 1366 1315 1080 1049 -31 -2,9%
17 Paarl Western Cape 552 889 860 861 1049 188 21,8%
18 Lyttelton Gauteng 1088 1074 1076 1102 1045 -57 -5,2%
19 Umbilo Kwazulu/Natal 928 748 754 917 972 55 6,0%
20 Sandton Gauteng 1353 1480 1282 1586 957 -629 -39,7%
21 Woodstock Western Cape 1210 1106 1097 916 950 34 3,7%
22 Witbank Mpumalanga 1291 1333 1101 963 908 -55 -5,7%
23 Rustenburg North West 977 1105 1056 1077 905 -172 -16,0%
24 Midrand Gauteng 916 899 931 1375 903 -472 -34,3%
25 Wierdabrug Gauteng 1005 901 879 1041 895 -146 -14,0%
26 Mount Road Eastern Cape 962 958 864 889 889 0 0,0%
27 East London Eastern Cape 718 664 589 925 887 -38 -4,1%
28 Kimberley Northern Cape 1292 1015 980 1035 870 -165 -15,9%
29 Potchefstroom North West 577 770 772 944 860 -84 -8,9%
30 Pinetown Kwazulu/Natal 830 943 1053 1071 820 -251 -23,4%

STOCK-THEFT : TREND OVER 10-YEAR PERIOD
27 255
29 428
26 942
27 611
26 465
24 534 24 965
24 715
26 902
28 849
22 000
23 000
24 000
25 000
26 000
27 000
28 000
29 000
30 0007,2%
1947 Count(s)
126

127
STOCK-THEFT : PROVINCIAL OVERVIEW

128
STOCK-THEFT : TOP 30 STATIONS
Position Station ProvinceApril 2013 to March 2014
April 2014 to March 2015
April 2015 to March 2016
April 2016 to March 2017
April 2017 to March 2018
Case Diff % Change
1 Mthatha Eastern Cape 175 186 195 179 274 95 53,1%
2 Maluti Eastern Cape 212 240 191 183 258 75 41,0%
3 Sulenkama Eastern Cape 174 227 271 231 248 17 7,4%
4 Qumbu Eastern Cape 179 191 206 205 227 22 10,7%
5 Harrismith Free State 143 112 126 175 196 21 12,0%
6 Mount Frere Eastern Cape 135 135 186 140 183 43 30,7%
7 Bityi Eastern Cape 108 109 161 214 179 -35 -16,4%
8 Utrecht Kwazulu/Natal 119 150 162 141 174 33 23,4%
9 Amersfoort Mpumalanga 132 120 111 136 173 37 27,2%
10 Selosesha Free State 81 99 79 141 172 31 22,0%
11 Bergville Kwazulu/Natal 160 130 134 158 168 10 6,3%
12 Taylors Halt Kwazulu/Natal 55 86 100 142 163 21 14,8%
13 Mogwase North West 63 83 89 113 157 44 38,9%
14 Dirkiesdorp Mpumalanga 79 109 126 141 156 15 10,6%
15 Piet Retief Mpumalanga 86 76 117 155 156 1 0,6%
16 Dalasile Eastern Cape 90 72 116 97 147 50 51,5%
17 Ladysmith Kwazulu/Natal 161 143 117 145 146 1 0,7%
18 Kwamhlanga Mpumalanga 70 68 59 160 142 -18 -11,3%
19 Elandslaagte Kwazulu/Natal 98 84 97 112 141 29 25,9%
20 Estcourt Kwazulu/Natal 104 128 114 116 141 25 21,6%
21 Taung North West 106 131 89 115 141 26 22,6%
22 Nongoma Kwazulu/Natal 100 56 67 116 140 24 20,7%
23 Ventersdorp North West 107 90 141 143 139 -4 -2,8%
24 Vryheid Kwazulu/Natal 131 122 86 103 138 35 34,0%
25 Stutterheim Eastern Cape 74 101 107 100 132 32 32,0%
26 Ezakheni Kwazulu/Natal 104 119 139 133 132 -1 -0,8%
27 Upper Tugela Kwazulu/Natal 75 86 90 90 129 39 43,3%
28 Tsolo Eastern Cape 130 121 120 94 128 34 36,2%
29 Ematsheni Kwazulu/Natal 73 59 76 109 128 19 17,4%
30 Impendle Kwazulu/Natal 71 92 126 98 128 30 30,6%

11
OTHER SERIOUS CRIMEInclude all Serious Crimes not mentioned in the above categories
• All Theft not mentioned elsewhere
• Commercial Crime
• Shoplifting
130
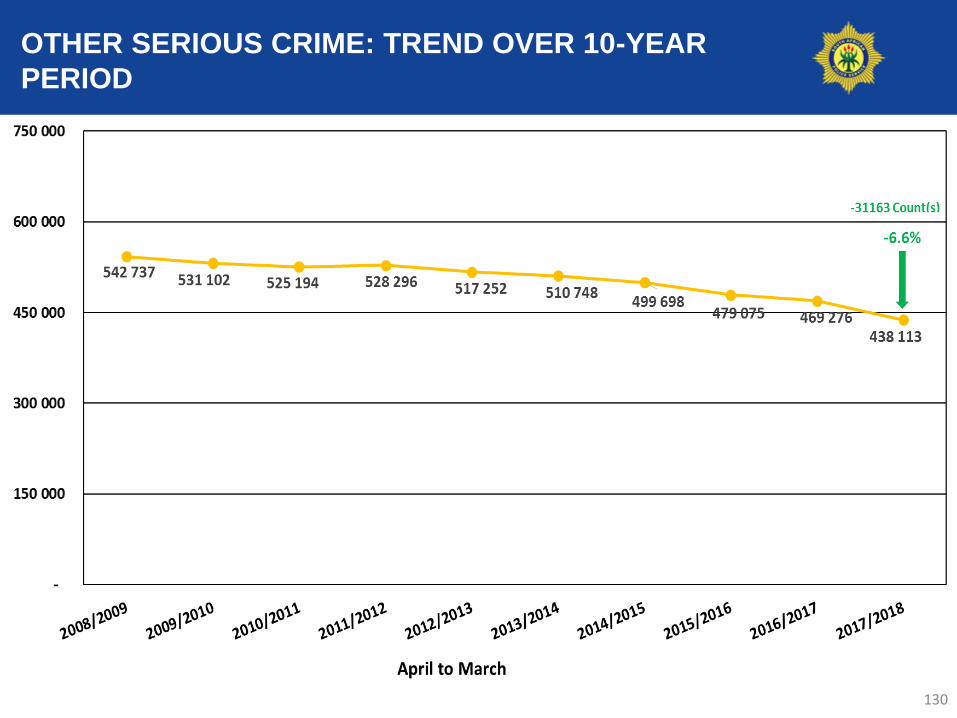
OTHER SERIOUS CRIME: TREND OVER 10-YEAR
PERIOD

131
OTHER SERIOUS CRIME : TWO YEAR COMPARISON

132
OTHER SERIOUS CRIME: PROVINCIALOVERVIEW

ALL THEFT NOT MENTIONED ELSEWHERE : TREND
OVER 10-YEAR PERIOD
386 858
360 120
361 222
370 916
356 847
363 517
360 541
340 372
328 272
302 656
250 000
276 000
302 000
328 000
354 000
380 000
406 000
-7,8%
-25616 Count(s)
133

ALL THEFT NOT MENTIONED ELSEWHERE : PROVINCIAL
OVERVIEW
NW GP KZN FS MP EC WC NC LP
2016/17 15 677 97 633 42 577 15 623 18 457 24 486 85 957 7 104 20 758
2017/18 14 268 90 739 39 615 13 604 17 024 23 174 79 975 6 871 17 386
Case Diff -1 409 -6 894 -2 962 -2 019 -1 433 -1 312 -5 982 -233 -3 372
% Change -9.0% -7.1% -7.0% -12.9% -7.8% -5.4% -7.0% -3.28% -16.2%
-
20 000
40 000
60 000
80 000
100 000
120 000
134

COMMERCIAL CRIME : TREND OVER 10-YEAR
PERIOD
75 166
82 414
85 646 85 570
89 138
76 744
67 830
69 917
73 550 73 277
60 000
65 000
70 000
75 000
80 000
85 000
90 000
95 000
-0,4%-273 Count(s)
135

COMMERCIAL CRIME : PROVINCIAL OVERVIEW
NW GP KZN FS MP EC WC NC LP
2016/17 3 914 24 147 12 405 4 511 5 149 6 567 11 725 1 108 4 024
2017/18 3 744 24 912 12 308 3 756 5 178 6 437 12 109 1 097 3 736
Case Diff -170 765 -97 -755 29 -130 384 -11 -288
% Change -4.3% 3.2% -0.8% -16.7% 0.6% -2.0% 3.3% -0.99% -7.2%
-
5 000
10 000
15 000
20 000
25 000
30 000
136
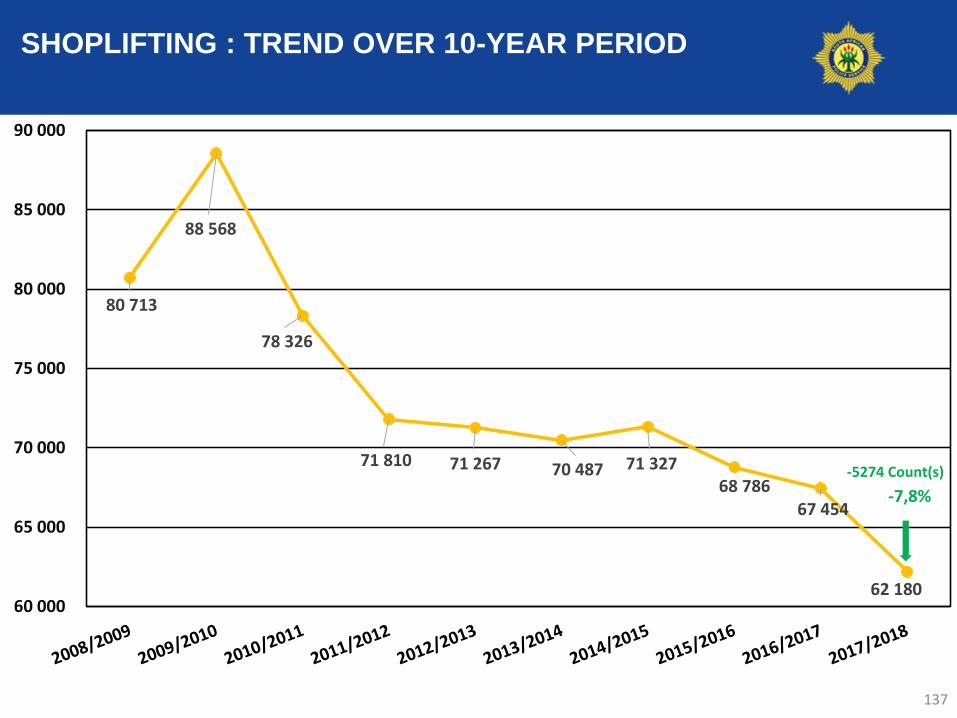
SHOPLIFTING : TREND OVER 10-YEAR PERIOD
80 713
88 568
78 326
71 810 71 267 70 487 71 327 68 786
67 454
62 180 60 000
65 000
70 000
75 000
80 000
85 000
90 000
-7,8%
-5274 Count(s)
137

SHOPLIFTING : PROVINCIAL OVERVIEW
NW GP KZN FS MP EC WC NC LP
2016/17 2 176 21 194 12 302 3 214 3 454 5 408 14 557 1 407 3 742
2017/18 2 008 19 436 11 620 2 875 3 290 4 645 13 738 1 309 3 259
Case Diff -168 -1 758 -682 -339 -164 -763 -819 -98 -483
% Change -7.7% -8.3% -5.5% -10.5% -4.7% -14.1% -5.6% -6.97% -12.9%
-
5 000
10 000
15 000
20 000
25 000
138

11
CORE BUSINESS DIVERSION
Public Order incidents

140
PUBLIC ORDER INCIDENTS: FINANCIAL YEAR
COMPARISON

141
PUBLIC ORDER INCIDENTS: UNREST AND PEACEFUL: FINANCIAL
YEAR COMPARISON

142
PUBLIC ORDER INCIDENTS: UNREST AND PEACEFUL:
PROVINCIAL OVERVIEW

143
UNREST : PARTICIPANTA INJURED: PROVINCIAL OVERVIEW

144
UNREST : LAW ENFORCEMENT OFFICERS INJURED: PROVINCIAL
OVERVIEW

11
CRIME DETECTED AS A RESULT
OF POLICE ACTION Crime detected as a result of police action is usually not reported to the police largely
deployment of law enforcement personnel and employment of intelligence. The crime is
usually recorded after the apprehension of suspects in connection with the illegal
possession of firearms and ammunition, drug-related crimes, driving under the influence
of alcohol and/or drugs and sexual offences detected as a result of police action.

146
CRIME DETECTED AS A RESULT OF POLICE
ACTION: TREND OVER 10-YEAR PERIOD

147
CRIME DETECTED AS A RESULT OF POLICE ACTION :
TWO YEAR COMPARISON

148
CRIME DETECTED AS A RESULT OF POLICE ACTION:
PROVINCIAL OVERVIEW

149
ILLEGAL POSITION OF FIRE-ARM AND
AMMUNITION: TREND OVER 10-YEAR PERIOD
13 918 14 430 14 385 14 37214 813 15 362 15 116
14 772
16 134
17 558
0
2 000
4 000
6 000
8 000
10 000
12 000
14 000
16 000
18 000
20 000
April to March
8,8%1 424
Counts

150
ILLEGAL POSITION OF FIREARM AND AMMUNITION:
PROVINCIAL OVERVIEW

151
DRUG-RELATED CRIME: TREND OVER 10-YEAR
PERIOD

152
DRUG-RELATED CRIME: PROVINCIAL OVERVIEW
153
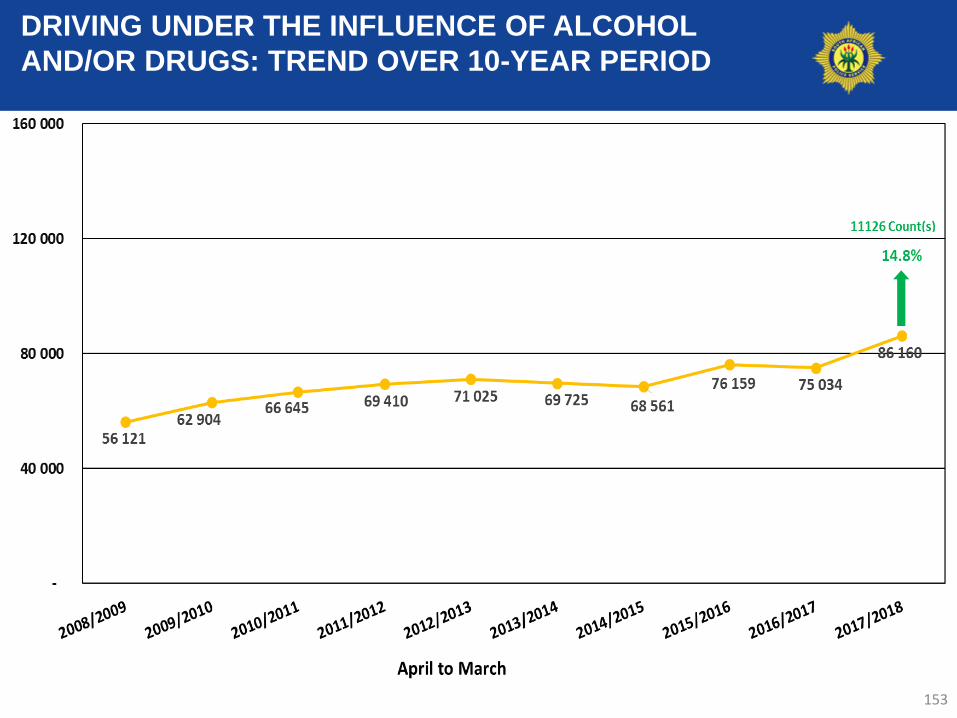
DRIVING UNDER THE INFLUENCE OF ALCOHOL
AND/OR DRUGS: TREND OVER 10-YEAR PERIOD

154
DRIVING UNDER THE INFLUENCE OF ALCOHOL AND/OR
DRUGS: PROVINCIAL OVERVIEW

155
SEXUAL OFFENCES DETECTED AS A RESULT OF
POLICE ACTION: TREND OVER 10-YEAR PERIOD

156
SEXUAL OFFENCES DETECTED AS A RESULT OF POLICE
ACTION: PROVINCIAL OVERVIEW

11
TABLES PER PROVINCE
Republic of South Africa consist of Nine Provinces:
Eastern Cape
Free State
Gauteng
KwaZulu/Natal
Limpopo
Mpumalanga
North West
Northern Cape
Western Cape

EASTERN CAPENational Overview – April to March 2017/18
158
CRIME CATEGORY 2008/2009 2009/2010 2010/2011 2011/2012 2012/2013 2013/2014 2014/2015 2015/2016 2016/2017 2017/2018 Case Diff % Change
Murder 3 253 3 212 3 179 3 269 3 335 3 441 3 321 3 649 3 628 3 815 187 5.2%
Sexual Offences 9 302 8 900 9 211 9 001 9 288 9 616 9 224 8 797 8 050 8 094 44 0.5%
Attempted murder 1 985 1 927 1 701 1 721 1 755 1 853 1 832 2 052 2 110 2 232 122 5.8%
Assault with the intent to inflict grievous bodily harm 31 234 32 081 30 671 29 275 27 788 27 361 25 431 24 818 23 241 23 133 -108 -0.5%
Common assault 16 724 17 134 16 391 15 159 14 168 13 330 11 848 11 475 11 100 11 171 71 0.6%
Common robbery 5 911 5 347 5 518 4 878 4 565 3 988 3 753 3 690 3 707 3 463 -244 -6.6%
Robbery with aggravating circumstances 9 766 9 636 10 406 12 476 11 751 13 443 13 245 12 777 13 688 13 485 -203 -1.5%
Total Contact Crimes ( Crimes Against The Person) 78 175 78 237 77 077 75 779 72 650 73 032 68 654 67 258 65 524 65 393 -131 -0.2%
Murder 50.2 49.6 49.1 50.5 51.5 53.1 51.2 56.3 55.9 58.5 2.6
Attempted murder 30.6 29.7 26.3 26.6 27.1 28.6 28.3 31.6 32.5 34.2 1.7
Assault with the intent to inflict grievous bodily harm 482.0 495.2 473.6 452.1 429.1 422.4 392.4 382.6 357.9 354.7 -3.3
Common assault 258.1 264.5 253.1 234.1 218.8 205.8 182.8 176.9 170.9 171.3 0.3
Common robbery 91.2 82.5 85.2 75.3 70.5 61.6 57.9 56.9 57.1 53.1 -4.0
Rape 6 610 6 854 7 276 7 301 7 701 8 212 7 934 7 437 6 836 6 821 -15 -0.2%
Sexual Assault 615 574 645 682 741 692 636 747 753 805 52 6.9%
Attempted Sexual Offences 713 745 786 688 603 509 440 430 301 318 17 5.6%
Contact Sexual Offences 1 364 727 504 330 243 203 214 183 160 150 -10 -6.3%
Total Sexual Offences 9 302 8 900 9 211 9 001 9 288 9 616 9 224 8 797 8 050 8 094 44 0.5%
CONTACT CRIMES ( CRIMES AGAINST THE PERSON)
Total Sexual Offences
RATIO: CONTACT CRIMES ( CRIMES AGAINST THE PERSON)

EASTERN CAPENational Overview – April to March 2017/18
159
CRIME CATEGORY 2008/2009 2009/2010 2010/2011 2011/2012 2012/2013 2013/2014 2014/2015 2015/2016 2016/2017 2017/2018 Case Diff % Change
Rape 102.0 105.8 112.3 112.8 118.9 126.8 122.4 114.7 105.3 104.6 -0.7
Sexual Assault 9.5 8.9 10.0 10.5 11.4 10.7 9.8 11.5 11.6 12.3 0.7
Attempted Sexual Offences 11.0 11.5 12.1 10.6 9.3 7.9 6.8 6.6 4.6 4.9 0.2
Contact Sexual Offences 21.0 11.2 7.8 5.1 3.8 3.1 3.3 2.8 2.5 2.3 -0.2
Total Sexual Offences 143.5 137.4 142.2 139.0 143.4 148.5 142.3 135.6 124.0 124.1 0.1
Carjacking 698 596 520 636 694 773 769 956 955 999 44 4.6%
Robbery at residential premises 1 517 1 606 1 556 1 747 1 726 1 924 1 811 2 054 2 171 2 184 13 0.6%
Robbery at non-residential premises 849 1 267 1 654 2 167 1 940 2 441 2 474 2 218 2 369 2 395 26 1.1%
Robbery of cash in transit 56 69 51 12 16 8 10 19 11 23 12 109.1%Bank robbery 3 4 1 6 1 5 0 0 1 0 -1 -100.0%
Truck hijacking 30 57 27 29 15 31 34 54 82 92 10 12.2%
Arson 1 018 1 084 1 068 980 968 1 061 785 679 748 605 -143 -19.1%
Malicious damage to property 13 372 12 980 13 229 12 707 12 546 12 674 12 399 11 819 12 062 11 422 -640 -5.3%
Total Contact-Related Crimes 14 390 14 064 14 297 13 687 13 514 13 735 13 184 12 498 12 810 12 027 -783 -6.1%
Burglary at non-residential premises 6 171 6 401 6 497 6 487 7 528 7 642 7 810 7 470 7 755 7 446 -309 -4.0%
Burglary at residential premises 28 380 28 233 27 086 26 825 25 782 24 643 24 329 23 901 24 385 23 758 -627 -2.6%
Theft of motor vehicle and motorcycle 4 301 4 231 3 943 3 848 3 676 3 376 3 276 2 678 2 739 2 443 -296 -10.8%
Theft out of or from motor vehicle 9 655 10 248 11 056 11 743 11 968 11 771 12 034 11 225 12 195 11 649 -546 -4.5%
Stock-theft 6 331 7 104 6 854 6 839 6 530 5 808 6 087 5 809 6 023 6 217 194 3.2%
Total Property-Related Crimes 54 838 56 217 55 436 55 742 55 484 53 240 53 536 51 083 53 097 51 513 -1 584 -3.0%
SOME SUBCATEGORIES OF AGGRAVATED ROBBERY
CONTACT-RELATED CRIMES
PROPERTY-RELATED CRIMES
RATIO: Total Sexual Offences

EASTERN CAPENational Overview – April to March 2017/18
160
CRIME CATEGORY 2008/2009 2009/2010 2010/2011 2011/2012 2012/2013 2013/2014 2014/2015 2015/2016 2016/2017 2017/2018 Case Diff % Change
All theft not mentioned elsewhere 32 902 28 289 30 077 28 931 26 198 27 699 25 597 23 429 24 486 23 174 -1 312 -5.4%
Commercial crime 6 438 7 514 7 972 8 360 8 616 6 766 5 546 6 155 6 567 6 437 -130 -2.0%
Shoplifting 7 924 7 987 7 091 6 399 6 172 6 260 6 045 5 654 5 408 4 645 -763 -14.1%
Total Other Serious Crimes 47 264 43 790 45 140 43 690 40 986 40 725 37 188 35 238 36 461 34 256 -2 205 -6.0%
Total 17 Community Reported Serious Crimes 194 667 192 308 191 950 188 898 182 634 180 732 172 562 166 077 167 892 163 189 -4 703 -2.8%
Illegal possession of firearms and ammunition 1 510 1 419 1 462 1 455 1 530 1 834 1 719 1 773 2 045 2 142 97 4.7%
Drug-related crime 8 419 8 926 9 557 11 643 12 871 15 032 16 038 16 129 17 710 18 936 1 226 6.9%
Driving under the influence of alcohol or drugs 8 917 10 985 8 236 7 771 7 603 7 349 6 946 6 547 6 090 5 648 -442 -7.3%
Sexual Offences detected as a result of police action 0 0 0 101 96 119 219 262 337 275 -62 -18.4%
Total Crime Detected As A Result Of Police Action 18 846 21 330 19 255 20 970 22 100 24 334 24 922 24 711 26 182 27 001 819 3.1%
CRIME DETECTED AS A RESULT OF POLICE ACTION
OTHER SERIOUS CRIMES

FREE STATENational Overview – April to March 2017/18
161
CRIME CATEGORY 2008/2009 2009/2010 2010/2011 2011/2012 2012/2013 2013/2014 2014/2015 2015/2016 2016/2017 2017/2018 Case Diff % Change
Murder 901 900 958 954 1 019 942 943 993 950 1 054 104 10.9%
Sexual Offences 4 418 4 521 4 737 4 785 5 098 4 584 4 094 3 928 3 488 3 284 -204 -5.8%
Attempted murder 905 836 766 855 938 906 816 787 694 617 -77 -11.1%
Assault with the intent to inflict grievous bodily harm 15 756 15 609 15 333 14 955 15 317 14 465 13 458 13 116 11 702 10 842 -860 -7.3%
Common assault 19 398 18 833 17 757 17 944 17 623 17 064 15 243 15 194 13 568 12 701 -867 -6.4%
Common robbery 3 524 2 942 2 781 2 670 2 694 2 637 2 521 2 304 2 192 2 195 3 0.1%
Robbery with aggravating circumstances 5 139 4 943 4 828 5 323 5 791 5 347 5 239 4 778 5 147 5 032 -115 -2.2%
Total Contact Crimes ( Crimes Against The Person) 50 041 48 584 47 160 47 486 48 480 45 945 42 314 41 100 37 741 35 725 -2 016 -5.3%
Murder 33.3 33.1 35.0 34.7 36.8 33.8 33.6 35.1 33.3 35.7 2.3
Attempted murder 33.4 30.7 28.0 31.1 33.9 32.5 29.1 27.8 24.4 20.9 -3.5
Assault with the intent to inflict grievous bodily harm 582.1 573.7 560.5 543.5 553.2 519.0 479.5 463.9 410.7 367.0 -43.7
Common assault 716.6 692.2 649.1 652.1 636.5 612.3 543.1 537.4 476.2 429.9 -46.3
Common robbery 130.2 108.1 101.7 97.0 97.3 94.6 89.8 81.5 76.9 74.3 -2.6
Rape 3 212 3 298 3 530 3 622 4 022 3 629 3 290 3 059 2 702 2 573 -129 -4.8%
Sexual Assault 503 500 616 649 587 553 441 484 474 435 -39 -8.2%
Attempted Sexual Offences 305 303 257 303 277 226 208 232 154 153 -1 -0.6%
Contact Sexual Offences 398 420 334 211 212 176 155 153 158 123 -35 -22.2%
Total Sexual Offences 4 418 4 521 4 737 4 785 5 098 4 584 4 094 3 928 3 488 3 284 -204 -5.8%
CONTACT CRIMES ( CRIMES AGAINST THE PERSON)
Total Sexual Offences
RATIO: CONTACT CRIMES ( CRIMES AGAINST THE PERSON)

FREE STATENational Overview – April to March 2017/18
162
CRIME CATEGORY 2008/2009 2009/2010 2010/2011 2011/2012 2012/2013 2013/2014 2014/2015 2015/2016 2016/2017 2017/2018 Case Diff % Change
Rape 118.7 121.2 129.0 131.6 145.3 130.2 117.2 108.2 94.8 87.1 -7.7
Sexual Assault 18.6 18.4 22.5 23.6 21.2 19.8 15.7 17.1 16.6 14.7 -1.9
Attempted Sexual Offences 11.3 11.1 9.4 11.0 10.0 8.1 7.4 8.2 5.4 5.2 -0.2
Contact Sexual Offences 14.7 15.4 12.2 7.7 7.7 6.3 5.5 5.4 5.5 4.2 -1.4
Total Sexual Offences 163.2 166.2 173.2 173.9 184.1 164.5 145.9 138.9 122.4 111.2 -11.3
Carjacking 252 311 227 281 279 255 270 258 234 235 1 0.4%
Robbery at residential premises 490 535 637 662 835 753 718 773 875 864 -11 -1.3%
Robbery at non-residential premises 780 872 1 021 1 103 1 146 989 852 756 973 886 -87 -8.9%
Robbery of cash in transit 17 17 18 12 8 4 9 5 12 18 6 50.0%Bank robbery 10 8 2 2 0 3 2 0 0 2 2 2 Cases Higher
Truck hijacking 93 67 27 54 82 71 89 65 41 32 -9 -22.0%
Arson 347 356 347 404 377 344 287 265 186 164 -22 -11.8%
Malicious damage to property 9 559 8 926 8 585 8 730 8 770 8 080 7 655 7 551 6 652 6 068 -584 -8.8%
Total Contact-Related Crimes 9 906 9 282 8 932 9 134 9 147 8 424 7 942 7 816 6 838 6 232 -606 -8.9%
Burglary at non-residential premises 5 493 5 167 5 090 5 174 5 646 5 186 4 875 5 210 5 011 4 963 -48 -1.0%
Burglary at residential premises 16 040 15 682 14 828 15 101 17 284 16 314 15 618 15 323 14 635 13 463 -1 172 -8.0%
Theft of motor vehicle and motorcycle 2 614 2 401 2 188 1 996 2 013 2 022 1 743 1 745 1 588 1 596 8 0.5%
Theft out of or from motor vehicle 5 168 4 818 4 371 5 014 5 620 5 661 5 399 4 878 4 822 4 599 -223 -4.6%
Stock-theft 4 499 4 591 4 170 4 487 4 175 4 051 3 527 3 466 3 677 4 032 355 9.7%
Total Property-Related Crimes 33 814 32 659 30 647 31 772 34 738 33 234 31 162 30 622 29 733 28 653 -1 080 -3.6%
SOME SUBCATEGORIES OF AGGRAVATED ROBBERY
CONTACT-RELATED CRIMES
PROPERTY-RELATED CRIMES
RATIO: Total Sexual Offences

FREE STATENational Overview – April to March 2017/18
163
All theft not mentioned elsewhere 23 908 21 206 19 467 19 243 19 144 18 522 17 180 16 341 15 623 13 604 -2 019 -12.9%
Commercial crime 3 081 3 331 4 482 7 301 6 299 4 329 3 806 3 986 4 511 3 756 -755 -16.7%
Shoplifting 3 452 3 584 3 280 2 985 3 293 3 191 3 148 3 175 3 214 2 875 -339 -10.5%
Total Other Serious Crimes 30 441 28 121 27 229 29 529 28 736 26 042 24 134 23 502 23 348 20 235 -3 113 -13.3%
Total 17 Community Reported Serious Crimes 124 202 118 646 113 968 117 921 121 101 113 645 105 552 103 040 97 660 90 845 -6 815 -7.0%
Illegal possession of firearms and ammunition 320 326 331 328 431 479 442 469 527 570 43 8.2%
Drug-related crime 4 537 5 081 4 189 4 455 6 153 8 189 8 776 9 623 11 314 12 176 862 7.6%
Driving under the influence of alcohol or drugs 1 642 1 651 1 577 1 518 1 671 1 767 1 976 2 448 2 828 2 824 -4 -0.1%
Sexual Offences detected as a result of police action 0 0 0 55 79 135 193 251 346 441 95 27.5%
Total Crime Detected As A Result Of Police Action 6 499 7 058 6 097 6 356 8 334 10 570 11 387 12 791 15 015 16 011 996 6.6%
CRIME DETECTED AS A RESULT OF POLICE ACTION
OTHER SERIOUS CRIMES

GAUTENGNational Overview – April to March 2017/18
164
CRIME CATEGORY 2008/2009 2009/2010 2010/2011 2011/2012 2012/2013 2013/2014 2014/2015 2015/2016 2016/2017 2017/2018 Case Diff % Change
Murder 3 946 3 429 3 246 2 995 2 988 3 325 3 671 3 842 4 101 4 233 132 3.2%
Sexual Offences 17 770 15 267 13 664 11 512 11 113 10 264 9 902 9 510 9 566 10 116 550 5.7%
Attempted murder 5 149 4 728 4 041 3 432 3 571 3 866 4 202 4 574 4 872 4 462 -410 -8.4%
Assault with the intent to inflict grievous bodily harm 47 604 48 373 46 072 42 939 40 430 41 182 41 830 42 790 39 684 39 552 -132 -0.3%
Common assault 57 437 57 638 53 547 48 437 44 387 44 159 42 918 44 255 42 083 43 587 1 504 3.6%
Common robbery 20 410 19 842 18 007 15 826 15 404 15 579 17 379 18 051 17 367 16 984 -383 -2.2%
Robbery with aggravating circumstances 51 055 47 014 39 873 35 148 35 717 42 506 47 362 49 792 53 793 51 706 -2 087 -3.9%
Total Contact Crimes ( Crimes Against The Person) 203 371 196 291 178 450 160 289 153 610 160 881 167 264 172 814 171 466 170 640 -826 -0.5%
Murder 34.6 29.3 27.1 24.4 23.7 25.7 27.6 28.2 29.3 28.8 -0.5
Attempted murder 45.2 40.5 33.7 27.9 28.3 29.9 31.6 33.5 34.8 30.3 -4.5
Assault with the intent to inflict grievous bodily harm 417.8 414.0 384.3 349.1 320.3 318.0 314.7 313.7 283.5 268.8 -14.7
Common assault 504.1 493.2 446.7 393.8 351.7 341.0 322.9 324.5 300.6 296.2 -4.4
Common robbery 179.1 169.8 150.2 128.7 122.1 120.3 130.8 132.4 124.1 115.4 -8.7
Rape 10 496 10 450 9 952 8 970 8 714 8 141 7 916 7 605 7 700 8 062 362 4.7%
Sexual Assault 1 204 1 040 1 261 1 247 1 374 1 249 1 228 1 214 1 277 1 511 234 18.3%
Attempted Sexual Offences 844 729 653 594 527 429 431 353 286 314 28 9.8%
Contact Sexual Offences 5 226 3 048 1 798 701 498 445 327 338 303 229 -74 -24.4%
Total Sexual Offences 17 770 15 267 13 664 11 512 11 113 10 264 9 902 9 510 9 566 10 116 550 5.7%
CONTACT CRIMES ( CRIMES AGAINST THE PERSON)
Total Sexual Offences
RATIO: CONTACT CRIMES ( CRIMES AGAINST THE PERSON)

GAUTENGNational Overview – April to March 2017/18
165
Rape 92.1 89.4 83.0 72.9 69.0 62.9 59.6 55.8 55.0 54.8 -0.2
Sexual Assault 10.6 8.9 10.5 10.1 10.9 9.6 9.2 8.9 9.1 10.3 1.1
Attempted Sexual Offences 7.4 6.2 5.4 4.8 4.2 3.3 3.2 2.6 2.0 2.1 0.1
Contact Sexual Offences 45.9 26.1 15.0 5.7 3.9 3.4 2.5 2.5 2.2 1.6 -0.6
Total Sexual Offences 156.0 130.6 114.0 93.6 88.1 79.3 74.5 69.7 68.3 68.7 0.4
Carjacking 7 644 7 427 5 910 4 983 4 934 6 056 6 867 7 367 8 610 8 269 -341 -4.0%
Robbery at residential premises 8 190 8 051 7 039 6 336 6 607 7 438 8 174 7 896 8 731 8 333 -398 -4.6%
Robbery at non-residential premises 6 231 6 370 5 544 5 102 5 002 6 014 6 329 6 910 7 187 6 679 -508 -7.1%
Robbery of cash in transit 126 117 122 83 50 60 39 32 33 80 47 142.4%Bank robbery 52 62 25 21 1 11 9 2 1 6 5 500.0%
Truck hijacking 906 860 600 443 524 547 804 695 668 708 40 6.0%
Arson 1 616 1 459 1 491 1 378 1 166 1 172 1 042 992 724 495 -229 -31.6%
Malicious damage to property 42 432 42 849 39 814 36 418 35 033 34 585 34 805 34 320 33 299 31 961 -1 338 -4.0%
Total Contact-Related Crimes 44 048 44 308 41 305 37 796 36 199 35 757 35 847 35 312 34 023 32 456 -1 567 -4.6%
Burglary at non-residential premises 17 520 17 822 16 704 15 985 15 544 16 452 16 983 16 412 17 173 16 220 -953 -5.5%
Burglary at residential premises 68 961 74 429 70 447 64 475 68 296 67 988 66 172 64 968 63 661 56 255 -7 406 -11.6%
Theft of motor vehicle and motorcycle 38 803 36 220 32 182 27 851 27 483 27 436 27 147 26 646 27 674 25 705 -1 969 -7.1%
Theft out of or from motor vehicle 35 653 38 683 37 038 38 774 41 738 42 528 44 809 42 111 45 266 41 298 -3 968 -8.8%
Stock-theft 770 829 670 605 698 784 801 818 987 998 11 1.1%
Total Property-Related Crimes 161 707 167 983 157 041 147 690 153 759 155 188 155 912 150 955 154 761 140 476 -14 285 -9.2%
SOME SUBCATEGORIES OF AGGRAVATED ROBBERY
CONTACT-RELATED CRIMES
PROPERTY-RELATED CRIMES
RATIO: Total Sexual Offences

GAUTENGNational Overview – April to March 2017/18
166
All theft not mentioned elsewhere 120 686 114 196 113 465 111 672 107 285 110 545 109 422 102 599 97 633 90 739 -6 894 -7.1%
Commercial crime 29 884 33 049 33 598 30 079 29 710 26 639 23 836 23 680 24 147 24 912 765 3.2%
Shoplifting 24 814 27 741 24 747 22 412 22 307 22 201 22 562 22 157 21 194 19 436 -1 758 -8.3%
Total Other Serious Crimes 175 384 174 986 171 810 164 163 159 302 159 385 155 820 148 436 142 974 135 087 -7 887 -5.5%
Total 17 Community Reported Serious Crimes 584 510 583 568 548 606 509 938 502 870 511 211 514 843 507 517 503 224 478 659 -24 565 -4.9%
Illegal possession of firearms and ammunition 3 967 4 052 3 619 3 886 3 697 3 667 3 740 3 600 4 126 4 505 379 9.2%
Drug-related crime 13 459 14 696 16 432 25 923 38 131 74 667 70 264 55 442 62 837 69 285 6 448 10.3%
Driving under the influence of alcohol or drugs 13 140 14 899 21 402 20 754 21 770 26 085 25 794 32 287 27 834 33 173 5 339 19.2%
Sexual Offences detected as a result of police action 0 0 0 522 739 439 469 470 606 651 45 7.4%
Total Crime Detected As A Result Of Police Action 30 566 33 647 41 453 51 085 64 337 104 858 100 267 91 799 95 403 107 614 12 211 12.8%
CRIME DETECTED AS A RESULT OF POLICE ACTION
OTHER SERIOUS CRIMES

KWAZULU/NATALNational Overview – April to March 2017/18
167
CRIME CATEGORY 2008/2009 2009/2010 2010/2011 2011/2012 2012/2013 2013/2014 2014/2015 2015/2016 2016/2017 2017/2018 Case Diff % Change
Murder 4 737 4 214 3 740 3 418 3 623 3 616 3 810 3 929 4 014 4 382 368 9.2%
Sexual Offences 13 058 12 980 12 480 11 034 10 964 9 889 9 079 8 947 8 484 8 759 275 3.2%
Attempted murder 4 882 4 591 3 894 3 643 3 827 3 835 3 918 4 041 3 914 4 099 185 4.7%
Assault with the intent to inflict grievous bodily harm 29 958 30 723 30 491 29 504 28 832 28 982 29 201 28 665 26 824 26 693 -131 -0.5%
Common assault 29 691 32 726 32 133 31 841 30 087 26 307 24 011 23 703 22 285 22 842 557 2.5%
Common robbery 8 498 7 919 7 273 7 586 8 188 8 397 7 857 7 524 7 305 6 596 -709 -9.7%
Robbery with aggravating circumstances 25 779 23 152 19 513 18 417 19 923 20 957 20 881 21 061 22 327 21 543 -784 -3.5%
Total Contact Crimes ( Crimes Against The Person) 116 603 116 305 109 524 105 443 105 444 101 983 98 757 97 870 95 153 94 914 -239 -0.3%
Murder 46.9 41.3 36.3 32.9 34.5 34.1 35.5 36.2 36.6 38.5 1.9
Attempted murder 48.3 45.0 37.8 35.1 36.5 36.2 36.5 37.3 35.7 36.0 0.3
Assault with the intent to inflict grievous bodily harm 296.3 301.2 296.2 283.9 274.7 273.3 272.4 264.3 244.4 234.5 -10.0
Common assault 293.7 320.9 312.2 306.4 286.7 248.1 224.0 218.6 203.1 200.6 -2.4
Common robbery 84.1 77.6 70.7 73.0 78.0 79.2 73.3 69.4 66.6 57.9 -8.6
Rape 8 824 9 242 8 954 8 798 8 861 8 001 7 427 7 307 7 032 7 243 211 3.0%
Sexual Assault 1 266 1 397 1 449 1 457 1 386 1 336 1 138 1 157 1 039 1 148 109 10.5%
Attempted Sexual Offences 404 451 357 382 352 290 274 271 226 204 -22 -9.7%
Contact Sexual Offences 2 564 1 890 1 720 397 365 262 240 212 187 164 -23 -12.3%
Total Sexual Offences 13 058 12 980 12 480 11 034 10 964 9 889 9 079 8 947 8 484 8 759 275 3.2%
CONTACT CRIMES ( CRIMES AGAINST THE PERSON)
Total Sexual Offences
RATIO: CONTACT CRIMES ( CRIMES AGAINST THE PERSON)

KWAZULU NATALNational Overview – April to March 2017/18
168
Rape 87.3 90.6 87.0 84.7 84.4 75.4 69.3 67.4 64.1 63.6 -0.5
Sexual Assault 12.5 13.7 14.1 14.0 13.2 12.6 10.6 10.7 9.5 10.1 0.6
Attempted Sexual Offences 4.0 4.4 3.5 3.7 3.4 2.7 2.6 2.5 2.1 1.8 -0.3
Contact Sexual Offences 25.4 18.5 16.7 3.8 3.5 2.5 2.2 2.0 1.7 1.4 -0.3
Total Sexual Offences 129.2 127.3 121.3 106.2 104.5 93.2 84.7 82.5 77.3 76.9 -0.4
Carjacking 4 049 3 710 2 595 2 218 2 413 2 262 2 190 2 493 3 029 2 698 -331 -10.9%
Robbery at residential premises 4 601 4 580 3 998 3 751 4 119 4 099 3 958 4 082 4 255 4 174 -81 -1.9%
Robbery at non-residential premises 2 494 2 065 1 937 1 909 2 347 2 696 2 750 2 825 2 951 3 047 96 3.3%
Robbery of cash in transit 103 80 48 25 20 37 18 21 25 30 5 20.0%Bank robbery 12 2 1 1 2 0 0 0 1 3 2 200.0%
Truck hijacking 133 127 94 64 82 46 63 71 81 52 -29 -35.8%
Arson 1 147 1 159 1 093 1 030 946 896 854 825 699 679 -20 -2.9%
Malicious damage to property 16 085 16 534 16 361 15 394 15 670 14 954 14 605 14 709 14 010 12 958 -1 052 -7.5%
Total Contact-Related Crimes 17 232 17 693 17 454 16 424 16 616 15 850 15 459 15 534 14 709 13 637 -1 072 -7.3%
Burglary at non-residential premises 11 149 11 295 10 968 10 944 11 954 11 194 11 032 11 656 11 253 10 756 -497 -4.4%
Burglary at residential premises 37 515 40 231 39 439 41 010 45 404 43 969 43 274 42 429 41 013 38 545 -2 468 -6.0%
Theft of motor vehicle and motorcycle 12 080 11 404 10 530 10 059 9 738 8 674 8 404 8 673 8 413 8 240 -173 -2.1%
Theft out of or from motor vehicle 12 915 14 175 15 886 15 912 18 014 18 614 18 148 17 896 16 854 16 344 -510 -3.0%
Stock-theft 6 652 6 927 6 276 6 508 6 018 5 754 5 956 5 731 5 959 6 322 363 6.1%
Total Property-Related Crimes 80 311 84 032 83 099 84 433 91 128 88 205 86 814 86 385 83 492 80 207 -3 285 -3.9%
SOME SUBCATEGORIES OF AGGRAVATED ROBBERY
CONTACT-RELATED CRIMES
PROPERTY-RELATED CRIMES
RATIO: Total Sexual Offences

KWAZULU/NATALNational Overview – April to March 2017/18
169
All theft not mentioned elsewhere 48 283 46 077 49 588 52 467 50 361 49 846 47 622 43 573 42 577 39 615 -2 962 -7.0%
Commercial crime 12 665 13 452 14 985 13 375 14 226 12 431 11 227 11 395 12 405 12 308 -97 -0.8%
Shoplifting 12 744 15 399 12 811 12 399 13 014 13 378 14 118 13 648 12 302 11 620 -682 -5.5%
Total Other Serious Crimes 73 692 74 928 77 384 78 241 77 601 75 655 72 967 68 616 67 284 63 543 -3 741 -5.6%
Total 17 Community Reported Serious Crimes 287 838 292 958 287 461 284 541 290 789 281 693 273 997 268 405 260 638 252 301 -8 337 -3.2%
Illegal possession of firearms and ammunition 4 231 4 964 5 067 4 692 4 444 4 586 4 081 3 908 4 000 4 418 418 10.5%
Drug-related crime 23 817 28 692 32 454 37 414 42 167 45 950 47 377 46 354 50 429 53 987 3 558 7.1%
Driving under the influence of alcohol or drugs 12 835 11 933 10 107 12 866 15 109 12 595 11 702 12 052 13 403 18 218 4 815 35.9%
Sexual Offences detected as a result of police action 0 0 0 935 1 188 1 765 2 258 2 561 3 558 3 520 -38 -1.1%
Total Crime Detected As A Result Of Police Action 40 883 45 589 47 628 55 907 62 908 64 896 65 418 64 875 71 390 80 143 8 753 12.3%
CRIME DETECTED AS A RESULT OF POLICE ACTION
OTHER SERIOUS CRIMES

LIMPOPONational Overview – April to March 2017/18
170
CRIME CATEGORY 2008/2009 2009/2010 2010/2011 2011/2012 2012/2013 2013/2014 2014/2015 2015/2016 2016/2017 2017/2018 Case Diff % Change
Murder 745 761 663 734 701 728 777 898 813 911 98 12.1%
Sexual Offences 4 566 4 807 4 799 4 836 4 866 4 423 4 312 4 369 3 828 3 862 34 0.9%
Attempted murder 696 716 646 696 701 748 793 875 829 884 55 6.6%
Assault with the intent to inflict grievous bodily harm 13 138 13 259 12 869 14 663 13 710 12 645 13 511 14 143 12 948 12 005 -943 -7.3%
Common assault 9 689 8 871 8 066 10 475 9 570 9 044 9 073 9 838 8 373 7 519 -854 -10.2%
Common robbery 3 302 3 255 3 094 3 770 3 321 3 202 3 382 3 545 3 228 2 839 -389 -12.1%
Robbery with aggravating circumstances 2 793 2 951 2 750 3 652 3 917 5 163 6 123 6 723 6 745 7 048 303 4.5%
Total Contact Crimes ( Crimes Against The Person) 34 929 34 620 32 887 38 826 36 786 35 953 37 971 40 391 36 764 35 068 -1 696 -4.6%
Murder 14.2 14.3 12.4 13.6 12.8 13.2 13.9 15.9 14.2 15.7 1.5
Attempted murder 13.2 13.5 12.1 12.9 12.8 13.5 14.2 15.5 14.5 15.2 0.8
Assault with the intent to inflict grievous bodily harm 249.6 249.6 240.1 270.9 250.8 228.8 241.8 250.1 226.2 207.1 -19.1
Common assault 184.1 167.0 150.5 193.5 175.0 163.7 162.3 174.0 146.3 129.7 -16.6
Common robbery 62.7 61.3 57.7 69.7 60.7 57.9 60.5 62.7 56.4 49.0 -7.4
Rape 3 551 3 847 3 844 4 045 4 109 3 769 3 725 3 731 3 321 3 301 -20 -0.6%
Sexual Assault 218 204 227 257 290 269 245 245 240 303 63 26.3%
Attempted Sexual Offences 323 322 300 342 314 299 262 258 195 195 0 0.0%
Contact Sexual Offences 474 434 428 192 153 86 80 135 72 63 -9 -12.5%
Total Sexual Offences 4 566 4 807 4 799 4 836 4 866 4 423 4 312 4 369 3 828 3 862 34 0.9%
CONTACT CRIMES ( CRIMES AGAINST THE PERSON)
Total Sexual Offences
RATIO: CONTACT CRIMES ( CRIMES AGAINST THE PERSON)

LIMPOPONational Overview – April to March 2017/18
171
CRIME CATEGORY 2008/2009 2009/2010 2010/2011 2011/2012 2012/2013 2013/2014 2014/2015 2015/2016 2016/2017 2017/2018 Case Diff % Change
Rape 67,5 72,4 71,7 74,7 75,2 68,2 66,7 66,0 58,0 56,9 -1,1
Sexual Assault 4,1 3,8 4,2 4,7 5,3 4,9 4,4 4,3 4,2 5,2 1,0
Attempted Sexual Offences 6,1 6,1 5,6 6,3 5,7 5,4 4,7 4,6 3,4 3,4 0,0
Contact Sexual Offences 9,0 8,2 8,0 3,5 2,8 1,6 1,4 2,4 1,3 1,1 -0,2
Carjacking 286 250 175 157 219 249 345 450 459 584 125 27,2%
Robbery at residential premises 514 584 530 754 767 960 1 117 1 190 1 181 1 490 309 26,2%
Robbery at non-residential premises 527 629 755 1 130 1 221 1 374 1 522 1 802 1 750 1 821 71 4,1%
Robbery of cash in transit 22 21 8 11 5 7 9 13 10 14 4 40,0%
Bank robbery 2 3 0 0 0 0 1 0 0 0 0 0 CasesTruck hijacking 27 19 20 19 34 13 27 15 27 32 5 18,5%
CONTACT-RELATED CRIMES
Arson 551 584 539 599 649 565 585 613 484 431 -53 -11,0%
Malicious damage to property 6 456 6 009 5 729 6 936 6 647 6 580 6 959 7 612 6 868 6 815 -53 -0,8%
Total Contact-Related Crimes 7 007 6 593 6 268 7 535 7 296 7 145 7 544 8 225 7 352 7 246 -106 -1,4%
PROPERTY-RELATED CRIMES
Burglary at non-residential premises 6 334 6 227 5 868 6 607 6 501 6 992 7 048 7 386 7 288 6 716 -572 -7,8%
Burglary at residential premises 12 332 13 936 13 376 15 225 14 851 16 477 16 466 16 217 15 984 14 351 -1 633 -10,2%
Theft of motor vehicle and motorcycle 1 074 1 083 872 1 013 979 977 988 1 151 1 017 1 024 7 0,7%
Theft out of or from motor vehicle 3 013 3 444 3 453 4 761 4 634 5 466 5 501 5 571 4 995 4 447 -548 -11,0%
Stock-theft 1 326 1 438 1 520 1 729 1 568 1 567 1 666 1 756 1 956 2 187 231 11,8%
Total Property-Related Crimes 24 079 26 128 25 089 29 335 28 533 31 479 31 669 32 081 31 240 28 725 -2 515 -8,1%
SOME SUBCATEGORIES OF AGGRAVATED ROBBERY
RATIO: Total Sexual Offences

LIMPOPONational Overview – April to March 2017/18
172
CRIME CATEGORY 2008/2009 2009/2010 2010/2011 2011/2012 2012/2013 2013/2014 2014/2015 2015/2016 2016/2017 2017/2018 Case Diff % Change
OTHER SERIOUS CRIMES
All theft not mentioned elsewhere 17 649 15 856 15 978 19 492 17 513 18 288 19 050 19 915 20 758 17 386 -3 372 -16,2%
Commercial crime 2 777 2 930 3 091 3 785 4 353 4 002 3 500 3 733 4 024 3 736 -288 -7,2%
Shoplifting 4 317 4 466 3 910 3 509 3 824 3 899 3 909 3 799 3 742 3 259 -483 -12,9%
Total Other Serious Crimes 24 743 23 252 22 979 26 786 25 690 26 189 26 459 27 447 28 524 24 381 -4 143 -14,5%
Total 17 Community Reported Serious Crimes 90 758 90 593 87 223 102 482 98 305 100 766 103 643 108 144 103 880 95 420 -8 460 -8,1%
CRIME DETECTED AS A RESULT OF POLICE ACTION
Illegal possession of firearms and ammunition 460 460 400 413 496 488 474 456 533 640 107 20,1%
Drug-related crime 3 314 4 834 4 633 5 253 7 528 9 608 11 716 11 268 14 393 19 592 5 199 36,1%
Driving under the influence of alcohol or drugs 1 657 2 223 2 728 2 637 2 831 2 268 3 214 4 143 4 420 5 684 1 264 28,6%
Sexual Offences detected as a result of police action 0 0 0 778 1 547 1 905 2 917 1 842 698 1 346 648 92,8%
Total Crime Detected As A Result Of Police Action 5 431 7 517 7 761 9 081 12 402 14 269 18 321 17 709 20 044 27 262 7 218 36,0%

MPUMALANGANational Overview – April to March 2017/18
173
CRIME CATEGORY 2008/2009 2009/2010 2010/2011 2011/2012 2012/2013 2013/2014 2014/2015 2015/2016 2016/2017 2017/2018 Case Diff % Change
Murder 895 864 717 726 693 806 831 859 954 922 -32 -3.4%
Sexual Offences 4 634 4 516 4 345 3 955 4 065 3 797 3 474 3 331 3 216 3 198 -18 -0.6%
Attempted murder 1 257 1 209 811 763 721 764 703 797 951 897 -54 -5.7%
Assault with the intent to inflict grievous bodily harm 17 006 15 779 14 359 13 025 11 657 10 712 10 778 11 359 10 896 10 690 -206 -1.9%
Common assault 11 391 11 102 10 251 9 187 8 211 7 467 7 510 7 649 7 712 7 641 -71 -0.9%
Common robbery 4 345 3 926 3 514 3 324 3 147 2 977 2 934 2 746 2 950 2 541 -409 -13.9%
Robbery with aggravating circumstances 6 923 6 574 5 517 5 681 5 198 5 252 5 656 5 996 6 702 6 757 55 0.8%
Total Contact Crimes ( Crimes Against The Person) 46 451 43 970 39 514 36 661 33 692 31 775 31 886 32 737 33 381 32 646 -735 -2.2%
Murder 23.3 22.2 18.1 18.0 16.9 19.4 19.6 19.9 21.8 20.4 -1.4
Attempted murder 32.8 31.0 20.5 18.9 17.6 18.3 16.6 18.5 21.7 19.8 -1.9
Assault with the intent to inflict grievous bodily harm 443.3 404.8 362.4 323.4 284.7 257.2 254.4 263.5 248.4 236.3 -12.1
Common assault 297.0 284.8 258.7 228.1 200.5 179.3 177.3 177.5 175.8 168.9 -6.9
Common robbery 113.3 100.7 88.7 82.5 76.8 71.5 69.3 63.7 67.3 56.2 -11.1
Rape 3 748 3 625 3 528 3 272 3 486 3 251 3 000 2 844 2 708 2 712 4 0.1%
Sexual Assault 204 193 217 251 241 243 221 244 264 282 18 6.8%
Attempted Sexual Offences 330 330 331 253 216 198 174 161 146 119 -27 -18.5%
Contact Sexual Offences 352 368 269 179 122 105 79 82 98 85 -13 -13.3%
Total Sexual Offences 4 634 4 516 4 345 3 955 4 065 3 797 3 474 3 331 3 216 3 198 -18 -0.6%
CONTACT CRIMES ( CRIMES AGAINST THE PERSON)
Total Sexual Offences
RATIO: CONTACT CRIMES ( CRIMES AGAINST THE PERSON)

MPUMALANGANational Overview – April to March 2017/18
174
Rape 97.7 93.0 89.0 81.2 85.1 78.1 70.8 66.0 61.7 59.9 -1.8
Sexual Assault 5.3 5.0 5.5 6.2 5.9 5.8 5.2 5.7 6.0 6.2 0.2
Attempted Sexual Offences 8.6 8.5 8.4 6.3 5.3 4.8 4.1 3.7 3.3 2.6 -0.7
Contact Sexual Offences 9.2 9.4 6.8 4.4 3.0 2.5 1.9 1.9 2.2 1.9 -0.4
Total Sexual Offences 120.8 115.8 109.7 98.2 99.3 91.2 82.0 77.3 73.3 70.7 -2.6
Carjacking 976 707 419 363 355 359 509 629 810 896 86 10.6%
Robbery at residential premises 1 188 1 300 1 045 1 189 1 123 1 118 1 112 1 080 1 138 1 125 -13 -1.1%
Robbery at non-residential premises 815 972 1 102 1 380 1 308 1 257 1 366 1 562 1 764 1 624 -140 -7.9%
Robbery of cash in transit 12 19 12 15 12 9 14 18 22 23 1 4.5%Bank robbery 7 5 3 1 2 2 2 1 0 0 0 0 Cases
Truck hijacking 172 197 163 149 143 197 155 194 178 121 -57 -32.0%
Arson 598 539 373 294 284 260 291 286 260 254 -6 -2.3%
Malicious damage to property 8 540 7 999 7 025 6 420 6 071 5 712 5 839 5 827 5 574 5 519 -55 -1.0%
Total Contact-Related Crimes 9 138 8 538 7 398 6 714 6 355 5 972 6 130 6 113 5 834 5 773 -61 -1.0%
Burglary at non-residential premises 5 317 5 515 5 209 5 470 5 399 5 292 5 541 6 014 6 158 5 980 -178 -2.9%
Burglary at residential premises 19 766 19 206 18 026 18 117 18 777 18 489 18 183 18 162 18 507 17 565 -942 -5.1%
Theft of motor vehicle and motorcycle 3 185 3 221 2 728 2 705 2 496 2 340 2 303 2 222 2 208 2 206 -2 -0.1%
Theft out of or from motor vehicle 5 563 6 337 6 655 7 396 7 386 7 675 7 999 7 372 6 926 6 830 -96 -1.4%
Stock-theft 2 773 2 898 2 514 2 481 2 254 2 182 2 192 2 337 2 867 3 135 268 9.3%
Total Property-Related Crimes 36 604 37 177 35 132 36 169 36 312 35 978 36 218 36 107 36 666 35 716 -950 -2.6%
SOME SUBCATEGORIES OF AGGRAVATED ROBBERY
CONTACT-RELATED CRIMES
PROPERTY-RELATED CRIMES
RATIO: Total Sexual Offences

MPUMALANGANational Overview – April to March 2017/18
175
All theft not mentioned elsewhere 24 354 22 667 23 163 22 291 21 373 19 581 18 894 18 416 18 457 17 024 -1 433 -7.8%
Commercial crime 3 922 4 547 4 431 5 408 6 509 5 063 4 494 4 733 5 149 5 178 29 0.6%
Shoplifting 3 632 3 943 3 618 3 194 3 248 3 151 3 494 3 397 3 454 3 290 -164 -4.7%
Total Other Serious Crimes 31 908 31 157 31 212 30 893 31 130 27 795 26 882 26 546 27 060 25 492 -1 568 -5.8%
Total 17 Community Reported Serious Crimes 124 101 120 842 113 256 110 437 107 489 101 520 101 116 101 503 102 941 99 627 -3 314 -3.2%
Illegal possession of firearms and ammunition 587 618 540 704 800 937 1 068 977 1 137 1 084 -53 -4.7%
Drug-related crime 1 640 2 039 3 167 4 151 5 834 7 459 8 841 9 820 11 519 13 026 1 507 13.1%
Driving under the influence of alcohol or drugs 1 914 2 120 2 696 3 756 4 023 3 088 2 974 3 649 4 205 4 300 95 2.3%
Sexual Offences detected as a result of police action 0 0 0 46 83 50 46 93 41 24 -17 -41.5%
Total Crime Detected As A Result Of Police Action 4 141 4 777 6 403 8 657 10 740 11 534 12 929 14 539 16 902 18 434 1 532 9.1%
CRIME DETECTED AS A RESULT OF POLICE ACTION
OTHER SERIOUS CRIMES

NORTH WESTNational Overview – April to March 2017/18
176
CRIME CATEGORY 2008/2009 2009/2010 2010/2011 2011/2012 2012/2013 2013/2014 2014/2015 2015/2016 2016/2017 2017/2018 Case Diff % Change
Murder 853 741 743 799 867 824 853 907 901 950 49 5.4%
Sexual Offences 4 962 4 695 4 649 4 885 5 228 4 616 4 585 4 164 4 326 4 182 -144 -3.3%
Attempted murder 782 834 701 762 912 1 069 984 899 898 864 -34 -3.8%
Assault with the intent to inflict grievous bodily harm 14 665 14 498 14 035 14 193 14 189 13 464 13 334 13 614 12 731 13 131 400 3.1%
Common assault 9 253 8 846 7 746 7 634 7 194 6 750 6 930 6 942 7 021 7 828 807 11.5%
Common robbery 3 066 2 999 2 724 2 473 2 406 2 341 2 419 2 417 2 589 2 824 235 9.1%
Robbery with aggravating circumstances 5 566 5 402 5 060 5 366 5 271 5 409 5 977 6 281 7 017 6 825 -192 -2.7%
Total Contact Crimes ( Crimes Against The Person) 39 147 38 015 35 658 36 112 36 067 34 473 35 082 35 224 35 483 36 604 1 121 3.2%
Murder 25.5 21.8 21.6 22.8 24.4 22.8 23.2 24.2 23.7 23.9 0.2
Attempted murder 23.4 24.6 20.3 21.8 25.6 29.5 26.7 24.0 23.6 21.7 -1.9
Assault with the intent to inflict grievous bodily harm 438.7 427.1 407.1 405.3 398.7 372.2 362.5 363.9 334.5 330.0 -4.5
Common assault 276.8 260.6 224.7 218.0 202.1 186.6 188.4 185.6 184.5 196.7 12.3
Common robbery 91.7 88.4 79.0 70.6 67.6 64.7 65.8 64.6 68.0 71.0 2.9
Rape 3 782 3 523 3 545 3 928 4 331 3 829 3 771 3 433 3 615 3 479 -136 -3.8%
Sexual Assault 450 436 441 410 379 301 310 305 319 347 28 8.8%
Attempted Sexual Offences 398 411 392 380 374 368 315 284 246 261 15 6.1%
Contact Sexual Offences 332 325 271 167 144 118 189 142 146 95 -51 -34.9%
Total Sexual Offences 4 962 4 695 4 649 4 885 5 228 4 616 4 585 4 164 4 326 4 182 -144 -3.3%
Rape 113.1 103.8 102.8 112.2 121.7 105.8 102.5 91.8 95.0 87.4 -7.5
Sexual Assault 13.5 12.8 12.8 11.7 10.6 8.3 8.4 8.2 8.4 8.7 0.3
Attempted Sexual Offences 11.9 12.1 11.4 10.9 10.5 10.2 8.6 7.6 6.5 6.6 0.1
Contact Sexual Offences 9.9 9.6 7.9 4.8 4.0 3.3 5.1 3.8 3.8 2.4 -1.4
Total Sexual Offences 148.4 138.3 134.9 139.5 146.9 127.6 124.6 111.3 113.7 105.1 -8.6
CONTACT CRIMES ( CRIMES AGAINST THE PERSON)
Total Sexual Offences
RATIO: CONTACT CRIMES ( CRIMES AGAINST THE PERSON)
RATIO: Total Sexual Offences

NORTH WESTNational Overview – April to March 2017/18
177
CRIME CATEGORY 2008/2009 2009/2010 2010/2011 2011/2012 2012/2013 2013/2014 2014/2015 2015/2016 2016/2017 2017/2018 Case Diff % Change
Rape 113.1 103.8 102.8 112.2 121.7 105.8 102.5 91.8 95.0 87.4 -7.5
Sexual Assault 13.5 12.8 12.8 11.7 10.6 8.3 8.4 8.2 8.4 8.7 0.3
Attempted Sexual Offences 11.9 12.1 11.4 10.9 10.5 10.2 8.6 7.6 6.5 6.6 0.1
Contact Sexual Offences 9.9 9.6 7.9 4.8 4.0 3.3 5.1 3.8 3.8 2.4 -1.4
Total Sexual Offences 148.4 138.3 134.9 139.5 146.9 127.6 124.6 111.3 113.7 105.1 -8.6
Carjacking 251 271 233 232 227 242 278 370 390 425 35 9.0%
Robbery at residential premises 919 899 828 894 1 022 1 004 1 110 1 065 1 290 1 145 -145 -11.2%
Robbery at non-residential premises 1 012 1 127 1 159 1 348 1 231 1 366 1 419 1 394 1 493 1 263 -230 -15.4%
Robbery of cash in transit 6 4 9 8 3 0 5 4 4 23 19 475.0%Bank robbery 13 7 5 4 0 0 1 3 0 1 1 1 Case Higher
Truck hijacking 49 70 47 28 22 46 45 42 48 41 -7 -14.6%
Arson 486 397 462 470 407 348 329 314 290 323 33 11.4%
Malicious damage to property 7 054 6 958 6 328 6 443 6 299 5 853 5 902 5 762 5 774 5 821 47 0.8%
Total Contact-Related Crimes 7 540 7 355 6 790 6 913 6 706 6 201 6 231 6 076 6 064 6 144 80 1.3%
Burglary at non-residential premises 5 360 5 355 4 980 5 247 5 394 4 861 5 080 5 313 6 042 5 563 -479 -7.9%
Burglary at residential premises 14 277 14 859 14 740 14 569 15 705 15 388 15 687 15 568 15 908 15 267 -641 -4.0%
Theft of motor vehicle and motorcycle 2 556 2 668 2 442 2 404 2 247 2 039 1 984 2 070 2 068 2 112 44 2.1%
Theft out of or from motor vehicle 5 032 5 192 5 426 5 501 5 665 5 981 6 349 5 913 6 293 5 866 -427 -6.8%
Stock-theft 2 513 2 900 2 498 2 668 2 714 2 388 2 574 2 605 3 192 3 447 255 8.0%
Total Property-Related Crimes 29 738 30 974 30 086 30 389 31 725 30 657 31 674 31 469 33 503 32 255 -1 248 -3.7%
SOME SUBCATEGORIES OF AGGRAVATED ROBBERY
CONTACT-RELATED CRIMES
PROPERTY-RELATED CRIMES
RATIO: Total Sexual Offences

NORTH WESTNational Overview – April to March 2017/18
178
All theft not mentioned elsewhere 21 512 18 937 19 126 18 411 17 417 18 042 17 943 16 751 15 677 14 268 -1 409 -9.0%
Commercial crime 4 328 5 011 4 346 4 339 6 766 5 658 4 016 4 212 3 914 3 744 -170 -4.3%
Shoplifting 2 987 2 760 2 480 2 458 2 265 2 364 2 270 2 188 2 176 2 008 -168 -7.7%
Total Other Serious Crimes 28 827 26 708 25 952 25 208 26 448 26 064 24 229 23 151 21 767 20 020 -1 747 -8.0%
Total 17 Community Reported Serious Crimes 105 252 103 052 98 486 98 622 100 946 97 395 97 216 95 920 96 817 95 023 -1 794 -1.9%
Illegal possession of firearms and ammunition 480 385 373 466 464 493 531 678 735 674 -61 -8.3%
Drug-related crime 7 099 7 694 7 163 7 677 9 152 11 007 11 632 12 189 11 972 13 825 1 853 15.5%
Driving under the influence of alcohol or drugs 2 040 2 174 1 617 1 718 2 028 2 246 1 927 2 583 2 562 2 725 163 6.4%
Sexual Offences detected as a result of police action 0 0 0 33 224 136 106 87 255 261 6 2.4%
Total Crime Detected As A Result Of Police Action 9 619 10 253 9 153 9 894 11 868 13 882 14 196 15 537 15 524 17 485 1 961 12.6%
CRIME DETECTED AS A RESULT OF POLICE ACTION
OTHER SERIOUS CRIMES
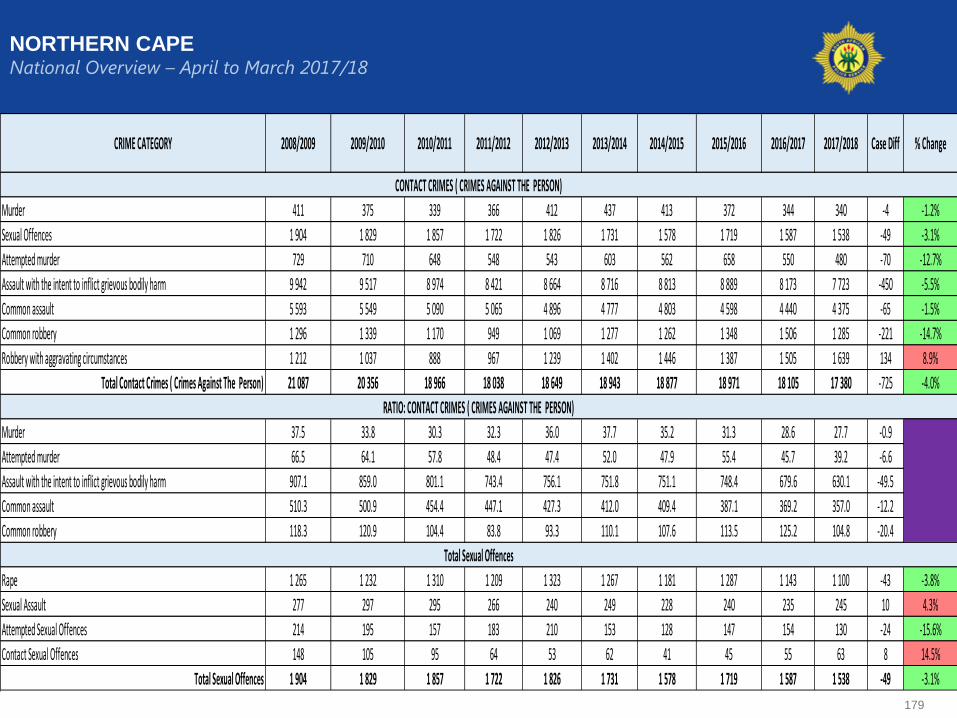
NORTHERN CAPENational Overview – April to March 2017/18
179
CRIME CATEGORY 2008/2009 2009/2010 2010/2011 2011/2012 2012/2013 2013/2014 2014/2015 2015/2016 2016/2017 2017/2018 Case Diff % Change
Murder 411 375 339 366 412 437 413 372 344 340 -4 -1.2%
Sexual Offences 1 904 1 829 1 857 1 722 1 826 1 731 1 578 1 719 1 587 1 538 -49 -3.1%
Attempted murder 729 710 648 548 543 603 562 658 550 480 -70 -12.7%
Assault with the intent to inflict grievous bodily harm 9 942 9 517 8 974 8 421 8 664 8 716 8 813 8 889 8 173 7 723 -450 -5.5%
Common assault 5 593 5 549 5 090 5 065 4 896 4 777 4 803 4 598 4 440 4 375 -65 -1.5%
Common robbery 1 296 1 339 1 170 949 1 069 1 277 1 262 1 348 1 506 1 285 -221 -14.7%
Robbery with aggravating circumstances 1 212 1 037 888 967 1 239 1 402 1 446 1 387 1 505 1 639 134 8.9%
Total Contact Crimes ( Crimes Against The Person) 21 087 20 356 18 966 18 038 18 649 18 943 18 877 18 971 18 105 17 380 -725 -4.0%
Murder 37.5 33.8 30.3 32.3 36.0 37.7 35.2 31.3 28.6 27.7 -0.9
Attempted murder 66.5 64.1 57.8 48.4 47.4 52.0 47.9 55.4 45.7 39.2 -6.6
Assault with the intent to inflict grievous bodily harm 907.1 859.0 801.1 743.4 756.1 751.8 751.1 748.4 679.6 630.1 -49.5
Common assault 510.3 500.9 454.4 447.1 427.3 412.0 409.4 387.1 369.2 357.0 -12.2
Common robbery 118.3 120.9 104.4 83.8 93.3 110.1 107.6 113.5 125.2 104.8 -20.4
Rape 1 265 1 232 1 310 1 209 1 323 1 267 1 181 1 287 1 143 1 100 -43 -3.8%
Sexual Assault 277 297 295 266 240 249 228 240 235 245 10 4.3%
Attempted Sexual Offences 214 195 157 183 210 153 128 147 154 130 -24 -15.6%
Contact Sexual Offences 148 105 95 64 53 62 41 45 55 63 8 14.5%
Total Sexual Offences 1 904 1 829 1 857 1 722 1 826 1 731 1 578 1 719 1 587 1 538 -49 -3.1%
CONTACT CRIMES ( CRIMES AGAINST THE PERSON)
Total Sexual Offences
RATIO: CONTACT CRIMES ( CRIMES AGAINST THE PERSON)

NORTHERN CAPENational Overview – April to March 2017/18
180
Rape 115.4 111.2 116.9 106.7 115.5 109.3 100.7 108.4 95.0 89.8 -5.3
Sexual Assault 25.3 26.8 26.3 23.5 20.9 21.5 19.4 20.2 19.5 20.0 0.4
Attempted Sexual Offences 19.5 17.6 14.0 16.2 18.3 13.2 10.9 12.4 12.8 10.6 -2.2
Contact Sexual Offences 13.5 9.5 8.5 5.6 4.6 5.3 3.5 3.8 4.6 5.1 0.6
Total Sexual Offences 173.7 165.1 165.8 152.0 159.4 149.3 134.5 144.7 132.0 125.5 -6.5
Carjacking 7 12 14 8 28 28 15 47 29 37 8 27.6%
Robbery at residential premises 45 64 41 89 104 110 123 106 142 159 17 12.0%
Robbery at non-residential premises 121 146 156 210 215 282 240 258 304 299 -5 -1.6%
Robbery of cash in transit 2 2 1 2 1 2 0 1 0 1 1 1 Case HigherBank robbery 1 0 1 0 0 0 1 0 0 0 0 0 Cases
Truck hijacking 0 1 4 4 4 0 0 2 0 3 3 3 Cases Higher
Arson 172 154 172 178 177 163 172 172 149 156 7 4.7%
Malicious damage to property 3 228 3 064 2 757 2 791 3 102 3 087 3 209 3 084 2 954 2 927 -27 -0.9%
Total Contact-Related Crimes 3 400 3 218 2 929 2 969 3 279 3 250 3 381 3 256 3 103 3 083 -20 -0.6%
Burglary at non-residential premises 2 056 2 232 2 030 2 251 2 358 2 373 2 270 2 203 2 403 2 172 -231 -9.6%
Burglary at residential premises 5 402 5 531 4 985 4 851 5 711 6 013 6 204 6 469 6 518 6 228 -290 -4.4%
Theft of motor vehicle and motorcycle 265 241 240 300 310 321 327 246 219 233 14 6.4%
Theft out of or from motor vehicle 2 103 1 863 2 101 2 261 2 570 2 968 2 898 2 962 2 911 2 609 -302 -10.4%
Stock-theft 1 553 1 706 1 542 1 418 1 584 1 211 1 331 1 332 1 356 1 558 202 14.9%
Total Property-Related Crimes 11 379 11 573 10 898 11 081 12 533 12 886 13 030 13 212 13 407 12 800 -607 -4.5%
SOME SUBCATEGORIES OF AGGRAVATED ROBBERY
CONTACT-RELATED CRIMES
PROPERTY-RELATED CRIMES
RATIO: Total Sexual Offences

NORTHERN CAPENational Overview – April to March 2017/18
181
All theft not mentioned elsewhere 7 995 7 345 6 326 6 662 6 951 7 016 7 437 7 316 7 104 6 871 -233 -3.3%
Commercial crime 978 1 128 1 119 1 118 868 1 035 997 1 037 1 108 1 097 -11 -1.0%
Shoplifting 2 017 2 203 1 638 1 480 1 316 1 302 1 360 1 276 1 407 1 309 -98 -7.0%
Total Other Serious Crimes 10 990 10 676 9 083 9 260 9 135 9 353 9 794 9 629 9 619 9 277 -342 -3.6%
Total 17 Community Reported Serious Crimes 46 856 45 823 41 876 41 348 43 596 44 432 45 082 45 068 44 234 42 540 -1 694 -3.8%
Illegal possession of firearms and ammunition 71 48 61 55 65 92 102 92 102 103 1 1.0%
Drug-related crime 1 931 2 367 2 412 2 667 2 852 3 247 3 527 4 344 5 136 5 563 427 8.3%
Driving under the influence of alcohol or drugs 1 243 1 284 1 053 867 829 744 804 725 797 812 15 1.9%
Sexual Offences detected as a result of police action 0 0 0 8 3 10 3 22 49 17 -32 -65.3%
Total Crime Detected As A Result Of Police Action 3 245 3 699 3 526 3 597 3 749 4 093 4 436 5 183 6 084 6 495 411 6.8%
CRIME DETECTED AS A RESULT OF POLICE ACTION
OTHER SERIOUS CRIMES

WESTERN CAPENational Overview – April to March 2017/18
182
CRIME CATEGORY 2008/2009 2009/2010 2010/2011 2011/2012 2012/2013 2013/2014 2014/2015 2015/2016 2016/2017 2017/2018 Case Diff % Change
Murder 2 343 2 271 2 308 2 293 2 575 2 904 3 186 3 224 3 311 3 729 418 12.6%
Sexual Offences 8 583 9 477 9 179 8 809 8 440 7 760 7 369 7 130 7 115 7 075 -40 -0.6%
Attempted murder 1 755 1 696 2 152 2 310 3 268 3 345 3 727 3 444 3 387 3 698 311 9.2%
Assault with the intent to inflict grievous bodily harm 23 025 23 968 24 666 24 637 24 463 24 806 26 200 25 539 24 417 23 583 -834 -3.4%
Common assault 31 533 34 223 33 122 34 423 35 517 37 183 39 150 41 304 39 868 38 579 -1 289 -3.2%
Common robbery 8 412 9 424 10 361 11 090 12 402 13 107 13 420 12 485 12 574 12 003 -571 -4.5%
Robbery with aggravating circumstances 12 687 12 491 12 204 13 739 16 681 19 484 23 116 23 732 24 032 24 329 297 1.2%
Total Contact Crimes ( Crimes Against The Person) 88 338 93 550 93 992 97 301 103 346 108 589 116 168 116 858 114 704 112 996 -1 708 -1.5%
Murder 43.3 41.1 40.9 39.8 43.7 48.3 51.9 51.4 51.7 56.3 4.6
Attempted murder 32.4 30.7 38.1 40.1 55.5 55.6 60.7 54.9 52.9 55.9 3.0
Assault with the intent to inflict grievous bodily harm 425.2 433.4 436.8 427.2 415.3 412.3 426.4 407.1 381.1 356.2 -24.9
Common assault 582.3 618.9 586.5 596.8 602.9 618.1 637.2 658.3 622.2 582.7 -39.5
Common robbery 155.3 170.4 183.5 192.3 210.5 217.9 218.4 199.0 196.2 181.3 -15.0
Rape 5 159 6 188 6 219 5 924 5 861 5 250 4 951 4 800 4 771 4 744 -27 -0.6%
Sexual Assault 1 659 1 988 1 855 1 975 1 729 1 705 1 640 1 576 1 670 1 710 40 2.4%
Attempted Sexual Offences 277 325 366 410 420 441 409 437 365 372 7 1.9%
Contact Sexual Offences 1 488 976 739 500 430 364 369 317 309 249 -60 -19.4%
Total Sexual Offences 8 583 9 477 9 179 8 809 8 440 7 760 7 369 7 130 7 115 7 075 -40 -0.6%
CONTACT CRIMES ( CRIMES AGAINST THE PERSON)
Total Sexual Offences
RATIO: CONTACT CRIMES ( CRIMES AGAINST THE PERSON)

WESTERN CAPENational Overview – April to March 2017/18
183
CRIME CATEGORY 2008/2009 2009/2010 2010/2011 2011/2012 2012/2013 2013/2014 2014/2015 2015/2016 2016/2017 2017/2018 Case Diff % Change
Rape 95,3 111,9 110,1 102,7 99,5 87,3 80,6 76,5 74,5 71,6 -2,8
Sexual Assault 30,6 35,9 32,8 34,2 29,4 28,3 26,7 25,1 26,1 25,8 -0,2
Attempted Sexual Offences 5,1 5,9 6,5 7,1 7,1 7,3 6,7 7,0 5,7 5,6 -0,1
Contact Sexual Offences 27,5 17,6 13,1 8,7 7,3 6,1 6,0 5,1 4,8 3,8 -1,1
Carjacking 693 568 448 539 782 956 1 530 2 032 2 201 2 182 -19 -0,9%
Robbery at residential premises 974 1 167 1 215 1 344 1 647 1 878 2 158 2 574 2 560 2 787 227 8,9%
Robbery at non-residential premises 1 056 1 056 1 309 1 563 1 933 2 154 2 218 1 973 1 889 2 033 144 7,6%
Robbery of cash in transit 44 29 21 14 30 18 15 24 35 26 -9 -25,7%
Bank robbery 2 2 1 0 1 0 1 0 0 1 1 1 Case HigherTruck hijacking 27 14 17 31 37 40 62 46 58 121 63 108,6%
CONTACT-RELATED CRIMES
Arson 510 572 612 663 691 649 782 757 781 762 -19 -2,4%
Malicious damage to property 24 743 24 024 22 986 24 068 24 888 26 458 29 289 29 217 29 216 28 001 -1 215 -4,2%
Total Contact-Related Crimes 25 253 24 596 23 598 24 731 25 579 27 107 30 071 29 974 29 997 28 763 -1 234 -4,1%
PROPERTY-RELATED CRIMES
Burglary at non-residential premises 10 429 11 530 11 561 11 737 13 168 13 472 13 719 13 344 12 535 11 379 -1 156 -9,2%
Burglary at residential premises 42 792 43 171 43 685 44 494 49 509 50 503 47 783 47 569 46 043 42 662 -3 381 -7,3%
Theft of motor vehicle and motorcycle 10 752 9 980 9 037 8 624 9 160 9 460 8 918 8 378 7 381 7 104 -277 -3,8%
Theft out of or from motor vehicle 29 807 35 294 36 348 38 282 41 361 42 549 42 221 41 458 37 910 35 532 -2 378 -6,3%
Stock-theft 838 1 035 898 876 924 789 831 861 885 953 68 7,7%
Total Property-Related Crimes 94 618 101 010 101 529 104 013 114 122 116 773 113 472 111 610 104 754 97 630 -7 124 -6,8%
SOME SUBCATEGORIES OF AGGRAVATED ROBBERY
RATIO: Total Sexual Offences

WESTERN CAPENational Overview – April to March 2017/18
184
All theft not mentioned elsewhere 89 569 85 547 84 032 91 747 90 605 93 978 97 396 92 032 85 957 79 975 -5 982 -7.0%
Commercial crime 11 093 11 452 11 622 11 805 11 791 10 821 10 408 10 986 11 725 12 109 384 3.3%
Shoplifting 18 826 20 485 18 751 16 974 15 828 14 741 14 421 13 492 14 557 13 738 -819 -5.6%
Total Other Serious Crimes 119 488 117 484 114 405 120 526 118 224 119 540 122 225 116 510 112 239 105 822 -6 417 -5.7%
Total 17 Community Reported Serious Crimes 327 697 336 640 333 524 346 571 361 271 372 009 381 936 374 952 361 694 345 211 -16 483 -4.6%
Illegal possession of firearms and ammunition 2 292 2 158 2 532 2 373 2 886 2 786 2 959 2 819 2 929 3 422 493 16.8%
Drug-related crime 52 733 60 358 70 554 77 035 82 033 85 437 88 731 93 996 107 379 117 157 9 778 9.1%
Driving under the influence of alcohol or drugs 12 733 15 635 17 229 17 523 15 161 13 583 13 224 11 725 12 895 12 776 -119 -0.9%
Sexual Offences detected as a result of police action 0 0 0 248 216 161 129 242 274 166 -108 -39.4%
Total Crime Detected As A Result Of Police Action 67 758 78 151 90 315 97 179 100 296 101 967 105 043 108 782 123 477 133 521 10 044 8.1%
CRIME DETECTED AS A RESULT OF POLICE ACTION
OTHER SERIOUS CRIMES

RSANational Overview – April to March
185
CRIME CATEGORY 2008/2009 2009/2010 2010/2011 2011/2012 2012/2013 2013/2014 2014/2015 2015/2016 2016/2017 2017/2018 Case Diff % Change
Murder 18 084 16 767 15 893 15 554 16 213 17 023 17 805 18 673 19 016 20 336 1 320 6.9%
Sexual Offences 69 197 66 992 64 921 60 539 60 888 56 680 53 617 51 895 49 660 50 108 448 0.9%
Attempted murder 18 140 17 247 15 360 14 730 16 236 16 989 17 537 18 127 18 205 18 233 28 0.2%
Assault with the intent to inflict grievous bodily harm 202 328 203 807 197 470 191 612 185 050 182 333 182 556 182 933 170 616 167 352 -3 264 -1.9%
Common assault 190 709 194 922 184 103 180 165 171 653 166 081 161 486 164 958 156 450 156 243 -207 -0.1%
Common robbery 58 764 56 993 54 442 52 566 53 196 53 505 54 927 54 110 53 418 50 730 -2 688 -5.0%
Robbery with aggravating circumstances 120 920 113 200 101 039 100 769 105 488 118 963 129 045 132 527 140 956 138 364 -2 592 -1.8%
Total Contact Crimes ( Crimes Against The Person) 678 142 669 928 633 228 615 935 608 724 611 574 616 973 623 223 608 321 601 366 -6 955 -1.1%
Murder 36.4 33.3 31.1 30.1 30.9 31.9 32.9 34.0 34.1 35.2 1.2
Attempted murder 139.4 133.1 127.2 117.0 115.9 106.3 99.1 94.4 88.9 86.8 -2.1
Assault with the intent to inflict grievous bodily harm 36.5 34.3 30.1 28.5 30.9 31.9 32.4 33.0 32.6 31.6 -1.0
Common assault 407.5 405.0 387.0 370.2 352.4 342.1 337.3 332.8 305.5 289.9 -15.6
Common robbery 384.1 387.3 360.8 348.1 326.8 311.6 298.4 300.1 280.2 270.7 -9.5
CONTACT CRIMES ( CRIMES AGAINST THE PERSON)
RATIO: CONTACT CRIMES ( CRIMES AGAINST THE PERSON)

RSANational Overview – April to March
186
CRIME CATEGORY 2008/2009 2009/2010 2010/2011 2011/2012 2012/2013 2013/2014 2014/2015 2015/2016 2016/2017 2017/2018 Case Diff % Change
Rape 46 647 48 259 48 158 47 069 48 408 45 349 43 195 41 503 39 828 40 035 207 0,5%
Sexual Assault 6 396 6 629 7 006 7 194 6 967 6 597 6 087 6 212 6 271 6 786 515 8,2%
Attempted Sexual Offences 3 808 3 811 3 599 3 535 3 293 2 913 2 641 2 573 2 073 2 066 -7 -0,3%
Contact Sexual Offences 12 346 8 293 6 158 2 741 2 220 1 821 1 694 1 607 1 488 1 221 -267 -17,9%
Total Sexual Offences 69 197 66 992 64 921 60 539 60 888 56 680 53 617 51 895 49 660 50 108 448 0,9%
Rape 94,0 95,9 94,4 90,9 92,2 85,1 79,8 75,5 71,3 69,4 -2,0
Sexual Assault 12,9 13,2 13,7 13,9 13,3 12,4 11,2 11,3 11,2 11,8 0,5
Attempted Sexual Offences 7,7 7,6 7,1 6,8 6,3 5,5 4,9 4,7 3,7 3,6 -0,1
Contact Sexual Offences 24,9 16,5 12,1 5,3 4,2 3,4 3,1 2,9 2,7 2,1 -0,5
Carjacking 14 856 13 852 10 541 9 417 9 931 11 180 12 773 14 602 16 717 16 325 -392 -2,3%
Robbery at residential premises 18 438 18 786 16 889 16 766 17 950 19 284 20 281 20 820 22 343 22 261 -82 -0,4%
Robbery at non-residential premises 13 885 14 504 14 637 15 912 16 343 18 573 19 170 19 698 20 680 20 047 -633 -3,1%
Robbery of cash in transit 386 358 290 182 145 145 119 137 152 238 86 56,6%
Bank robbery 102 93 39 35 7 21 17 6 3 13 10 333,3%Truck hijacking 1 437 1 412 999 821 943 991 1 279 1 184 1 183 1 202 19 1,6%
SOME SUBCATEGORIES OF AGGRAVATED ROBBERY
Total Sexual Offences
RATIO: Total Sexual Offences

RSANational Overview – April to March
187
CRIME CATEGORY 2008/2009 2009/2010 2010/2011 2011/2012 2012/2013 2013/2014 2014/2015 2015/2016 2016/2017 2017/2018 Case Diff % Change
CONTACT-RELATED CRIMES
Arson 6 445 6 304 6 157 5 996 5 665 5 458 5 127 4 903 4 321 3 869 -452 -10,5%
Malicious damage to property 131 469 129 343 122 814 119 907 119 026 117 983 120 662 119 901 116 409 111 492 -4 917 -4,2%
Total Contact-Related Crimes 137 914 135 647 128 971 125 903 124 691 123 441 125 789 124 804 120 730 115 361 -5 369 -4,4%
PROPERTY-RELATED CRIMES
Burglary at non-residential premises 69 829 71 544 68 907 69 902 73 492 73 464 74 358 75 008 75 618 71 195 -4 423 -5,8%
Burglary at residential premises 245 465 255 278 246 612 244 667 261 319 259 784 253 716 250 606 246 654 228 094 -18 560 -7,5%
Theft of motor vehicle and motorcycle 75 630 71 449 64 162 58 800 58 102 56 645 55 091 53 809 53 307 50 663 -2 644 -5,0%
Theft out of or from motor vehicle 108 909 120 054 122 334 129 644 138 956 143 801 145 358 139 386 138 172 129 174 -8 998 -6,5%
Stock-theft 27 255 29 428 26 942 27 611 26 465 24 534 24 965 24 715 26 902 28 849 1 947 7,2%
Total Property-Related Crimes 527 088 547 753 528 957 530 624 558 334 558 228 553 488 543 524 540 653 507 975 -32 678 -6,0%
OTHER SERIOUS CRIMES
All theft not mentioned elsewhere 386 858 360 120 361 222 370 916 356 847 363 517 360 541 340 372 328 272 302 656 -25 616 -7,8%
Commercial crime 75 166 82 414 85 646 85 570 89 138 76 744 67 830 69 917 73 550 73 277 -273 -0,4%
Shoplifting 80 713 88 568 78 326 71 810 71 267 70 487 71 327 68 786 67 454 62 180 -5 274 -7,8%
Total Other Serious Crimes 542 737 531 102 525 194 528 296 517 252 510 748 499 698 479 075 469 276 438 113 -31 163 -6,6%
Total 17 Community Reported Serious Crimes 1 885 881 1 884 430 1 816 350 1 800 758 1 809 001 1 803 991 1 795 947 1 770 626 1 738 980 1 662 815 -76 165 -4,4%
CRIME DETECTED AS A RESULT OF POLICE ACTION
Illegal possession of firearms and ammunition 13 918 14 430 14 385 14 372 14 813 15 362 15 116 14 772 16 134 17 558 1 424 8,8%
Drug-related crime 116 949 134 687 150 561 176 218 206 721 260 596 266 902 259 165 292 689 323 547 30 858 10,5%
Driving under the influence of alcohol or drugs 56 121 62 904 66 645 69 410 71 025 69 725 68 561 76 159 75 034 86 160 11 126 14,8%
Sexual Offences detected as a result of police action 0 0 0 2 726 4 175 4 720 6 340 5 830 6 164 6 701 537 8,7%
Total Crime Detected As A Result Of Police Action 186 988 212 021 231 591 262 726 296 734 350 403 356 919 355 926 390 021 433 966 43 945 11,3%

Thank you