crime reduction strategy
TRANSCRIPT

CRIME REDUCTION STRATEGY
Acting Officer In Charge Inspector Brent Mundle
Kelowna RCMP
1
November 14th, 2016

2016-2019 Crime Reduction Strategy
2016-2019 CRIME REDUCTION STRATEGY
2
The multi-faceted Crime Reduction Strategy for 2016-2019 was released and strides are being made to meet benchmarks and goals established.

2016-2019 Crime Reduction Strategy
GOAL #1 TAKING A PROACTIVE APPROACH TO CRIME
GOAL #2TO WORK WITH PARTNER AGENCIES FOR MORE EFFECTIVE POLICING
GOAL #3 TO MAXIMIZE THE EFFECTIVENESS OF RESOURCES USING AN
INTELLIGENCE-LED MODEL
GOAL #4 LEVERAGING EFFECTIVE COMMUNICATIONS
3
Crime Reduction Strategy
2016-2019 Crime Reduction Strategy
GOAL #1 TAKING A PROACTIVE APPROACH TO CRIME
Summer Bike Patrol
Bait Bicycle Program
Project 529
Don’t Be An Easy Target Campaign
Inadmissible Patrons Policy Initiative
4

2016-2019 Crime Reduction Strategy
GOAL #2TO WORK WITH PARTNER AGENCIES FOR MORE
EFFECTIVE POLICING
Bylaw Enforcement Collaboration
Child Advocacy Centre Initiative
Gratitude Project
Interior Health
Mental Health Worker and RCMP Partnership
5
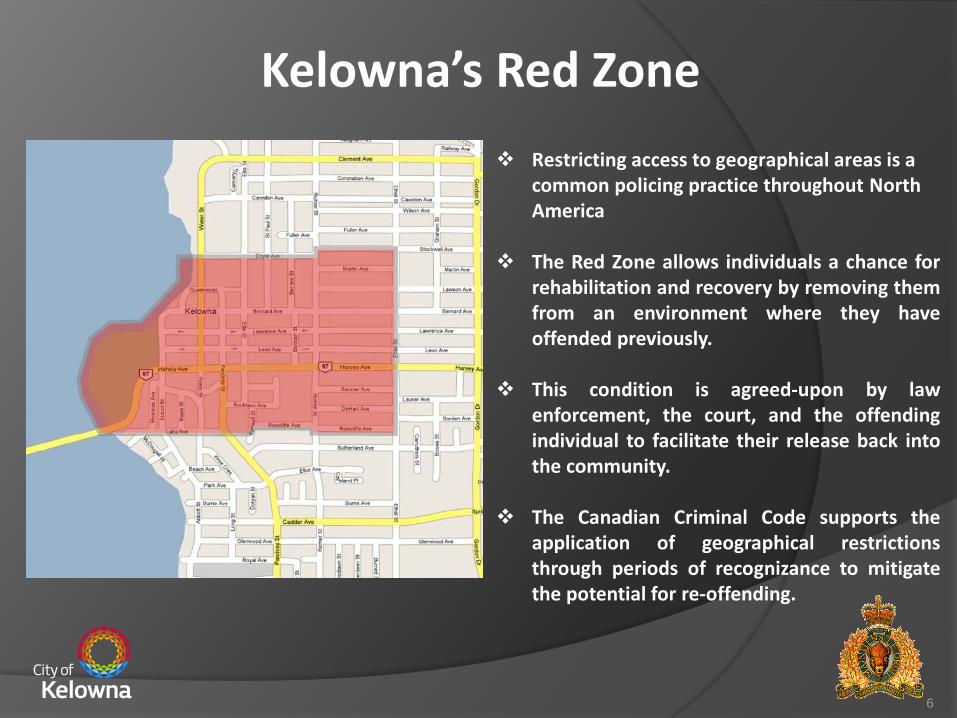
Restricting access to geographical areas is a common policing practice throughout North America
The Red Zone allows individuals a chance forrehabilitation and recovery by removing themfrom an environment where they haveoffended previously.
This condition is agreed-upon by lawenforcement, the court, and the offendingindividual to facilitate their release back intothe community.
The Canadian Criminal Code supports theapplication of geographical restrictionsthrough periods of recognizance to mitigatethe potential for re-offending.
6
Kelowna’s Red Zone

2016-2019 Crime Reduction Strategy
GOAL #3 TO MAXIMIZE THE EFFECTIVENESS OF RESOURCES
USING AN INTELLIGENCE-LED MODEL
CompStat
Intelligence Analysts
Prolific Offender Program
RDCO Alarm Strategy
7

2016-2019 Crime Reduction Strategy
GOAL #3 TO MAXIMIZE THE EFFECTIVENESS OF RESOURCES
USING AN INTELLIGENCE-LED MODEL
8

2016-2019 Crime Reduction Strategy 9
HWY 97 CORRIDOR EXAMPLE:
Elevated number of commercial break and enters in the Spring of 2016
Crime analysis used as a means to identify where crime was happening and who was committing these crimes
Implementation of multiple strategies to address re-occurring crime

2016-2019 Crime Reduction Strategy 10
51 Commercial B&Es in the Hwy 97 Corridor between April 01, 2016 – June 30, 2016
Strategies to combat the B&Es:- Targeting offenders operating within the hotspot areas using both overt and covert techniques- Working with businesses to improve security- Flooding hotspots with marked police vehicles and uniformed members
Results:
53% reduction in Commercial B&Es in this specified area
24 Commercial B&Es in the Hwy 97 Corridor between July 01, 2016 – September 30, 2016
2016-2019 Crime Reduction Strategy
GOAL #4 LEVERAGING EFFECTIVE COMMUNICATIONS
Media
Digital Signage
Don’t Be An Easy Target Campaign
Crime Stoppers
Publishing Crime Maps
11
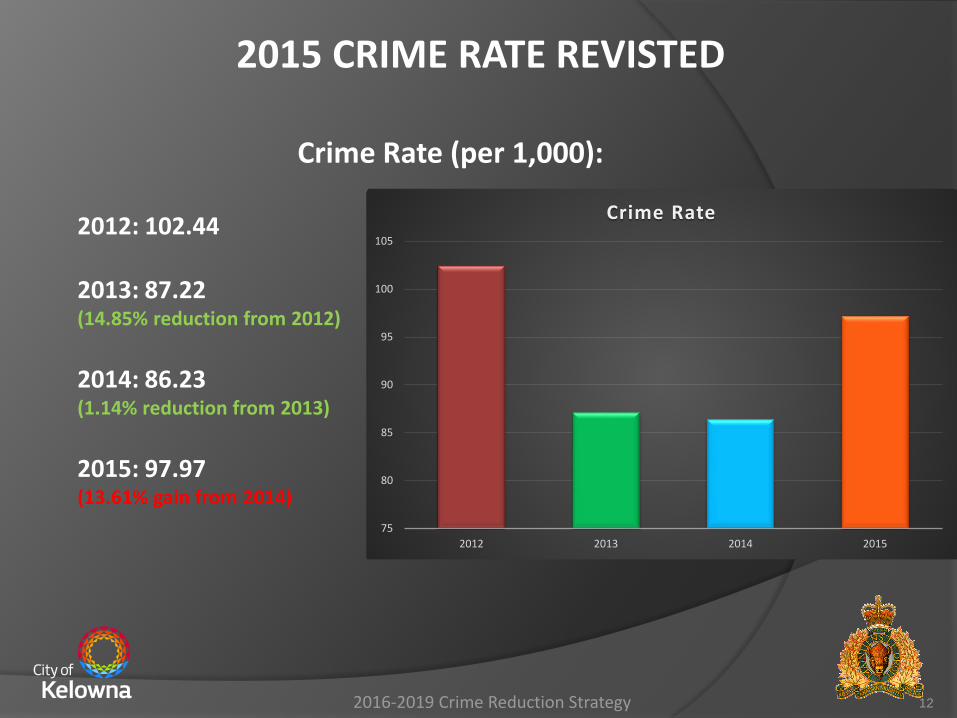
Crime Rate (per 1,000):
2012: 102.44
2013: 87.22 (14.85% reduction from 2012)
2014: 86.23 (1.14% reduction from 2013)
2015: 97.97 (13.61% gain from 2014)
2015 CRIME RATE REVISTED
12
75
80
85
90
95
100
105
2012 2013 2014 2015
Crime Rate
2016-2019 Crime Reduction Strategy

2016-2019 Crime Reduction Strategy 13
Calls for service have increased 8.87% in 2016 compared to the same period in 2015; an increase of 3908 calls.
2012 2013 2014 2015 2016Calls for service 39361 40120 40449 40157 44065
37000
38000
39000
40000
41000
42000
43000
44000
45000
CALLS FOR SERVICE(YEAR TO SEPT. 30th)
TRENDS IN 2016

2016-2019 Crime Reduction Strategy 14
TRENDS IN 2016
Person Offences
Other CC
Property Offences
0
1000
2000
3000
4000
5000
6000
7000
2012 2013 2014 2015 2016
14301059 999 1117 1155
2042 1887 1956 2110
2646
5978
5117 4990
5612
6778
NU
MB
ER O
F O
FFEN
CES
CRIMINAL CODE OFFENCES BY TYPE(YEAR TO SEPT. 30th)
2016-2019 Crime Reduction Strategy 15
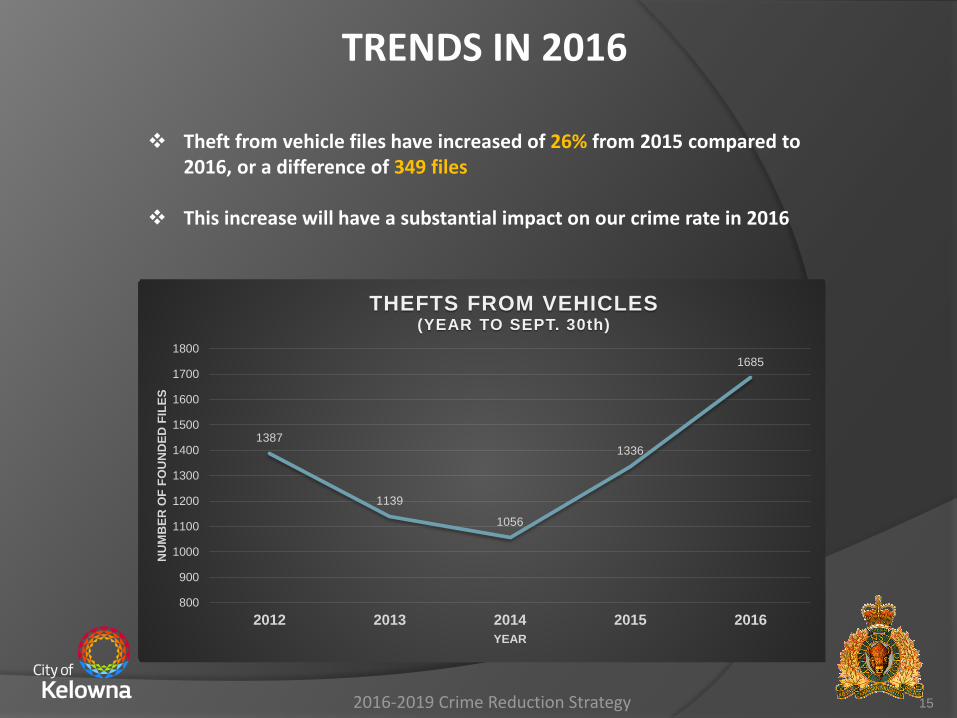
Theft from vehicle files have increased of 26% from 2015 compared to 2016, or a difference of 349 files
This increase will have a substantial impact on our crime rate in 2016
TRENDS IN 2016
1387
1139
1056
1336
1685
800
900
1000
1100
1200
1300
1400
1500
1600
1700
1800
2012 2013 2014 2015 2016
NU
MB
ER O
F FO
UN
DED
FIL
ES
YEAR
THEFTS FROM VEHICLES(YEAR TO SEPT. 30th)

2016-2019 Crime Reduction Strategy 16
0.00
0.20
0.40
0.60
0.80
1.00
1.20
1.40
1.60
1.80
Sep Oct
Nov
Dec Jan
Feb
Mar Apr
May Jun
Jul
Aug
Sep Oct
Nov
Dec Jan
Feb
Mar Apr
May Jun
Jul
Aug
Sep Oct
Nov
Dec Jan
Feb
Mar Apr
May Jun
Jul
Aug
2013 2014 2015 2016
THEFT FROM VEHICLE(est. rate per 1,000)
KELOWNA DETACHMENT ALL SE RCMP

2016-2019 Crime Reduction Strategy 17
Theft from bicycle files have increased of 43% from 2015 compared to 2016, or a difference of 164 files
This increase will have a substantial impact on our crime rate in 2016
TRENDS IN 2016
301
334
273
384
548
200
250
300
350
400
450
500
550
600
2012 2013 2014 2015 2016
NU
MB
ER O
F FO
UN
DED
FIL
ES
YEAR
THEFTS OF BICYCLES(YEAR TO SEPT. 30th)

2016-2019 Crime Reduction Strategy 18
0.00
0.10
0.20
0.30
0.40
0.50
0.60
0.70
Sep Oct
Nov
Dec Jan
Feb
Mar Apr
May Jun
Jul
Aug
Sep Oct
Nov
Dec Jan
Feb
Mar Apr
May Jun
Jul
Aug
Sep Oct
Nov
Dec Jan
Feb
Mar Apr
May Jun
Jul
Aug
2013 2014 2015 2016
BICYCLE THEFT(est. rate per 1,000)
KELOWNA DETACHMENT ALL SE RCMP
TRENDS IN 2016

2016-2019 Crime Reduction Strategy 19
QUESTIONS?