crime rate data analysis in los angeles
TRANSCRIPT

Crime rate data analysis in Los Angeles
24th Annual Student Symposium
on Research, Scholarship and Creative Activity
Friday February 26th,2016
Presented by,Sontinani, Ravi Teja Donda, Ram Dharan Puli, Sridhar Reddy Devabathini, Sri Chakra Sanjay
Advised by, Dr Jongwook Woo

Synopsis
• Introduction
•Microsoft Azure HDInsight Cluster Details
• Raw data projection
• Detailed analysis of Crime Data
• Conclusion
• Data set & Github URL

Introduction
• Day to day exponential growth of crimes
• US holds 44th position with 50.15% crime index in 2014
• Despite of having technology
• Total reported crimes in USA are 94.76 million in 2014

Specifications of Data Set
• Data is collected from Los Angeles Police Department (LAPD)
• Offenses like Criminal, Vandalism, Burglary, Assault, Traffic and Theft
occurred in 2014 are analysed.
•File Size – 41MB
•Number of Files – 1
•File Format – CSV (Comma Separated Values)
•Total Number of offenses – 2.44 million

Microsoft Azure HDInsight Cluster Details
• Number of data nodes - 2
• CPU – 4cores
•Memory – 14GB
• Operating system - Windows server 2012
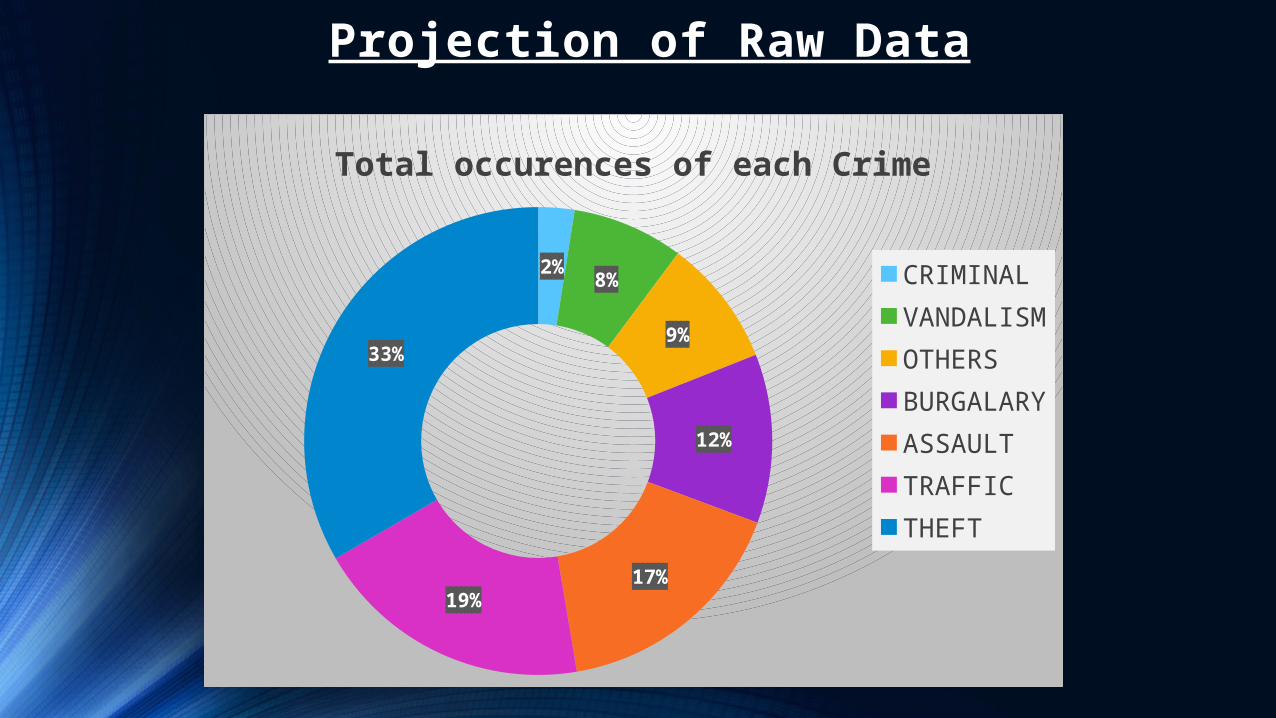
Projection of Raw Data
2%8%
9%
12%
17%19%
33%
Total occurences of each Crime
CRIMINALVANDALISMOTHERSBURGALARYASSAULTTRAFFICTHEFT

1 2 3 4 5 6 7 8 9 10 11 120
5000
10000
15000
20000
25000
19169
17384
19730
19413
20645
20494
21480
21280
21287
2166919844
21355
No.of Crimes per Month
Total No.of Crimes in 2014
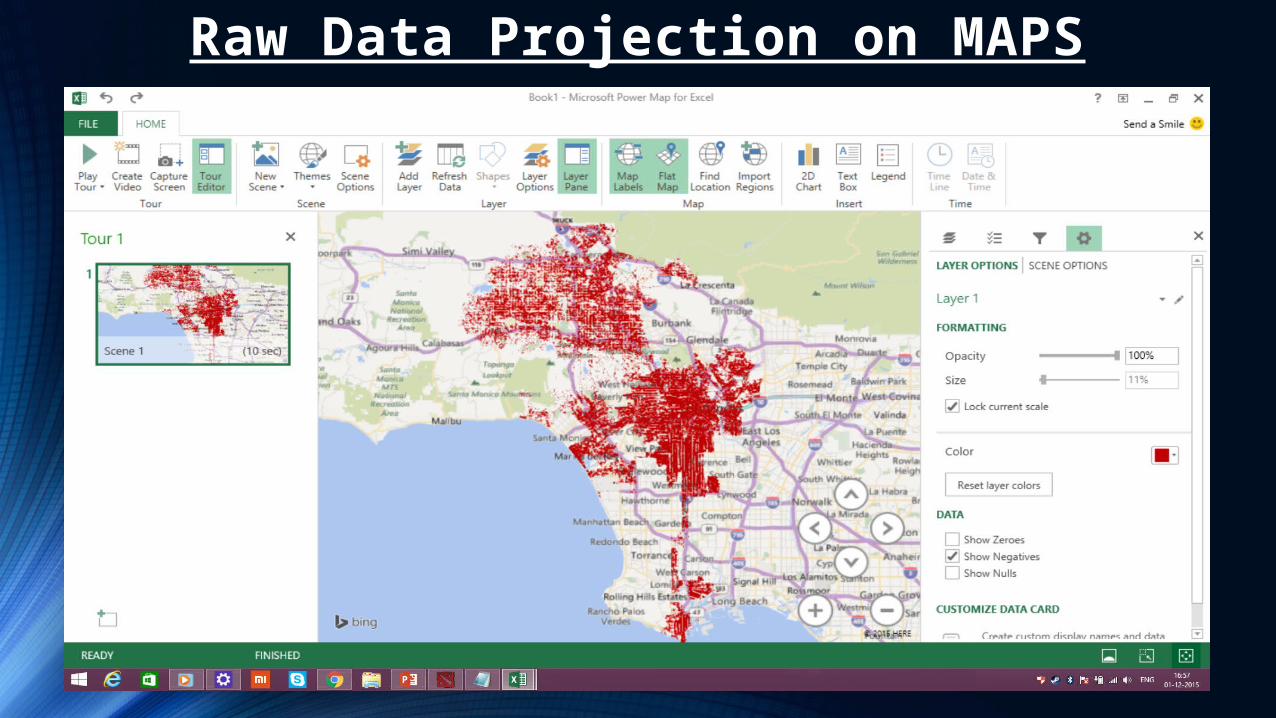
Raw Data Projection on MAPS

Query for accurate ‘DISTANCE’ calculationINSERT OVERWRITE TABLE LOCATION_VALUES Select cast(regexp_replace(split(location_2,',')[0],'\\(','') as double),
cast(regexp_replace(split(location_2,',')[1],'\\)','') as double),
dr_no,
2 * asin(
sqrt(cos(radians(34.0667)) *
cos(radians(cast(regexp_replace(split(location_2,',')[0],'\\(','') as double))) *
pow(sin(radians((-118.1678 - cast(regexp_replace(split(location_2,',')[1],'\\)','') as double))/2)), 2)
+pow(sin(radians((34.0667 - cast(regexp_replace(split(location_2,',')[0],'\\(','') as double))/2)), 2)) )*3956 from LAPD_CRIME_DATA;

No.of Crimes for every 5miles from CSULA
0- 5 5-10 10-15 15-20 20-25 25-30 30-35 35-40 >400
10000
20000
30000
40000
50000
60000
70000
80000
20062
77559
49075 46935
33974
14321
6 1 1
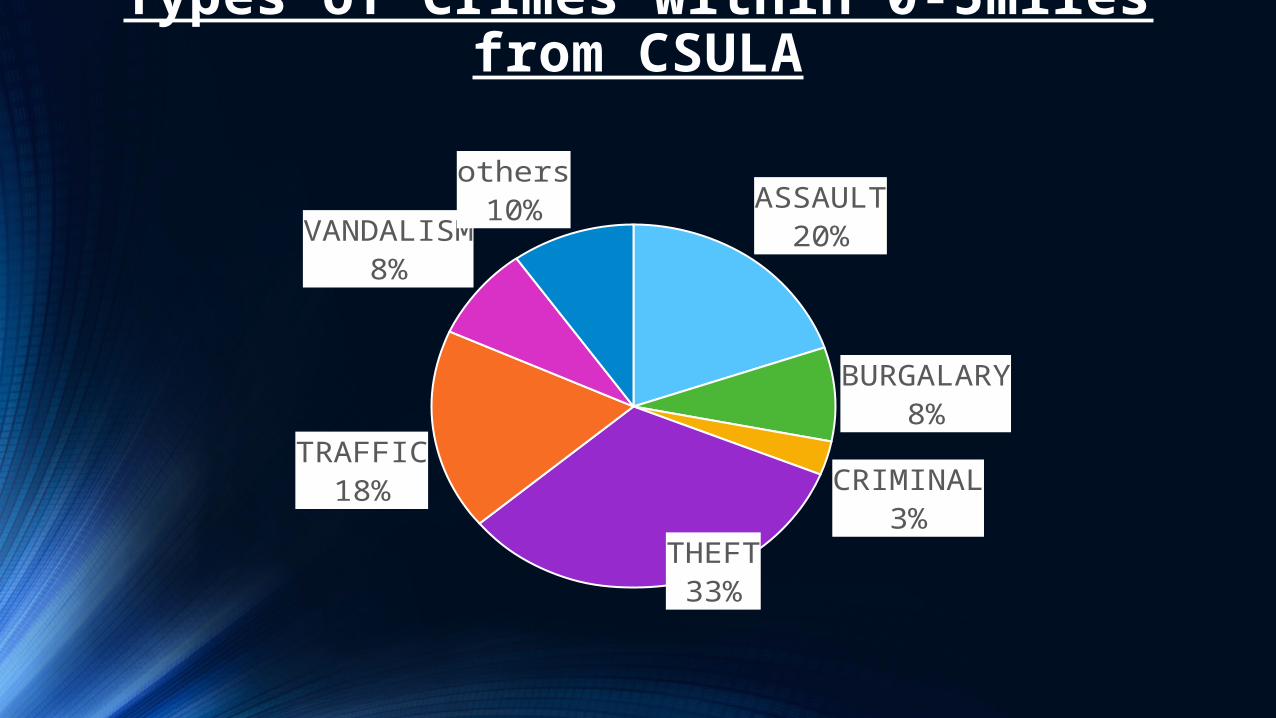
Types of Crimes within 0-5miles from CSULA
ASSAULT20%
BURGALARY8%
CRIMINAL3%
THEFT33%
TRAFFIC18%
VANDALISM8%
others10%

Mapping of Crimes Occurred within 5miles from CSULA

ASSAULT20%
BURGALARY11%
CRIMINAL3%
THEFT32%
TRAFFIC18%
VANDALISM8%
others9%
Types of Crimes within 5-10miles from CSULA
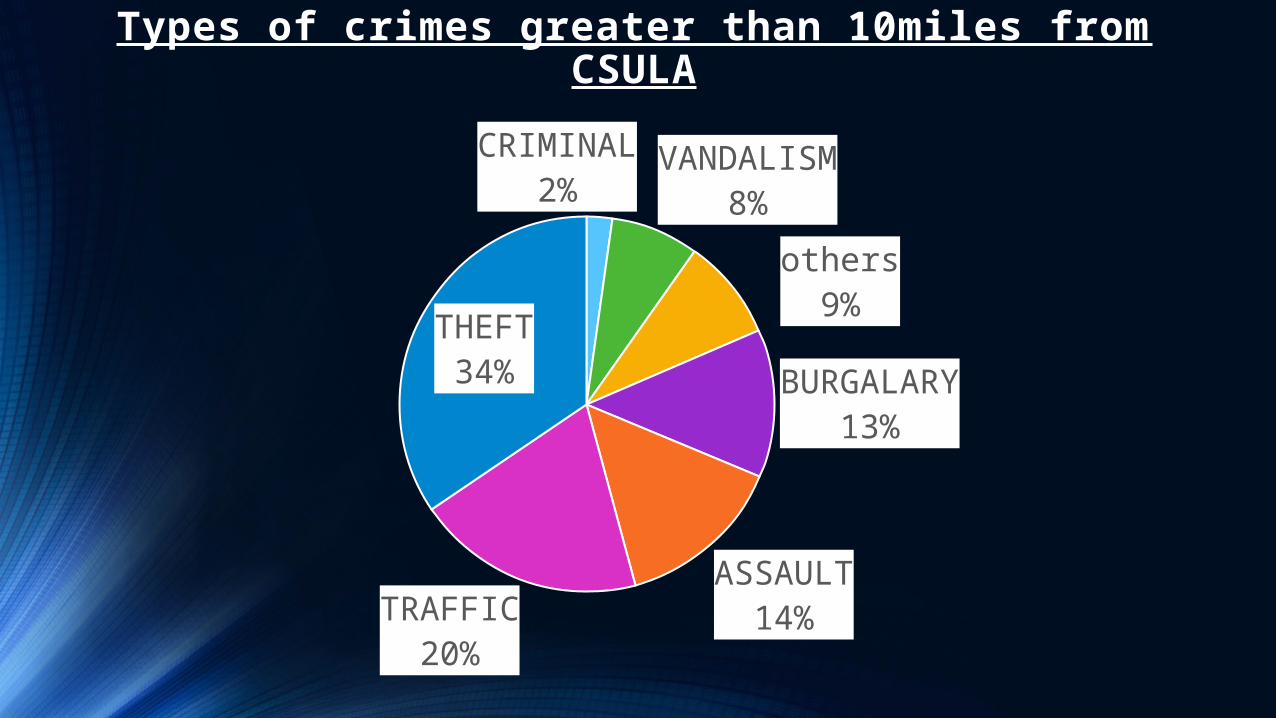
Types of crimes greater than 10miles from CSULACRIMINAL
2% VANDALISM8%
others9%
BURGALARY13%
ASSAULT14%
TRAFFIC20%
THEFT34%

HQL Query when ‘DISTANCE’ is a parameter

No.of crimes per area in LA
No.of Crimes in LA0
2000400060008000
1000012000140001600018000
1698
210
307
1084
087
65 1002
786
74 1090
612
016
1295
311
538
1200
811
804
1350
510
417
1247
6 1587
110
802
1193
910
886
1036
810
666
77th Street Central Devonshire Foothill HarborHollenbeck Hollywood Mission N Hollywood NewtonNortheast Olympic Pacific Rampart SoutheastSouthwest Topanga Van Nuys West LA West ValleyWilshire

77th S...
Central
Devon...
Harbor
Holle...
Mission
N Hol... Ne
North... Oly
Pacific
RamSo
uth...
South... To
pVan ... Wes
0
1000
2000
3000
4000
5000
6000
7000
8000
9000
2
6007
1 1
8483
1 1649
4637
1 5 249 1 8 13 1 2
No.of crimes per Area within 5miles from CSULA
ASSAULT
BURGALARY
CRIMINAL
THEFT
TRAFFIC
VANDALISM
others0
500
1000
1500
2000
2500
3000
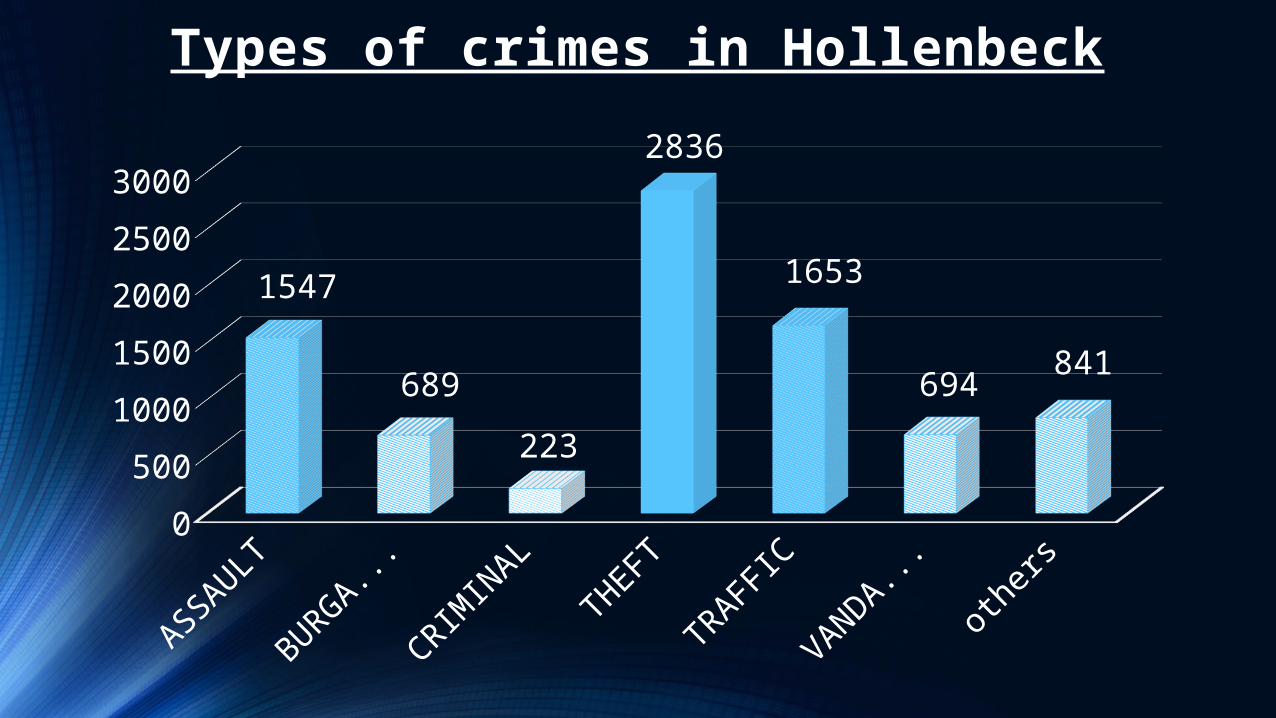
1547
689
223
2836
1653
694841
Types of crimes in Hollenbeck

Total No.of Crimes for every 2hours in LA
00:00-
02:00
02:00-
04:00
04:00-
06:00
06:00-
08:00
08:00-
10:00
10:00-
12:00
12:00-
14:00
14:00-
16:00
16:00-
18:00
18:00-
20:00
20:00-
22:00
22:00-
24:00
0
5000
10000
15000
20000
25000
30000
35000
18352
8657
6517
15059
19597
28592
22823
26114
28130
27874
25175
16860

00:00-
02:00
02:00-
04:00
04:00-
06:00
06:00-
08:00
08:00-
10:00
10:00-
12:00
12:00-
14:00
14:00-
16:00
16:00-
18:00
18:00-
20:00
20:00-
22:00
22:00-
24:00
0
500
1000
1500
2000
2500
1534
761 646
13351533
2158
18322072
2290 22942132
1475
No.of crimes for every 2hrs within 5miles from CSULA
ASSAULT
BURGALARY
CRIMINAL
THEFT
TRAFFIC
VANDALISM
others0
200400600800
10001200140016001800
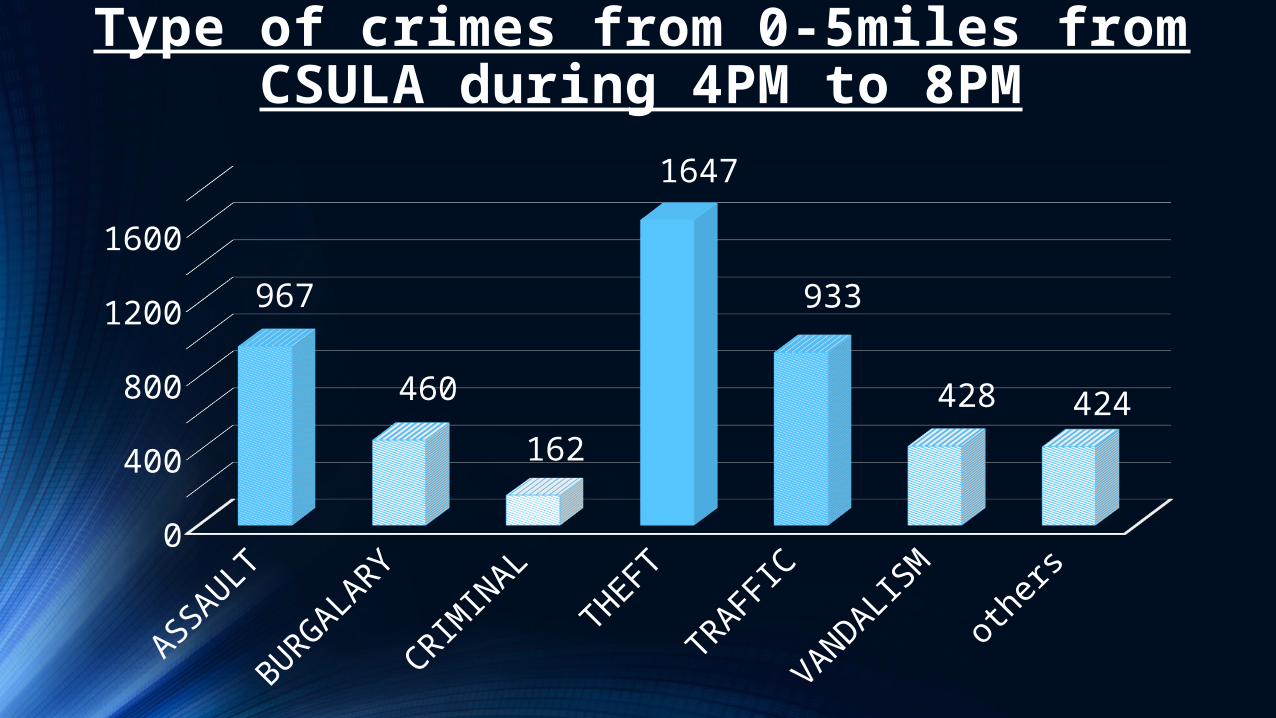
967
460
162
1647
933
428 424
Type of crimes from 0-5miles from CSULA during 4PM to 8PM

Conclusion
• Crime rate is higher in the heart of the city than in other regions in LA
• Average crime rate in the year 2014 is 20312.5
• Nearly 119 kinds of crimes are reported in 2014
•Microsoft Azure allowed us to process the entire data with minimal cost
• Huge storage space in cloud made Hadoop to store the data without any data loss
• HQL made it simple to extract the data from HDFS

Github & Data Set details
• https://github.com/Ramdharan/Lapd_Crime_Data_Analysis_2014
• https://data.lacity.org/A-Safe-City/LAPD-Crime-and-Collision-Raw-Data-2014/eta5-h8qx