crime in south africa: a country and cities profile of the average person falling victim to crime is...
TRANSCRIPT
Crime in South Africa: A country and cities profile
Martin Schönteich & Antoinette Louw, Crime and Justice Programme, Institute for Security Studies
Occasional Paper No 49 - 2001
INTRODUCTION Levels of recorded crime in South Africa began to increase in the mid-1980s — dramatically so in the early 1990s. Expectations that violent crime would decrease after 1994 have not materialised. While levels of recorded crime stabilised between 1995 and 1996, crime has been increasing since then. The annual increase in the overall number of recorded crimes was greater in 1999 than in any previous year after 1994. Violent crimes increased at a greater rate than the total over this period. According to the latest available statistics at the time of writing, levels of recorded crime continued to increase during much of the first half of 2000. Crime trends in South Africa’s major cities have followed a similar pattern as those nationally since 1994. A comparison of crime rates shows that Johannesburg has the highest volume of serious crime, followed by Pretoria, Cape Town and Durban. Crime levels in all these urban centres with the exception of Johannesburg increased between 1994 and 1999. In Johannesburg, overall crime levels decreased marginally, as did levels of property crimes and some violent crimes such as car hijacking. Of all the cities covered in this analysis, violent crimes increased at a faster rate than the national total over this period in Pretoria only. Why does South Africa have consistently high levels of crime? There is no single satisfactory answer to this question, but rather a number of explanations which help to explain the high levels of crime plaguing the country. Such explanations consider the impact on levels of serious crime of the country’s ongoing political and socio-economic transition, the connection between the country’s violent past and contemporary criminal behaviour, the impact of the proliferation of firearms, the growth in organised crime, changes in the demographic composition of the country, and the consequences of a poorly performing criminal justice system. While levels of crime are high in South Africa, crime does not affect all people uniformly. The likelihood of the average person falling victim to crime is strongly influenced by, among other things, his or her age, income, place of residence, and circle of friends and acquaintances. At greatest risk of becoming victims of interpersonal violent crime are the young, the poor and township residents. Conversely, middle-aged and wealthy suburban residents have a greater than average chance of being victims of serious property crimes. The risk of violent crimes aimed at property such as robbery and car hijacking is fairly evenly spread throughout the population. HISTORICAL BACKGROUND Measuring crime It is difficult to measure crime accurately over sustained periods. For crime to make it onto the official police records two things need to happen. First, victims or witnesses must report the incident to the police. Second, the police must record it in their records. As many crimes fail to make it over these hurdles, official statistics significantly undercount the number of crimes
that are committed. Victimisation surveys — which ask a random sample of the population whether they have been victims of crime — are estimated to uncover between 60% and 70% more crime than that reported by official statistics (for more on the nature of police crime statistics and their accuracy, see appendix 1).1 Historically, the collection of statistics in South Africa was further complicated by the divide between the police and the majority of the public, and the existence of different policing agencies. South African Police (SAP) crime figures, for example, excluded crimes committed and reported in the erstwhile TBVC states and KwaZulu-Natal.2 This implies a substantial proportion of crime which was not collected by the SAP’s statistical net before 1994.3 Official crime statistics before 1994 should consequently be treated with some caution. Violent past A multitude of apartheid and Draconian internal security laws were placed on the South African statute books between the mid-1950s and late-1980s. Behaviour which is considered normal in a free society was criminalised. Politically motivated strikes; the actions of people of one race working, living or playing in areas reserved for people of another race; interracial sex; or, the possession of ‘subversive’ literature — from the Karma Sutra to Marx’s Das Kapital — were, at one time or another, a criminal offence. As the legitimacy of the South African government at the time declined, and opposition to its policies intensified, the distinction between political and criminal behaviour became blurred. Apartheid offences were classified as crimes. The state’s security forces committed crimes, and showed disdain for the rule of law, in their zeal to clamp down on the government’s political opponents. Those engaged in ‘the struggle’, particularly from the mid-1980s onwards, justified forms of violence as legitimate weapons against the system. Actions which were violent crimes were often seen and justified by their perpetrators as a legitimate defence against political opponents and enemies. The result was a society in which the use of violence to achieve political and personal aims became widespread.4 In the 20-year period up to 1993, recorded crime, measured on a per capita basis, increased by about 35%. While crime levels did not change much in the 1970s, they increased thereafter — dramatically so in the early 1990s.5 Crime tends to increase during periods of political transition coupled with instability and violence. During periods of instability, routine policing activities are diverted towards controlling violence, and crime consequently increases. Community bonds forged in response to state aggression have an inhibiting effect on certain types of crime. In South Africa, anti-crime campaigns in the townships in the 1980s were launched by local street committees and civic organisations. The post-1990 negotiation period broke these linkages: state repression weakened, and transition brought intracommunity conflict.6 Violence also weakens social controls, producing marginalised groups reliant on crime for a livelihood. In South Africa, this led to an increase in levels of crime as disaffected individuals — notably township youth — became involved in criminal activity.7 Moreover, much of the political instability in the post-1990 period was recorded in the crime figures explaining, for example, the rapid increase in murder between 1990 and 1993. CRIME AFTER 1994 The expectation which many had in 1994 that crime — especially violent crime — would decrease has not materialised. Crime figures for 1999 indicate that the number of recorded crimes is at an all time high.8 The increase in the overall number of recorded crimes, including the number of violent crimes, was greater between 1998 and 1999 than in any previous year after 1994.9 During the first three years after South Africa’s political transition in 1994, overall crime levels stabilised, albeit at very high levels of especially violent crime. The number of recorded crimes increased by 3% between 1994 and 1996. Over a similar period, South Africa’s population increased by an estimated 4%.
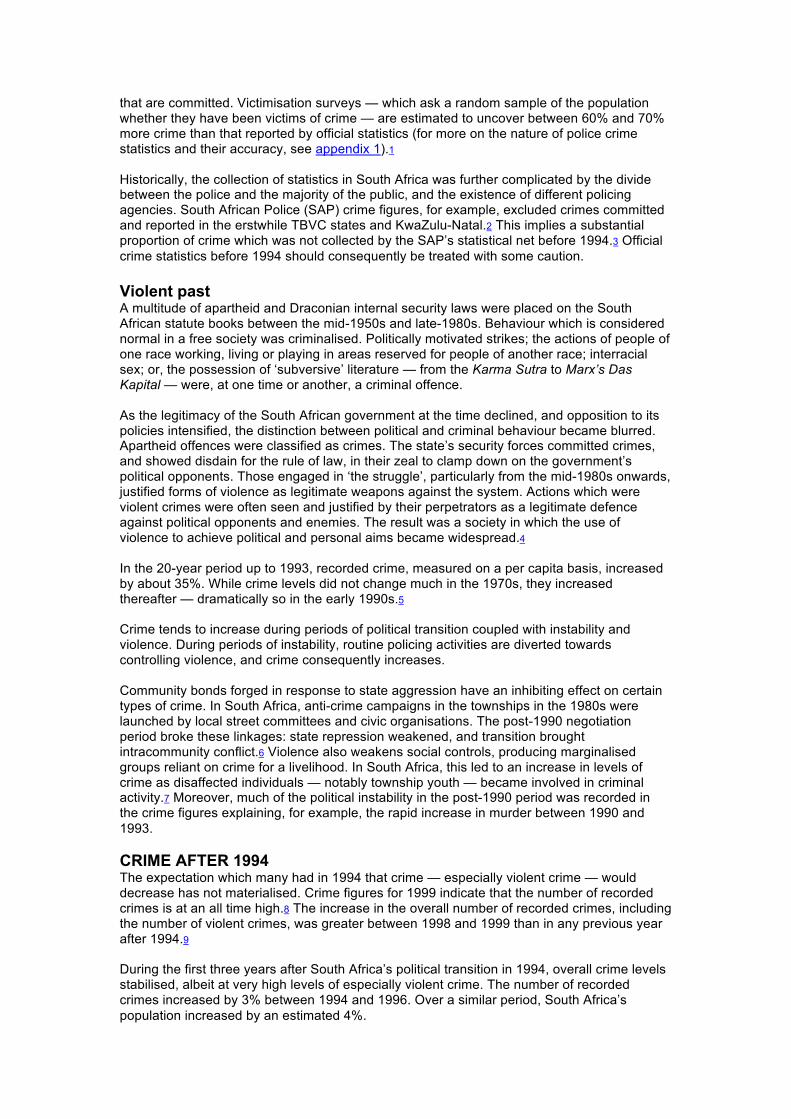
Escalating rate of recorded crime After 1996, levels of recorded crime, measured from one year to the next, increased at an escalating rate. While crime levels decreased fractionally between 1995 and 1996, and increased by only 1% between 1996-97, the increase was 5% in 1997-98, reaching a high of 7% in 1998-99 (figure 1). Figure 1: Percentage change in number of crimes recorded, 1994/95-1998/99
[Source: SAPS CIAC] Not all crimes increased or decreased at the same rate between 1994 and 1999. Common robbery experienced the greatest increase of 121%. Residential burglary, assault with the intent to commit grievous bodily harm, rape and car hijacking all experienced increases of over 20%. Robbery with aggravating circumstances increased by 15% — approximately the same rate as the 20 most serious and prevalent crimes taken together. The number of recorded murders and car thefts decreased between 1994 and 1999 (figure 2). Figure 2: Percentage change in selected crimes recorded between 1994 and
1999
[Source: SAPS CIAC] The increase in the number of recorded common robberies and car hijackings after 1994 provides one explanation why most South Africans are feeling increasingly unsafe because of crime. Common robbery is a prevalent crime, affecting a large number of people every year. Unlike most other violent crimes, common robbery such as muggings and bag-snatchings can

happen to anyone walking along a public street or in a crowded shopping centre. Common robbery is a crime against which relatively little can be done to reduce one’s chances of victimisation. Car hijacking, while less prevalent, often involves a high degree of violence and receives considerable media coverage. The public is consequently more aware of car hijackings in their city or suburb than, for example, rape or burglaries. Violent crime Unlike overall recorded crime levels which decreased slightly in 1995-96, recorded violent crime has increased consistently since 1994.10 In 1994 some 618 000 incidents of violent crime were recorded, increasing to 751 000 incidents in 1999. Between 1998 and 1999, the number of recorded violent crimes increased by 9% — more than any other crime category. Between 1994 and 1999, violent crime increased by 22%. Property crime increased by 15% over the same period, followed by commercial crime (7%), arson and malicious damage to property (7%) (figure 3).11 By global standards, South Africa has high levels of violent crime. In 1999, a third of all crimes recorded by the police in South Africa were violent in nature. In the United States, which is considered to be a relatively violent society, 15% of recorded crimes are violent, while about 6% of recorded crimes in the United Kingdom are violent in nature.
Figure 3: Percentage change in number of crimes recorded, 1998-99 and 1994-99
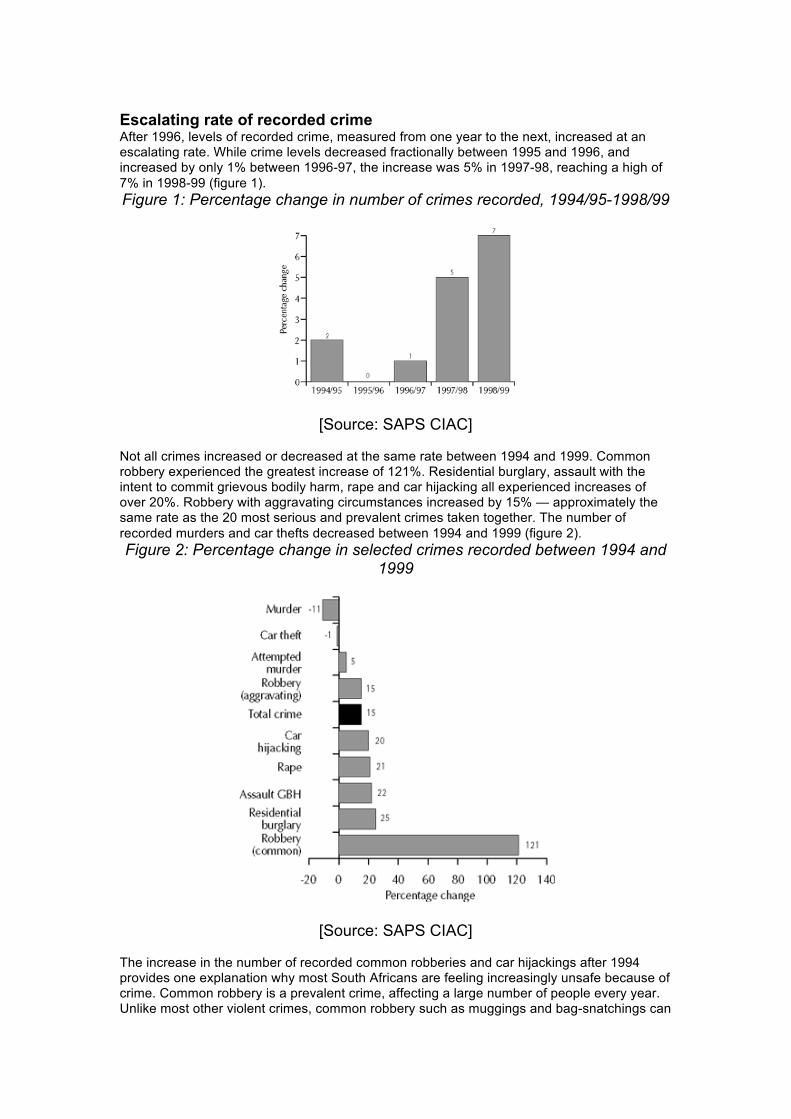
[Source: SAPS CIAC] According to 1997 Interpol statistics, South Africa had the highest per capita rates of murder and rape, the second highest rate of ‘robbery and violent theft’, and the fourth highest rates of ‘serious assault’ and ‘sexual offences’, of the 110 countries of which crime levels are listed by Interpol.12 Crime in 2000 According to the latest available statistics at the time of writing, levels of recorded crime increased during much of the first half of 2000. Measured on a per capita basis (per 100 000 of the population) for the periods January to May for every year from 1994 onwards, crime levels were at their highest in 2000. In the period January to May 2000, some 2 300 crimes were recorded for every 100 000 people living in South Africa, up from 2 187 in 1999 (figure 4). If only violent crimes are measured, the first five months of 2000 also show the highest per capita level for the same five-month period from 1994 onwards. In the period January to May 2000, 755 violent crimes were recorded per 100 000 of the population, compared to 697 per 100 000 over the same period in 1999.13
Figure 4: Number of crimes recorded per 100 000 of the population, January to May 1994-2000
[Source: SAPS CIAC] REASONS FOR HIGH CRIME There is no one satisfactory explanation for South Africa’s high levels of crime — especially the high and increasing levels of violent crime. There are, however, a number of explanations which help to explain South Africa’s consistently high levels of crime since the country’s first non-racial democratic election some seven years ago. Period of transition As pointed out above, there is a link between South Africa’s political transition over the last decade and the growth in the crime rate. Increases in crime in South Africa over the last ten years are consistent with the experiences of other countries undergoing transitions to democracy, which are followed by attempts to consolidate new democratic institutions. As change and democratisation processes proceed, society and its instruments of social control (both formal and informal) are reshaped. The result is that new areas for the development of crime open up.14 The South African transition brought about a restructuring of the criminal justice system, the abolition of a number of laws and the promulgation of new ones. As a result many criminal justice functions have been operationally weakened. Moreover, the experienced personnel working in the system, who were trained in the policing methods of the old authoritarian order, are now unsure how to function effectively within a new legal framework based on the rule of law and a constitutionally entrenched bill of rights. Culture of violence Some explanations for the high rate of violent crime refer to South Africa’s political history, suggesting that families suffered from ‘institutional violence’ for decades through the disruption of their lives by mass removals and migrant labour policies of apartheid. Political violence compounded this disruption of family life. The resultant weakening of the family unit and thus parental control over children may prompt criminal behaviour among the youth. Moreover, while the liberation movements’ strategy of ungovernability was theoretically directed against the apartheid state, it had other destructive effects. In the process of destabilising black local government, leading violent campaigns against black policemen, and urging a people’s war which involved the youth in particular, massive violence was unleashed in black communities which bred a culture of violent lawlessness and a distrust of authority.15 Since 1994, little has been done to reverse these tendencies and to draw young South Africans in particular back into a society governed by the rule of law. ‘Culture of violence’ theories similarly argue that the effects of apartheid coupled with years of political violence and the continued exposure to violence in the home and in the neighbourhood have produced a destructive culture which manifests itself in what the Nedcor Project on Crime, Violence and Investment called ‘murderous intolerance’.16 It also means
that South Africans quickly resort to violence as a means of solving conflicts — whether in the domestic, social or work environment. Proliferation of firearms South Africa is a heavily armed society. According to the police’s Central Firearms Registry, 3.5 million South Africans legally possess some 4.2 million firearms, of which slightly more than half are handguns. It is estimated that a similar number of illegal firearms are circulating in South Africa. South Africa’s porous borders allow arms smugglers to bring large quantities of firearms into the country.17 Because of an oversupply of small arms in the region these sell cheaply, making them accessible to petty criminals and juveniles in South Africa, who frequently use them to commit crimes or resolve personal disputes. Organised crime It is likely that organised crime syndicates are behind a significant number of car hijackings, vehicle thefts, armed robberies (especially cash-in-transit and bank robberies), burglaries of homes in upperclass areas and businesses, commercial crimes and even certain types of shoplifting. While no accurate figures exist, it is likely that organised crime has grown considerably in South Africa since 1994. Organised crime tends to grow rapidly during periods of political transition, when levels of violence are high, leading to state resources being concentrated in certain areas only and gaps emerging in which organised criminal groups may operate.18 Moreover, inadequate border controls, a good transport infrastructure, markets for and sources of contraband such as endangered species products and cannabis (dagga), a good banking system, and a ready supply of trained recruits would have contributed to the growth of organised crime in South Africa.19 Youthful population There is a strong relationship between age and crime. "Probably the most important single fact about crime is that it is committed mainly by teenagers and young adults."20 No national figures are available on the number of crimes committed by young people in South Africa. Conviction figures, however, show that young males are considerably more at risk of being convicted for a wide range of crimes than older males, or females of any age group. For example, during 1995/96 (the latest period for which figures are available from Statistics South Africa), males aged 18 to 20 were more than three times as likely of being convicted of robbery, than males aged over 20. South Africa has a relatively youthful population. According to the last census, a third of the South African population was under the age of 15 years, and 44% was under the age of 20 years in 1996. The numerically largest population segments were those aged 5 to 9 years and 10 to 14 years, each of which made up almost 12% of the total population.21 Over the last five years many children in the 1996 population ‘bubble’ of 5 to 14 year olds will have moved into the crime prone ages of 12 to 19 years. Rapid urbanisation22 It is a world-wide phenomenon that crime rates are higher in cities than in rural areas, with the rate generally increasing according to city size. Most factors associated with high crime rates characterise cities to a greater extent than small towns. Population density, for example, is thought to be associated with crime, in that greater concentrations of people lead to competition for limited resources, greater stress and increased conflict. Factors which characterise urbanisation, such as overcrowding, unemployment and increased consumer demands and expectations are themselves believed to be associated with high crime rates. High levels of gang activity and the availability of firearms are also mainly evident in urban areas and are known to be related to criminal activity.
With the abolition of influx control in the mid-1980s urbanisation rates increased in South Africa — especially in the country’s larger metropolitan areas to which a large number of people were drawn in the search for employment. South Africa is the third most urbanised country in sub-Saharan Africa: 56% of the country’s population is urbanised (up from 46% in 1960 and 52% in 1995). Weak criminal justice system The poor performance of a criminal justice system should not be interpreted as a cause of crime. The primary aim of the criminal justice system is to process cases and offenders speedily and effectively and to hand down appropriate sentences (punishment) to those convicted of an offence. Nevertheless, how well the system functions is important for several reasons:
• A relatively small proportion of people are believed to commit the majority of serious crimes, and especially organised crime. If these perpetrators are apprehended and convicted quickly and effectively, certain crimes can be reduced.
• A functional system helps to deter some potential offenders from committing a crime. • An effective and efficient criminal justice system inspires confidence among victims
and witnesses and encourages them to participate in the future by reducing secondary victimisation and alienation.
• Criminal justice successes — especially if well publicised — are essential for boosting public confidence in the government’s ability to reduce crime and make people feel safer.
South Africa’s criminal justice system is not performing optimally. In 1999, some 2.4 million crimes were recorded by the police and 200 000 crimes ended in the conviction of the perpetrators. While it is true that not all recorded crimes should necessarily result in a conviction (some charges are false, some are fraudulent, cases might be withdrawn by the complainant), the number of convictions in South Africa is low. On average, fewer than 9% of recorded crimes result in the conviction of the perpetrators.23 For some serious crimes, the number of convictions as a proportion of recorded cases is even lower. In 1999, the number was 2% for car hijacking, 3% for aggravated robbery, and 8% for rape. The majority of crime in most societies is committed by a relatively small proportion of criminals. An estimated 10% to 20% of criminals are usually responsible for 80% of all serious crimes. These are professional criminals, and criminals involved in the organised crime milieu and criminal gangs. For a criminal justice system to be successful, it must apprehend, convict and punish most of this core group of repeat offenders. This is not the case in South Africa where fewer than one in ten offenders, whose crimes are recorded, are convicted. RISK OF VICTIMISATION Crime does not affect all people uniformly. The likelihood of the average person falling victim to crime is strongly influenced by, among others, his or her age, income, place of residence, and circle of friends and acquaintances. Age Young people are disproportionately likely to be victims of crime — especially young urban males. Their lifestyles, and the fact that they are less risk adverse than older people (by, for example, frequenting high crime areas late at night), place them at higher than average risk of being victimised by criminals, especially in respect of violent crime. As young people are generally too young to have accumulated much valuable property (eg motor vehicles, houses or furniture), they are less likely to fall victim to property (or non-violent) crime than their elders. The national Victims of Crime Survey found that, of individuals who had experienced at least one violent crime in South Africa in 1997, almost a third were aged between 16 and 25 years. The level of victimisation consistently declines with age. For non-violent crime, the age group 26 to 35 years experienced the highest level of victimisation (30%), after which the level of victimisation declines rapidly with age.24
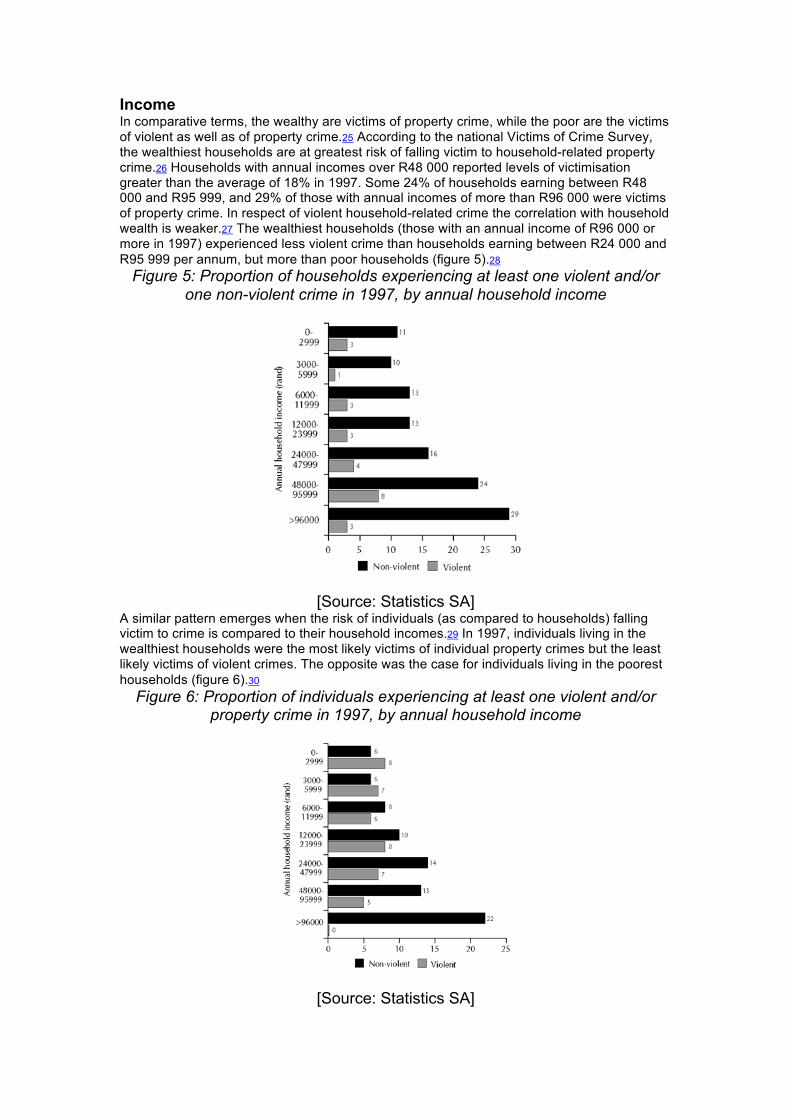
Income In comparative terms, the wealthy are victims of property crime, while the poor are the victims of violent as well as of property crime.25 According to the national Victims of Crime Survey, the wealthiest households are at greatest risk of falling victim to household-related property crime.26 Households with annual incomes over R48 000 reported levels of victimisation greater than the average of 18% in 1997. Some 24% of households earning between R48 000 and R95 999, and 29% of those with annual incomes of more than R96 000 were victims of property crime. In respect of violent household-related crime the correlation with household wealth is weaker.27 The wealthiest households (those with an annual income of R96 000 or more in 1997) experienced less violent crime than households earning between R24 000 and R95 999 per annum, but more than poor households (figure 5).28
Figure 5: Proportion of households experiencing at least one violent and/or one non-violent crime in 1997, by annual household income
[Source: Statistics SA] A similar pattern emerges when the risk of individuals (as compared to households) falling victim to crime is compared to their household incomes.29 In 1997, individuals living in the wealthiest households were the most likely victims of individual property crimes but the least likely victims of violent crimes. The opposite was the case for individuals living in the poorest households (figure 6).30
Figure 6: Proportion of individuals experiencing at least one violent and/or property crime in 1997, by annual household income
[Source: Statistics SA]
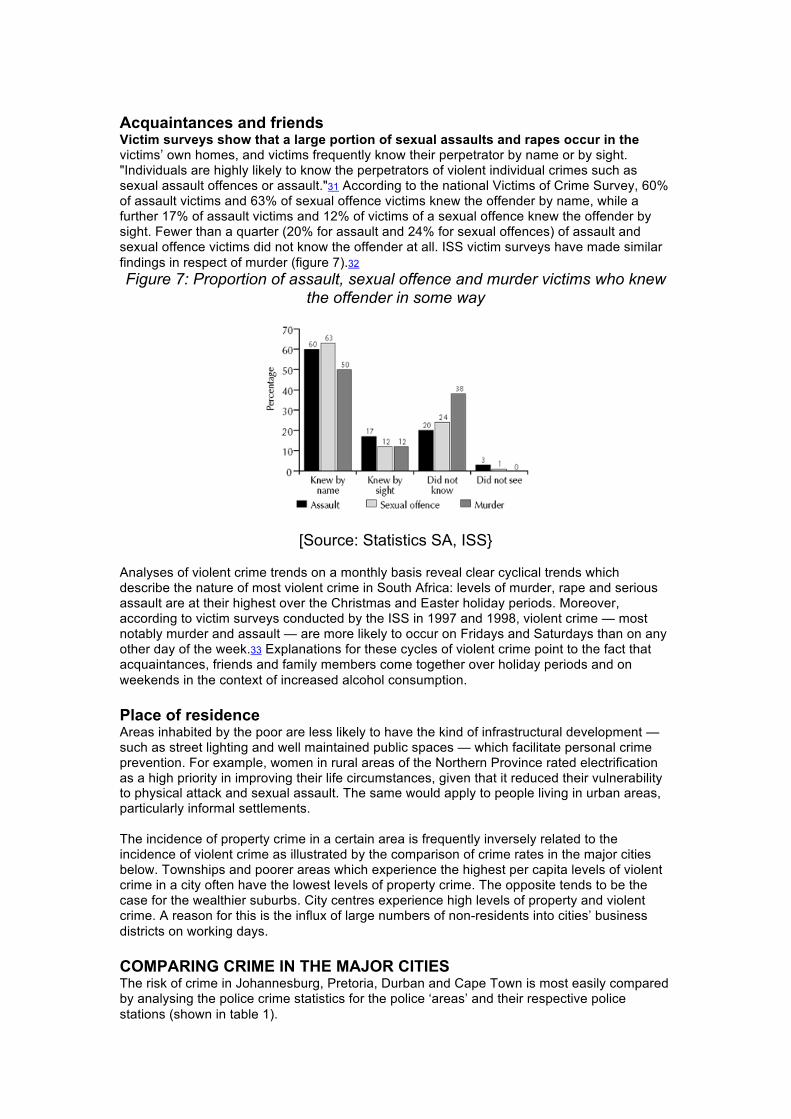
Acquaintances and friends Victim surveys show that a large portion of sexual assaults and rapes occur in the victims’ own homes, and victims frequently know their perpetrator by name or by sight. "Individuals are highly likely to know the perpetrators of violent individual crimes such as sexual assault offences or assault."31 According to the national Victims of Crime Survey, 60% of assault victims and 63% of sexual offence victims knew the offender by name, while a further 17% of assault victims and 12% of victims of a sexual offence knew the offender by sight. Fewer than a quarter (20% for assault and 24% for sexual offences) of assault and sexual offence victims did not know the offender at all. ISS victim surveys have made similar findings in respect of murder (figure 7).32 Figure 7: Proportion of assault, sexual offence and murder victims who knew
the offender in some way
[Source: Statistics SA, ISS} Analyses of violent crime trends on a monthly basis reveal clear cyclical trends which describe the nature of most violent crime in South Africa: levels of murder, rape and serious assault are at their highest over the Christmas and Easter holiday periods. Moreover, according to victim surveys conducted by the ISS in 1997 and 1998, violent crime — most notably murder and assault — are more likely to occur on Fridays and Saturdays than on any other day of the week.33 Explanations for these cycles of violent crime point to the fact that acquaintances, friends and family members come together over holiday periods and on weekends in the context of increased alcohol consumption. Place of residence Areas inhabited by the poor are less likely to have the kind of infrastructural development — such as street lighting and well maintained public spaces — which facilitate personal crime prevention. For example, women in rural areas of the Northern Province rated electrification as a high priority in improving their life circumstances, given that it reduced their vulnerability to physical attack and sexual assault. The same would apply to people living in urban areas, particularly informal settlements. The incidence of property crime in a certain area is frequently inversely related to the incidence of violent crime as illustrated by the comparison of crime rates in the major cities below. Townships and poorer areas which experience the highest per capita levels of violent crime in a city often have the lowest levels of property crime. The opposite tends to be the case for the wealthier suburbs. City centres experience high levels of property and violent crime. A reason for this is the influx of large numbers of non-residents into cities’ business districts on working days. COMPARING CRIME IN THE MAJOR CITIES The risk of crime in Johannesburg, Pretoria, Durban and Cape Town is most easily compared by analysing the police crime statistics for the police ‘areas’ and their respective police stations (shown in table 1).

Table 1: Police areas and their respective police stations Police area Police stations in each area
Johannesburg Alexandra, Booysens, Bramley, Brixton, Cleveland, Douglasdale, Fairland, Hillbrow, Jeppe, Johannesburg Central, Langlaagte, Linden, Mondeor, Norwood, Parkview, Randburg, Rosebank, Sandringham, Sandton, Sophiatown, Yeoville
Pretoria Akasia,Atteridgeville, Boschkop, Bronkhortspruit, Brooklyn, Cullinan, Eersterust, Erasmia, Garsfontein, Hammanskraal, Hercules, Kameeldrift, Laudium, Lyttleton, Mamelodi, Pretoria Moot, Pretoria North, Pretoria West, Pretoria Central, Rietgat, Silverton, Sinoville, Soshanguve, Sunnyside, Villieria, Welbekend, Wierdabrug, Wonderboompoort
Durban
Amanzimtoti, Bayview, Bellair, Berea, Brighton Beach, Cato Manor, Chatsworth, CR Swart, Durban North, Glendale, Greenwood Park, Hillcrest, Inanda, Isipingo, KwaMashu, KwaDabeka, KwaMakhutha, KwaNdengezi, Lamontville, Malvern, Marianhill, Maydon Harbour, Mayville, Montclair, Ndwedwe, Newark, Newlands East, Phoenix, Point, Pinetown, Stanger, Sydenham, Tongaat, Umbilo, Umbumbulu, Umhlali, Umlazi, Verulam, Wentworth, Westville
West Metropole (Cape Town)
Athlone, Camps Bay, Cape Town Central, Claremont, Dieprivier, Fish Hoek, Grassy Park, Guguletu, Hout Bay, Kensington, Kirstenhof, Langa, Lansdowne, Maitland, Manenberg, Mitchell's Plain, Mowbray, Muizenberg, Nyanga, Ocean View, Philippi, Pinelands, Rondebosch, Sea Point, Simon’s Town, Steenberg, Table Bay Harbour, Woodstock, Wynberg
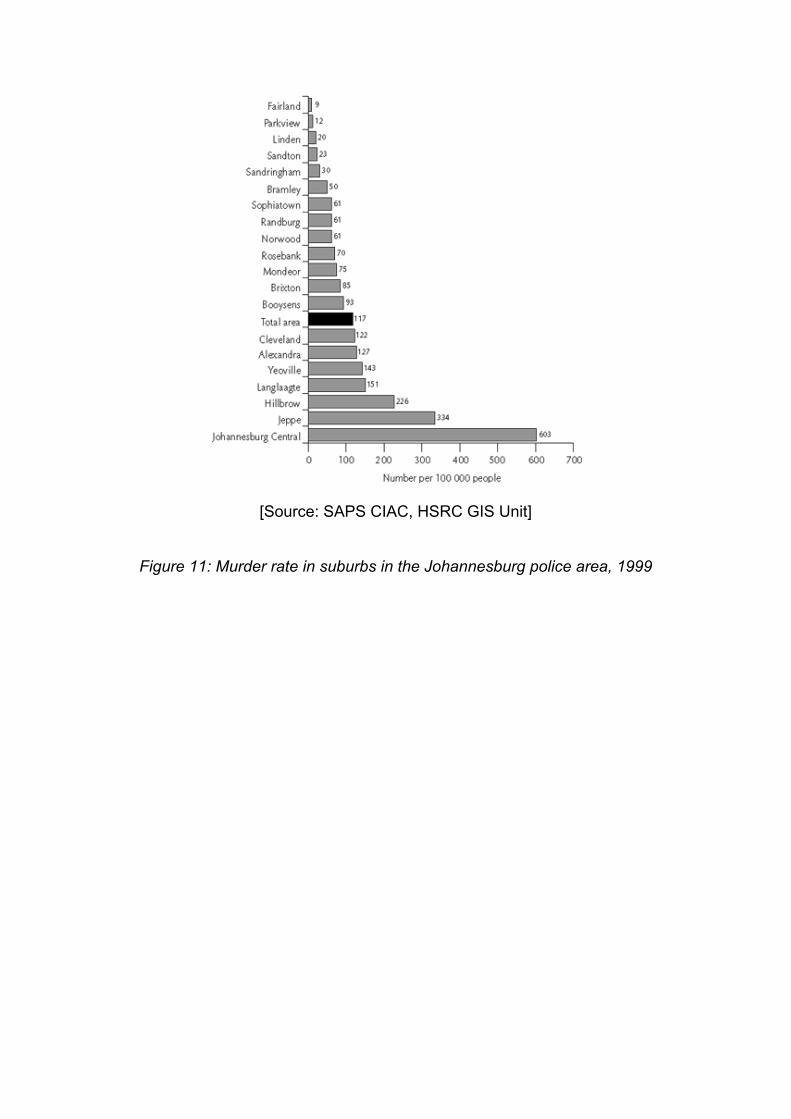
How the risk of crime compares On the basis of the 1999 recorded crime figures, Johannesburg had by far the highest rates of crime (both violent and property) of the four cities, followed by Pretoria, Cape Town (covered here by the statistics for the West Metropole police area) and lastly Durban (figure 8). The risk of becoming a victim of crime is thus highest in Johannesburg and lowest in Durban according to the police statistics. In all four cities, the proportion of violent crime was similar, at around one quarter of all recorded crime. In Durban, however, a slightly higher proportion of violent crime (29%) was recorded. Three serious crime types were analysed in each of the urban centres: murder, residential burglary and car hijacking. For all three, the risk of victimisation was greatest in Johannesburg in 1999. The murder rate in Johannesburg was 117 murders recorded per 100 000 people compared to only 37 murders per 100 000 in Pretoria — the city with the lowest murder rate (figure 9). An analysis of how the risk of murder varies in the suburbs of Johannesburg, Cape Town and Pretoria shows that people living in the poorer parts of the city, including the townships, were much more at risk of murder than those in the wealthier areas in 1999 (figures 10-12).
Figure 8: Violent and property crime rates in police areas, 1999
[Source: SAPS CIAC, HSRC GIS Unit]
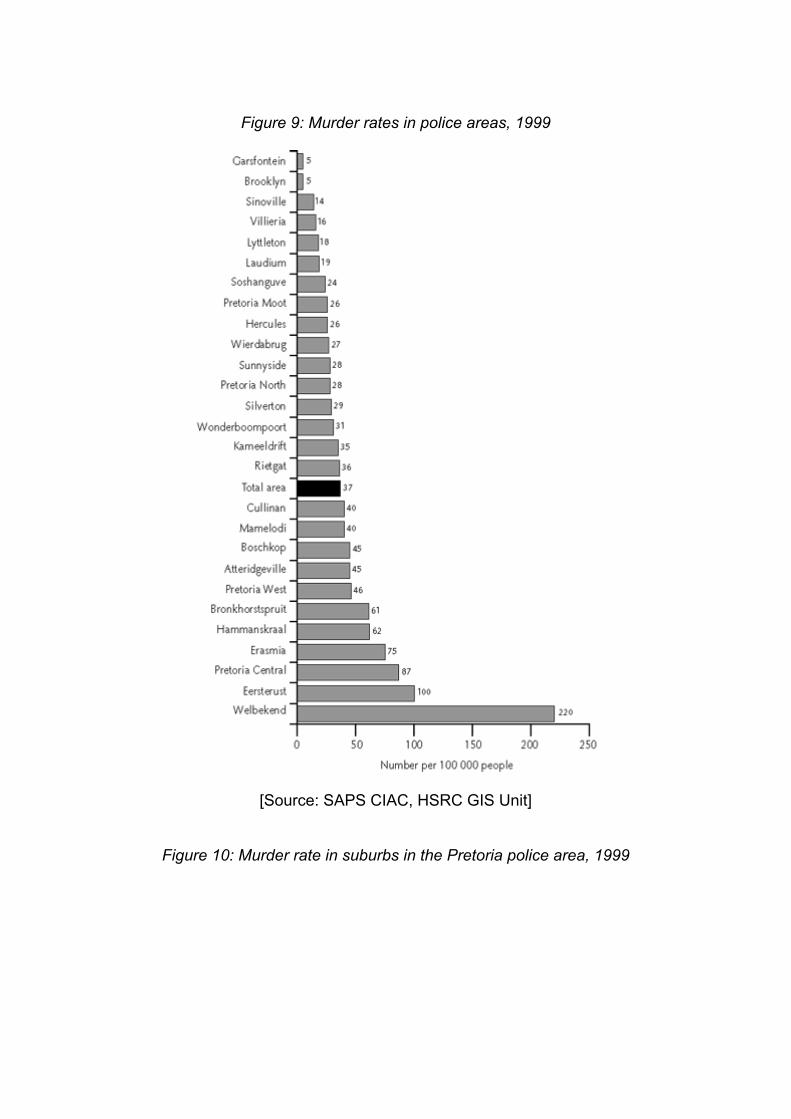
Figure 9: Murder rates in police areas, 1999
[Source: SAPS CIAC, HSRC GIS Unit]
Figure 10: Murder rate in suburbs in the Pretoria police area, 1999
[Source: SAPS CIAC, HSRC GIS Unit]
Figure 11: Murder rate in suburbs in the Johannesburg police area, 1999
[Source: SAPS CIAC, HSRC GIS Unit]
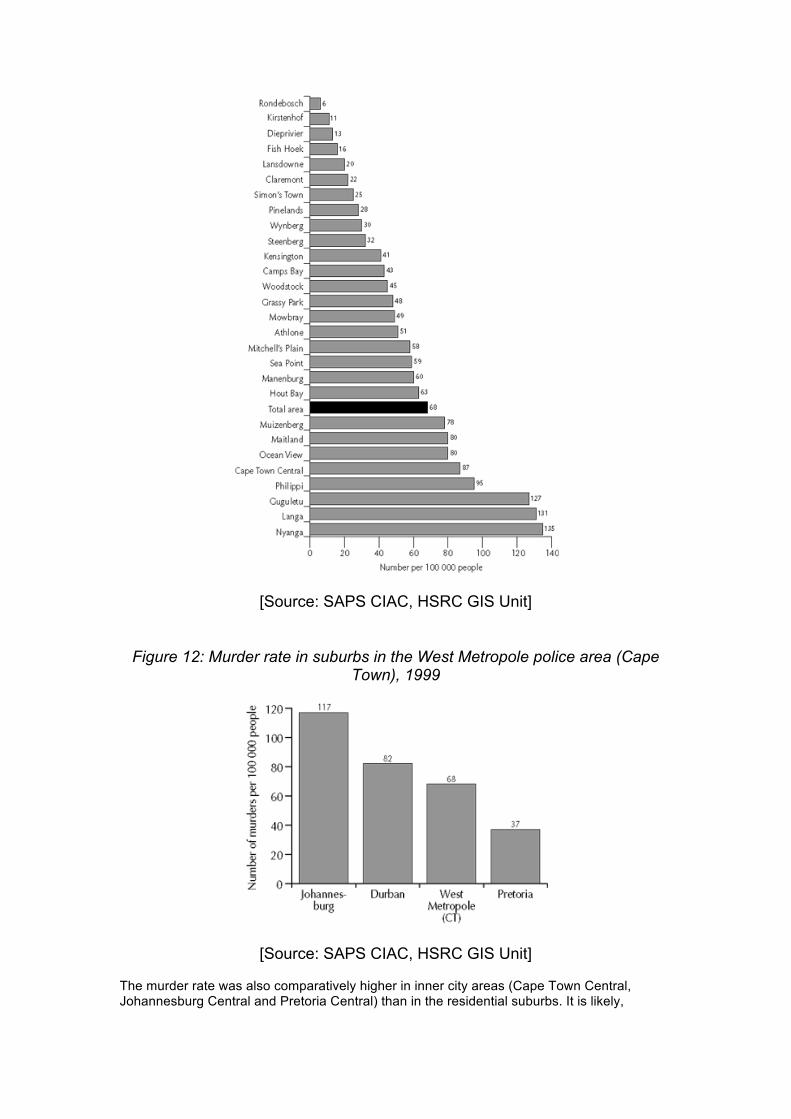
Figure 12: Murder rate in suburbs in the West Metropole police area (Cape Town), 1999
[Source: SAPS CIAC, HSRC GIS Unit] The murder rate was also comparatively higher in inner city areas (Cape Town Central, Johannesburg Central and Pretoria Central) than in the residential suburbs. It is likely,
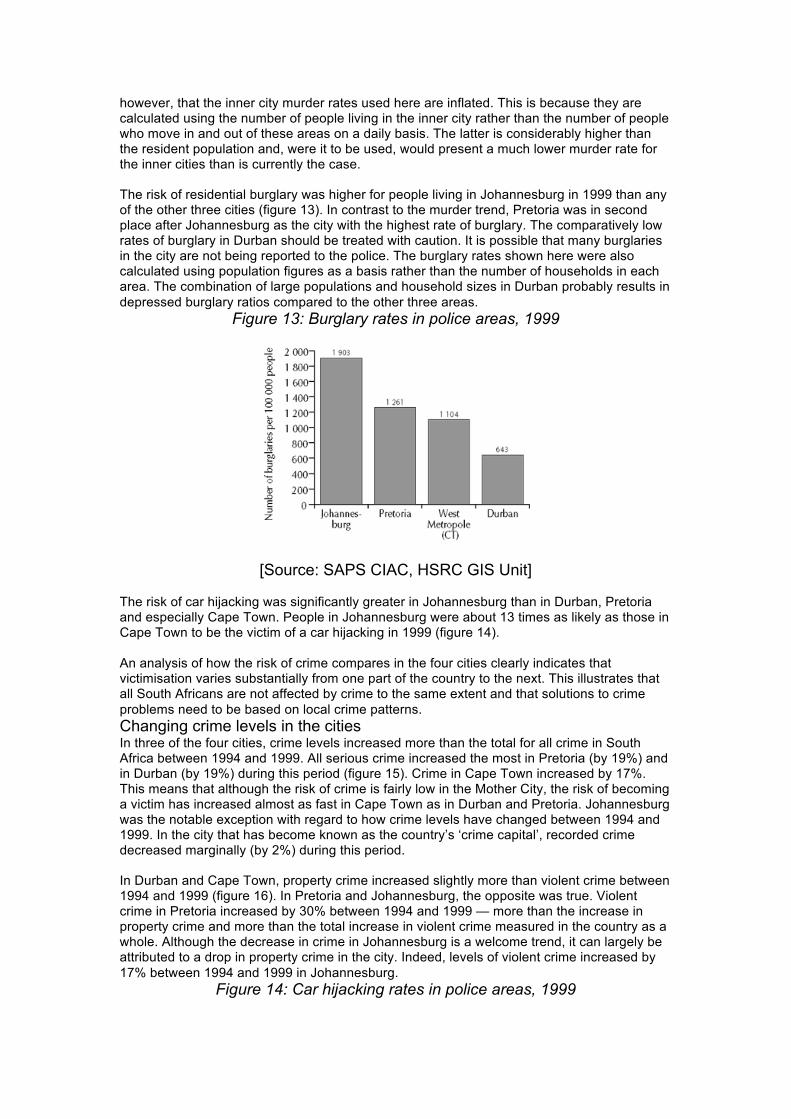
however, that the inner city murder rates used here are inflated. This is because they are calculated using the number of people living in the inner city rather than the number of people who move in and out of these areas on a daily basis. The latter is considerably higher than the resident population and, were it to be used, would present a much lower murder rate for the inner cities than is currently the case. The risk of residential burglary was higher for people living in Johannesburg in 1999 than any of the other three cities (figure 13). In contrast to the murder trend, Pretoria was in second place after Johannesburg as the city with the highest rate of burglary. The comparatively low rates of burglary in Durban should be treated with caution. It is possible that many burglaries in the city are not being reported to the police. The burglary rates shown here were also calculated using population figures as a basis rather than the number of households in each area. The combination of large populations and household sizes in Durban probably results in depressed burglary ratios compared to the other three areas.
Figure 13: Burglary rates in police areas, 1999
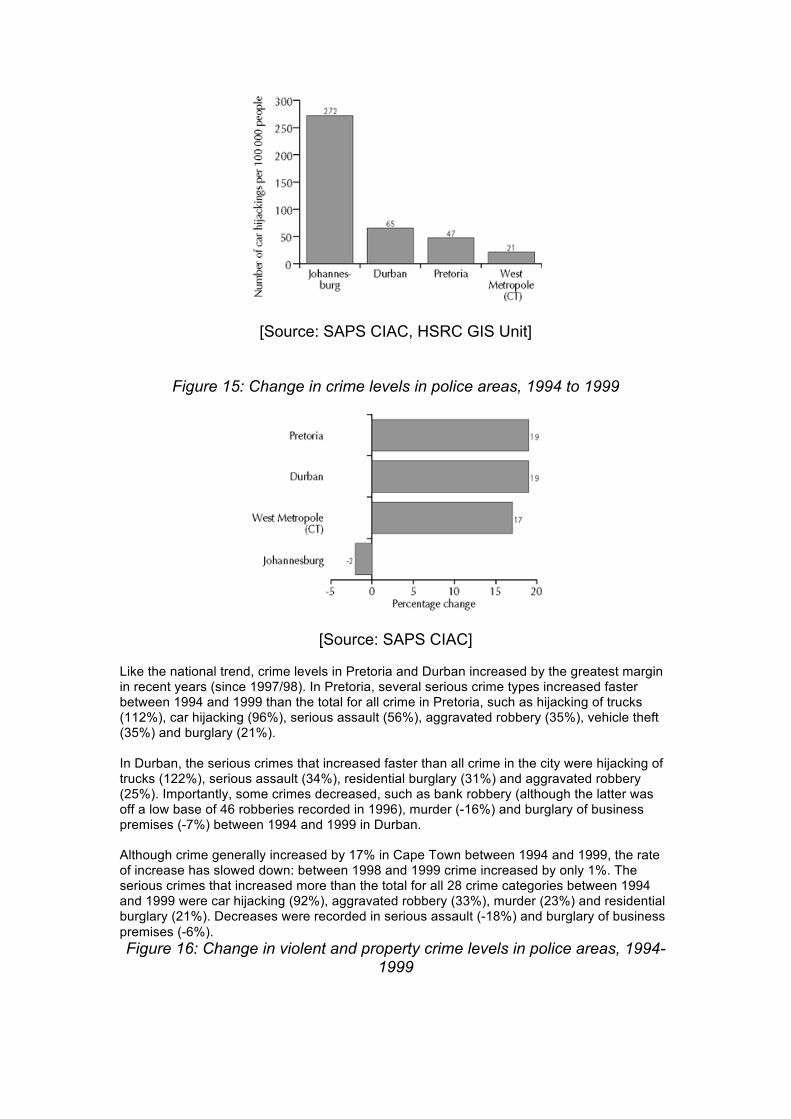
[Source: SAPS CIAC, HSRC GIS Unit] The risk of car hijacking was significantly greater in Johannesburg than in Durban, Pretoria and especially Cape Town. People in Johannesburg were about 13 times as likely as those in Cape Town to be the victim of a car hijacking in 1999 (figure 14). An analysis of how the risk of crime compares in the four cities clearly indicates that victimisation varies substantially from one part of the country to the next. This illustrates that all South Africans are not affected by crime to the same extent and that solutions to crime problems need to be based on local crime patterns. Changing crime levels in the cities In three of the four cities, crime levels increased more than the total for all crime in South Africa between 1994 and 1999. All serious crime increased the most in Pretoria (by 19%) and in Durban (by 19%) during this period (figure 15). Crime in Cape Town increased by 17%. This means that although the risk of crime is fairly low in the Mother City, the risk of becoming a victim has increased almost as fast in Cape Town as in Durban and Pretoria. Johannesburg was the notable exception with regard to how crime levels have changed between 1994 and 1999. In the city that has become known as the country’s ‘crime capital’, recorded crime decreased marginally (by 2%) during this period. In Durban and Cape Town, property crime increased slightly more than violent crime between 1994 and 1999 (figure 16). In Pretoria and Johannesburg, the opposite was true. Violent crime in Pretoria increased by 30% between 1994 and 1999 — more than the increase in property crime and more than the total increase in violent crime measured in the country as a whole. Although the decrease in crime in Johannesburg is a welcome trend, it can largely be attributed to a drop in property crime in the city. Indeed, levels of violent crime increased by 17% between 1994 and 1999 in Johannesburg.
Figure 14: Car hijacking rates in police areas, 1999
[Source: SAPS CIAC, HSRC GIS Unit]
Figure 15: Change in crime levels in police areas, 1994 to 1999
[Source: SAPS CIAC] Like the national trend, crime levels in Pretoria and Durban increased by the greatest margin in recent years (since 1997/98). In Pretoria, several serious crime types increased faster between 1994 and 1999 than the total for all crime in Pretoria, such as hijacking of trucks (112%), car hijacking (96%), serious assault (56%), aggravated robbery (35%), vehicle theft (35%) and burglary (21%). In Durban, the serious crimes that increased faster than all crime in the city were hijacking of trucks (122%), serious assault (34%), residential burglary (31%) and aggravated robbery (25%). Importantly, some crimes decreased, such as bank robbery (although the latter was off a low base of 46 robberies recorded in 1996), murder (-16%) and burglary of business premises (-7%) between 1994 and 1999 in Durban. Although crime generally increased by 17% in Cape Town between 1994 and 1999, the rate of increase has slowed down: between 1998 and 1999 crime increased by only 1%. The serious crimes that increased more than the total for all 28 crime categories between 1994 and 1999 were car hijacking (92%), aggravated robbery (33%), murder (23%) and residential burglary (21%). Decreases were recorded in serious assault (-18%) and burglary of business premises (-6%). Figure 16: Change in violent and property crime levels in police areas, 1994-
1999
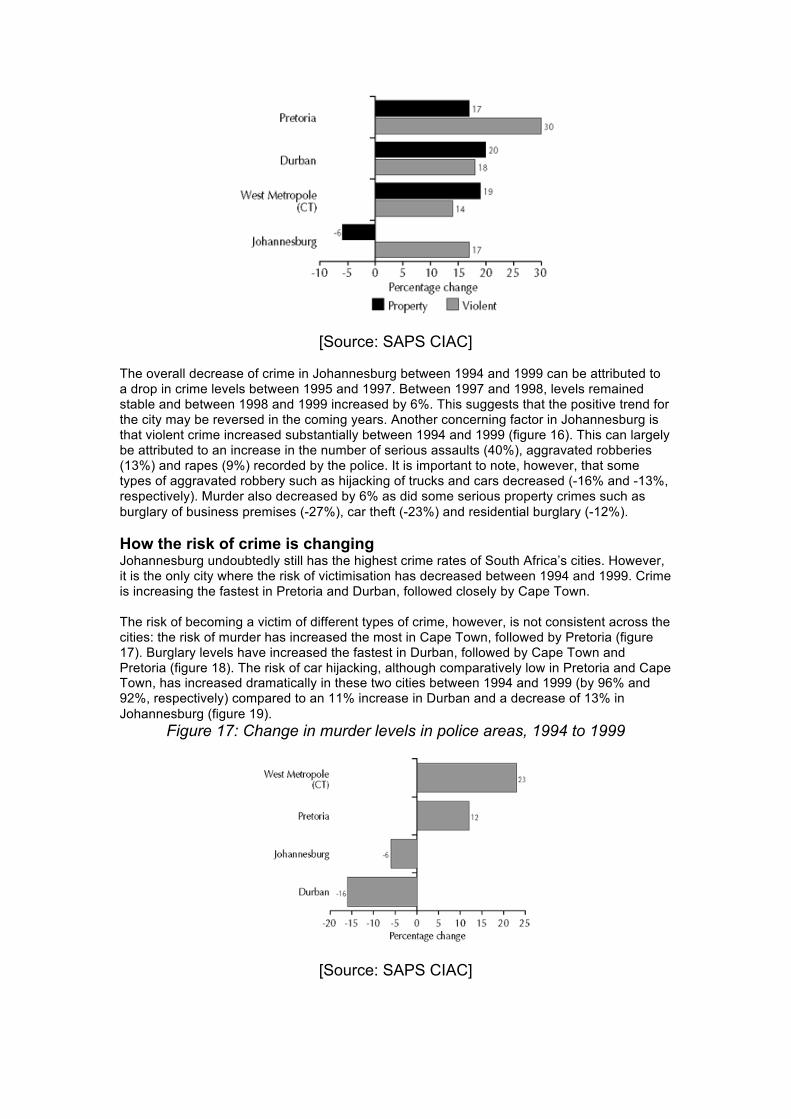
[Source: SAPS CIAC] The overall decrease of crime in Johannesburg between 1994 and 1999 can be attributed to a drop in crime levels between 1995 and 1997. Between 1997 and 1998, levels remained stable and between 1998 and 1999 increased by 6%. This suggests that the positive trend for the city may be reversed in the coming years. Another concerning factor in Johannesburg is that violent crime increased substantially between 1994 and 1999 (figure 16). This can largely be attributed to an increase in the number of serious assaults (40%), aggravated robberies (13%) and rapes (9%) recorded by the police. It is important to note, however, that some types of aggravated robbery such as hijacking of trucks and cars decreased (-16% and -13%, respectively). Murder also decreased by 6% as did some serious property crimes such as burglary of business premises (-27%), car theft (-23%) and residential burglary (-12%). How the risk of crime is changing Johannesburg undoubtedly still has the highest crime rates of South Africa’s cities. However, it is the only city where the risk of victimisation has decreased between 1994 and 1999. Crime is increasing the fastest in Pretoria and Durban, followed closely by Cape Town. The risk of becoming a victim of different types of crime, however, is not consistent across the cities: the risk of murder has increased the most in Cape Town, followed by Pretoria (figure 17). Burglary levels have increased the fastest in Durban, followed by Cape Town and Pretoria (figure 18). The risk of car hijacking, although comparatively low in Pretoria and Cape Town, has increased dramatically in these two cities between 1994 and 1999 (by 96% and 92%, respectively) compared to an 11% increase in Durban and a decrease of 13% in Johannesburg (figure 19).
Figure 17: Change in murder levels in police areas, 1994 to 1999
[Source: SAPS CIAC]

Figure 18: Change in burglary levels in police areas, 1994 to 1999
[Source: SAPS CIAC]
Figure 19: Change in car hijacking levels in police areas, 1994 to 1999
[Source: SAPS CIAC] Notes
1. See J J M van Dijk, On the uses of local, national and international crime surveys, in G Kaiser, H Kury & H-J Albrecht (eds), Victims and criminal justice, Max Planck Institute for Foreign and International Penal Law, Freiburg, 1991.
2. TBVC states refers to the erstwhile nominally independent homelands of the republics of Transkei, Bophuthatswana, Venda and Ciskei.
3. M Schönteich, Crime increase partly a statistical quirk, Fast Facts 3/99, March 1999, pp 2-3.
4. M Shaw, Partners in crime? Crime, political transition and changing forms of policing control, Research report 39, June 1995, Centre for Policy Studies, Johannesburg, p 9.
5. L Glanz, The not so long arm of the law, Indicator Crime and Conflict 5, Autumn 1996, p 10.
6. Shaw, June 1995, op cit, p 20. 7. Ibid, p 21. 8. At the time of writing, 1999 was the last full year for which official crime statistics were
released by the Crime Information Analysis Centre. 9. See M Schönteich, A battle lost? Violent crime trends in 1999, Nedbank ISS Crime
Index 4(3), May-June 2000, pp 1-4. 10. For the purposes of this briefing, violent crime comprises murder and attempted
murder, rape and attempted rape, and all forms of robbery and assault. 11. Schönteich, A battle lost? op cit, pp 1-4.
12. International crime statistics 1997, International Criminal Police Organisation (Interpol), Lyon in The incidence of serious crime January to June 1999, Semester Report 2/99, Crime Information Analysis Centre, November 1999, Pretoria, annexure D.
13. Criminal Justice Monitor, Nedbank ISS Crime Index 4(4), July-August 2000, pp 1-2. 14. M Shaw, South Africa: Crime in transition, ISS Paper 17, Institute for Security
Studies, Halfway House, March 1997, p 1. 15. See J Kane-Berman, Political violence in South Africa, South African Institute of Race
Relations, Johannesburg, 1993. 16. Nedcor Project on Crime, Violence and Investment: 1996, Final Report, The Nedcor
Project, Johannesburg, 1996. 17. E Hennop, South Africa’s porous borders: A haven for arms smugglers, Nedbank ISS
Crime Index 4(3), May-June 2000, pp 20-23. 18. M Shaw, Organised crime in post-apartheid South Africa, ISS Paper 28, Institute for
Security Studies, Halfway House, January 1998, p 1. 19. CIMC, The incidence of serious crime between 1 January and 31 December 1997,
Quarterly Report 1/98, 27 March 1998, p 25. 20. D J Smith, Youth crime and conduct disorders, in M Rutter & D J Smith (eds),
Psychological disorders in young people: Time trends and their correlates, Chichester, Wiley, 1995, p 395.
21. The People of South Africa Population Census, 1996, Census in Brief, Statistics South Africa, Pretoria, report no. 1:03-01-11[1996].
22. Most of the material contained in the sub-section on ‘rapid urbanisation’ has been taken from L Glanz, South African cities under siege, Indicator Crime and Conflict 2, Winter 1995, p 17.
23. See M Schönteich, Assessing the crime fighters: The ability of the criminal justice system to solve and prosecute crime, ISS Paper 40, Institute for Security Studies, Pretoria, September 1999.
24. Statistics South Africa, Victims of crime survey 1998, statistical release P0341, Pretoria, 1998.
25. A Louw & M Shaw, Stolen opportunities: The impact of crime on South Africa’s poor, ISS Monograph 14, Institute for Security Studies, Halfway House, July 1997.
26. Household-related property crimes include burglary and attempted burglary, car theft, theft from motor vehicle, and theft of motor cycle or bicycle.
27. Household-related violent crimes include murder, car hijacking and attempted hijacking, and arson.
28. Statistics South Africa, Victims of crime survey 1998, op cit, p 30. 29. Individual crimes include sexual offences, robbery, assault, fraud and theft of
personal property. 30. Statistics South Africa, Victims of crime survey 1998, op cit, p 41. 31. Ibid, p 47. 32. A Louw, Crime in Pretoria: Results of a city victim survey, Institute for Security
Studies and Idasa, Halfway House, 1998. 33. A Louw, M Shaw, L Camerer & R Robertshaw, Crime in Johannesburg: Results of a
city victim survey, ISS Monograph 18, Institute for Security Studies, Halfway House, February 1998; L Camerer, A Louw, M Shaw, L Artz & W Schärf, Crime in Cape Town: Results of a city victim survey, ISS Monograph 23, Institute for Security Studies, Halfway House, April 1998; Louw, Crime in Pretoria, op cit, 1998.
APPENDIX 1 ANALYSING POLICE CRIME STATISTICS: SOME ISSUES FOR CONSIDERATION
Crime statistics, whether recorded by the police or through other methods, are (and always will be) a source of debate. The department of safety and security’s moratorium on the release of police crime statistics has fuelled this debate. It has also increased the number of questions raised by the media, public, business and parliament about crime trends in South Africa. Many of these questions can be answered using the comprehensive police data that we already have (as outlined in this article). The moratorium has also encouraged the
(inaccurate) view that there is ‘no information’ available about crime trends. When the statistics are released again, it will be important to have an idea of the trends for the past five years in order to contextualise the changes in crime levels recorded during the period when the moratorium was in place. This appendix outlines some of the issues that those who use police crime statistics should consider. It is hoped that this will assist the public in interpreting crime statistics in a responsible manner once the moratorium is lifted. WHAT DO POLICE CRIME STATISTICS TELL US? Statistics drawn from the police crime database are useful for the public because they provide information on: How crime levels change over time Police statistics show how many crimes have been reported to, and recorded by, the police in a given time period and in a particular geographic area. This provides a means of tracking how crime levels have changed over time in specific places. Because the police rely on the public to report crime and individuals in the police station to record it, the crime statistics often say more about reporting patterns (some crimes are more likely to be reported than others) and police procedure (how police record crime, and their patrolling and arrest patterns) than about actual crime levels. How crime rates compare in different areas Together with data about the size of the population, the number of registered vehicles etc., police statistics can be used to compare crime rates in different areas. This is the most accurate way of comparing crime across cities, provinces or countries because it takes into account the potential for victimisation in each locality. It is therefore inaccurate to compare the raw number of murders in Soweto with those in Benoni, because there may be many more people living in Soweto which means the potential for murder is much higher in Soweto than in Benoni. About the nature of certain crimes The police record a range of details about when and where crimes occur, who the victims are and, when they are known, who the perpetrators might be. In some cases information is also recorded about the types of weapons used and other factors related to the commission of a crime such as the use of alcohol or drugs by the victim or perpetrator. The information can be analysed to determine the nature of certain crimes. This indicates areas for further investigation into what causes these crimes and thus how they could be reduced. WHAT POLICE CRIME STATISTICS DO NOT TELL US It is important to recognise the limitations of police data. This information, like that gathered through any other means, is influenced by the particular methods used. The police should not simply be criticised for these shortcomings. Rather the responsibility lies with those who use police crime data to be aware of the gaps and endeavour to fill them in their analysis of crime. Police crime statistics do not tell us: About crimes that the public does not report to the police Because the collection of police crime data largely depends on the public to report offences, it is unrealistic to expect the police to have information about all crime that occurs in a particular place. Crime types that are particularly affected by low levels of reporting are the less serious property crimes such as petty theft, as well as other crimes like fraud, corruption, sexual assault and crimes against children. Victim surveys — which ask a representative sample of people in a particular area what crimes they have experienced over a specific time period — can supplement police data to fill many of the gaps in crime information. About the causes of crime On their own, police statistics do not show what causes crime. These statistics, like those gathered through other means such as victim surveys, indicate trends and point out areas for

further investigation. For example, an analysis of the number of murders recorded by police on a monthly basis over five years in South Africa shows a consistent and dramatic peak over the Christmas and Easter holiday periods. This suggests that murder may be related to the gathering of people, friends and family over holiday periods and the consumption of alcohol. The police data however neither proves that this is the case, nor that alcohol actually causes crime. But it does indicate that these factors should be explored using other methods and data. About the performance of the police On their own, the number of recorded crimes is not always helpful in assessing whether the police are performing well or not, for three reasons:
• Crime statistics say little about what the police are actually doing about crime and how effective these interventions are. For example, a six month police operation to gather intelligence, investigate and arrest the participants in one car theft syndicate is unlikely to have an impact on the statistics for vehicle theft unless the syndicate confined its activities to a small, clearly identified locality. If that were the case, the figures for that specific locality only would need to be examined. It would also be important to examine not only the crime statistics but whether the perpetrators were convicted.
• There are a range of factors that influence crime trends that have little to do with police action.
• An increase in the level of some recorded crime does not always mean the police are performing poorly — in fact the opposite may be true. For example, many inter-personal crimes are committed in private homes among people who know each other. The police have little or no control over the commission of such offences. Even the best police service with patrols on every street corner cannot prevent a woman being raped or assaulted by her boyfriend in her bedroom. High recorded levels of such crimes should therefore not reflect badly on the police’s performance. If levels do increase, it may even indicate that police have been providing good victim support, are applying the new Domestic Violent Act, and have earned the trust and confidence of victims. Similarly, crimes such as drunk driving and drug related offences rely almost exclusively on the police for their detection. High levels of recorded crime for such offences are consequently a positive performance indicator for the police.
Crime statistics should not therefore be used in isolation to measure police effectiveness — they should form part of a package of measurement tools that are based on the objectives and activities of the police in a particular area. ARE THE STATISTICS OF THE SOUTH AFRICAN POLICE SERVICE ACCURATE? The accuracy of statistics can be assessed in terms of their validity (i.e. do they tell us about the true crime picture) and their reliability (i.e. do they provide information in a consistent manner). To adequately answer these questions would require an extensive and dedicated review of the SAPS statistics. However, some points can be made. Validity One way of assessing whether police data reflects the true crime picture is to compare police statistics with that of victim surveys. Only one national victim survey has been conducted in South Africa. More surveys of a similar nature will need to be conducted in order to determine whether crime levels are indeed increasing or decreasing as indicated by the police statistics. The national Victims of Crime survey of 1998 did however ask whether victims reported the most recent incident of victimisation to the police. This information indicates which crimes are more likely to be reported and thus which aspects of police data are most valid. The survey showed that broadly, reporting patterns were similar to those in other countries. Most victims reported serious property crimes and some serious violent crimes such as car hijacking, vehicle theft, burglary and murder. Less serious property crimes and personal violent crimes such as attempted burglary, theft of a bicycle, mugging, assault and sexual offences, were reported by less than half the victims.
Reliability The police depend on the public to report crime. However once this happens, how the police handle the information can affect its reliability. This was identified as a problem for the SAPS in 1997 by the then minister of safety and security who instituted a committee of inquiry into the collection, processing and publication of crime statistics. The committee consisted of representatives of the police, research community and international experts. After six months of work, detailed findings and recommendations were published at some cost to the taxpayer. The essence of the committee’s findings were that the absence of an ‘information culture’ in the police underlies the multitude of problems affecting crime statistics, particularly how crime information is entered into the police database at station level. Sources of human error also included insufficient training, inadequate physical and human resources and computer support at station level and a high turnover of skilled personnel. The reliability of the data was affected by several technical problems relating to the complexity of the system and lack of appropriate training, the enormity of the crime database, network related difficulties, computer downtime, faulty programmes and inadequate data validation (for more information see the Nedbank ISS Crime Index Volume 2 Number 3 1998). Some of the committee’s recommendations about how to improve the reliability of police statistics have since been implemented. It is also important to note that the committee found that the routine and widespread public scepticism about police data in South Africa was unfounded and that overall, the system was advanced compared to that used in other countries. Far from recommending a moratorium on the release of statistics, the committee suggested that more regular releases of crime information to the public were required. The reason given for this was that "if too little information is released too seldom, the credibility of the data when it is made available will probably be questioned. Furthermore, when public information is kept to a minimum (especially on an issue as important as crime), the number of requests is likely to increase". The moratorium has proven both to be true. Based on the committee’s findings and other ISS research, the status of police crime statistics in terms of reliability is that broad trends are reliable — especially national, provincial and area trends (because the numbers are large enough to ‘absorb’ a few mistakes). The major problems are around:
• Details on exactly where crimes happened. • The classification of certain crimes e.g. aggravated vs common robbery, serious
assault vs attempted murder. • Updating the SAP6 data sheet which provides information about the outcome of a
case once it has been to court (i.e. whether the charge remains that originally laid by the complainant, whether a conviction was achieved, whether the case was withdrawn, etc.).
The true situation about the reliability of police statistics may be different, but since the SAPS has not provided the public with any additional information in this regard, it is difficult to comment conclusively. The SAPS Crime Information Analysis Centre has in fact done particularly well to produce comprehensive, consistent and geographically detailed information about all 28 serious crime types. These data are available on the SAPS website: www.saps.co.za. Compared to other developing countries, members of the public in South Africa have much to be grateful for regarding our official crime database. ABOUT THIS PAPER Crime has been increasing at an escalating rate since 1997. Crime does not affect all people uniformly in South Africa. Johannesburg has the highest volume of serious crime, followed by Pretoria, Cape Town and Durban. There is no single satisfactory explanation for why South Africa has consistently high levels of crime. Rather, it is necessary to consider the country's

political transition, and the impact firearms, organised crime, changing demographics, and a poorly performing criminal justice system have on levels of crime.