crime and self-control revisited: disentangling the effect
TRANSCRIPT

DI
SC
US
SI
ON
P
AP
ER
S
ER
IE
S
Forschungsinstitut zur Zukunft der ArbeitInstitute for the Study of Labor
Crime and Self-Control Revisited: Disentangling the Effect of Self-Control on Risk and Social Preferences
IZA DP No. 8109
April 2014
Tim FrieheHannah Schildberg-Hörisch
Crime and Self-Control Revisited:
Disentangling the Effect of Self-Control on Risk and Social Preferences
Tim Friehe CASTLE, University of Bonn
and CESifo
Hannah Schildberg-Hörisch University of Bonn
and IZA
Discussion Paper No. 8109 April 2014
IZA
P.O. Box 7240 53072 Bonn
Germany
Phone: +49-228-3894-0 Fax: +49-228-3894-180
E-mail: [email protected]
Any opinions expressed here are those of the author(s) and not those of IZA. Research published in this series may include views on policy, but the institute itself takes no institutional policy positions. The IZA research network is committed to the IZA Guiding Principles of Research Integrity. The Institute for the Study of Labor (IZA) in Bonn is a local and virtual international research center and a place of communication between science, politics and business. IZA is an independent nonprofit organization supported by Deutsche Post Foundation. The center is associated with the University of Bonn and offers a stimulating research environment through its international network, workshops and conferences, data service, project support, research visits and doctoral program. IZA engages in (i) original and internationally competitive research in all fields of labor economics, (ii) development of policy concepts, and (iii) dissemination of research results and concepts to the interested public. IZA Discussion Papers often represent preliminary work and are circulated to encourage discussion. Citation of such a paper should account for its provisional character. A revised version may be available directly from the author.
IZA Discussion Paper No. 8109 April 2014
ABSTRACT
Crime and Self-Control Revisited: Disentangling the Effect of Self-Control on Risk and Social Preferences
In economic models, risk and social preferences are major determinants of criminal behavior. In criminology, low self-control is considered a fundamental cause of crime. Relating the arguments from both disciplines, this paper studies the relationship between self-control and both risk and social preferences. To exogenously vary the level of self-control, we use a well-established experimental manipulation. We find that low self-control causes less risk-averse behavior. The effect of self-control on social preferences is not significant. In sum, our findings support the proposition that low self-control is a facilitator of crime. While our study is motivated by the literature on the determinants of criminal behavior, it has important implications for dual-system models and documents endogeneity of economic preferences. JEL Classification: K42, H23, C91 Keywords: criminal behavior, risk preferences, social preferences, ego-depletion,
dual-system models, experiment, endogeneity of economic preferences Corresponding author: Hannah Schildberg-Hörisch Department of Economics University of Bonn Adenauerallee 24-42 53113 Bonn Germany E-mail: [email protected]
1
1. Motivation
Crime is a social phenomenon of great importance, adversely affecting society as a whole
and the countless individuals who are victimized each day (see, e.g., Anderson 1999). One of
the most influential theories regarding its causes is the General Theory of Crime. It argues
that low self-control “is the primary individual characteristic causing criminal behavior”
(Gottfredson and Hirschi 1990: 111). The central tenet is that individuals with low self-
control are particularly vulnerable to temptations because they fail to take full account of
the negative consequences of their acts. A criminal act has both an antisocial aspect since it
imposes harm on the victims and a risk aspect because there is some chance of detection
and subsequent sanctioning. The General Theory of Crime posits that individuals with low
self-control are more likely to engage in criminal behavior since they are both more risk-
taking and more insensitive to others.
Similarly, risk and social preferences are crucial in economic models of criminal behavior.
The seminal paper by Becker (1968) was the first to address the link between risk
preferences and criminal behavior. Studies on the relationship between criminal behavior
and social preferences are more recent and their count keeps growing. Falk and Fischbacher
(2002), Schildberg-Hörisch and Strassmair (2012), Harbaugh et al. (2013), and Khadjavi
(2014) mimic criminal behavior in laboratory experiments and use take games to elicit
(anti)social preferences. Birkeland et al. (forthcoming) and Chmura et al. (2013) elicit social
preferences of prisoners and find that they do not differ significantly from those of
populations not incarcerated.1
This paper studies how self-control ability relates to risk and social preferences, thereby
linking the General Theory of Crime to the economic literature on criminal behavior. More
precisely, we test whether low self-control induces less risk-averse and more antisocial
behavior. We use a laboratory experiment to be able to exogenously vary the level of self-
control across treatments and, thus, to provide causal evidence on the link between self-
control and both risk and social preferences.
1 A related literature deals with the effect of income inequality on crime, see, for example, Fleisher (1966), Fajnzylber et al. (2002), or Chintrakarn and Herzer (2012).

2
We use a 2x2 between-subject design. In the first stage, subjects participate in a version of a
so-called ego-depletion task that induces either high or low self-control capabilities. In the
second stage, we elicit subjects’ risk or social preferences. In social psychology, ego-
depletion tasks are a standard tool to manipulate an individual’s level of self-control. They
are based on the intuition that self-control can be likened to a muscle that it is fatigued by
prior use (e.g., Muraven and Baumeister 2000). The exertion of self-control in one activity is
assumed to consume mental self-control resources, thereby diminishing self-control ability
in subsequent activities (Muraven forthcoming).2 Once put in a state of low self-control (so-
called ego-depletion) in the low self-control treatments, subjects are temporarily less able to
exert self-control in the decision problems that elicit risk or social preferences. 3
We find that individuals with lower self-control capability behave significantly less risk-
averse. This effect is mainly driven by the behavior of male subjects. The effect of self-
control on social preferences is not significant.
In sum, our findings support the proposition of the General Theory of Crime that low self-
control is a facilitator of crime. Our study complements empirical studies that suggest a link
between crime and low self-control, but struggle to establish causality because they lack an
exogenous manipulation of self-control (see the meta-analyses by Engel 2012 and Pratt and
Cullen 2000).
Our research also adds to the ongoing discussion about the role of rational choice in theories
about crime. For example, De Haan and Vos (2003) argue for the case of street robbery that
the rational-choice perspective does not add much, because it misses essential aspects such
as impulsiveness and moral ambiguity. In our paper, we investigate how subjects with low
self-control, i.e., subjects acting more impulsively, decide and compare their choices to the
behavior of subjects with higher self-control. Our results suggest that individuals who act
more impulsively are indeed less likely to be deterred by probabilistic sanctioning.
2 Self-control resources are required when situations and tasks involve conflict and a need to suppress natural tendencies, such as resisting a temptation, thought control, control of affect, or persisting on complex cognitive tasks (Kahneman 2011: 42). 3 Current psychological and criminological research suggests that the level of self-control at a given point in time depends both on situational aspects and a stable personality trait self-control (e.g., Muraven et al. 2006, Wikström and Treiber 2007). In our study, we manipulate the level of situational self-control ability and collect information about the level of trait self-control in a post-experimental questionnaire.

3
Moreover, our paper points at a potential mechanism underlying empirical findings on crime
and factors which, surprisingly, have predictive power for crime. Examples are the
relationship between crime and hot weather (Jacob et al. 2007) or the relationship between
family or hooligan violence and the unexpectedly bad performance of sports teams (Card
and Dahl 2011, Priks 2010). If hot weather or an unexpected loss of the own team consume
self-control resources, lower self-control ability in subsequent situations might increase an
individual’s inclination to engage in criminal behavior.
Our key research question whether low self-control causes less risk-averse and more
antisocial behavior has also important implications beyond the analysis of causes of criminal
behavior. First, our paper adds to the literature on dual-system models, such as Fudenberg
and Levine (2006, 2011, 2012), Kahneman (2003), and Loewenstein and O’Donoghue
(2007).4 According to dual-system models, decision-making is governed by the interaction of
an instinctive affective system and a controlled deliberative system. Exerting self-control is
required for implementing deliberative processes and overriding affective processes. Our
low self-control treatment diminishes mental resources left for further self-control and
thereby enhances the influence of the affective system on behavior. In the light of dual-
system models, our result that individuals with lower self-control ability are less risk-averse
contrasts with the deliberative system (“long-run self”) being less risk-averse than the
affective system (“short-run self”) in the dual-system model of Fudenberg and Levine (2006,
2011).
Second, by documenting systematic variations in risk preferences due to changes in self-
control capabilities, we contribute to the discussion on the endogeneity of preferences.
Traditionally, economists treat preferences as exogenously given and explain changes in
behavior by changes in beliefs or constraints that people face rather than by changes in
preferences. This view is increasingly challenged. For example, Fehr and Hoff (2011) provide
a general discussion of the influence of society on preferences. Moreover, there is an
emerging literature on the effect of emotions on risk preferences (Conte et al. 2013, Guisi et
al. 2013, Nguyen and Noussair 2013).
4 For a recent, more general discussion of the dual-system approach, see Evans (2008), Rustichini (2008), or Kahneman (2011).
4
Our paper is most closely related to Muraven et al. (2006) who compare the level of
subjects’ cheating (as a form of deviant behavior) in a low self-control condition with that of
subjects in a high self-control condition. They find that subjects with low self-control cheat
more. In contrast to our paper, cheating was inconsequential for others (i.e., not antisocial)
and not incentivized. Moreover, our study also investigates the effect of low self-control on
risk attitudes since, in real-life circumstances, crime is subject to probabilistic sanctioning.5
The remainder of our paper is structured as follows. In Section 2, we describe the
experiment design and procedures. Section 3 spells out the hypotheses, before Section 4
presents results. Section 5 embeds our results in those obtained in the related literature.
Section 6 concludes.
2. Experiment design, treatments, and procedures
We first describe the experiment design and the four treatments. Next, we provide details
on the implementation of the experiment. Appendix B contains a translated example of the
instructions that subjects received in the beginning of the experiment.
2.1 Experiment design and treatments
To investigate how low self-control influences criminal behavior in situations with
probabilistic law enforcement, we separately analyze the effect of self-control on risk and
social preferences, i.e., the two components that are key to the decision of whether or not
to engage in criminal behavior. For a sound understanding of the mechanisms underlying the
relationship between self-control and criminal behavior, a separate analysis of the effects of
self-control on risk and social preferences is crucial since the two effects could potentially
offset each other. For example, if subjects with low self-control behave in a more selfish and
a more risk-averse manner, the first effect will increase and the second effect will decrease
the attractiveness of criminal behavior, which may result in unchanged behavior.
5 DeBono et al. (2011) provide a study on cheating that is closely related to Muraven et al. (2006), but add the comparison of an anonymous condition with one in which subjects could, in principle, be identified. As another example of norm-deviant behavior, they report evidence that subjects with low self-control are less likely to show polite behavior.
5
Our central research question is whether subjects with low self-control capability behave
less risk-averse and more antisocial than subjects with higher self-control capability. We use
a 2x2 design to address this question. The first treatment dimension distinguishes subjects
who participate in the ego-depletion task that induces low self-control capability (LSC
treatment) from subjects who take part in the ego-depletion task that results in higher self-
control capability (HSC treatment). The second treatment dimension is whether a subjects’
risk or social preferences are elicited first. For each subject, we measure both risk and social
preferences, but the order of decisions differs across treatments. The second decision was
announced only after subjects had taken their first decision. Table 1 summarizes the four
treatments.
Table 1: Treatments
Ego-depletion task First decision elicits Second decision
elicits
N
Treatment 1 high self-control risk preferences social preferences 43
Treatment 2 high self-control social preferences risk preferences 43
Treatment 3 low self-control risk preferences social preferences 47
Treatment 4 low self-control social preferences risk preferences 47
We describe the different stages of our experiment in more detail below.
Ego-depletion task:
To induce variations in situation-specific self-control, we use the crossing-out-letters task,
one of the best established and most frequently used ego-depletion tasks (see the meta-
analysis by Hagger et al. 2010 and Baumeister et al. 1998). This non-interactive, paper-and-
pencil task had two parts lasting seven minutes each. In both parts, participants got a text
with six paragraphs. Each paragraph had six lines of text. The content of the text (about the
pros and cons of different kinds of statistics software) was chosen to be relatively boring,
and, thus, not distracting.
6
For the first part of the task, subjects in both the LSC and the HSC treatment were instructed
to cross out and count each instance of the letter “e”, paragraph after paragraph. This
habituated all subjects to crossing out each instance of the letter “e”. In the second part of
the task, subjects in the LSC treatment received the new instruction to cross out and count
each letter “e” unless another vowel immediately followed the letter “e” or unless another
vowel was at a distance of exactly two letters from the letter “e” (in either direction).
Looking at _ _ e _ _, the letter “e” should not be crossed out when there was a vowel on
position 1, 3, or 4. Participants in the HSC treatment were provided with the same text, but
asked to continue crossing out and counting each letter “e” (i.e., maintain the habituated
behavior in part 2 of the task). These instructions ensured that only subjects in the LSC
treatment had to consume self-control resources to inhibit the habituated urge to cross out
each letter “e” in part 2 of the task.
We refrained from incentivizing performance in the ego-depletion task because there is
evidence that monetary incentives can mitigate depletion effects (Muraven and Slessareva
2003). We repeatedly emphasized the importance of doing the task right and collected the
task sheets for later control. Moreover, subjects knew that they would receive private
feedback about their performance in the crossing-out-letters task on the computer screen at
the end of the experiment.
Risk preferences:
In order to elicit risk preferences, we use the basic setup of Gneezy and Potters (1997) and
the subsequent literature surveyed in Charness and Gneezy (2012). Each subject receives 20
points and decides how many points y to invest in a risky option and how many to keep. The
invested amount y yields a dividend of 2.5y with probability 1/2 and is lost with probability
1/2, where y Є {0,1,2,…,20}. The money not invested, 20-y, is kept by the subject. The
resulting payoffs are 20-y+2.5y with probability 1/2 and 20-y with probability 1/2. Given our
parameters, risk-neutral and risk-seeking individuals invest all 20 points, while different
investment levels below 20 reflect different degrees of risk aversion. At the end of the
experiment, 4 points were converted into 1 Euro.
7
Social preferences:
We use a take game version of the dictator game to elicit (anti)social preferences. Two
subjects are matched randomly and anonymously. Each participant obtains an initial
endowment of 20 points. One of the two subjects decides how many points x to take from
the other passive subject, where x Є {0,1,2,…,20}.6 When taking x points from the other
subject, the taking subject obtains 20+x/4 and the other subject receives 20-x. This setting
clearly suggests that taking points is antisocial since it is characterized by an initially equal
distribution of endowments and a drastic inefficiency of taking. In order to disentangle the
effect of self-control on social and risk preferences, we do not add a probabilistic sanctioning
scheme to the take game. We share these features – inefficiency of taking from others and
absence of law enforcement – with Falk and Fischbacher’s (2002) setup of “crime” in the lab.
2.2 Experiment procedures
Subjects received written instructions that described the ego-depletion task in detail and
their first decision in general terms. In order to prevent that subjects could plan their exact
decision before completing the ego-depletion task, we represented the level of endowment,
the inefficiency parameter in the take game and the dividend in the winning state of nature
of the risky investment as general variables. In view of the evidence that many people
struggle with the concept of probabilities, we included the probability of 50% in the written
instructions. The second decision was only announced after subjects had made their first
decision to keep the first decision as clean as possible.
In each session, we elicited social preferences in the first decision and risk preferences in the
second decision for half of the subjects. The other half of subjects first made the decision
that elicits risk preferences followed by the decision that elicits social preferences. In the
take game, the active subject was randomly matched with another subject taking the risky
investment decision at that time. After participating in the ego-depletion task and making
the two decisions, subjects filled out a questionnaire eliciting data on their trait self-control,
age, sex, and subject of studies, among others.
6 The wording of the instructions was “As participant B, you choose an integer transfer amount that you would like to take from participant A’s endowment.”
8
The experiment was run in August and October 2013 at the experimental laboratory of the
University of Bonn, Germany (BonnEconLab). We used the experimental software z-Tree
(Fischbacher 2007) and the recruitment software ORSEE (Greiner 2003). In total, 180
students of various fields of study participated. Subjects were randomly assigned to sessions.
Sessions were framed neutrally and lasted about 60 minutes. Subjects did not receive a
show-up fee and earned 13.04 Euro on average.
3. Hypotheses
We derive our hypotheses from the General Theory of Crime (Gottfredson and Hirschi 1990),
which posits that individuals with low self-control are prone to criminal behavior since they
are less risk-averse and more insensitive towards others.
H1: Lower self-control causes less risk-averse behavior.
H2: Lower self-control causes more antisocial behavior.
Dual-system models offer an alternative source for deriving hypotheses. According to dual-
system models, subjects’ behavior in the low self-control treatment should be more affect-
based. Fudenberg and Levine (2006, 2011) present a dual-system model in which the
affective system is more risk-averse than the deliberative one, which contrasts with
Hypothesis H1.
Hypothesis H2 implies that selfish behavior is pushed by the affective system and inhibited
by the deliberative system. Hypothesis H2 is supported by Moore and Loewenstein (2004)
and Rachlin (2002), for example, while Haidt (2001) considers moral decisions to be
automatic.
When testing Hypotheses H1 and H2, we focus on the effect of situation-specific self-control
on risk and social preferences since our experiment design allows for an exogenous
manipulation of situation-specific self-control. Additionally, we test H1 and H2 using
information on the level of trait self-control based on the standard Grasmick scale (Grasmick
et al. 1993) that we have elicited in the post-experimental questionnaire.
9
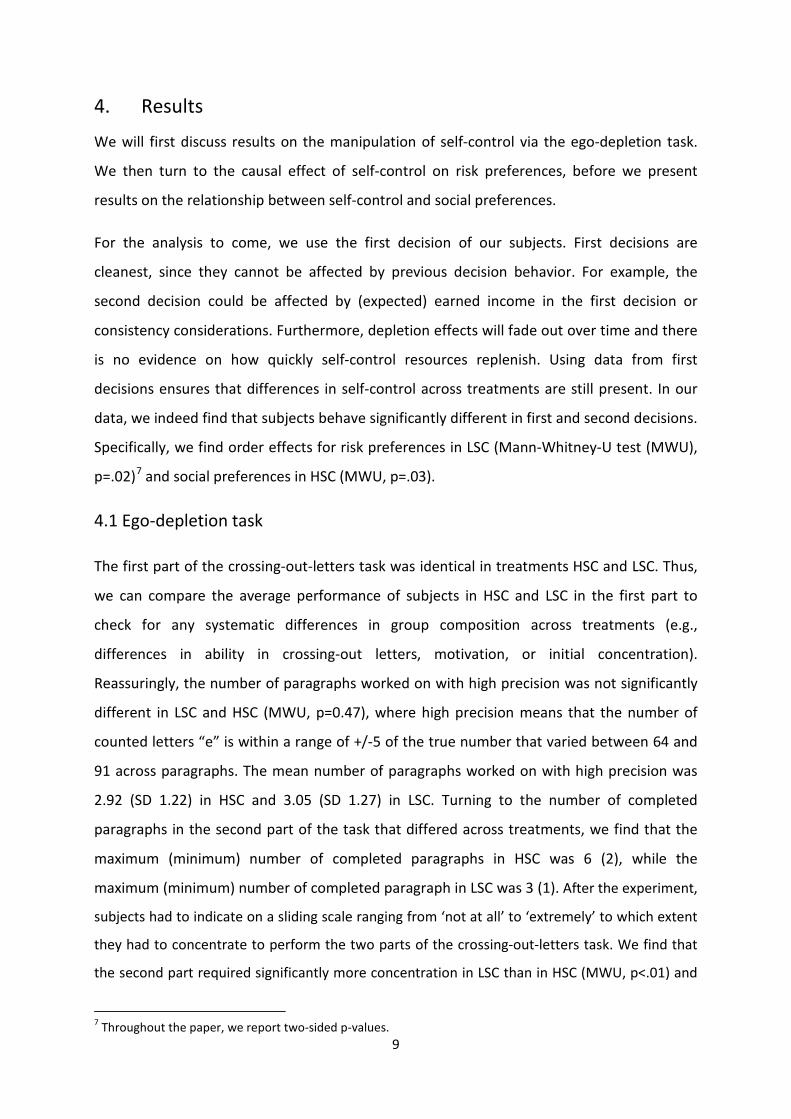
4. Results
We will first discuss results on the manipulation of self-control via the ego-depletion task.
We then turn to the causal effect of self-control on risk preferences, before we present
results on the relationship between self-control and social preferences.
For the analysis to come, we use the first decision of our subjects. First decisions are
cleanest, since they cannot be affected by previous decision behavior. For example, the
second decision could be affected by (expected) earned income in the first decision or
consistency considerations. Furthermore, depletion effects will fade out over time and there
is no evidence on how quickly self-control resources replenish. Using data from first
decisions ensures that differences in self-control across treatments are still present. In our
data, we indeed find that subjects behave significantly different in first and second decisions.
Specifically, we find order effects for risk preferences in LSC (Mann-Whitney-U test (MWU),
p=.02)7 and social preferences in HSC (MWU, p=.03).
4.1 Ego-depletion task
The first part of the crossing-out-letters task was identical in treatments HSC and LSC. Thus,
we can compare the average performance of subjects in HSC and LSC in the first part to
check for any systematic differences in group composition across treatments (e.g.,
differences in ability in crossing-out letters, motivation, or initial concentration).
Reassuringly, the number of paragraphs worked on with high precision was not significantly
different in LSC and HSC (MWU, p=0.47), where high precision means that the number of
counted letters “e” is within a range of +/-5 of the true number that varied between 64 and
91 across paragraphs. The mean number of paragraphs worked on with high precision was
2.92 (SD 1.22) in HSC and 3.05 (SD 1.27) in LSC. Turning to the number of completed
paragraphs in the second part of the task that differed across treatments, we find that the
maximum (minimum) number of completed paragraphs in HSC was 6 (2), while the
maximum (minimum) number of completed paragraph in LSC was 3 (1). After the experiment,
subjects had to indicate on a sliding scale ranging from ‘not at all’ to ‘extremely’ to which extent
they had to concentrate to perform the two parts of the crossing-out-letters task. We find that
the second part required significantly more concentration in LSC than in HSC (MWU, p<.01) and
7 Throughout the paper, we report two-sided p-values.

10
that the difference in the concentration required for part 2 and part 1 was significantly higher for
subjects in LSC (MWU, p<.01). As intended, treatment LSC was more demanding than
treatment HSC.
In general, subjects worked on the crossing-out-letters task in a concentrated and ambitious
manner. We are very confident that participation in treatment LSC resulted in subjects
having less self-control resources available than their counterparts in treatment HSC. The
results on effect sizes in the meta-analysis of Hagger et al. (2010) imply that the crossing-
out-letters task is an ego-depletion task that is especially successful in inducing low self-
control resources.
4.2 Subjects with low self-control are less risk-averse
Table 2 reports the mean investment in the risky option out of a total of 20 points for the full
sample and according to gender. For the whole sample, we find that subjects in LSC behave
less risk-averse. Subjects with low self-control invest 18% (or 1.7 points) more in the risky
option than subjects with high self-control. This is a large effect: other studies using ego-
depletion manipulations often find only subtle effect sizes.8 Moreover, DeBono et al. (2011)
argue that providing incentives for the decisions that follow the ego-depletion task is likely
to weaken treatment differences (because depletion can be overcome if the situation is
important enough).
Table 2: Mean level and standard deviation of investment in the risky option
(whole sample and gender-specific)
All
in HSC
All
in LSC
Male
in HSC
Male
in LSC
Female
in HSC
Female
in LSC
Mean level (SD) of
Investment
8.98
(5.60)
10.64
(5.57)
9.81
(6.01)
13.83
(5.47)
8.18
(5.20)
8.66
(4.72)
N 43 47 21 18 22 29
We additionally provide gender-specific results on risk preferences and the effect of self-
control on risk preferences to reflect the comprehensive evidence that risk preferences of
8 See, for example, Achtziger et al. (2012) for a paper that uses a very similar crossing-out-letters task as we do.
11
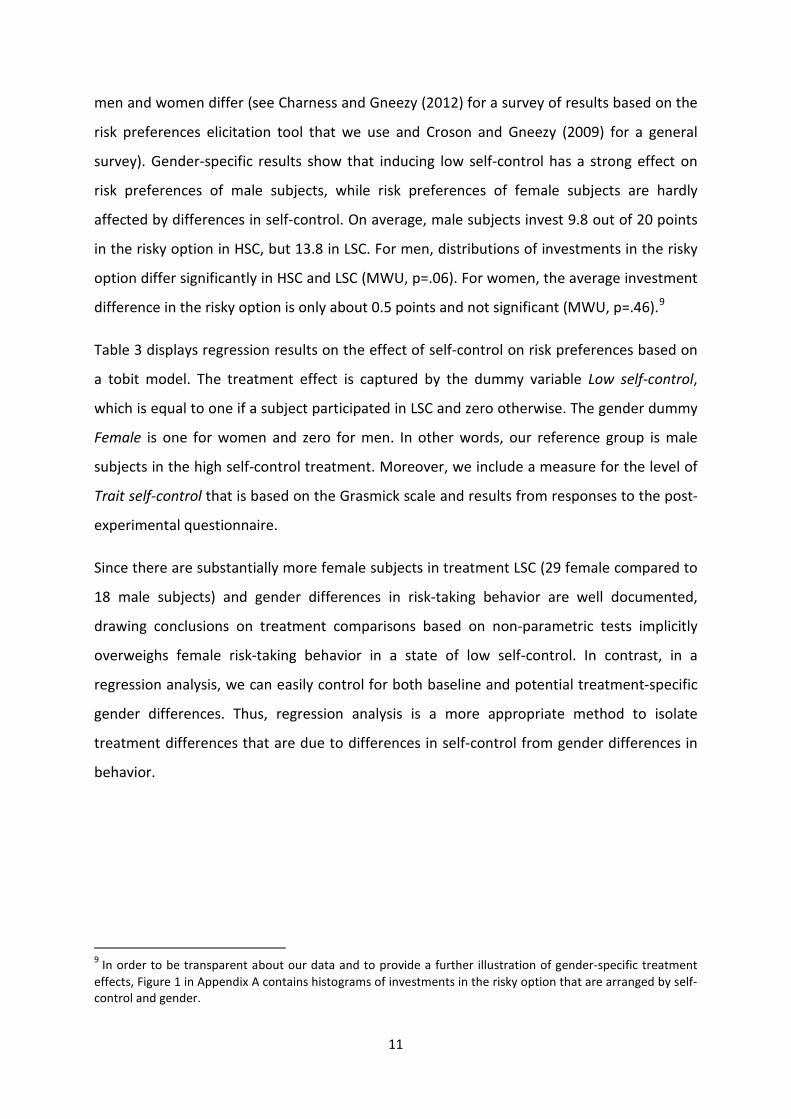
men and women differ (see Charness and Gneezy (2012) for a survey of results based on the
risk preferences elicitation tool that we use and Croson and Gneezy (2009) for a general
survey). Gender-specific results show that inducing low self-control has a strong effect on
risk preferences of male subjects, while risk preferences of female subjects are hardly
affected by differences in self-control. On average, male subjects invest 9.8 out of 20 points
in the risky option in HSC, but 13.8 in LSC. For men, distributions of investments in the risky
option differ significantly in HSC and LSC (MWU, p=.06). For women, the average investment
difference in the risky option is only about 0.5 points and not significant (MWU, p=.46).9
Table 3 displays regression results on the effect of self-control on risk preferences based on
a tobit model. The treatment effect is captured by the dummy variable Low self-control,
which is equal to one if a subject participated in LSC and zero otherwise. The gender dummy
Female is one for women and zero for men. In other words, our reference group is male
subjects in the high self-control treatment. Moreover, we include a measure for the level of
Trait self-control that is based on the Grasmick scale and results from responses to the post-
experimental questionnaire.
Since there are substantially more female subjects in treatment LSC (29 female compared to
18 male subjects) and gender differences in risk-taking behavior are well documented,
drawing conclusions on treatment comparisons based on non-parametric tests implicitly
overweighs female risk-taking behavior in a state of low self-control. In contrast, in a
regression analysis, we can easily control for both baseline and potential treatment-specific
gender differences. Thus, regression analysis is a more appropriate method to isolate
treatment differences that are due to differences in self-control from gender differences in
behavior.
9 In order to be transparent about our data and to provide a further illustration of gender-specific treatment effects, Figure 1 in Appendix A contains histograms of investments in the risky option that are arranged by self-control and gender.
12
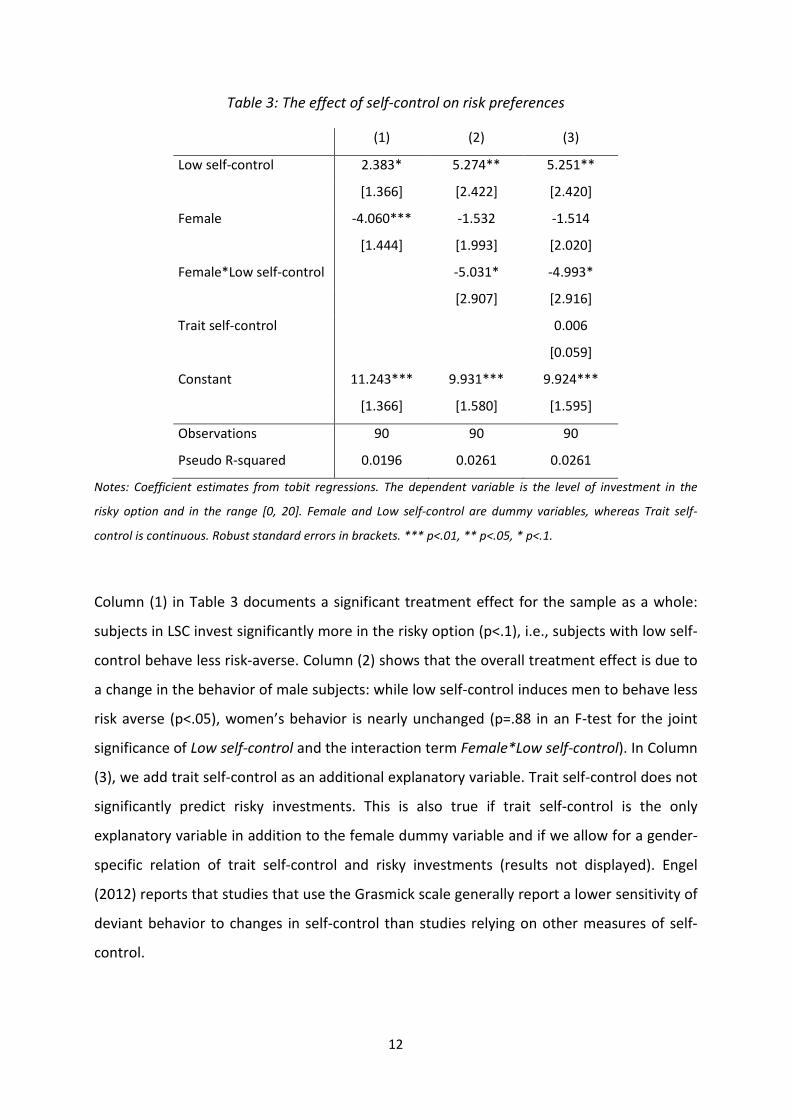
Table 3: The effect of self-control on risk preferences
(1) (2) (3)
Low self-control 2.383* 5.274** 5.251**
[1.366] [2.422] [2.420]
Female -4.060*** -1.532 -1.514
[1.444] [1.993] [2.020]
Female*Low self-control -5.031* -4.993*
[2.907] [2.916]
Trait self-control
0.006
[0.059]
Constant 11.243*** 9.931*** 9.924***
[1.366] [1.580] [1.595]
Observations 90 90 90
Pseudo R-squared 0.0196 0.0261 0.0261
Notes: Coefficient estimates from tobit regressions. The dependent variable is the level of investment in the
risky option and in the range [0, 20]. Female and Low self-control are dummy variables, whereas Trait self-
control is continuous. Robust standard errors in brackets. *** p<.01, ** p<.05, * p<.1.
Column (1) in Table 3 documents a significant treatment effect for the sample as a whole:
subjects in LSC invest significantly more in the risky option (p<.1), i.e., subjects with low self-
control behave less risk-averse. Column (2) shows that the overall treatment effect is due to
a change in the behavior of male subjects: while low self-control induces men to behave less
risk averse (p<.05), women’s behavior is nearly unchanged (p=.88 in an F-test for the joint
significance of Low self-control and the interaction term Female*Low self-control). In Column
(3), we add trait self-control as an additional explanatory variable. Trait self-control does not
significantly predict risky investments. This is also true if trait self-control is the only
explanatory variable in addition to the female dummy variable and if we allow for a gender-
specific relation of trait self-control and risky investments (results not displayed). Engel
(2012) reports that studies that use the Grasmick scale generally report a lower sensitivity of
deviant behavior to changes in self-control than studies relying on other measures of self-
control.

13
We summarize the findings of this section:
Result 1a: Low situational self-control causes significantly less risk-averse behavior.
Result 1b: Low trait self-control is not a significant predictor of risk preferences.
Next, we turn to Hypothesis H2 that addresses the effect of self-control on social
preferences as measured in the take game.
4.3 No significant effect of self-control on social preferences
Our measure of social preferences is the number of points that subjects take from the
endowment of another subject who initially possesses 20 points. Table 4 reports the average
amount taken for the full sample and according to gender. In contrast to Hypothesis H2 that
is based on the General Theory of Crime, we find that on average subjects take 12% (1.6
points) less in treatment LSC than in treatment HSC, i.e., subjects with low self-control tend
to behave more prosocial.
Similar to the case of risk preferences, there is some (somewhat weaker) evidence for
gender differences in social preferences in our data. Such differences are reported
frequently, although the evidence is not as clear-cut for social preferences as it is for risk
preferences (see, e.g., the survey of Croson and Gneezy 2009).10 The gender-specific results
illustrate that the overall difference in social preferences arises due to the effect of self-
control on social preferences of female subjects. On average, women in LSC take 2 points
less than in HSC. The distribution of the taken amount by women, however, is not
significantly different for high and low self-control (MWU, p=.19). The average taken amount
of men is nearly unchanged across treatments and there is no significant treatment
difference (MWU, p=.96).11
10 In an especially careful study of a dictator game, Eckel and Grossman (2008) conclude that women behave more prosocial than men. However, our take game is in the domain of antisocial as opposed to prosocial behavior and additionally characterized by inefficiency of transfers. Varying the price of giving in a dictator game, Andreoni and Vesterlund (2001) show that men care more about efficient outcomes, which, in our experiment, could decrease potential gender differences in social preferences. With respect to antisocial or deviant behavior, Dreber and Johannesson (2008) and Erat and Gneezy (2012) document that women are more averse to lying. 11 Figure 2 in Appendix A contains histograms of the taken amount that are arranged by self-control and gender.
14
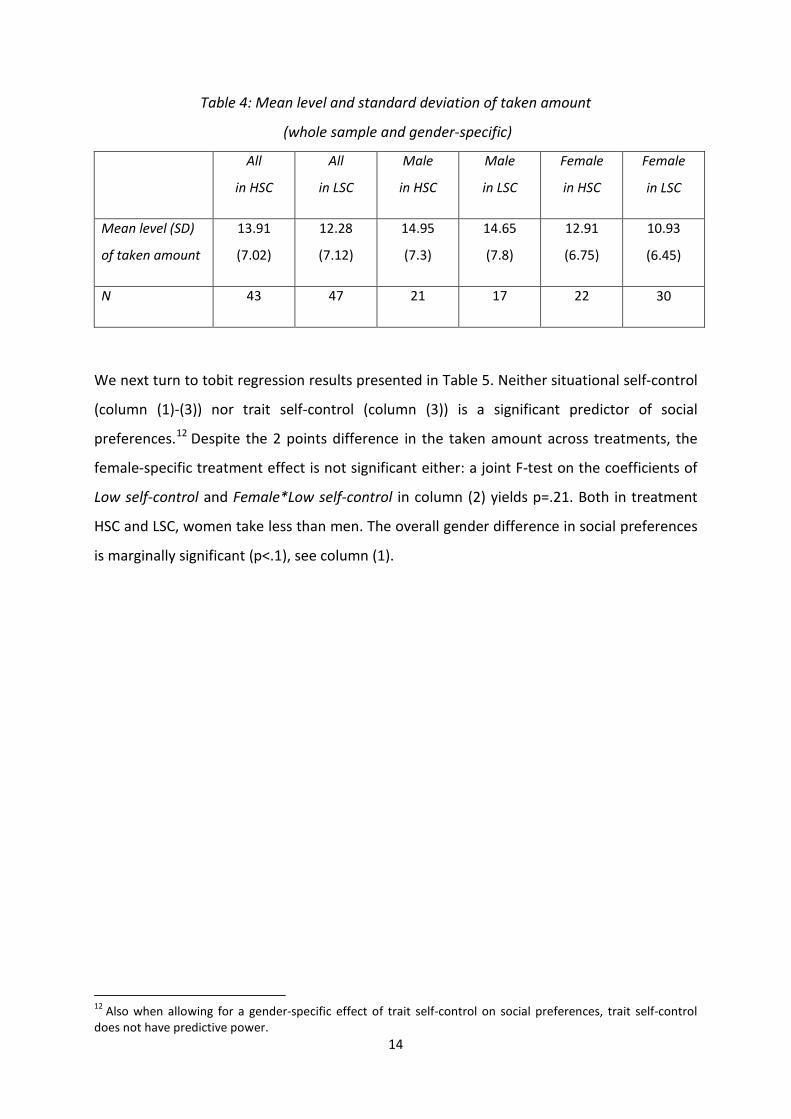
Table 4: Mean level and standard deviation of taken amount
(whole sample and gender-specific)
All
in HSC
All
in LSC
Male
in HSC
Male
in LSC
Female
in HSC
Female
in LSC
Mean level (SD)
of taken amount
13.91
(7.02)
12.28
(7.12)
14.95
(7.3)
14.65
(7.8)
12.91
(6.75)
10.93
(6.45)
N 43 47 21 17 22 30
We next turn to tobit regression results presented in Table 5. Neither situational self-control
(column (1)-(3)) nor trait self-control (column (3)) is a significant predictor of social
preferences.12 Despite the 2 points difference in the taken amount across treatments, the
female-specific treatment effect is not significant either: a joint F-test on the coefficients of
Low self-control and Female*Low self-control in column (2) yields p=.21. Both in treatment
HSC and LSC, women take less than men. The overall gender difference in social preferences
is marginally significant (p<.1), see column (1).
12 Also when allowing for a gender-specific effect of trait self-control on social preferences, trait self-control does not have predictive power.

15
Table 5: The effect of self-control on social preferences
(1) (2) (3)
Low self-control -2.687 -0.534 -0.454
[2.827] [5.209] [5.164]
Female -5.527* -3.725 -3.586
[2.964] [4.254] [4.317]
Female*Low self-control -3.546 -3.555
[6.107] [6.077]
Trait self-control
0.104
[0.166]
Constant 19.999*** 19.022*** 18.819***
[2.796] [3.328] [3.379]
Observations 90 90 90
Pseudo R-squared 0.0122 0.0131 0.0142
Notes: Coefficient estimates from tobit regressions. The dependent variable is the number of points taken from
another participant and in the range [0, 20]. Female and Low self-control are dummy variables, whereas Trait
self-control is continuous. Robust standard errors in brackets. *** p<.01, ** p<.05, * p<.1.
We summarize the findings of this section:
Result 2a: Low situational self-control does not have a significant impact on social
preferences.
Result 2b: Low trait self-control is not a significant predictor of social preferences.
5. Related literature and discussion of results
In this section, we first compare our results to those of other studies that also use an ego-
depletion manipulation and study the effect of self-control on risk-related and prosocial
behavior (both defined in a very broad sense). Besides ego-depletion, time pressure and
cognitive load are two further mechanisms that have been used to study predictions of dual-
system models. In the dual-system paradigm, low self-control, high time pressure, and high
cognitive load are often considered alternative tools to induce more automatic and affect-
based decisions as opposed to more deliberative ones (e.g., Lobel and Loewenstein 2005).
16
Therefore, we proceed by briefly discussing the literature on the effects of time pressure or
cognitive load on risk preferences and social preferences.
Using an ego-depletion manipulation, Freeman and Muraven (2010) find that subjects with
low self-control are less “risk”-averse. However, choices in their first experiment were not
incentivized and subjects in both experiments decided under ambiguity instead of risk (i.e.,
without knowing the probabilities of the different states of the world). Unger and Stahlberg
(2011) report that depleted subjects with low self-control make more risk-averse decisions.
In their strongly framed investment experiment, subjects were asked to imagine that they
were a manager making a decision on behalf of their firm. Consequently, subjects’ decisions
do not necessarily reflect only their own risk preferences.13 In contrast, our experiment is
the first to use a standard tool applied by many economists for measuring risk preferences
(the one introduced by Gneezy and Potters 1997) and documents that depleted subjects
with low self-control behave less risk-averse.
A few papers use an ego-depletion manipulation to investigate the effect of low self-control
on prosocial behavior, while our focus is on antisocial behavior. In an ultimatum game,
Achtziger et al. (2012) find that depleted proposers make slightly lower offers than non-
depleted proposers.14 Acceptance rates of depleted and non-depleted responders are not
significantly different. It is difficult to compare our setting to that of Achtziger et al. (2012)
because we have no similar strategic, interactive, or repeated game element. If anything,
one could argue that our finding that social preferences are not significantly affected by self-
control has a similar spirit as responder behavior in Achtziger et al. (2012). Even more
loosely related to our study, Xu et al. (2012) show that, in a dictator game, depleted subjects
give away less money than non-depleted subjects to apologize for previously imposing
negative externalities (loud noise) on other participants. DeWall et al. (2008) report data
about the effects of low self-control on helping and find that depleted subjects are less
willing to help. Gino et al. (2011) consider the link between ego-depletion and cheating the
experimenter in a problem-solving task and document that more depleted subjects
13 For example, Pahlke et al. (2012) provide evidence that individuals behave more risk averse in the gain domain if others are affected by their decision as well. 14 Depleted proposers offer 2.68 Euro out of a total of 7 Euro to responders, whereas non-depleted proposers offer 2.84 Euro. Due to the large number of observations in their repeated game, this small difference is statistically significant.

17
overstate their performance. In contrast to our take game, cheating has no efficiency
implications and does not impose harm on another participant of the experiment.
We now turn to studies that use time pressure instead of ego-depletion to induce decisions
steered by the affective system (based on the assumption that deliberative processes are
more time-consuming than affective ones). Sutter et al. (2003) and Cappalletti et al. (2011)
study ultimatum games and find that responders under time pressure are more likely to
reject. These results suggest that, fairness considerations have a greater weight relative to
monetary considerations under the affective system rather than the deliberative system.
Additionally, Cappalletti et al. (2011) find that proposers offer more under time pressure.
Proposer behavior is less straightforward to interpret, since proposers may also reason
strategically.
Cognitive load is still another manipulation which consumes self-control resources. In
contrast to ego-depletion which exhausts self-control resources before the decision of
interest, cognitive load occupies self-control resources during the decision of interest. Schulz
et al. (forthcoming), Hauge et al. (2009), and Cornelissen et al. (2011) use dictator games to
study the effect of cognitive load on prosocial behavior. Hauge et al. (2009) and Cornelissen
et al. (2011) do not find a significant treatment effect of cognitive load on prosocial
behavior15, while in Schulz et al. (forthcoming) subjects with higher cognitive load behave
more prosocial. In the domain of risky choices, Benjamin et al. (2012) report results of an
experiment in which higher cognitive load induces more risk-averse behavior.
In sum, studies on the effect of low self-control (induced by ego-depletion, time pressure, or
cognitive load) on risk preferences are scarce. In contrast, somewhat more evidence is
available on the relation between self-control and prosocial behavior. However, these
studies differ widely in which facet of prosocial behavior they measure and in how they
manipulate self-control, which makes it somewhat hazardous to compare their results. Still it
is fair to say that, so far, evidence on the effect of self-control on social preferences is
inconclusive. Our study adds evidence on the absence of a significant effect of self-control
on antisocial behavior.
15 In their study of the ultimatum game, Cappalletti et al. (2011) also consider a cognitive load manipulation and do not find a significant treatment effect.
18
6. Conclusion
Perpetrators are popularly considered to be impulsive with little ability to resist temptations
posed by criminal opportunities. The influential General Theory of Crime proposes that low
self-control ability is the most important cause of crime. It argues that individuals with low
self-control behave in a less risk-averse and more antisocial manner. Our study exogenously
manipulates the level of self-control in a laboratory experiment to explore the causal effect
of self-control on risk and social preferences. We do not find a significant effect of self-
control on social preferences. As hypothesized in the General Theory of Crime, we find that
subjects with low self-control resources are less risk-averse. It is noteworthy that this result
contrasts with the dual-system model of Fudenberg and Levine (2006) that suggests that
lower self-control induces more risk-averse behavior. Furthermore, the result that lower
self-control causes less risk-averse behavior provides an example for endogenous risk
preferences.
In sum, our results support the proposition of the General Theory of Crime that low self-
control is a facilitator of criminal behavior. Taking the gender-specificity of effects into
account, our results imply that it is mainly men with low self-control who are more likely to
engage in crime.
Acknowledgements
Financial support from SFB-TR 15 is gratefully acknowledged. We thank Majied Ammar
Mahran and Geraldine Reichard for excellent assistance in programming and implementing
the experiment. We are grateful for the helpful comments by Laszlo Goerke, Matthias
Wibral, Jana Willrodt, and participants in research seminars at the University of Düsseldorf
and the University of Trier.

19
References
Achtziger, A., Alos-Ferrer, C., and A.K. Wagner, 2012. Social preferences and self-control. Mimeo.
Anderson, D.A., 1999. The aggregate burden of crime. Journal of Law and Economics 42, 611-642.
Andreoni, J. and L. Vesterlund, 2001. Which is the fair sex? Gender differences in altruism. Quarterly Journal of Economics 116, 293-312.
Baumeister, R.F., Bratslavsky, E., Muraven, M., and D.M. Tice, 1998. Ego Depletion: Is the active self a limited resource? Journal of Personality and Social Psychology 74, 1252-1265.
Becker, G. S., 1968. Crime and punishment: an economic approach. Journal of Political Economy 76, 169-217.
Benjamin, D.J., Brown, S.A., and J.M. Shapiro, 2012. Who is `behavioral’? Cognitive ability and anomalous preferences. Journal of the European Economic Association 11, 1231-1255.
Birkeland, S., Cappelen, A.W., Sorensen, E., and B. Tungodden, forthcoming. An experimental study of prosocial motivation among criminals. Experimental Economics.
Cappalletti, D., Güth, W., and M. Ploner, 2011. Being of two minds: Ultimatum offers under cognitive constraints. Journal of Economic Psychology 32, 940-950.
Charness, G. and U. Gneezy, 2012. Strong evidence for gender differences in risk taking. Journal of Economic Behavior & Organization 83, 50–58.
Chintrakarn, P. and D. Herzer, 2012. More inequality, more crime? A panel cointegration analysis for the United States. Economics Letters 116, 389–391.
Chmura, T., Engel, C., and M. Englerth, 2013. Selfishness as a potential cause of crime - a prison experiment. Preprints of the Max Planck Institute for Research on Collective Goods Bonn 2013/5.
Conte, A., Levati, M.V., and C. Nardi, 2013. The role of emotions on risk preferences: An experimental analysis. Jena Economic Research Paper 2013-046.
Cornelissen, G., Dewitte, S., and L. Warlop, 2011. Are social value orientations expressed automatically? Decision making in the Dictator Game. Personality and Social Psychology Bulletin 37, 1080-1090.
Croson, R. and U. Gneezy, 2009. Gender differences in preferences. Journal of Economic Literature 47, 1-27.

20
DeBono, A., Shmueli, D., and M. Muraven, 2011. Rude and inappropriate: The role of self-control in following social norms. Personality and Social Psychology Bulletin 37, 136-146.
DeHaan, W. and J. Vos, 2003. A crying shame: The over-rationalized conception of man in the rational choice perspective. Theoretical Criminology 7, 29-54.
DeWall, N.C., Baumeister, R.F., Gailliot, M.T., and J.K. Maner, 2008. Depletion makes the heart grow less helpful: Helping as a function of self-regulatory energy and genetic relatedness. Personality and Social Psychology Bulletin 34, 1653-1662.
Dreber, A. and M. Johannesson, 2008. Gender differences in deception. Economics Letters 99, 197-199.
Eckel, C.C. and P.J. Grossman, 2008. Differences in the economic decisions of men and women: Experimental evidence. In: Plott, C., and V. Smith (Eds.). Handbook of Experimental Economics Results, 509-519.
Engel, C., 2012. Low self-control as a source of crime. Preprints of the MPI for Research on Collective Goods 2012/4.
Erat, S. and U. Gneezy, 2012. White lies. Management Science 58, 723-733.
Evans, J., 2008. Dual-processing accounts of reasoning, judgment, and social cognition. Annual Review of Psychology 59, 255-278.
Fajnzylber, P., Lederman, D., and N. Loayza, 2002. What causes violent crime? European Economic Review 46, 1323-1357.
Falk, A. and U. Fischbacher, 2002. “Crime” in the lab – detecting social interaction. European Economic Review 46, 859-869.
Fehr, E. and K. Hoff, 2011. Introduction: tastes, castes and culture: the influence of society on preferences. Economic Journal 121, F396–F412.
Fischbacher, U., 2007. z-Tree: Zurich toolbox for ready-made economic experiments. Experimental Economics 10, 171-178.
Fleisher, B.M., 1966. The effect of income on delinquency. American Economic Review 56, 118-137.
Freeman, N. and M. Muraven, 2010. Self-control depletion leads to increased risk taking. Social Psychology and Personality Science 1, 175-181.
Fudenberg, D. and D.K. Levine, 2006. A dual-self model of impulse control. American Economic Review 96, 1449–1476.
Fudenberg, D. and D.K. Levine, 2011. Risk, delay, and convex self-control costs. American Economic Journal: Microeconomics 3, 34–68.

21
Fudenberg, D. and D.K. Levine, 2012. Timing and self-control. Econometrica 80, 1–42.
Gino, F., Schweitzer, M.E., Mead, N.L., and D. Ariely, 2011. Unable to resist temptation: How self-control depletion promotes unethical behavior. Organizational Behavior and Human Decision Processes 115, 191-203.
Gneezy, U. and J. Potters, 1997. An experiment on risk-taking and evaluation periods. Quarterly Journal of Economics 112, 631-645.
Gottfredson, M.R. and T. Hirschi, 1990. A general theory of crime. Stanford, CA: Stanford University Press.
Guisi, L., Sapienza, P., and L. Zingales, 2013. Time varying risk aversion. NBER WP 19284.
Grasmick, H.G., Tittle, C.R., Bursik, R.J., and B.J. Arneklev, 1993. Testing the core empirical implications of the general theory of crime. Journal of Research in Crime and Delinquency 30, 5-29.
Greiner, B., 2003. An online recruitment system for economic experiments. In: Kremer, K., and V. Macho Eds., Forschung und wissenschaftliches Rechnen, GWDG Bericht 63, Göttingen: Ges. für Wiss. Datenverarbeitung, 79-93.
Hagger, M. S., Wood, C., Nikos, C. S., and L.D. Chatzisarantis, 2010. Ego depletion and the strength model of self-control: A meta-analysis. Psychological Bulletin 136, 495–525.
Haidt, J., 2001. The emotional dog and its rational tail: A social intuitionist approach to moral judgment. Psychological Review 108, 814-834.
Harbaugh, W.T., Mocan, N., and M.S. Visser, 2013. Theft and deterrence. Journal of Labor Research 34, 389-407.
Hauge, K., Brekke, K.A., Johansson, L.O., Stenmann-Johansson, O., and H. Svedsäter, 2009: Are social preferences skin deep? Dictators under cognitive load. Working Paper in Economics 371, University of Gothenburg.
Jacob, B., Lefgren, L., and E. Moretti, 2007. The dynamics of criminal behavior: evidence from weather shocks. Journal of Human Resources 42, 489-527.
Kahneman, D., 2003. A perspective on judgment and choice: Mapping bounded rationality. American Psychologist 58, 697–720.
Kahneman, D., 2011. Thinking, fast and slow. Macmillan.
Khadjavi, M., 2014. On the interaction of deterrence and emotions. Mimeo.
Lobel, J. and G. Loewenstein, 2005. Emote control: The substitution of symbol for substance in foreign policy and international law. Chicago Kent Law Review 80, 101-147.
22
Moore, D.A. and G. Loewenstein, 2004. Self-interest, automaticity, and the psychology of conflict of interest. Social Justice Research 17, 189-202.
Muraven, M. (forthcoming). Ego-depletion: Theory and evidence. In R. M. Ryan (Ed.), Oxford handbook of motivation. Oxford: Oxford University Press
Muraven, M. and R.F. Baumeister, 2000. Self-regulation and depletion of limited resources: Does self-control resemble a muscle? Psychological Bulletin 126, 247-259.
Muraven, M., Pogarsky, G., and D. Shmueli, 2006. Self-control depletion and the general theory of crime. Journal of Quantitative Criminology 22, 263-277.
Muraven, M. and E. Slessareva, 2003. Mechanisms of self-control failure: Motivation and limited resources. Personality and Social Psychology Bulletin 29, 894-906.
Nguyen, Y. and C.N. Noussair, 2013. Risk aversion and emotions. CentER Discussion Paper 2013-041, Tilburg: Economics.
Pahlke, J., Strasser, S., and F.M. Vieider, 2012. Risk-taking for others under accountability. Economics Letters 114, 102–105.
Pratt, T.C. and F.T. Cullen, 2000. The empirical status of Gottfredson and Hirschi’s General Theory of Crime: A meta-analysis. Criminology 38, 931-964.
Priks, M., 2010. Does frustration lead to unruly behavior? Evidence from the Swedish hooligan scene. Kyklos 63, 450-460.
Rachlin, H., 2002. Altruism and selfishness. The Behavioral and Brain Sciences 25, 239-250.
Rustichini, A., 2008. Dual or unitary system? Two alternative models of decision-making. Cognitive, Affective, and Behavioral Neuroscience 8, 355-362.
Schildberg-Hörisch, H. and C. Strassmair, 2012. An experimental test of the deterrence hypothesis. Journal of Law, Economics, and Organization 28, 447-459.
Schulz, J., Fischbacher, U., Thoeni, C., and V. Utikal, forthcoming. Affect and fairness: Dictator games under cognitive load. Journal of Economic Psychology.
Sutter, M., Kocher, M., and S. Strauss, 2003. Bargaining under time pressure in an experimental ultimatum game. Economics Letters 81, 341-347.
Unger, A. and D. Stahlberg, 2011. Ego-depletion and risk behavior: Too exhausted to take a risk. Social Psychology 42, 28-38.
Wikström, P.O.H. and K. Treiber, 2007. The role of self-control in crime causation: Beyond Gottfredson and Hirschi’s General Theory of Crime. European Journal of Criminology 4, 237-264.

23
Xu, H., Bègue, L., and B.J. Bushman, 2012. Too fatigued to care: Ego depletion, guilt, and prosocial behavior. Journal of Experimental Social Psychology 48, 1183-1186.

24
Appendix A: Histograms
In order to further document the gender-specific treatment effect, Figure 1 depicts the
histograms for investments in the risky option in HSC and LSC for male and female subjects.
It shows that the share of men who invest the maximum amount in the risky option (i.e.,
who behave in a risk-neutral or risk-seeking manner) increases substantially from about 15%
in HSC to more than 40% in LSC. Figure 1 also illustrates the absence of a treatment effect
regarding the behavior of female subjects.
Figure 1: Histograms of investment in risky option arranged by self-control and gender
Figure 2 presents gender-specific histograms of the taken amount in treatments HSC and
LSC. They illustrate that social preferences of men are not affected by self-control, while
women with high self-control tend to behave more antisocial. For example, close to 40% of
women take the maximum amount of 20 points in HSC, while less than 15% do in LSC.

25
Figure 2: Histograms of taken amount arranged by self-control and gender
26
Appendix B: Translated version of the instructions for the LSC [HSC] treatment for risky
investment first
General explanations
Welcome to this economic experiment.
In the following, we explain how you can earn money from your decisions in this experiment.
Please read the instructions carefully. If you have any questions, please raise your hand and
we will come to your seat.
During the whole experiment it is not allowed to talk to the other participants, to use cell
phones, or to launch any programs on the computer. Disregarding any of these rules will
lead to your exclusion from the experiment and from all payments.
During the experiment, your gains and losses are counted in points instead of in Euro. Your
total income will be calculated in points first. At the end of the experiment, your total points
will be converted into Euro: 1 point=25 Cents. At the end of the experiment, you will receive
the income that results from your decision in cash.
In the following paragraphs we will describe the exact experimental procedure.
The experiment
First, we will describe your decision situation in general terms, using the variables X and Y
that are explained below. We will assign numerical values to the variables X and Y during the
course of the experiment and show them to you on the screen.
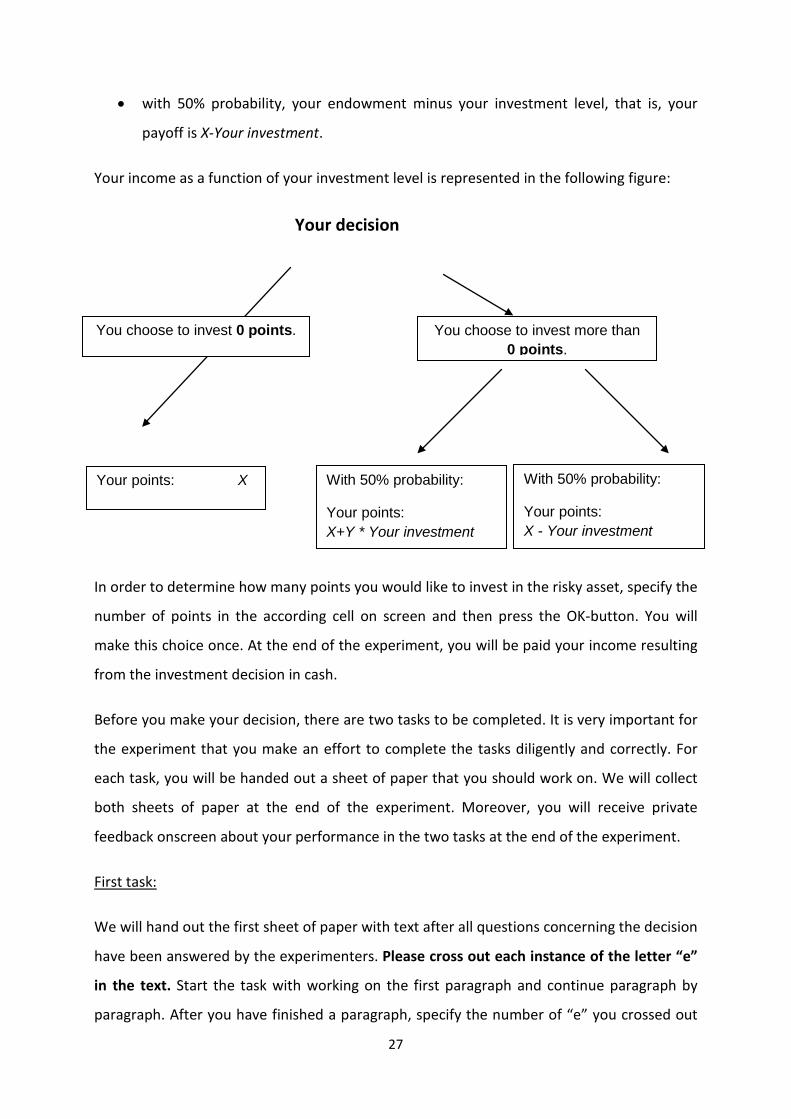
In this experiment, you will make a decision which influences only your payoff. You receive
an endowment of X points and decide how many of these X points to invest in a risky asset.
Your income in this experiment is determined by your investment level as follows:
If you invest 0 points, you will receive your endowment amounting to X points as income.
If you invest more than 0 points, you will receive:
• with 50% probability, your endowment plus Y times your investment level, that is,
your income is X+Y * Your investment. Y is greater than 1.
27
• with 50% probability, your endowment minus your investment level, that is, your
payoff is X-Your investment.
Your income as a function of your investment level is represented in the following figure:
Your decision
In order to determine how many points you would like to invest in the risky asset, specify the
number of points in the according cell on screen and then press the OK-button. You will
make this choice once. At the end of the experiment, you will be paid your income resulting
from the investment decision in cash.
Before you make your decision, there are two tasks to be completed. It is very important for
the experiment that you make an effort to complete the tasks diligently and correctly. For
each task, you will be handed out a sheet of paper that you should work on. We will collect
both sheets of paper at the end of the experiment. Moreover, you will receive private
feedback onscreen about your performance in the two tasks at the end of the experiment.
First task:
We will hand out the first sheet of paper with text after all questions concerning the decision
have been answered by the experimenters. Please cross out each instance of the letter “e”
in the text. Start the task with working on the first paragraph and continue paragraph by
paragraph. After you have finished a paragraph, specify the number of “e” you crossed out
You choose to invest 0 points. You choose to invest more than 0 points.
Your points: X With 50% probability:
Your points: X+Y * Your investment
With 50% probability:
Your points: X - Your investment

28
in the paragraph in the field below the paragraph. We will check later on whether you
crossed out the number of “e” indicated.
You have 7 minutes to work on the task. Rather spend more time on few paragraphs and do
them right instead of trying to do many paragraphs. The time remaining for the task is
shown in the upper right corner of your screen. A new display will appear after the 7
minutes have passed. Please insert the number of counted “e” for each completed
paragraph on the screen. Enter a zero for each paragraph not worked on or not completed.
Second task:
After you have finished the first task, we will hand out a second sheet of paper with text. You
now have to cross out the letter “e” according to the following set of rules:
Generally you cross out the letter “e”; however, there are the following exceptions:
(a) there is a vowel in the text after the letter “e” or
(b) there is a vowel in the text two letters after the letter “e”, or
(c) there is a vowel in the text two letters before the letter “e”.
In counting letters, disregard full stops, commas, or spaces. You are asked to cross out the
“e” if there is a vowel directly before the “e” (as, for instance, in the example “were
engaged” (in German “etwa elf”)). Vowels comprise: A, Ä, E, I, O, Ö, U, Ü.
The following representation summarizes the rules:
_ _ e _ _
1 2 3 4
Cross out all “e” in principle. Exceptions: Do not cross out the “e” if there is a vowel on
position 1, 3, or 4.
[HSC Treatment: After you have finished the first task, we will hand out a second sheet of
paper with text. Please again cross out each instance of the letter “e” in the text. This is the
same instruction as used for the first task.]
29
Please start again with the first paragraph and continue paragraph by paragraph. Specify the
number of “e” you crossed out in the paragraph in the field below it. We will check later on
whether you crossed out the number of “e” indicated.
Again, you have 7 minutes to work on the task. Spend rather more time on few paragraphs
and do them right instead of trying to do many paragraphs. The time remaining is shown in
the upper right corner of the screen. A new display will appear after the 7 minutes have
passed. Please insert the number of counted “e” for each completed paragraph on the
screen. Enter a zero for each paragraph not worked on or not completed.
Subsequent to the two tasks, you will make your previously described decision concerning
the level of investment. At the end of the experiment, all participants will receive their
income resulting from the investment decision in cash.
Please raise your hand in case you have any questions. One of the experimenters will come
to you to answer it.
Another experiment
Next, you will make one further decision. This is your last decision in this experiment. Again,
we will describe the decision situation in general terms. The numerical values of the
variables W and Z that are introduced below will be shown onscreen during the course of
the experiment.
There are two kinds of participants, A and B. You will participate as participant B. Your
anonymity and your randomly assigned participant A’s anonymity will be ensured during and
after the experiment. Each pair consists of a real participant A and a real participant B.
You as a participant B receive an endowment amounting to W points. Participant A also
receives an endowment of W points.
As participant B, you choose an integer transfer amount that you would like to take from
participant A’s endowment. Participant A does not make a decision and cannot influence
your payoff. For each point that you take from A, you receive Z points. Z is smaller than one.

30
Your income is given by your endowment of W points plus Z times your chosen transfer
amount. Participant A receives an income that equals his endowment of W points minus the
transfer amount determined by you.
Specifically: You determine how many points are transferred from participant A to you. Your
income is (W + Z*transfer amount) points. Participant A receives an income amounting to (W
– transfer amount) points.
In order to determine how many points you would like to take from participant A, specify
the number of points in the according cell on screen and press the OK-button.
At the end of the experiment, all participants A and B will receive their income resulting
from the transfer decision in cash.
You will make this decision once.