cree diabetes information system (cdis) 2009 annual report cdis report.pdf · cree diabetes...
TRANSCRIPT

Cree Diabetes Information System (CDIS) 2009 Annual ReportCree Diabetes Information System (CDIS) 2009 Annual Report
Prepared by:Elena Kuzmina, Pierre Lejeune, David Dannenbaum and Jill Elaine Torrie
Public Health Report Series 3 on DiabetesCree Board of Health and Social Services of James Bay December 2010 Revised January 26, 2011

Cree Diabetes Information System (CDIS) 2009 Annual Report
Public Health Department
Public Health Report Series 3 on Diabetes Cree Board of Health and Social Services of James Bay December 2010 Revised January 26, 2011

The cover picture of Conrad Mianscum and Devine Loon, of Mistissini, is an example of the Maamuu Nakaahehtaau (“Together, let’s prevent it”) Campaign happening in Eeyou Istchee.
Authors: Elena Kuzmina Research and Evaluation Program Officer Public Health Department of the Cree Territory of James Bay elena.kuzmina @ssss.gouv.cq.ca
David Dannenbaum Medical Adviser for Chronic Diseases Public Health Department of the Cree Territory of James Bay [email protected]
Jill Elaine Torrie Assistant Director of Public Health Public Health Department of the Cree Territory of James Bay [email protected]
Analysis: Pierre Lejeune Consultant Health Data Management and Analysis [email protected]
Reproduction is authorised for non-commercial purposes on condition the source is acknowledged.
Copies of this report can be found at: http://www.creehealth.org
Series editor & coordinator: Jill Elaine Torrie [email protected]
Cover design: Katya Petrov [email protected]
Photo: Stanley Mianscum
© All rights reserved Cree Board of Health and Social Services of James Bay, Chisasibi, Quebec JOM 1E0, December 2010
ISSN: 1712-9249Legal deposit: 4th trimester 2010National Library of Canada, 2010Bibliothèque Nationale du Québec, 2010

TABLE OF CONTENTS
EXECUTIVE SUMMARY: CDIS 2009 ANNUAL UPDATE .............................................................................................. I
FOREWORD TO THE PUBLIC HEALTH REPORT SERIES ............................................................................................. 1
FOREWORD TO THE ANNUAL DIABETES REPORT ................................................................................................... 2
INTRODUCTION ..................................................................................................................................................... 3
THE CREE DIABETES INFORMATION SYSTEM .......................................................................................................... 4
GOALS OF THE CDIS ....................................................................................................................................................... 4 DATA COLLECTION AND QUALITY ASSURANCE ....................................................................................................................... 4
METHODS .............................................................................................................................................................. 6
DATA SOURCES AND DEFINITIONS ...................................................................................................................................... 6 STATISTICAL MEASURES ................................................................................................................................................... 6
PREVALENCE OF DIAGNOSED DIABETES ................................................................................................................. 7
OVERVIEW .................................................................................................................................................................... 7 PREVALENCE BY SEX ........................................................................................................................................................ 8 PREVALENCE BY AGE ....................................................................................................................................................... 9 PREVALENCE BY GEOGRAPHIC AREA .................................................................................................................................. 11
INCIDENCE OF DIABETES ...................................................................................................................................... 14
OVERVIEW .................................................................................................................................................................. 14 INCIDENCE BY SEX ......................................................................................................................................................... 16 INCIDENCE BY AGE ........................................................................................................................................................ 17 INCIDENCE BY GEOGRAPHIC AREA..................................................................................................................................... 18
DURATION OF DIABETES ...................................................................................................................................... 19
DISCUSSION AND CONCLUSION ........................................................................................................................... 20
REFERENCES ......................................................................................................................................................... 22

INDEX OF TABLES TABLE SUMMARY-1: NUMBER OF EEYOUCH WITH DIABETES, BY COMMUNITY AND SEX,
ADULTS AGE 20 AND OVER, DECEMBER 31ST, 2009 ................................................................................... ii TABLE 1: PREVALENCE OF DIABETES IN ADULTS 20 AND OVER: CREE POPULATION COMPARED TO QUEBEC
EEYOU ISTCHEE (DECEMBER 31ST
, 2009) AND QUEBEC (2006-2007) ........................................................................ 7 TABLE 2: CRUDE DIABETES PREVALENCE (%), CREE POPULATION 20 YEARS AND OVER, BY SEX, AGE GROUP AND TERRITORY,
EEYOU ISTCHEE, DECEMBER 31, 2009 .................................................................................................................. 9 TABLE 3: NUMBER OF PEOPLE WITH DIAGNOSED DIABETES BY REGION, SEX AND AGE GROUP,
CREE POPULATION OF EEYOU ISTCHEE, DECEMBER 31ST
, 2009 ................................................................................. 10 TABLE 4: NUMBER OF PEOPLE WITH DIABETES AND CRUDE PREVALENCE BY COMMUNITY AND SEX,
CREE POPULATION AGE 20 AND OVER, EEYOU ISTCHEE, DECEMBER 31ST
, 2009 ........................................................... 12 TABLE 5: CUMULATIVE INCIDENCE OF DIABETES, CREE POPULATION AGE 20 AND OVER,
EEYOU ISTCHEE, FROM 1998-2000 TO 2007-2009 ............................................................................................. 14 TABLE 6: TOTAL NUMBER OF NEW CASES OF DIABETES PER THREE-YEAR PERIOD, BY SEX, AGE GROUP AND REGION,
CREE POPULATION AGE 20 AND OVER, EEYOU ISTCHEE 1998-2000 TO 2007-2009 ................................................... 15 TABLE 7: CUMULATIVE DIABETES INCIDENCE RATE (PER 1,000) OVER TIME, BY SEX,
CREE POPULATION AGE 20 AND OVER, EEYOU ISTCHEE, 1998-2000 TO 2007-2009 .................................................. 16 TABLE 8: CUMULATIVE DIABETES INCIDENCE RATES (PER 1,000 POPULATION) OVER TIME, BY SEX AND AGE GROUP,
CREE POPULATION AGE 20 AND OVER, EEYOU ISTCHEE, 1998-2000 TO 2007-2009 .................................................. 17 TABLE 9: CUMULATIVE DIABETES INCIDENCE RATES (PER 1,000 POPULATION) OVER TIME, BY REGION AND SEX,
CREE POPULATION AGE 20 AND OVER, EEYOU ISTCHEE, 1998-2000 TO 2007-2009 .................................................. 18 TABLE 10: AGE AT DIAGNOSIS OF DIABETES, CREE POPULATION, EEYOU ISTCHEE, DECEMBER 31
ST, 2009 ..................................... 19
TABLE 11: DURATION OF DIABETES, CREE POPULATION, EEYOU ISTCHEE, DECEMBER 31ST
, 2009 .................................................. 19
INDEX OF FIGURES FIGURE SUMMARY-1: DIABETES PREVALENCE (%) BY REGION AND COMMUNITY, CREE POPULATION AGE 20 AND OVER,
EEYOU ISTCHEE, DECEMBER 31ST
, 2009 .................................................................................................. ii FIGURE SUMMARY-2: DIABETES RATES 1983 TO 2009 CRUDE PREVALENCE IN EEYOUCH AGE 20 AND OVER (%) ................................. iii FIGURE 1: CRUDE DIABETES PREVALENCE RATE (%), CREE POPULATION AGE 20 AND OVER, EEYOU ISTCHEE, 1983 TO 2009 ................ 8 FIGURE 2: CRUDE PREVALENCE RATES OF DIABETES, BY SEX, CREE POPULATION AGE 20 AND OVER,
EEYOU ISTCHEE, DECEMBER 31ST
, 2009 FIGURE 3: AGE- AND SEX-SPECIFIC DIABETES PREVALENCE RATES, CREE POPULATION AGE 20 AND OVER,
EEYOU ISTCHEE, DECEMBER 31ST, 2009 ............................................................................................................. 10 FIGURE 4: AGE DISTRIBUTION OF CREE ADULTS WITH DIAGNOSED DIABETES, BY REGION, DECEMBER 31, 2009 ................................ 11 FIGURE 5: DIABETES PREVALENCE (%) BY REGION AND COMMUNITY, CREE POPULATION AGE 20 AND OVER,
EEYOU ISTCHEE, DECEMBER 31ST
, 2009 .............................................................................................................. 12 FIGURE 6: DIABETES PREVALENCE BY COMMUNITY AND LATITUDE, CREE POPULATION AGE 20 AND OVER,
EEYOU ISTCHEE, DECEMBER 31ST
, 2009 .............................................................................................................. 13 FIGURE 7: CUMULATIVE INCIDENCE RATE OF DIABETES OVER TIME, CREE POPULATION AGE 20 AND OVER,
EEYOU ISTCHEE (PER 1,000) .............................................................................................................................. 14 FIGURE 8: SEX DISTRIBUTION (%) OF NEW CASES OF DIABETES, CREE POPULATION AGE 20 AND OVER,
EEYOU ISTCHEE, 1998-2000 TO 2007-2009 ...................................................................................................... 16
i
More than one Cree adult in five now has diabetes.
The high diabetes rates in women are alarming.
EXECUTIVE SUMMARY: CDIS 2009 ANNUAL UPDATE
The 2010 Maamuu Nakaahehtaau (“Together, let’s prevent it”) campaign in Eeyou Istchee seeks to bring
everyone together to prevent diabetes and obesity, and to make our communities safer and healthier.
It emphasizes that all groups—political leaders, teachers, restaurant owners, religious leaders, parents,
healers, health care workers and individual community members—should work towards these goals.
This update shows the numbers that inspired the campaign.
High diabetes rates, especially in women
As of the end of 2009, a total of 1,910 Cree, 1,898 of them adults (age 20 and
over) had been diagnosed with diabetes in Eeyou Istchee. More than one Cree
adult in five now has diabetes (21.4%). This is almost four times the diabetes rate
in the general population of Québec.
Diabetes continues to affect more Cree women than men (25.2% vs 17.5%). The higher rates in women
may be due to one or a combination of several factors. As a group, Cree women are more likely than
men to: be obese; become overweight at a younger age; and be less physically
active. Cree women tend to gain excessive weight during pregnancy and have
high rates of gestational diabetes which puts them at risk of developing Type 2
diabetes in later years. The high rate of diabetes in Cree women—especially
those who are still in their childbearing years—is alarming. Babies born to women who have diabetes
during pregnancy (either gestational diabetes or Type 2 diabetes) are at much higher risk of becoming
obese during childhood and developing diabetes at a young age.
Variations in diabetes rates across Eeyou Istchee
Diabetes rates vary between the communities (Figure 1 and Table 1). As in previous years, the figures for
2009 generally show higher rates for the inland communities than for the coastal ones: 25.4% vs. 18.5%.

ii
Figure Summary-1: Diabetes prevalence (%) by region and community, Cree population age 20 and over, Eeyou Istchee, December 31st, 2009
Sources: - CDIS, September 28, 2010 extraction. - MHSS, James Bay and Northern Quebec Agreement Cree beneficiary list, December 31
st, 2009.
Table Summary-1: Number of Eeyouch with diabetes, by community and sex
Adults age 20 and over, December 31st, 2009
Community Females Males Total
Chisasibi 246 159 405
Eastmain 62 44 106
Mistissini 287 211 498
Nemaska 45 36 81
Oujé-Bougoumou 60 40 100
Waskaganish 142 81 223
Waswanipi 143 110 253
Wemindji 108 71 179
Whapmagoostui 34 19 53
Eeyou Istchee 1,127 771 1,898
Sources: CDIS, September 28, 2010 extraction; population data from MHSS, James Bay and Northern Quebec Agreement Cree beneficiary list, December 31
st, 2009.
11.4
17.2
18.5
18.9
19.6
21.4
21.6
25.0
25.4
25.8
27.1
27.4
0.0 5.0 10.0 15.0 20.0 25.0 30.0
Whapmagoostui
Chisasibi
Coastal
Waskaganish
Nemaska
Eeyou Istchee
Wemindji
Oujé-Bougoumou
Inland
Mistissini
Eastmain
Waswanipi
Crude prevalence rate (%)

iii
Diabetes rates continue to rise.
A younger age of onset, and lots of new cases, mean that many more people could develop diabetic complications in the coming years.
Rising diabetes rates over time
The number of people with diabetes in Eeyou Istchee continues to rise. In
1983, 2.4% of Eeyouch had diabetes. This has increased to 21.4% in 2009
(Figure 2). In the past 3 years (2007-2009), 339 Cree adults were newly
diagnosed with diabetes.
Figure Summary-2: Diabetes rates 1983 to 2009 Crude prevalence in Eeyouch age 20 and over (%)
Younger ages at diagnosis
Cree people are being diagnosed with diabetes at a younger age. In
1989, the average age at diagnosis was 48 years; in 2009, it was 41
years. This is approximately 20 years younger than the age people get
diagnosed with diabetes in the rest of Quebec. Almost half the Eeyouch
who are now living with diabetes (46.8%) were diagnosed before they
reached age 40. In the rest of Quebec it is very rare for people to be diagnosed with diabetes before the
age of 40. Since diabetes is a lifelong condition, those who have it need to take care of their health to
prevent complications and live a long, healthy life. If young people do not control their diabetes, they
are likely to develop complications at an early age. This poses a serious threat to health in Eeyou Istchee.
2.4
5.0
7.3
10.711.6
12.513.3
14.415.1
16.0
17.7
18.719.5
20.421.021.4
0.0
5.0
10.0
15.0
20.0
25.0
1983
1989
1993
1997
1998
1999
2000
2001
2002
2003
2004
2005
2006
2007
2008
2009
Cru
de p
revale
nce (
%)
iv
It is urgent to focus on obesity and lack of physical activity.
Health summits will kick-start development of healthy public policies.
Lastly, diabetes is a relatively new disease in the region. More than half the Eeyouch with diabetes
(61.0%) have been diagnosed in the past 10 years and many of them are relatively young. Since the risk
of complications increases the longer someone has diabetes, many of these people will become at
higher risk as they continue living with their diabetes. This has important implications for health services
in the region.
A call to action
Taken together, these statistics show the importance of mobilizing the
communities to halt or slow down the diabetes epidemic. It is urgent to focus on
the things that can be changed, including obesity and lack of physical activity. It is
especially important to reach children, teenagers, and women of childbearing age.
Mobilizing the region through the Maamuu Nakaahehtaau campaign
On August 11, 2010 the General Assembly of the Grand Council/CRA passed Resolution 13, endorsing
the Maamuu Nakaahehtaau* approach. When communities are ready and request support, the Public
Health Department of the Cree Health Board will help to organize
summits in every community to kick-start the implementation of
healthy public policies. These will be positive, action-oriented meetings
that will identify things that are working well and build on them. With the leadership of Chief and
Council, this campaign began in Eastmain in November, 2010. It will continue in other communities.
* Updates on the Maamuu Nakaahehtaau campaign will be posted at www.creehealth.org

1
FOREWORD TO THE PUBLIC HEALTH REPORT SERIES The Public Health Report Series includes reports prepared by the Department of Public Health of the
Cree Territory of James Bay on major activities of the Department. At the present time, the series
includes the following:
• Series 1: annual reports of the Public Health Department (from 2002)
• Series 2: reports on immunizations and/or notifiable diseases (periodic)
• Series 3: annual diabetes updates (from 1996) and annual diabetes reports (from 2004 most years)
• Series 4: reports on the health status of the population (periodic)
The Series 3: Annual Diabetes Reports are dedicated to the memory of all of our late friends and
colleagues who tried through their work and example to make a difference in the lives of Eeyouch living
with diabetes, and especially the late Mavis Véronneau , the late Sam Awashish, the late Alan Neacappo
and the late René Coon.

2
FOREWORD TO THE ANNUAL DIABETES REPORT As Director of Public Health (interim) for Eeyou Istchee, I am pleased to be presenting the 2009 report on diabetes in the territory. Monitoring and reporting on the health status of the population is a primary mandate of Public Health and, since 1997, the Public Health Department has been documenting the rise of diabetes. This information becomes important to the extent that it feeds into other actions with the potential to improve the health status of the population. Reporting on diabetes supports the reorganization happening within health and social services in Cree Istchee. Introducing a ‘primary care’ model for services puts the ‘patient’ – who may be an individual, a family, and a community – at the centre of the services. Health care workers will work in teams organized according to the needs of the ‘patient’. Specific services will integrate their work with others in order to follow the patient until the problem is resolved or the risk that justified follow-up has disappeared. In a primary care model, services are developed and organized according to the needs of the population. The Cree Board of Health and Social Services is responsible for providing services to the population in each community according to the age profile and health status of the population. This report on the state of diabetes – which is the primary health problem in the region – provides essential information underlying that planning for local services. According to the World Health Organization Report (2008), a dynamic primary care organization of services “forces the team to take targeted initiatives, in collaboration with other sectors, to reach the excluded and the unreached and tackle broader determinants of ill-health”. While this emphasizes preventive practices in clinical services, it also puts a focus on prevention in the community, setting the stage for a community investment in diabetes prevention and health promotion activities, and for venturing into areas that are often overlooked, such as healthy public policies, health in schools and in the workplace. The Maamuu Nakaahehtaau campaign aims at combining the efforts of all the entities in the region to prevent diabetes in children, in youth and in adults, to better support diabetic patients in the management of their disease and to prevent serious consequences or complications. Our public health mandate from the Public Health Act of Québec gives us the responsibility to promote health, prevent disease, protect from illness and report on the state of health of the population. This 2009 Annual Diabetes Report underlines the importance of the Maamuu Nakaahehtaau (“Together, let’s prevent it”) diabetes campaign to promote health-related public policies and actions throughout the region. Richard Lessard Director of Public Health (interim) Public Health Department of the Cree Territory of James Bay
3
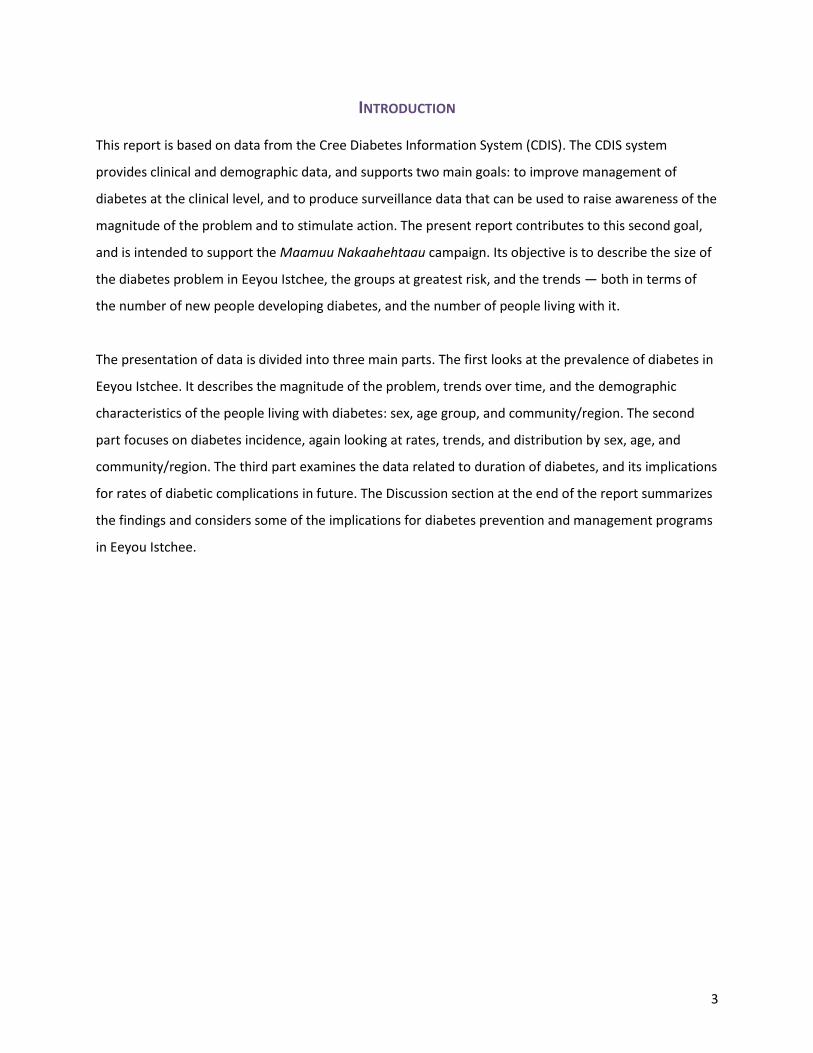
INTRODUCTION This report is based on data from the Cree Diabetes Information System (CDIS). The CDIS system
provides clinical and demographic data, and supports two main goals: to improve management of
diabetes at the clinical level, and to produce surveillance data that can be used to raise awareness of the
magnitude of the problem and to stimulate action. The present report contributes to this second goal,
and is intended to support the Maamuu Nakaahehtaau campaign. Its objective is to describe the size of
the diabetes problem in Eeyou Istchee, the groups at greatest risk, and the trends — both in terms of
the number of new people developing diabetes, and the number of people living with it.
The presentation of data is divided into three main parts. The first looks at the prevalence of diabetes in
Eeyou Istchee. It describes the magnitude of the problem, trends over time, and the demographic
characteristics of the people living with diabetes: sex, age group, and community/region. The second
part focuses on diabetes incidence, again looking at rates, trends, and distribution by sex, age, and
community/region. The third part examines the data related to duration of diabetes, and its implications
for rates of diabetic complications in future. The Discussion section at the end of the report summarizes
the findings and considers some of the implications for diabetes prevention and management programs
in Eeyou Istchee.

4
THE CREE DIABETES INFORMATION SYSTEM
Goals of the CDIS
The Cree Diabetes Information System (CDIS) was created in 1996, at the request of the Cree
authorities, to respond to the growing problem of diabetes in Eeyou Istchee. Over the past 14 years, the
system has continually evolved to address the changing needs of the communities and of health care
workers.
The primary goal of the CDIS is to improve the clinical management of diabetes. It does this in part by
promoting the use of standardized Diabetes Flow Sheets in medical charts. These Flow Sheets are a
clinical, educational and quality assurance tool. They are particularly helpful in assisting staff to identify
and manage patients at high risk of diabetes-related complications. In addition, the CDIS functions as a
management tool, allowing clinic managers to obtain statistics for their particular clientele.
The secondary goal of the CDIS is to provide surveillance data to the communities and regional
authorities, in order to increase awareness of the magnitude of this health problem and to stimulate
action. This is part of the Public Health Department’s broader mandate to monitor and report on the
health of the population.
Data collection and quality assurance
The CDIS identifies clients through their unique RAMQ healthcare number, and provides both clinical
and demographic data.
Diabetes Registration Forms are the key first step in the CDIS data collection. These registration forms
contain information about new cases of diabetes, changes in diagnosis or deaths. They are filled out in
the local clinics and faxed to the Public Health Department office in Montreal. In Montreal, the
information is entered into the system on a regular basis by a data-entry person. To ensure data quality,
a validation process is in place: CDIS coordinators ensure ongoing training and supervision of the data-
entry person, conduct regular data-quality audits, and maintain ongoing contact with the clinics in order
to complete or clarify the original information where necessary.

5
Laboratory data are also added to the system. Beginning in 2007, an automated data-merge system
has allowed lab data for the coastal communities to be updated on a regular basis. For the inland
communities, periodic data merges have been carried out, most recently in December 2009.
Since the validity of the CDIS data (other than lab information) depends mainly on how well the clinics
record this information on the Diabetes Registration Forms and Diabetes Flow Sheets, a regular data
validation is necessary. Thus, in 2009, the CDIS Data Validation Project was conducted to validate RAMQ
numbers; identify all patients with diabetes who were not registered on the CDIS (missing cases); update
the list of deceased patients; and fill in missing or incomplete information on James Bay Cree band
numbers and clinical measures of height, weight, and blood pressure.1
6
METHODS
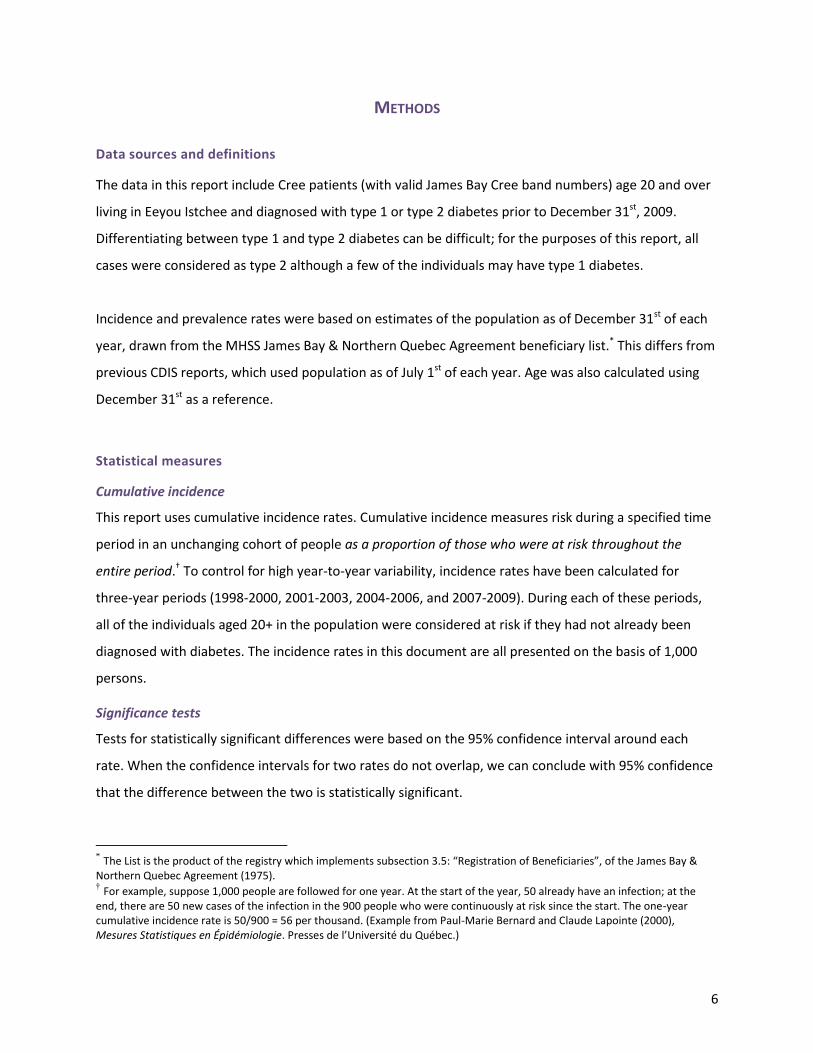
Data sources and definitions
The data in this report include Cree patients (with valid James Bay Cree band numbers) age 20 and over
living in Eeyou Istchee and diagnosed with type 1 or type 2 diabetes prior to December 31st, 2009.
Differentiating between type 1 and type 2 diabetes can be difficult; for the purposes of this report, all
cases were considered as type 2 although a few of the individuals may have type 1 diabetes.
Incidence and prevalence rates were based on estimates of the population as of December 31st of each
year, drawn from the MHSS James Bay & Northern Quebec Agreement beneficiary list.* This differs from
previous CDIS reports, which used population as of July 1st of each year. Age was also calculated using
December 31st as a reference.
Statistical measures
Cumulative incidence
This report uses cumulative incidence rates. Cumulative incidence measures risk during a specified time
period in an unchanging cohort of people as a proportion of those who were at risk throughout the
entire period.† To control for high year-to-year variability, incidence rates have been calculated for
three-year periods (1998-2000, 2001-2003, 2004-2006, and 2007-2009). During each of these periods,
all of the individuals aged 20+ in the population were considered at risk if they had not already been
diagnosed with diabetes. The incidence rates in this document are all presented on the basis of 1,000
persons.
Significance tests
Tests for statistically significant differences were based on the 95% confidence interval around each
rate. When the confidence intervals for two rates do not overlap, we can conclude with 95% confidence
that the difference between the two is statistically significant.
* The List is the product of the registry which implements subsection 3.5: “Registration of Beneficiaries”, of the James Bay &
Northern Quebec Agreement (1975). † For example, suppose 1,000 people are followed for one year. At the start of the year, 50 already have an infection; at the
end, there are 50 new cases of the infection in the 900 people who were continuously at risk since the start. The one-year cumulative incidence rate is 50/900 = 56 per thousand. (Example from Paul-Marie Bernard and Claude Lapointe (2000), Mesures Statistiques en Épidémiologie. Presses de l’Université du Québec.)
7
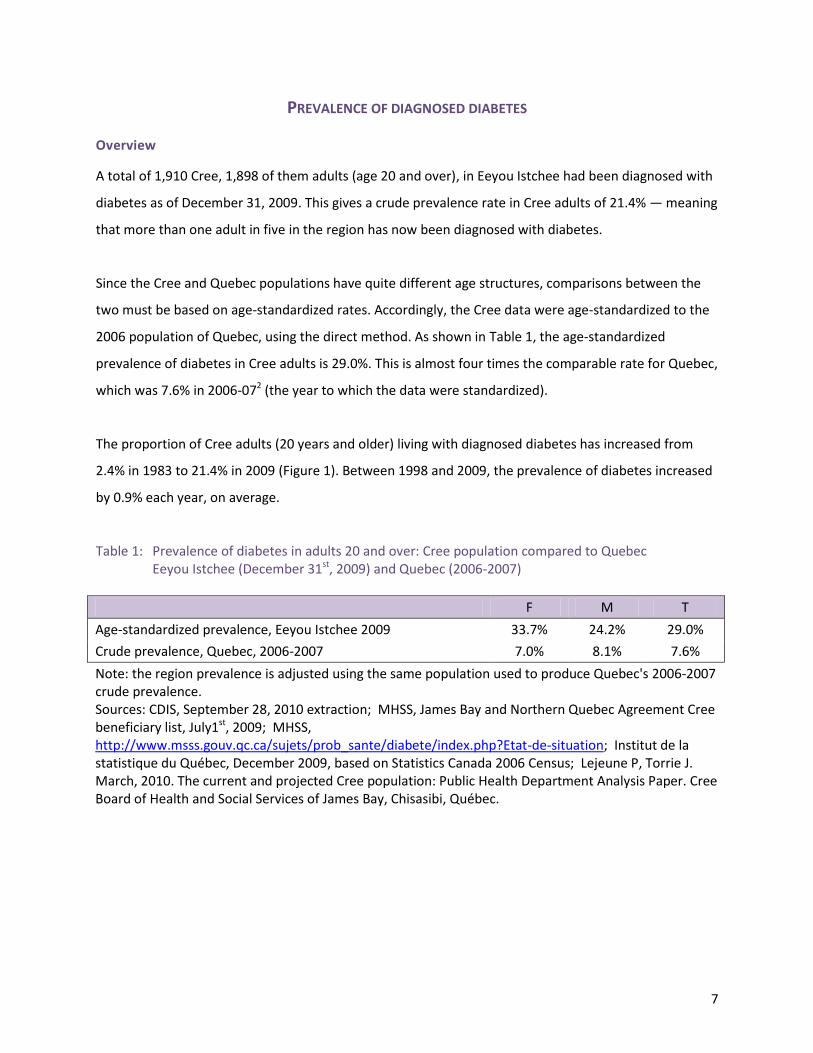
PREVALENCE OF DIAGNOSED DIABETES Overview
A total of 1,910 Cree, 1,898 of them adults (age 20 and over), in Eeyou Istchee had been diagnosed with
diabetes as of December 31, 2009. This gives a crude prevalence rate in Cree adults of 21.4% — meaning
that more than one adult in five in the region has now been diagnosed with diabetes.
Since the Cree and Quebec populations have quite different age structures, comparisons between the
two must be based on age-standardized rates. Accordingly, the Cree data were age-standardized to the
2006 population of Quebec, using the direct method. As shown in Table 1, the age-standardized
prevalence of diabetes in Cree adults is 29.0%. This is almost four times the comparable rate for Quebec,
which was 7.6% in 2006-072 (the year to which the data were standardized).
The proportion of Cree adults (20 years and older) living with diagnosed diabetes has increased from
2.4% in 1983 to 21.4% in 2009 (Figure 1). Between 1998 and 2009, the prevalence of diabetes increased
by 0.9% each year, on average.
Table 1: Prevalence of diabetes in adults 20 and over: Cree population compared to Quebec Eeyou Istchee (December 31st, 2009) and Quebec (2006-2007)
F M T
Age-standardized prevalence, Eeyou Istchee 2009 33.7% 24.2% 29.0%
Crude prevalence, Quebec, 2006-2007 7.0% 8.1% 7.6%
Note: the region prevalence is adjusted using the same population used to produce Quebec's 2006-2007 crude prevalence. Sources: CDIS, September 28, 2010 extraction; MHSS, James Bay and Northern Quebec Agreement Cree beneficiary list, July1st, 2009; MHSS, http://www.msss.gouv.qc.ca/sujets/prob_sante/diabete/index.php?Etat-de-situation; Institut de la statistique du Québec, December 2009, based on Statistics Canada 2006 Census; Lejeune P, Torrie J. March, 2010. The current and projected Cree population: Public Health Department Analysis Paper. Cree Board of Health and Social Services of James Bay, Chisasibi, Québec.

8
Figure 1: Crude diabetes prevalence rate (%), Cree population age 20 and over, Eeyou Istchee, 1983 to 2009
Note: The prevalence rates for the years 1983, 1989 and 1993 have been adjusted to include only those aged 20 or more. The rates for the years 1997 to 2009 are based on the data available in the CDIS database as of September 28, 2010. The rates for the years 1997-2007 were recalculated using calendar years as a reference year and 2009 CDIS validated data. Thus, the presented rates may differ from the rates reported in the previous reports. Sources: - 1983 data from Thouez et al. (1990); 1989 data from Brassard et al. (1993); 1993 data from Véronneau and Robinson (1993); 1997 to 2009 data from the CDIS, September 28, 2010 extraction; MHSS, James Bay and Northern Quebec Agreement Cree beneficiary list, December 31
st population estimates; Lejeune P, Torrie J.
March, 2010. The current and projected Cree population: Public Health Department Analysis Paper. Cree Board of Health and Social Services of James Bay, Chisasibi, Québec.
Prevalence by sex
As shown in Figure 2, diabetes continues to affect more women than men in the Cree population
(25.2% vs. 17.5%, respectively, among adults 20 and over). The difference is statistically significant and
corresponds to a rate ratio of 1.4, indicating that Cree women have a diabetes prevalence rate 40%
higher than that of men. This sex pattern is seen in many other Aboriginal populations, but not in the
general Canadian population where diabetes is more prevalent among men.3, 4 In Québec, the female-
to-male diabetes ratio in 2006-07 was 0.9, reflecting a prevalence rate of 7.0% among adult women and
8.1% among men.2
2.4
5.0
7.3
10
.7 11
.6 12
.5 13
.3 14
.4 15
.1 16
.0
17
.7 18
.7 19
.5 20
.4 21
.0
21
.4
0
5
10
15
20
25
19
83
19
89
19
93
19
97
19
98
19
99
20
00
20
01
20
02
20
03
20
04
20
05
20
06
20
07
20
08
20
09
Pre
val
ence
(%
)
9
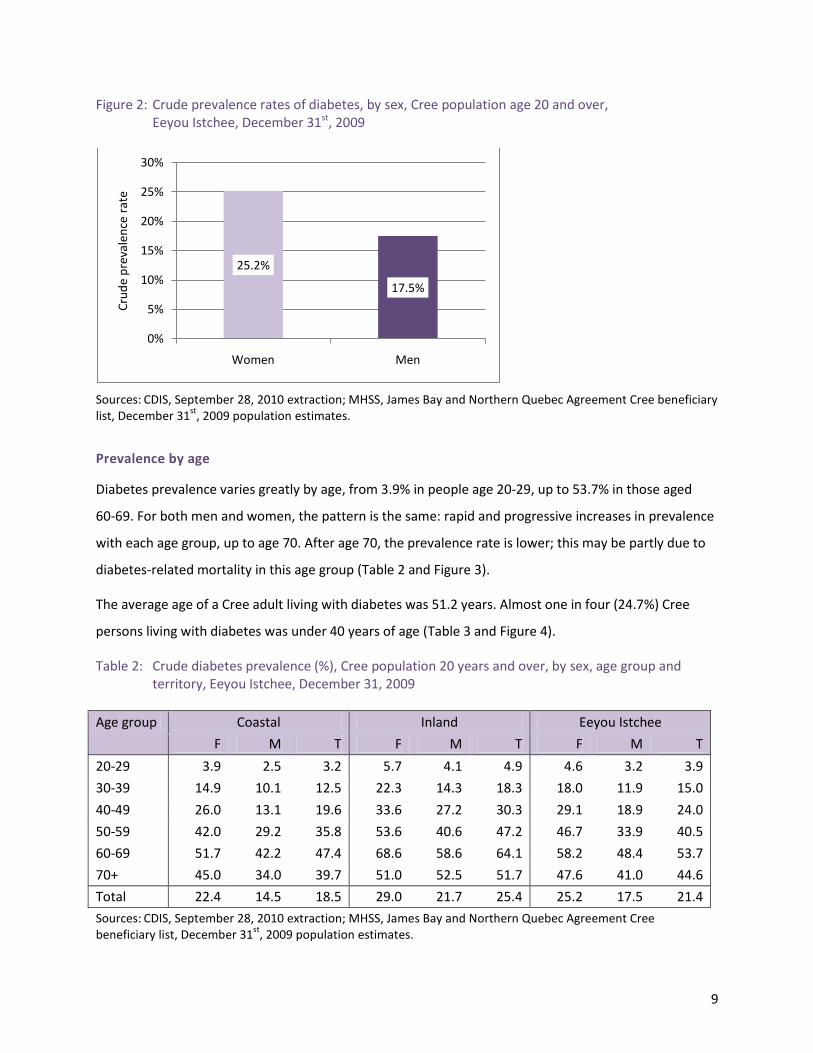
Figure 2: Crude prevalence rates of diabetes, by sex, Cree population age 20 and over, Eeyou Istchee, December 31st, 2009
Sources: CDIS, September 28, 2010 extraction; MHSS, James Bay and Northern Quebec Agreement Cree beneficiary list, December 31
st, 2009 population estimates.
Prevalence by age
Diabetes prevalence varies greatly by age, from 3.9% in people age 20-29, up to 53.7% in those aged
60-69. For both men and women, the pattern is the same: rapid and progressive increases in prevalence
with each age group, up to age 70. After age 70, the prevalence rate is lower; this may be partly due to
diabetes-related mortality in this age group (Table 2 and Figure 3).
The average age of a Cree adult living with diabetes was 51.2 years. Almost one in four (24.7%) Cree
persons living with diabetes was under 40 years of age (Table 3 and Figure 4).
Table 2: Crude diabetes prevalence (%), Cree population 20 years and over, by sex, age group and territory, Eeyou Istchee, December 31, 2009
Age group Coastal Inland Eeyou Istchee
F M T F M T F M T
20-29 3.9 2.5 3.2 5.7 4.1 4.9 4.6 3.2 3.9
30-39 14.9 10.1 12.5 22.3 14.3 18.3 18.0 11.9 15.0
40-49 26.0 13.1 19.6 33.6 27.2 30.3 29.1 18.9 24.0
50-59 42.0 29.2 35.8 53.6 40.6 47.2 46.7 33.9 40.5
60-69 51.7 42.2 47.4 68.6 58.6 64.1 58.2 48.4 53.7
70+ 45.0 34.0 39.7 51.0 52.5 51.7 47.6 41.0 44.6
Total 22.4 14.5 18.5 29.0 21.7 25.4 25.2 17.5 21.4
Sources: CDIS, September 28, 2010 extraction; MHSS, James Bay and Northern Quebec Agreement Cree beneficiary list, December 31
st, 2009 population estimates.
25.2%
17.5%
0%
5%
10%
15%
20%
25%
30%
Women Men
Cru
de
pre
vale
nce
rat
e

10
Figure 3: Age- and sex-specific diabetes prevalence rates, Cree population age 20 and over, Eeyou Istchee, December 31st, 2009
Sources: CDIS, September 28, 2010 extraction; MHSS, James Bay and Northern Quebec Agreement Cree beneficiary list, December 31
st, 2009 population estimates.
Table 3: Number of people with diagnosed diabetes by region, sex and age group, Cree population of Eeyou Istchee, December 31st, 2009
Age group
Coastal Inland Eeyou Istchee
F M T F M T F M T
20 to 29 27 18 45 28 21 49 55 39 94
30 to 39 105 71 176 114 76 190 219 147 366
40 to 49 138 69 207 121 102 223 259 171 430
50 to 59 137 89 226 118 86 204 255 175 430
60 to 69 113 77 190 93 65 158 206 142 348
70+ 72 50 122 61 47 108 133 97 230
Total 592 374 966 535 397 932 1,127 771 1,898*
* Note: There were also 12 cases of diabetes in people age 10-19; to protect confidentiality, the details for these people are not shown in the table, nor are they included in the totals. Source: CDIS, September 28, 2010 extraction.
0
10
20
30
40
50
60
70
20 to 29 30 to 39 40 to 49 50 to 59 60 to 69 70 or more
Cru
de
pre
val
ence
(%
)
Age groups
Female
Male
Total

11
Figure 4: Age distribution of Cree adults with diagnosed diabetes, by region, December 31, 2009
* To protect confidentiality, people age 10-19 have been excluded from the total, and the percentages are based only on cases age 20 and over. Source: CDIS, September 28, 2010 extraction.
Prevalence by geographic area
Four of Eeyou Istchee’s nine communities (Nemaska, Mistissini, Oujé-Bougoumou and Waswanipi)
are located inland, while the remaining five (Whapmagoostui, Chisasibi, Wemindji, Eastmain and
Waskaganish) are on the coast. As shown in Figure 5 and Table 4, the prevalence of diabetes varies
between the communities. The highest prevalence rates are in Waswanipi (27.4%) and Eastmain
(27.1%), and the lowest in Whapmagoostui (11.4%).
As in previous years, the coastal communities have a significantly lower diabetes prevalence overall
than the inland ones (18.5% vs. 25.4%, respectively). This is consistent with other studies of Aboriginal
populations that have reported lower diabetes prevalence in more-isolated regions than in the less-
isolated ones.5, 6 Proximity to urban areas and greater access to fast-food facilities may play a role in
these observed differences.
Among the Cree of Eeyou Istchee, a north-south gradient in diabetes prevalence was first reported by
Brassard et al. in 1993,7 and CDIS data consistently confirmed this pattern from 1998 until 2007.
However, as of 2009, the coastal communities of Eastmain and Wemindji are no longer following the
north-south gradient in diabetes prevalence (Figure 6).
5% 5% 5%
18% 20% 19%
21%24%
23%
23%22%
23%
20%17% 18%
13% 12% 12%
0%
10%
20%
30%
40%
50%
60%
70%
80%
90%
100%
Coastal Inland Eeyou Istchee
70+ yrs
60 to 69 yrs
50 to 59 yrs
40 to 49 yrs
30 to 39 yrs
20 to 29 yrs

12
Figure 5: Diabetes prevalence (%) by region and community, Cree population age 20 and over, Eeyou Istchee, December 31st, 2009
Sources: CDIS, September 28, 2010 extraction; MHSS, James Bay and Northern Quebec Agreement Cree beneficiary list, December 31
st, 2009 population estimates.
Table 4: Number of people with diabetes and crude prevalence by community and sex, Cree population age 20 and over, Eeyou Istchee, December 31st, 2009
Number of cases Crude prevalence (%)
F M T F M T
Chisasibi 246 159 405 20.7 13.6 17.2
Eastmain 62 44 106 31.1 22.9 27.1
Mistissini 287 211 498 29.1 22.3 25.8
Nemaska 45 36 81 22.3 17.0 19.6
Oujé-Bougoumou 60 40 100 29.9 20.1 25.0
Waskaganish 142 81 223 23.6 14.0 18.9
Waswanipi 143 110 253 31.5 23.4 27.4
Wemindji 108 71 179 25.8 17.3 21.6
Whapmagoostui 34 19 53 14.6 8.2 11.4
Coastal 592 374 966 22.4 14.5 18.5
Inland 535 397 932 29.0 21.7 25.4
Eeyou Istchee 1,127 771 1,898 25.2 17.5 21.4
Sources: CDIS, September 28, 2010 extraction; MHSS, James Bay and Northern Quebec Agreement Cree beneficiary list, December 31
st, 2009 population estimates.
27.4
27.1
25.8
25.4
25.0
21.6
21.4
19.6
18.9
18.5
17.2
11.4
- 5.0 10.0 15.0 20.0 25.0 30.0
Waswanipi
Eastmain
Mistissini
Inland
Ouje-…
Wemindji
Iiyiyiu Aschii
Nemaska
Waskaganish
Coastal
Chisasibi
Whapmagoostui
Crude prevalence rates (%)

13
Figure 6: Diabetes prevalence by community and latitude, Cree population age 20 and over, Eeyou Istchee, December 31st, 2009
Sources: CDIS, September 28, 2010 extraction; MHSS, James Bay and Northern Quebec Agreement Cree beneficiary list, December 31
st, 2009 population estimates.
0.0 5.0 10.0 15.0 20.0 25.0 30.0
Waswanipi - 49.65
Ouje-Bougoumou - 49.93
Mistissini - 50.25
Nemaska - 51.17
Waskaganish - 51.28
Eastmain - 52.25
Wemindji - 53.37
Chisasibi - 53.47
Whapmagoostui - 55.90
Crude prevalence rate (%)
Co
mm
un
ity
an
d L
ati
tud
e

14
INCIDENCE OF DIABETES
Overview
Over the 2007-2009 period, 339 Cree adults age 20 and over were newly diagnosed with diabetes. The
cumulative incidence rate* rose steadily for years, from 16.3 per 1,000 in 1998-2000 to 20.7 per 1,000 in
2004-2006. It apparently began to level off in 2007-2009, dropping to 16.7 per 1,000. However, none of
these variations reach statistical significance (Table 5 and Figure 7).
Table 5: Cumulative incidence of diabetes, Cree population age 20 and over,
Eeyou Istchee, from 1998-2000 to 2007-2009
Period Number of new cases
Cumulative incidence rate (per 1,000)
1998-2000 287 16.3
2001-2003 317 17.0
2004-2006 407 20.7
2007-2009 339 16.7
Sources: CDIS, September 28, 2010 extraction; population estimates from MHSS, James Bay and Northern Quebec Agreement Cree beneficiary list, population as of December 31
st.
Figure 7: Cumulative incidence rate of diabetes over time, Cree population age 20 and over,
Eeyou Istchee (per 1,000)
Sources: CDIS, September 28, 2010 extraction; population estimates from MHSS, James Bay and Northern Quebec Agreement Cree beneficiary list, population as of December 31
st.
* Please see the Methods section for an explanation of cumulative incidence.
16.3 17.0
20.7
16.7
0.0
5.0
10.0
15.0
20.0
25.0
1998-2000 2001-2003 2004-2006 2007-2009
3-y
ear
rate
per
1,0
00

15
Table 6: Total number of new cases of diabetes per three-year period, by sex, age group and region,
Cree population age 20 and over, Eeyou Istchee 1998-2000 to 2007-2009
Period Age
group
Coastal Inland Eeyou Istchee
F M T F M T F M T
1998-2000
20-29 14 5 19 22 12 34 36 17 53
30-39 27 8 35 20 14 34 47 22 69
40-49 26 15 41 19 11 30 45 26 71
50-59 16 17 33 12 6 18 28 23 51
60-69 9 4 13 3 9 12 12 13 25
70+ * * * * * * 12 6 18
Total** 92 49 141 76 52 128 180 107 287
2001-2003
20-29 17 8 25 20 9 29 37 17 54
30-39 33 23 56 23 14 37 56 37 93
40-49 20 21 41 21 9 30 41 30 71
50-59 20 19 39 8 12 20 28 31 59
60-69 6 10 16 3 10 13 9 20 29
70+ * * * * * * 5 6 11
Total** 96 81 177 75 54 129 176 141 317
2004-2006
20-29 19 10 29 21 14 35 40 24 64
30-39 31 24 55 30 32 62 61 56 117
40-49 27 19 46 28 28 56 55 47 102
50-59 23 30 53 12 10 22 35 40 75
60-69 9 11 20 8 6 14 17 17 34
70+ * * * * * * 9 6 15
Total** 109 94 203 99 90 189 217 190 407
2007-2009
20-29 11 8 19 10 12 22 21 20 41
30-39 28 27 55 26 25 51 54 52 106
40-49 30 18 48 18 18 36 48 36 84
50-59 21 14 35 17 13 30 38 27 65
60-69 7 5 12 6 8 14 13 13 26
70+ * * * * * * 10 7 17
Total** 97 72 169 77 76 153 184 155 339
Source: CDIS, September 28, 2010 extraction. * When the number of a cell is less than 5, it is not reported and related cells are also masked. ** Totals show the sum of the columns, excluding any cells that are masked.

16
Incidence by sex
Women outnumber men in the new cases of diagnosed diabetes, although the extent to which they do so
has varied over the years. Since 1998, cumulative incidence rates have been consistently higher in women
than in men, but the difference is statistically significant only for the years 1998-2000 (Table 7). The
proportion of men among the newly diagnosed cases climbed from 37% in 1998-2000 to 44% in 2001-2003
and 47% in 2003-2006; but fell slightly in the most recent period (2006-2009), to 46% (Figure 8).
Table 7: Cumulative diabetes incidence rate (per 1,000) over time, by sex, Cree population age 20 and over, Eeyou Istchee, 1998-2000 to 2007-2009
1998-2000 2001-2003 2004-2006 2007-2009
Rate 95% CI Rate 95% CI Rate 95% CI Rate 95% CI
F 21.0 16.10 25.93 19.6 15.06 24.12 22.9 18.17 27.54 18.8 14.70 22.90
M 11.8 8.09 15.51 14.6 10.65 18.56 18.7 14.41 22.97 14.7 11.06 18.41
Both 16.3 13.21 19.35 17.0 14.01 20.02 20.7 17.53 23.87 16.7 13.95 19.44
Sources: CDIS, September 28, 2010 extraction; population estimates from MHSS, James Bay and Northern Quebec Agreement Cree beneficiary list, population as of December 31
st.
Figure 8: Sex distribution (%) of new cases of diabetes, Cree population age 20 and over,
Eeyou Istchee, 1998-2000 to 2007-2009
Source: CDIS, September 28, 2010 extraction.
37.3%44.3% 46.7% 45.7%
63.7%55.7% 53.3% 54.3%
0%
10%
20%
30%
40%
50%
60%
70%
80%
90%
100%
1998-2000 2001-2003 2004-2006 2007-2009
% o
f d
iab
etes
cas
es
Females
Males
17
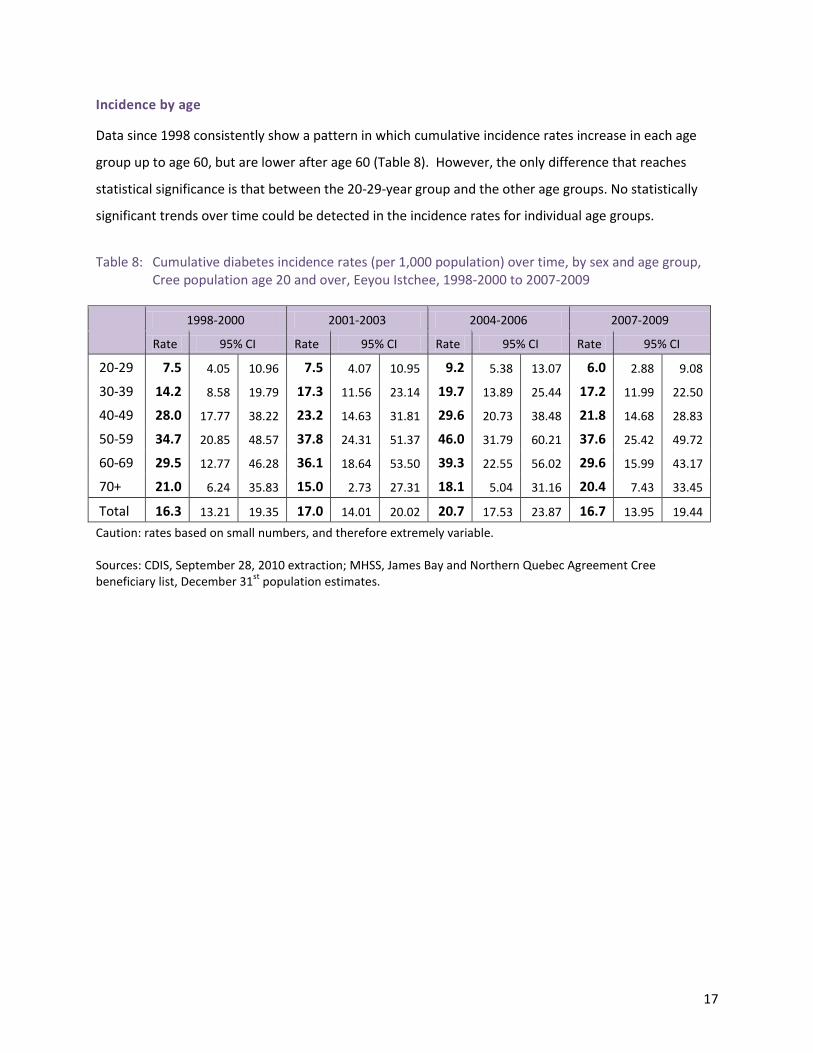
Incidence by age
Data since 1998 consistently show a pattern in which cumulative incidence rates increase in each age
group up to age 60, but are lower after age 60 (Table 8). However, the only difference that reaches
statistical significance is that between the 20-29-year group and the other age groups. No statistically
significant trends over time could be detected in the incidence rates for individual age groups.
Table 8: Cumulative diabetes incidence rates (per 1,000 population) over time, by sex and age group,
Cree population age 20 and over, Eeyou Istchee, 1998-2000 to 2007-2009
1998-2000 2001-2003 2004-2006 2007-2009
Rate 95% CI Rate 95% CI Rate 95% CI Rate 95% CI
20-29 7.5 4.05 10.96 7.5 4.07 10.95 9.2 5.38 13.07 6.0 2.88 9.08
30-39 14.2 8.58 19.79 17.3 11.56 23.14 19.7 13.89 25.44 17.2 11.99 22.50
40-49 28.0 17.77 38.22 23.2 14.63 31.81 29.6 20.73 38.48 21.8 14.68 28.83
50-59 34.7 20.85 48.57 37.8 24.31 51.37 46.0 31.79 60.21 37.6 25.42 49.72
60-69 29.5 12.77 46.28 36.1 18.64 53.50 39.3 22.55 56.02 29.6 15.99 43.17
70+ 21.0 6.24 35.83 15.0 2.73 27.31 18.1 5.04 31.16 20.4 7.43 33.45
Total 16.3 13.21 19.35 17.0 14.01 20.02 20.7 17.53 23.87 16.7 13.95 19.44
Caution: rates based on small numbers, and therefore extremely variable. Sources: CDIS, September 28, 2010 extraction; MHSS, James Bay and Northern Quebec Agreement Cree beneficiary list, December 31
st population estimates.
18
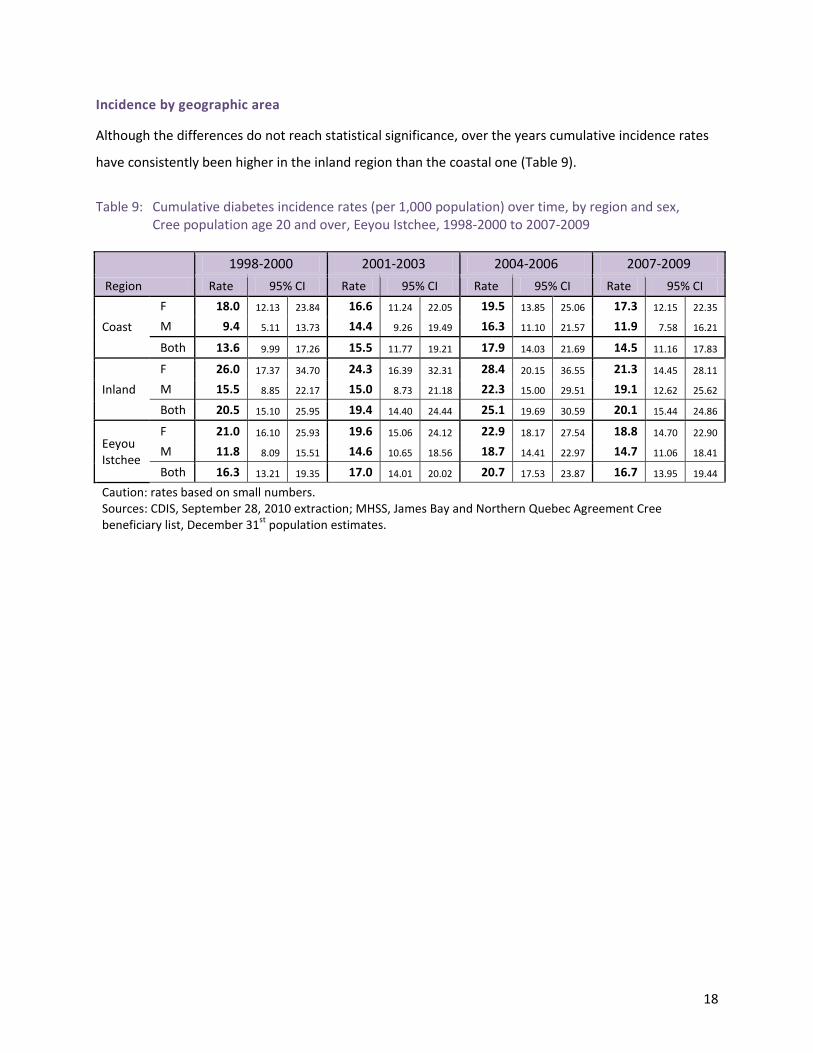
Incidence by geographic area
Although the differences do not reach statistical significance, over the years cumulative incidence rates
have consistently been higher in the inland region than the coastal one (Table 9).
Table 9: Cumulative diabetes incidence rates (per 1,000 population) over time, by region and sex,
Cree population age 20 and over, Eeyou Istchee, 1998-2000 to 2007-2009
Region
1998-2000 2001-2003 2004-2006 2007-2009
Rate 95% CI Rate 95% CI Rate 95% CI Rate 95% CI
Coast
F 18.0 12.13 23.84 16.6 11.24 22.05 19.5 13.85 25.06 17.3 12.15 22.35
M 9.4 5.11 13.73 14.4 9.26 19.49 16.3 11.10 21.57 11.9 7.58 16.21
Both 13.6 9.99 17.26 15.5 11.77 19.21 17.9 14.03 21.69 14.5 11.16 17.83
Inland
F 26.0 17.37 34.70 24.3 16.39 32.31 28.4 20.15 36.55 21.3 14.45 28.11
M 15.5 8.85 22.17 15.0 8.73 21.18 22.3 15.00 29.51 19.1 12.62 25.62
Both 20.5 15.10 25.95 19.4 14.40 24.44 25.1 19.69 30.59 20.1 15.44 24.86
Eeyou Istchee
F 21.0 16.10 25.93 19.6 15.06 24.12 22.9 18.17 27.54 18.8 14.70 22.90
M 11.8 8.09 15.51 14.6 10.65 18.56 18.7 14.41 22.97 14.7 11.06 18.41
Both 16.3 13.21 19.35 17.0 14.01 20.02 20.7 17.53 23.87 16.7 13.95 19.44
Caution: rates based on small numbers. Sources: CDIS, September 28, 2010 extraction; MHSS, James Bay and Northern Quebec Agreement Cree beneficiary list, December 31
st population estimates.

19
DURATION OF DIABETES Diabetes is a relatively recent disease in Eeyou Istchee. As of December 31, 2009, 61% of the people
living with diabetes had been diagnosed within the past ten years; 31% had been diagnosed in the
previous five years. The average duration of diabetes was 8.9 years.
Concurrently, diabetes is being diagnosed at younger and younger ages. In 1989, the average age at
diagnosis was 48 years;8 in 2009, it was 41.4 years. As of 2009, almost half of all Eeyouch living with
diabetes (46.8%) had been diagnosed before the age of 40 (Table 10).
Taken together, the large number of recent diagnoses and the younger age of onset have major
implications for health services in the region. They point to the potential for rates of diabetic
complications to increase dramatically as more and more people live with the disease for many years.
This underscores the need for a concerted effort to help people manage their diabetes well, and thereby
reduce their risk of developing complications.
Table 10: Age at diagnosis of diabetes, Cree population, Eeyou Istchee, December 31st, 2009
Age at diagnosis Number %
Under 40 years 893 46.8%
40-49 years 493 25.8%
50-59 years 333 17.4%
60-69 years 131 6.9%
70 years or more 60 3.1%
Total all ages 1,910 100%
Source: CDIS, September 28, 2010 extraction.
Table 11: Duration of diabetes, Cree population, Eeyou Istchee, December 31st, 2009
Duration (years) Number %
0 to 4 594 31.1%
5 to 9 571 29.9%
10 to 14 370 19.4%
15 to 19 195 10.2%
20 or more 180 9.4%
Total, all durations 1,910 100%
Source: CDIS, September 28, 2010 extraction.
20
DISCUSSION AND CONCLUSION Within the past twelve years, crude diabetes prevalence in Eeyouch 20 years and older has risen from
11.6% to 21.4%. Thus, as of December 31st, 2009, more than one in every five Cree adults was living with
diagnosed diabetes. Diabetes rates are substantially higher in Eeyouch than in the general population of
Quebec (age-adjusted prevalence of 29.0% vs. 7.6% in 2006-072); however, they are consistent with the
rates reported for other First Nations. The preponderance of female cases, and the young age of onset,
are also consistent with the pattern observed in other Aboriginal groups in Canada.3
The observed increase in diabetes prevalence over the years probably results from a combination of
several factors: new cases of diabetes; increased awareness and screening for diabetes, such that more
of the existing cases are being detected; and decreased mortality of patients with diabetes. The
contribution of new cases of diabetes to the total number of people suffering from this chronic disease
varies from year to year, but remains important: cumulative incidence rates rose steadily from 1998 to
2006, although there is some indication that they may now be levelling off or decreasing. Nonetheless,
in the past 3 years alone (2007-2009), 339 Cree adults were newly diagnosed with diabetes.
Although only some of the differences are statistically significant, cumulative diabetes incidence rates
among Eeyouch have been consistently higher in women than in men since at least 1998. Prevalence
rates are also higher in women than men (25.2% vs. 17.5%, respectively). The observed sex difference
could be explained by a higher obesity rates among Cree women,9 excessive weight gain by young Cree
mothers during pregnancy10, 11 and a high rate of gestational diabetes.12 It may also reflect more
aggressive screening for diabetes among women, particularly during pregnancy. Whatever the cause,
the high prevalence of diabetes among Cree women, especially of reproductive age, is alarming, since
women who have pre-existing type 2 diabetes or gestational diabetes are at much higher risk for
maternal and neonatal complications and their children are at a significantly higher risk for obesity and
diabetes at a young age.13, 14
The age at diagnosis of diabetes among Eeyouch has been dropping (41.4 years in 2009 compared to 48
years in 1989); almost half the Eeyouch currently living with diabetes (48%) were diagnosed before they
reached 40 years of age. This is in sharp contrast to the trend observed in non-Aboriginal people where
the majority of new cases occur among individuals aged 70 years old and older3, 4. Further, more than
21
half of all Cree patients with diabetes (61.0%) have been diagnosed in the past 10 years. These
observations have major implications for regional health services. The 2006 diabetes clinical
management audit clearly demonstrated that the risk of diabetes-related complications significantly
increases with the duration of diabetes.15 Therefore, a younger age at diagnosis and a longer duration of
diabetes among Cree patients highlight the urgent need to implement high-quality integrated services in
the region.
In conclusion, the data presented in this report underline the importance of developing and
implementing effective primary prevention programs for diabetes, and reinforcing existing clinical
preventive practices in the territory. In order to halt or slow the epidemic of diabetes in the Cree
population, it is urgent to target the modifiable risk factors for diabetes, such as obesity and physical
inactivity, especially among women of reproductive age. As well, in addition to the existing surveillance
system, further surveillance projects are required to assess the magnitude of gestational diabetes
among Cree women and pre-diabetic states in the general Cree population.
22
REFERENCES 1 Kuzmina E, Dannenbaum D, Torrie J. Cree Diabetes Information System (CDIS) data validation
project. Internal report, Public Health Department, Cree Board of Health and Social Services of James
Bay. Québec. May 2010. 12 pages.
2 Ministère de la santé et des services sociaux du Québec. Available on line at:
http://www.msss.gouv.qc.ca/sujets/prob_sante/diabete/index.php?Etat-de-situation &PHPSESSID
=d6a42b8beb579c69abb253f62c592e40.
3 Dyck R, Osgood N, Lin TH, Gao A, Stang MR. Epidemiology of diabetes mellitus among First
Nations and non-First Nation adults. CMAJ 2010; 182(3):249-256.
4 The National Diabetes Surveillance System: Diabetes in Canada, 2008. Available on line at: http//
www.ndss.qc.ca
5 Young TK, Emoke JES, Evers S, Wheatley B. Geographical distribution of diabetes among native
population in Canada: A national survey". Soc Sci Med 1990; 31:129-39
6 Green C, Blanchard JF, Young TK et al. The epidemiology of diabetes in the Manitoba-registered
First Nation population. Diabetes Care 2003; 26(7):1993-1998
7 Brassard P, Robinson E, Lavallée C. Prevalence of diabetes mellitus among the James Bay Cree of
northern Quebec. CMAJ 1993; 149(3):303-307
8 Brassard P, Robinson E, Dumon C. Descriptive epidemiology of non-insulin-dependant diabetes
mellitus in the James Bay Cree population of Quebec, Canada. Arct Med Res 1993; 52: 47-54
9 Nolin B, Blanchet C, Kuzmina E (2008) L’enquête de santé auprès des Cris 2003. Enquête sur la
santé dans les collectivités canadiennes (Cycle 2.1). Iiyiyiu Aschii. Habitudes alimentaires, activité
physique et poids corporel. CCSSSBJ et INSPQ. Available on line at: www.inspq.qc.ca
10 Brennand E, Dannenbaum D, Willow N. Pregnancy outcomes of first nations women in relation to
pregravid weight and pregnancy weight gain. JOGC 2005; 936-944.
11 Chu SY, Callaghan WM, Kim SY, et al. Maternal obesity and risk of gestational diabetes mellitus.
Diabetes Care 2007; 30(8):2070-2076
12 Rodrigues S, Robinson E, Gray-Donald K. Prevalence of gestational diabetes mellitus among James
Bay Cree women in northern Quebec. CMAJ 1999; 160(9):12931297.
13 Dabelea D, Hanson RL, Lindsay RS et al. Intrauterine exposure to diabetes conveys risks for type 2
diabetes and obesity: A study of discordant sibships. Diabetes 2000; 49: 2208-2211.
14 Mohamed N, Dooley J. Gestational diabetes and subsequent development of NIDDM in aboriginal
women of north-western Ontario. Int J Circumpolar 1998; 57 Suppl 1: 355-8.
15 Dannenbaum D, Kuzmina E, Gangbè M, Torrie J. Diabetes clinical management in Iiyiyiu Aschii
(2006). Cree Public Health Department .Cree Board of Health and Social Services of James Bay.
Québec. 2008, ISBN: 978-2-550-54041-0.14 pages.