crediton traffic model report of surveys - devon · crediton traffic model report of surveys july...
TRANSCRIPT

Crediton Traffic Model Report of Surveys July 2011 Ref: B2300056/ROS/01

Document control sheet BPP 04 F8
Client: Devon County Council Project: Crediton Link Road Model Job No: B2300056 Document Title: Report of Surveys Ref: B2300056/ROS/01
Originator Checked by Reviewed by Approved by NAME NAME NAME NAME ORIGINAL Dharmender Singh / Theo Genis
Chris Paine Rich Smith Theo Genis
DATE SIGNATURE SIGNATURE SIGNATURE SIGNATURE 18/11/2010
Document Status: Draft for Client Review
NAME NAME NAME NAME REVISION Theo Genis Chris Paine Theo Genis Theo Genis
DATE SIGNATURE SIGNATURE SIGNATURE SIGNATURE 10/03/2011
Document Status: Final Draft for comment
NAME NAME NAME NAME REVISION Matt Collins
(DCC) Dave Black (DCC)
DATE SIGNATURE SIGNATURE SIGNATURE SIGNATURE 07/07/2011
Document Status
Jacobs Engineering U.K. Limited This document has been prepared by a division, subsidiary or affiliate of Jacobs Engineering U.K. Limited (“Jacobs”) in its professional capacity as consultants in accordance with the terms and conditions of Jacobs’ contract with the commissioning party (the “Client”). Regard should be had to those terms and conditions when considering and/or placing any reliance on this document. No part of this document may be copied or reproduced by any means without prior written permission from Jacobs. If you have received this document in error, please destroy all copies in your possession or control and notify Jacobs. Any advice, opinions, or recommendations within this document (a) should be read and relied upon only in the context of the document as a whole; (b) do not, in any way, purport to include any manner of legal advice or opinion; (c) are based upon the information made available to Jacobs at the date of this document and on current UK standards, codes, technology and construction practices as at the date of this document. It should be noted and it is expressly stated that no independent verification of any of the documents or information supplied to Jacobs has been made. No liability is accepted by Jacobs for any use of this document, other than for the purposes for which it was originally prepared and provided. Following final delivery of this document to the Client, Jacobs will have no further obligations or duty to advise the Client on any matters, including development affecting the information or advice provided in this document. This document has been prepared for the exclusive use of the Client and unless otherwise agreed in writing by Jacobs, no other party may use, make use of or rely on the contents of this document. Should the Client wish to release this document to a third party, Jacobs may, at its discretion, agree to such release provided that (a) Jacobs’ written agreement is obtained prior to such release; and (b) by release of the document to the third party, that third party does not acquire any rights, contractual or otherwise, whatsoever against Jacobs and Jacobs, accordingly, assume no duties, liabilities or obligations to that third party; and (c) Jacobs accepts no responsibility for any loss or damage incurred by the Client or for any conflict of Jacobs’ interests arising out of the Client's release of this document to the third party.
Contents
1 Introduction 1 1.1 Background 1 1.2 Survey Programme 1 1.3 Report Purpose and Structure 1
2 Overview of Crediton Traffic Model 3 2.1 Introduction 3 2.2 Model Study Area and Zoning System 3
3 Data Sources 5 3.1 Introduction 5 3.2 Automatic Traffic Counts 5 3.3 Manual Classified Link and Turning Counts 6 3.4 Roadside Interview Surveys 6 3.5 Automatic Number Plat Recognition Surveys 7
4 Data Analysis: Traffic Counts 9 4.1 Introduction 9 4.2 ATC Flow Profiles 9 4.3 MCC Flow Profiles 11 4.4 Historical Growth in Traffic 12 4.5 Determination of Peak Hours from Junction Counts 13
5 Data Analysis: Roadside Interviews 16 5.1 Introduction 16 5.2 Acceptability of RSI Survey Dates 17 5.3 Sample Rate of RSI Surveys 17 5.4 Processing of RSI Survey Data 19 5.5 Analysis of RSI Data against Model Sectors 24 5.6 Description of Trips into Crediton 26
6 Data Analysis: ANPRs and Journey Times 28 6.1 Introduction 28 6.2 Locations of ANPR sites 28 6.3 Processing of ANPR Data 28 6.4 Validation of ANPR Records 29 6.5 Analysis of ANPR Data using MicroMatch Software 31 6.6 Extraction of Journey Time Data 31
7 Accident Data 37 7.1 Introduction 37 7.2 Accident Types and Locations 37
Appendix A Glossary of Terms A - 1

Appendix B MCC Count Turning Movement Diagrams B - 2
Appendix C Sector Trip Matrices from RSI Surveys C - 3
Appendix D Crediton ANPR Locations D - 6
Appendix E Accident and Collision Data E - 7 List of Tables
Table 3-A ATC Average Weekday Peak Hour Flow 5 Table 3-B RSI Locations 7 Table 3-C Summary of ANPR Locations 8 Table 5-A Key to RSI Survey Questions 16 Table 5-B Review of Traffic Flows on Survey Date 17 Table 5-C RSI Sample Rate against Annual Weekday Counts 17 Table 5-D Peak Hour RSI Sample Rates 18 Table 5-E RSI Sample Rates for Light and Heavy Vehicles 18 Table 5-F RSI Trip Purposes by site 19 Table 5-G Vehicle Occupancy Rates by Period 19 Table 5-H Scaling Factors - All Vehicles 20 Table 5-I Scaling Factors – Cars and LGVs 21 Table 5-J Scaling Factors – HGVs 21 Table 5-K Comparison of Peak Hour and Peak Period Journey Purpose
Split 21 Table 5-L Comparison of Peak Hour and Peak Period Vehicle Class Split 22 Table 5-M RSI Trips from all survey sites for 12 hours (scaled to counts) 25 Table 6-A Partially Captured Registration Records 28 Table 6-B Comparison of ANPR Records and Traffic Flows 29 Table 6-C ANPR Matching Matrix 31 Table 6-D Journey Time Survey Summary Table (Part1) 33 Table 6-E Journey Time Survey Summary Table (Part 2) 34 Table 6-F Journey Time Survey Summary Table (Part 3) 35 Table 7-A Accidents by Severity 37 Table 7-B Analysis of Actual vs Predicated Accidents 37 Table 7-C Accidents by Type 37
List of Figures
Figure 2-A Detailed Model Network for Crediton 3 Figure 2-B Extent of the Wider Area Model Network 4 Figure 3-A ATC Locations 5 Figure 3-B MCC Locations in Crediton 6 Figure 3-C RSI Locations around Crediton 7 Figure 3-D Location of ANPR Sites in Crediton 8 Figure 4-A Flow Profile – A377 Half Moon (towards Exeter) 9 Figure 4-B Flow Profile – A377 Knowle Cross (towards Barnstaple) 10 Figure 4-C Flow Profile – A3072 Cadbury (towards Tiverton) 10 Figure 4-D Flow Profile – Mill Street (in Crediton) 11 Figure 4-E Flow Profile – A377 Exeter Road (east of Crediton) 11 Figure 4-F Flow Profile – A377 (east of High Street) 12 Figure 4-G Flow Profile – A377 (west of High Street) 12 Figure 4-H Flow Profile of ATC Sites showing Historical Growth in Traffic 13 Figure 4-I AM Peak Hour Determination 14

Figure 4-J PM Peak Hour Determination 14 Figure 4-K Interpeak Analysis indicating a flat profile 15 Figure 5-A RSI Analysis: Towards Crediton from Tiverton along the A3072 22 Figure 5-B RSI Analysis: Towards Crediton from Tiverton along the A3072 22 Figure 5-C Comparison of AM Peak Hour and Peak Period Trip Distribution 23 Figure 5-D Comparison of IP Peak Hour and Peak Period Trip Distribution 24 Figure 5-E Comparison of PM Peak Hour and Peak Period Trip Distribution 24 Figure 5-F Sectors within Crediton 25 Figure 5-G RSI Analysis: Towards Crediton from Exeter along the A377 26 Figure 5-H Towards Crediton from Barnstaple along the A377 27 Figure 5-I RSI Analysis: Towards Crediton from Tiverton along the A3072 27 Figure 6-A Analysis of ANPR Records in the AM Peak 30 Figure 6-B Analysis of ANPR Records in the PM Peak 30 Figure 6-C Analysis of ANPR Records over 12 hours 31 Figure 6-D Journey Time Routes extracted from ANPRs (part 1) 32 Figure 6-E Journey Time Routes extracted from ANPRs (part 2) 32 Figure 6-F Journey Time Routes extracted from ANPRs (part 3) 32

Final_Report of surveys_MC.doc 1
1 Introduction
1.1 Background
1.1.1 Jacobs was commissioned by Devon County Council (DCC) in June 2010 to develop a traffic model for Crediton. The model was to be used for a broad assessment of the proposed Crediton Link Road between the A377 Exeter Road and the Lords Meadow Industrial area to the east of Crediton. In addition the model was to be used to consider alternatives to a link road, including options for a bypass.
1.1.2 The report details the surveys and data collection undertaken as part of the study. This report forms part of a series of reports describing the Crediton Traffic Model. The other reports are:
• Local Model Validation Report, March 2011 (B2300056/LMVR/01); • The Forecasting and Economics Report, March 2011
(B2300056/FER/01)
1.2 Survey Programme
1.2.1 The surveys detailed within this report and used during the study were performed during April, May and June 2010.
1.2.2 The data used in the study includes:
• Roadside Interviews (RSIs) – 12-hour surveys on a neutral day at three locations along the key arterial routes into the town to determine the purpose and origins/destinations of trips.
• Manual Classified Counts (MCCs) – 12-hour link counts were performed at the locations of the roadside interviews, and junction turning counts at 11 locations in town. In addition, historic traffic counts at various locations were incorporated.
• Automatic Traffic Counts (ATCs) – data was included from four permanent count sites in and around Crediton.
• Automatic Number Plate Recognition (ANPR) data – surveys at six locations (12 directional sites) within Crediton.
• Journey Time Surveys – were derived across twelve routes inside the town using the ANPR survey data, and a small sample of journey time data was collected using GPS units during site visits by the project team.
1.3 Report Purpose and Structure
1.3.1 The purpose of this report is to summarise the work carried out by Devon County Council and Jacobs in the collection and processing of data for the development of the Crediton Traffic Model.
1.3.2 This report is structured as follows:
• Section 2 – provides an overview of the Crediton Traffic Model; • Section 3 – provides a summary of the data sources; • Section 4 – provides detailed analysis of the traffic counts;
Final_Report of surveys_MC.doc 2
• Section 5 – provides analysis of the roadside interview surveys; • Section 6 – provides analysis of the ANPR and journey time surveys; • Section 7 – provides information on accident statistics.
Appendix A has a glossary of terms used in this report.
Final_Report of surveys_MC.doc 3
2 Overview of Crediton Traffic Model
2.1 Introduction
2.1.1 This section provides a brief overview of the Crediton Traffic Model. Further details are included in the Local Model Validation Report.
2.2 Model Study Area and Zoning System
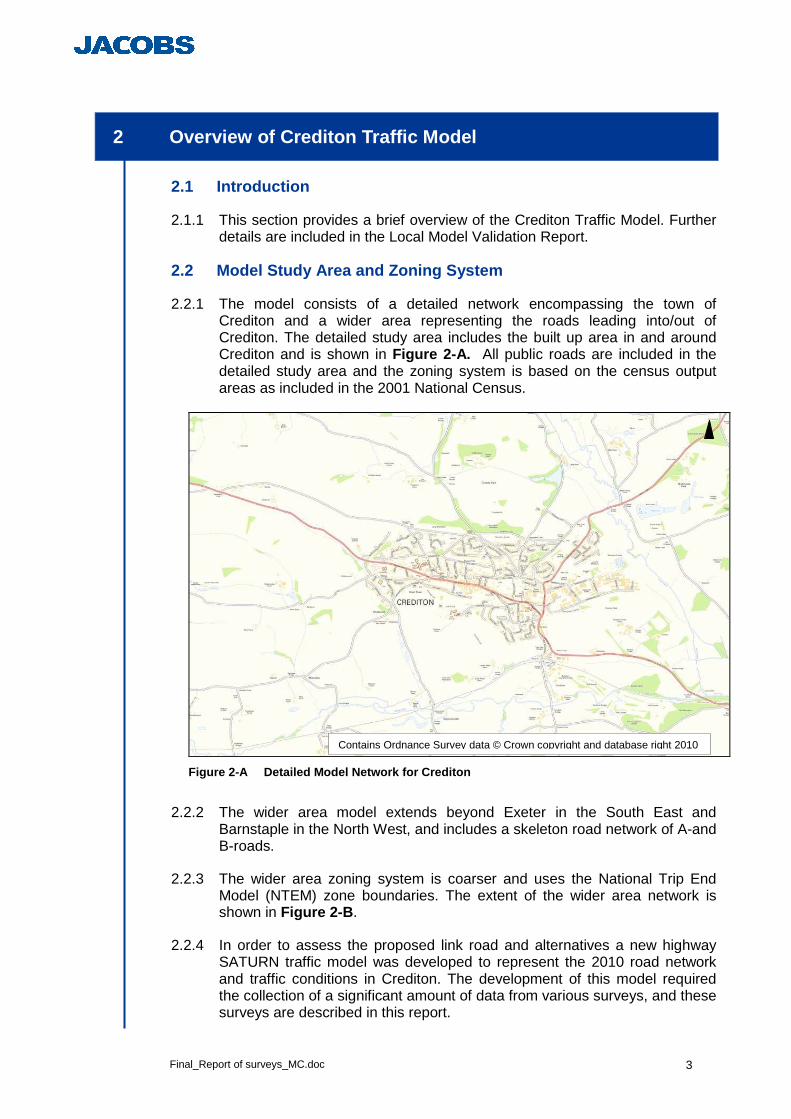
2.2.1 The model consists of a detailed network encompassing the town of Crediton and a wider area representing the roads leading into/out of Crediton. The detailed study area includes the built up area in and around Crediton and is shown in Figure 2-A. All public roads are included in the detailed study area and the zoning system is based on the census output areas as included in the 2001 National Census.
Figure 2-A Detailed Model Network for Crediton
2.2.2 The wider area model extends beyond Exeter in the South East and
Barnstaple in the North West, and includes a skeleton road network of A-and B-roads.
2.2.3 The wider area zoning system is coarser and uses the National Trip End Model (NTEM) zone boundaries. The extent of the wider area network is shown in Figure 2-B .
2.2.4 In order to assess the proposed link road and alternatives a new highway SATURN traffic model was developed to represent the 2010 road network and traffic conditions in Crediton. The development of this model required the collection of a significant amount of data from various surveys, and these surveys are described in this report.
Contains Ordnance Survey data © Crown copyright and database right 2010

Final_Report of surveys_MC.doc 4
Figure 2-B Extent of the Wider Area Model Network
Contains Ordnance Survey data © Crown copyright and database right 2010
CREDITON
Barnstaple
Tiverton
Exeter
Okehampton

Final_Report of surveys_MC.doc 5
3 Data Sources
3.1 Introduction
3.1.1 In order to inform the development of an accurate base model, several surveys were undertaken to collect data on traffic flows and movements. The majority of the data was sourced from periodic data collection done by DCC during Spring 2010. Details of how the data was used in the development of the model can be found in Local Model Validation Report for the 2010 Crediton Traffic Model.
3.2 Automatic Traffic Counts
3.2.1 Traffic counts from four Automatic Traffic Count (ATC) sites were used for the validation of the highway model and to assess the variation of traffic flows on the day of the manual surveys against the typical traffic in the town.
3.2.2 The ATC sites are described in Table 3-A with rounded average weekday flow in each of the modelled hours. The average weekday flow was determined from at least two weeks of counts on Tuesdays, Wednesdays and Thursdays over a two week period in May/June 2010 for all sites except Half Moon which was surveyed in 2009. Figure 3-A shows their locations.
Average Weekday Flow Site Location AM IP PM
1 A377 Half Moon 1240 760 1270 2 A377 Barnstaple Cross 810 580 900 3 A3072 - Cadbury 250 150 250 4 A3072 Mill Street 680 670 910
Table 3-A ATC Average Weekday Peak Hour Flow
Figure 3-A ATC Locations
Contains Ordnance Survey data © Crown copyright and database right 2010
2 – A377 Barnstaple Cross
4 – Mill Street
3 – A3072 Cadbury
1 – A377 Half Moon

Final_Report of surveys_MC.doc 6
3.3 Manual Classified Link and Turning Counts
3.3.1 Manual Classified Counts (MCCs) were performed at key junctions within the town and at the sites of the RSI surveys. Link counts at the RSI sites served the purpose of providing expansion factors to scale up the sample of RSI surveys to the full traffic flow past the survey point. The junction turning counts within the town were used as part of the calibration of the model to the observed traffic movements.
3.3.2 All the junction turning counts within the town were performed on the 25th of May 2010 from 07:00 till 19:00. The full MCC count data records are available in a separate report (Crediton Traffic Count Study 2010 by Devon County Council) and Figure 3-B shows the locations of these sites.
3.3.3 Turning movement diagrams for all of the peak hour and 12-hour counts are included in Appendix B and analysis of the counts in Section 4.
11
1. Western Road/ Landscore
2. East Street / Charlotte Street
3. Exhibition Road / Blagdon
4. Exhibition Road / Commercial Road
5. Exhibition Road / Old Tiverton Road
6. A377 Exeter Road / Tesco
7. Jockey Hill / Higher Road
8. A377 Barnstaple Cross
9. A377 / Coleford Road
10. Charlotte Street / Mill Street
11. Exeter Road / Park Road
1
2
3 4
5
6
7
89
10
Figure 3-B MCC Locations in Crediton
3.3.4 Enumerators were used to perform manual classified counts at the roadside.
The day of the count was divided into 15 minute time periods, and the flow of traffic classified by vehicle type according to DCC classifications. These classifications are: cars and light goods vehicles (combined Car/LGV); heavy goods vehicles (HGVs); other goods vehicles (OGVs); motorcycles (MCL); pedal cycles (PCL); buses and other passenger service vehicles (PSV).
3.4 Roadside Interview Surveys
3.4.1 A set of Roadside Interview Surveys (RSIs) were carried in the Crediton area at locations on the three arterial roads leading into the town. The locations of the RSI sites are given in Table 3-B and shown in Figure 3-C .
Contains Ordnance Survey data © Crown copyright and database right 2010

Final_Report of surveys_MC.doc 7
Date Taken Location
Tuesday 27th April 2010 Layby on the A377 at Half Moon near Newton St Cyres Tuesday 29th June2010 Layby on the A377 at Knowle Cross near Copplestone Tuesday 25th May 2010 Layby on the A3072 at Cadbury near Stockleigh Pomeroy
Table 3-B RSI Locations
Figure 3-C RSI Locations around Crediton
3.5 Automatic Number Plat Recognition Surveys
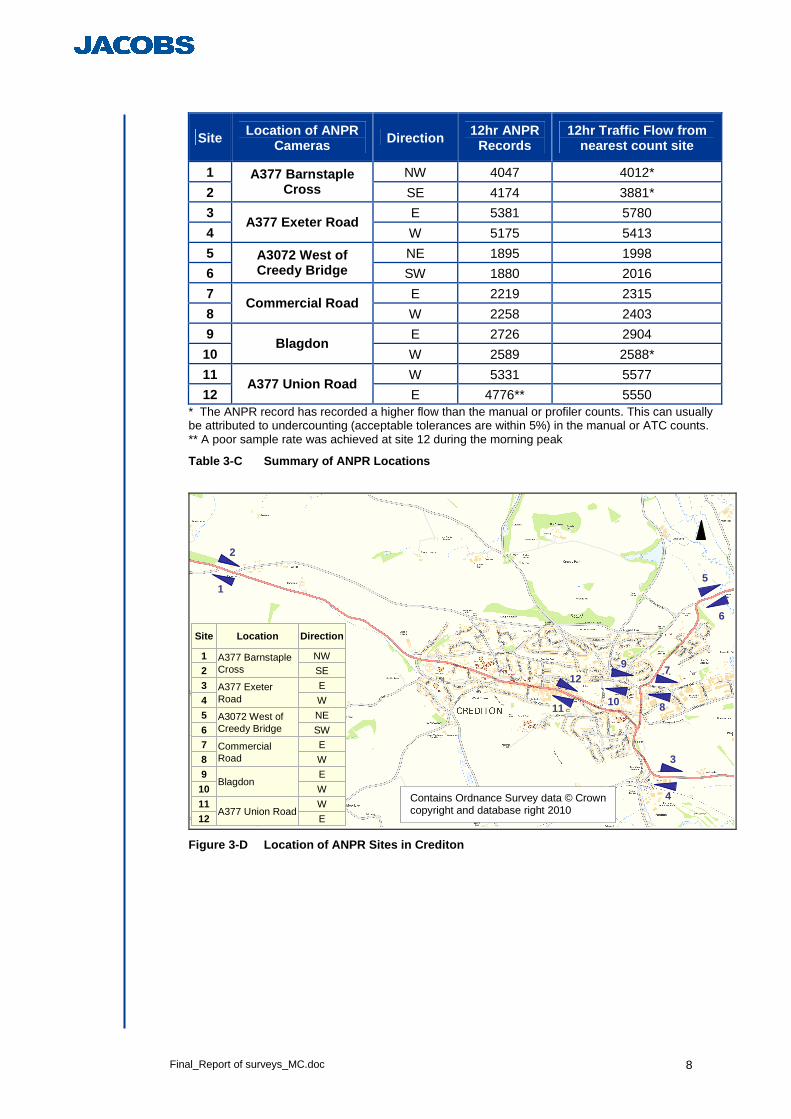
3.5.1 Automatic Number Plate Recognition (ANPR) surveys were performed at six locations within the town of Crediton on Tuesday 25th May 2010. ANPR surveys are a non-intrusive way of estimating the traffic movements through an area by automatically recording the number plates of vehicles passing a site. These records can be matched with those from other sites to give information on vehicle movements.
3.5.2 Control traffic data for the day of survey was obtained either from nearby junction MCC or ATC sites, factored to an average weekday. Table 3-C and Figure 3-D provide details of the 12 sites and Section 6 provides further analysis of the survey data.
Contains Ordnance Survey data © Crown copyright and database right 2010
A377 Knowle Cross Site
A377 Half Moon Site
A3072 Cadbury Site
Final_Report of surveys_MC.doc 8
Site Location of ANPR Cameras Direction 12hr ANPR
Records 12hr Traffic Flow from
nearest count site
1 NW 4047 4012*
2 A377 Barnstaple
Cross SE 4174 3881*
3 E 5381 5780
4 A377 Exeter Road
W 5175 5413
5 NE 1895 1998
6 A3072 West of Creedy Bridge SW 1880 2016
7 E 2219 2315
8 Commercial Road
W 2258 2403
9 E 2726 2904
10 Blagdon
W 2589 2588*
11 W 5331 5577
12 A377 Union Road
E 4776** 5550 * The ANPR record has recorded a higher flow than the manual or profiler counts. This can usually be attributed to undercounting (acceptable tolerances are within 5%) in the manual or ATC counts. ** A poor sample rate was achieved at site 12 during the morning peak
Table 3-C Summary of ANPR Locations
1
2
4
3
6
5
8
7
10
9
11
12
E12W
A377 Union Road11
W10E
Blagdon9
W8ECommercial
Road7
SW6NEA3072 West of
Creedy Bridge5
W4EA377 Exeter
Road3
SE2NWA377 Barnstaple
Cross1
DirectionLocationSite
E12W
A377 Union Road11
W10E
Blagdon9
W8ECommercial
Road7
SW6NEA3072 West of
Creedy Bridge5
W4EA377 Exeter
Road3
SE2NWA377 Barnstaple
Cross1
DirectionLocationSite
Figure 3-D Location of ANPR Sites in Crediton
Contains Ordnance Survey data © Crown copyright and database right 2010
Final_Report of surveys_MC.doc 9
4 Data Analysis: Traffic Counts
4.1 Introduction
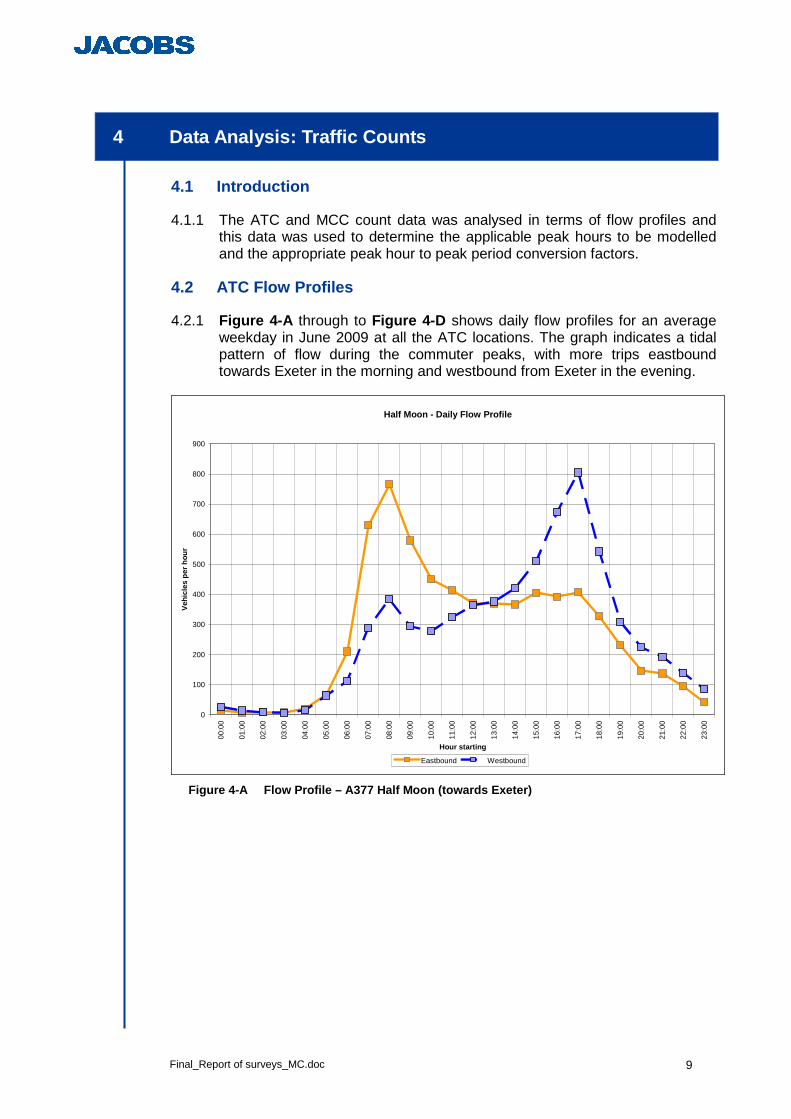
4.1.1 The ATC and MCC count data was analysed in terms of flow profiles and this data was used to determine the applicable peak hours to be modelled and the appropriate peak hour to peak period conversion factors.
4.2 ATC Flow Profiles
4.2.1 Figure 4-A through to Figure 4-D shows daily flow profiles for an average weekday in June 2009 at all the ATC locations. The graph indicates a tidal pattern of flow during the commuter peaks, with more trips eastbound towards Exeter in the morning and westbound from Exeter in the evening.
Half Moon - Daily Flow Profile
0
100
200
300
400
500
600
700
800
900
00:0
0
01:0
0
02:0
0
03:0
0
04:0
0
05:0
0
06:0
0
07:0
0
08:0
0
09:0
0
10:0
0
11:0
0
12:0
0
13:0
0
14:0
0
15:0
0
16:0
0
17:0
0
18:0
0
19:0
0
20:0
0
21:0
0
22:0
0
23:0
0
Hour starting
Veh
icle
s pe
r ho
ur
Eastbound Westbound
Figure 4-A Flow Profile – A377 Half Moon (towards Exe ter)

Final_Report of surveys_MC.doc 10
Knowle Cross - Daily Flow Profile
0
100
200
300
400
500
600
00:0
0
01:0
0
02:0
0
03:0
0
04:0
0
05:0
0
06:0
0
07:0
0
08:0
0
09:0
0
10:0
0
11:0
0
12:0
0
13:0
0
14:0
0
15:0
0
16:0
0
17:0
0
18:0
0
19:0
0
20:0
0
21:0
0
22:0
0
23:0
0
Hour starting
Veh
icle
s pe
r ho
ur
Eastbound Westbound
Figure 4-B Flow Profile – A377 Knowle Cross (towards Barnstaple)
Cadbury - Daily Flow Profile
0
20
40
60
80
100
120
140
160
180
00:0
0
01:0
0
02:0
0
03:0
0
04:0
0
05:0
0
06:0
0
07:0
0
08:0
0
09:0
0
10:0
0
11:0
0
12:0
0
13:0
0
14:0
0
15:0
0
16:0
0
17:0
0
18:0
0
19:0
0
20:0
0
21:0
0
22:0
0
23:0
0
Hour starting
Veh
icle
s pe
r ho
ur
Southbound Northbound
Figure 4-C Flow Profile – A3072 Cadbury (towards Tiv erton)
4.2.2 Figure 4-D indicates that Mill Street operates at a flat profile throughout the
daytime interpeak period. There is less difference in the flow of traffic in either direction during the peak periods. This could be attributed to the location of the Mill Street ATC site within the town itself, where commuter flows may be masked by non-commuter flows.

Final_Report of surveys_MC.doc 11
A3072 Mill Street - Daily Flow Profile
0
50
100
150
200
250
300
350
400
450
00:0
0
01:0
0
02:0
0
03:0
0
04:0
0
05:0
0
06:0
0
07:0
0
08:0
0
09:0
0
10:0
0
11:0
0
12:0
0
13:0
0
14:0
0
15:0
0
16:0
0
17:0
0
18:0
0
19:0
0
20:0
0
21:0
0
22:0
0
23:0
0
Hour starting
Veh
icle
s pe
r ho
ur
Southbound Northbound
Figure 4-D Flow Profile – Mill Street (in Crediton)
4.3 MCC Flow Profiles
4.3.1 Figure 4-E through to Figure 4-G shows 12-hour flow profiles for the manual count locations (surveyed on 25 May 2010) along the A377 through Crediton. The graphs indicate a tidal pattern of flow during the commuter peaks, which is similar to that observed at the ATC sites external to Crediton, but less pronounced.
A377 Exeter Road (west of Tesco access) - Daily Flo w Profile
0
100
200
300
400
500
600
700
800
07:0
0
08:0
0
09:0
0
10:0
0
11:0
0
12:0
0
13:0
0
14:0
0
15:0
0
16:0
0
17:0
0
18:0
0
Hour starting
Veh
icle
s pe
r hou
r
Westbound Eastbound
Figure 4-E Flow Profile – A377 Exeter Road (east of Crediton)

Final_Report of surveys_MC.doc 12
A377 East Street (east of High Street) - Daily Flow Profile
0
100
200
300
400
500
600
700
800
07:0
0
08:0
0
09:0
0
10:0
0
11:0
0
12:0
0
13:0
0
14:0
0
15:0
0
16:0
0
17:0
0
18:0
0
Hour starting
Veh
icle
s pe
r hou
r
Westbound Eastbound
Figure 4-F Flow Profile – A377 (east of High Street)
A377 High Street (east of Landscore) - Daily Flow P rofile
0
100
200
300
400
500
600
700
07:0
0
08:0
0
09:0
0
10:0
0
11:0
0
12:0
0
13:0
0
14:0
0
15:0
0
16:0
0
17:0
0
18:0
0
Hour starting
Veh
icle
s pe
r hou
r
Westbound Eastbound
Figure 4-G Flow Profile – A377 (west of High Street)
4.4 Historical Growth in Traffic
4.4.1 In order to calculate the historical growth in traffic flows these were analysed across all the ATC locations on the key arterials leading into and out of Crediton. Figure 4-G indicates that there has been no significant change in the traffic flows recorded at the ATC sites around Crediton since 2005.

Final_Report of surveys_MC.doc 13
Historical Traffic Growth based on ATC Counts
0
2000
4000
6000
8000
10000
12000
14000
2005 2006 2007 2008 2009 2010
Year
Tw
o-w
ay D
aily
Tra
ffic
A377 Barnstaple Cross
A3072 Cadbury Cross
A377 Half Moon
Figure 4-H Flow Profile of ATC Sites showing Histori cal Growth in Traffic
4.4.2 Note that due to a mechanical error the site at the A377 Half Moon ATC
insufficient data was recorded in 2010.
4.5 Determination of Peak Hours from Junction Count s
4.5.1 The Crediton Traffic Model includes assignment matrices for the AM and PM peak hours, as well as a typical interpeak hour. The junction counts were used to determine the appropriate hours to model, as the AM and PM peak hours represent the hours with the highest flow in the peak periods, whilst the interpeak hour should represent an average interpeak hour.
4.5.2 The recorded hourly flows over 15 minute time periods from 07:00 for the AM and 16:00 for the PM peak hour were analysed. Flows were summarised across all the manual count locations in Crediton for turning movements in all directions. Figure 4-I and Figure 4-J indicate the flow distribution for the AM and PM peak periods. 07:45–08:45 and 16:45–17:45 were identified as the highest hourly flows.
4.5.3 The determination of a typical interpeak peak hour was based on the analysis of interpeak period flow profiles. Figure 4-K indicates the sum of all the count sites in the town (for all movements) for each 15-minute time period in the interpeak. The figure shows a flat profile between the AM and PM peak periods.

Final_Report of surveys_MC.doc 14
Total Counted AM Peak Hour Trips
0
1000
2000
3000
4000
5000
6000
7000
8000
9000
07:00 - 08:00 07:15 - 08:15 07:30 - 08:30 07:45 - 08:45 08:00 - 09:00 08:15 - 09:15 08:30 - 09:30 08:45 - 09:45 09:00 - 10:00
Hour Assessed (peak hour highlighted)
Tot
al V
olum
e of
Trip
s co
unte
d at
all
MC
C s
ites
Figure 4-I AM Peak Hour Determination
Total Counted PM Peak Hour Trips
0
1000
2000
3000
4000
5000
6000
7000
8000
9000
16:00 - 17:00 16:15 - 17:15 16:30 - 17:30 16:45 - 17:45 17:00 - 18:00 17:15 - 18:15 17:30 - 18:30 17:45 - 18:45 18:00 - 19:00
Hour Assessed (peak hour in highlighted)
Tot
al V
olum
e of
Trip
s co
unte
d at
all
MC
C s
ites
Figure 4-J PM Peak Hour Determination

Final_R
eport of surveys_MC
.doc
15
Interpeak 15-minute C
ounts
0
200
400
600
800
1000
1200
1400
1600
1800
2000
09:00
09:15
09:30
09:45
10:00
10:15
10:30
10:45
11:00
11:15
11:30
11:45
12:00
12:15
12:30
12:45
13:00
13:15
13:30
13:45
14:00
14:15
14:30
14:45
15:00
15:15
15:30
15:45
16:00
16:15
16:30
Period A
ssessed (interpeak in orange)
Total Volume of Trips counted at all MCC sites
F
igure 4-K
Interpeak Analysis indicating a flat pro
file

Final_Report of surveys_MC.doc 16
5 Data Analysis: Roadside Interviews
5.1 Introduction
5.1.1 At each of the three locations where RSIs were performed, vehicles were stopped by a police officer and the type of vehicle and the number of occupants was recorded. Drivers were then asked a series of questions regarding their specific journey and regular travel behaviour.
5.1.2 Individual roadside interviews were conducted over a 12 hour period between 07:00 and 19:00 hours and the information collected is described in Table 5-A .
Information Code Response
Origin of Journey Postcode/town/area/street/company
Destination of Journey Postcode/town/area/street/company
Number of adults in the vehicle Occupancy Information
Number of children in the vehicle
Vehicle Type Car/LGV/OGV1/OGV2/PSV
1 Permanent Home
2 Work
3 Employers Business
4 Education
5 Shopping
6 Personal Business
7 Social
8 Recreation/Leisure
9 Holiday Home
Origin Purpose / Destination Purpose
(from which the trip
purpose was determined)
0 Other
1 Next day
2 Once more in survey week
3 In week following survey
4 In month following survey
5 In year following survey
Repetition of trip
6 Never
1 Yes
2 No Intention to stop in Crediton for any
reason? 3 Destination is Crediton
Table 5-A Key to RSI Survey Questions
Final_Report of surveys_MC.doc 17
5.2 Acceptability of RSI Survey Dates
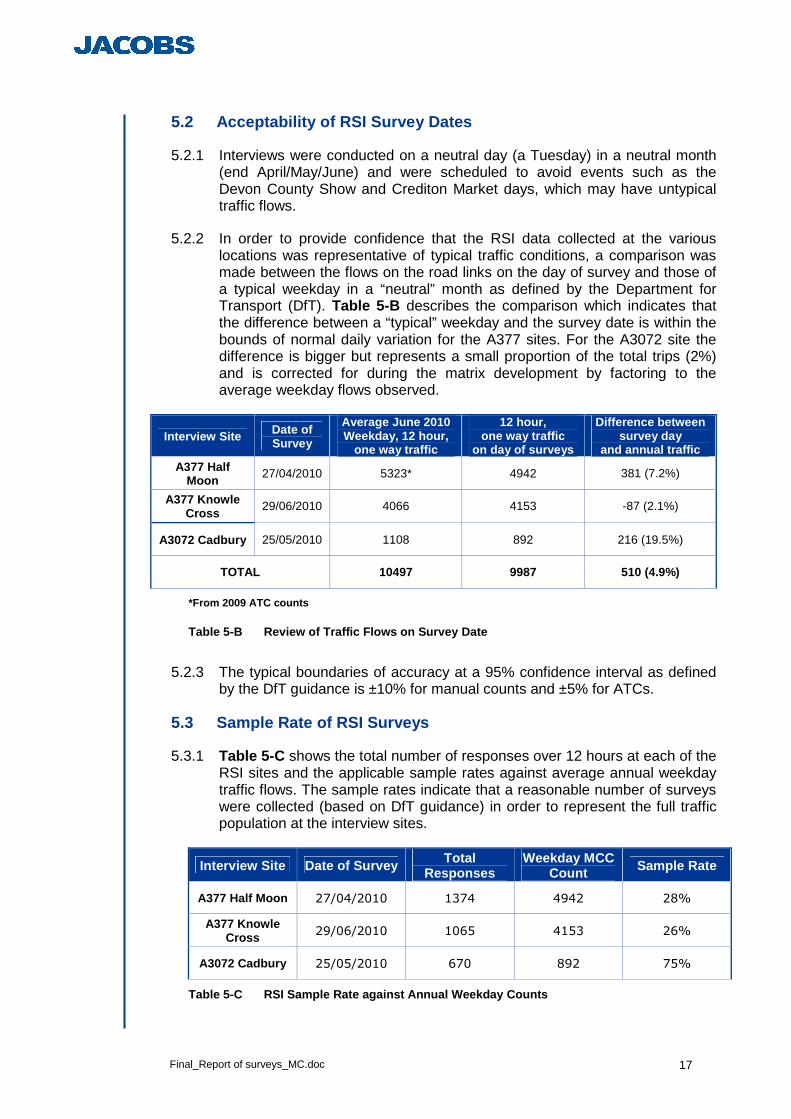
5.2.1 Interviews were conducted on a neutral day (a Tuesday) in a neutral month (end April/May/June) and were scheduled to avoid events such as the Devon County Show and Crediton Market days, which may have untypical traffic flows.
5.2.2 In order to provide confidence that the RSI data collected at the various locations was representative of typical traffic conditions, a comparison was made between the flows on the road links on the day of survey and those of a typical weekday in a “neutral” month as defined by the Department for Transport (DfT). Table 5-B describes the comparison which indicates that the difference between a “typical” weekday and the survey date is within the bounds of normal daily variation for the A377 sites. For the A3072 site the difference is bigger but represents a small proportion of the total trips (2%) and is corrected for during the matrix development by factoring to the average weekday flows observed.
Interview Site Date of Survey
Average June 2010 Weekday, 12 hour,
one way traffic
12 hour, one way traffic
on day of surveys
Difference between survey day
and annual traffic A377 Half
Moon 27/04/2010 5323* 4942 381 (7.2%)
A377 Knowle Cross
29/06/2010 4066 4153 -87 (2.1%)
A3072 Cadbury 25/05/2010 1108 892 216 (19.5%)
TOTAL 10497 9987 510 (4.9%)
*From 2009 ATC counts
Table 5-B Review of Traffic Flows on Survey Date
5.2.3 The typical boundaries of accuracy at a 95% confidence interval as defined
by the DfT guidance is ±10% for manual counts and ±5% for ATCs.
5.3 Sample Rate of RSI Surveys
5.3.1 Table 5-C shows the total number of responses over 12 hours at each of the RSI sites and the applicable sample rates against average annual weekday traffic flows. The sample rates indicate that a reasonable number of surveys were collected (based on DfT guidance) in order to represent the full traffic population at the interview sites.
Interview Site Date of Survey Total Responses
Weekday MCC Count Sample Rate
A377 Half Moon 27/04/2010 1374 4942 28%
A377 Knowle Cross 29/06/2010 1065 4153 26%
A3072 Cadbury 25/05/2010 670 892 75%
Table 5-C RSI Sample Rate against Annual Weekday Coun ts

Final_Report of surveys_MC.doc 18
5.3.2 Table 5-D shows the number of interviews undertaken, the total number of vehicles counted and the resulting sample rate at each interview site for each of the three modeled peak hours. The highest sample rates at individual sites coincide with the lowest number of passing vehicles in the accompanying traffic counts. The peak hour sample rates are similar to the sample rates over the full 12 hours.
Morning Peak Hour (07:45-08:45)
Interpeak Hour (13:00-14:00)
Evening Peak Hour (16:30-17:30)
Location
Nr of
Surveys
MC
C
Total
Sam
ple R
ate
Nr of
Surveys
MC
C
Total
Sam
ple R
ate
Nr of
Surveys
MC
C
Total
Sam
ple R
ate
Half Moon A377 105 1389 25.4% 92 789 29.5% 170 1197 25.1%
Knowle Cross A377 102 839 17.3% 91 597 30.7% 84 886 25.3%
A3072 Cadbury 71 223 74.7% 40 136 69.0% 79 205 77.5%
Table 5-D Peak Hour RSI Sample Rates
5.3.3 The total number of vehicles counted at each survey site, shown in Table 5-
D, represents the total flow of vehicles counted. This does not necessarily represent the total number of vehicles which could be interviewed as a negligibly small number of vehicles (motorcycles and other goods vehicles) were excluded from the survey.
5.3.4 Table 5-E shows sample rates for light/heavy vehicles in the RSI surveys over 12 hours.
Location Light Vehicles Heavy Vehicles (HGVs)
Interviewed Count Sample
Rate Interviewed Count Sample Rate
Half Moon A377 1282 4564 28% 77 195 39%
Knowle Cross A377 979 3779 26% 68 207 33%
A3072 Cadbury 619 782 79% 41 68 60%
Table 5-E RSI Sample Rates for Light and Heavy Vehicle s
5.3.5 Table 5-F shows the 12-hour percentage breakdown based on the main trip
purpose for each survey site. Other categories that were recorded were personal business (such as hospital appointments, visits to the bank etc); social, recreational and leisure trips; and trips to or from a holiday home.
5.3.6 Vehicle occupancy rates were also derived from the interview data. These rates are shown in Table 5-G with indicative values published in Table 4 of WebTAG 3.5.6. All the values are very similar to the WebTAG indicative values with the exception of the education trips, which show higher vehicle occupancies. This may be due to the rural location of Crediton and the location of the RSI sites along main arterials.

Final_Report of surveys_MC.doc 19
Interview
Site Commuter Employers
Business Education Personal Business,
Shopping, Social, Other A377 Half
Moon 31% 26% 5% 38%
A377 Knowle Cross 25% 24% 4% 47%
A3072 Cadbury 27% 38% 1% 33%
Table 5-F RSI Trip Purposes by site
Purpose AM IP PM Overall WebTAG
All Purpose 1.27 1.44 1.43 1.38 1.50 Commute 1.14 1.12 1.17 1.14 1.10 Education 2.12 1.49 2.24 1.95 1.60
Employers Business 1.19 1.18 1.25 1.21 1.20 Other 1.46 1.67 1.74 1.62 1.60
Table 5-G Vehicle Occupancy Rates by Period
5.4 Processing of RSI Survey Data
5.4.1 The RSI survey data was used as part of the model matrix development for the Crediton base year model. A brief overview of some of the key processes involved in manipulating the RSI data into a useable format is described below. Further processing of the data is described in the Local Model Validation Report.
Assignment of RSI records to Model Zones
5.4.2 The processing of the RSI data involved allocating an OS grid reference to each origin and destination in order to associate each record with reasonably accurate locations. The origin and destination information was provided by the respondents by means of a postcode or a description of the location.
5.4.3 Where valid postcodes were provided, records were converted into grid references. Where the postcode was found to have been incorrectly entered, it was possible to infer the correct postcode using intuitive logic. Where a business, street name, town or area location was provided, this was assigned to a grid reference and the most reasonable location determined.
5.4.4 The set of grid references was displayed on a scatter plot which was used for a visual check of the geographic locations of origins and destinations against the locations of the RSI sites. Records with unlikely routes were further investigated and illogical records removed or reversed (six records were reversed).
5.4.5 The grid references for the RSI records were related to model zones and sectors using GIS software.
Final_Report of surveys_MC.doc 20
Determination Journey Purposes for RSI Records
5.4.6 The category of trip purpose was derived from the combination of Origin Purposes and Destination Purposes provided in the RSI data (refer to the “Key” in Table 5-A):
• Commute – purposes ‘Permanent Home’ to ‘Work’ or ‘Work’ to ‘Permanent Home’ and any other trip terminating in ‘Work’ that didn’t start with ‘Work’ or ‘Employers Business’;
• Employers Business – any trip involving purpose ‘Employers Business’, or where a ‘Work’ to ‘Work’ trip was indicated. All HGV trips were associated with Employers Business;
• Education – any trip where the destination purpose was ‘Education’, or where the origin was ‘Education’ and the destination was ‘Permanent Home’;
• Shopping – any trip where the destination purpose was ‘Shopping’, or where the origin was ‘Shopping’ and the destination was ‘Permanent Home’; and
• Other – Trips that did not fit into the other categories. These included personal business, social, holiday home and recreational / leisure trips.
Conversion of RSI Data to Modelled Peak Hours
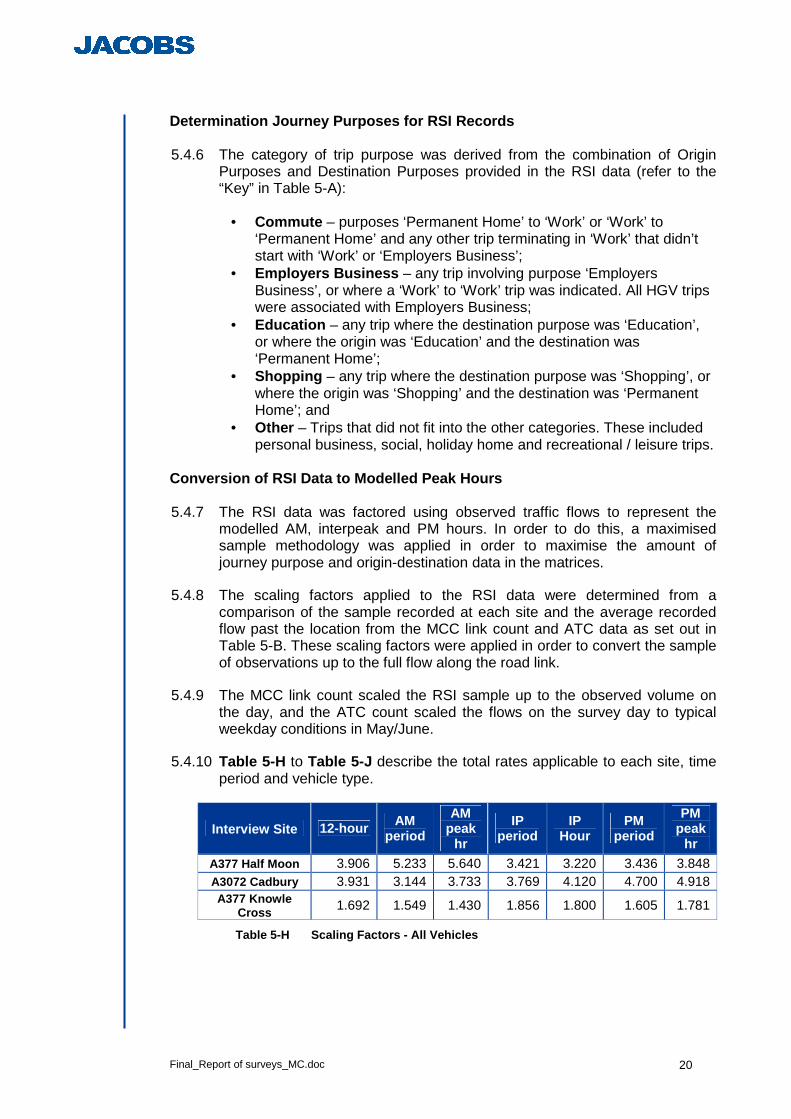
5.4.7 The RSI data was factored using observed traffic flows to represent the
modelled AM, interpeak and PM hours. In order to do this, a maximised sample methodology was applied in order to maximise the amount of journey purpose and origin-destination data in the matrices.
5.4.8 The scaling factors applied to the RSI data were determined from a comparison of the sample recorded at each site and the average recorded flow past the location from the MCC link count and ATC data as set out in Table 5-B. These scaling factors were applied in order to convert the sample of observations up to the full flow along the road link.
5.4.9 The MCC link count scaled the RSI sample up to the observed volume on the day, and the ATC count scaled the flows on the survey day to typical weekday conditions in May/June.
5.4.10 Table 5-H to Table 5-J describe the total rates applicable to each site, time period and vehicle type.
Interview Site 12-hour AM period
AM peak
hr
IP period
IP Hour
PM period
PM peak
hr A377 Half Moon 3.906 5.233 5.640 3.421 3.220 3.436 3.848 A3072 Cadbury 3.931 3.144 3.733 3.769 4.120 4.700 4.918 A377 Knowle
Cross 1.692 1.549 1.430 1.856 1.800 1.605 1.781
Table 5-H Scaling Factors - All Vehicles

Final_Report of surveys_MC.doc 21
Interview Site 12-hour AM period
AM peak
hr
IP period
IP Hour
PM period
PM peak
hr
A377 Half Moon 3.962 5.347 5.857 3.450 3.184 3.446 3.953 A3072 Cadbury 4.007 3.245 3.808 3.859 4.298 4.692 4.882 A377 Knowle
Cross 1.670 1.519 1.360 1.799 1.722 1.623 1.772
Table 5-I Scaling Factors – Cars and LGVs
Interview Site 12-hour AM period
AM peak
hr
IP period
IP Hour
PM period
PM peak
hr A377 Half Moon 3.076 3.375 2.167 3.053 4.000 3.200 1.750 A3072 Cadbury 2.692 2.038 2.500 2.696 2.250 5.400 11.000 A377 Knowle
Cross 2.000 1.867 3.000 2.800 2.500 1.273 2.000
Table 5-J Scaling Factors – HGVs
Maximised Sample Methodology
5.4.11 The survey sample represents only a fraction of the trips passing each site,
and using only the data recorded in the modelled peak hour could result in a lumpy matrix, with only certain origin-destination pairs represented. It was decided to make use of all the samples in the three hour peak period as part of the development of the peak hour matrix. In this way, lumpiness in the resultant matrices was minimised. Hence, all the interview records from the entire time period were used and then scaled to match the recorded traffic flow in the peak hour of the same survey site.
5.4.12 This required the assumption that, by example, the AM peak period trips (07:00-10:00) are representative of the AM peak hour (07:45-08:45) trips with regards to origin-destination patterns and trip purpose.
Comparison of Peak Hour and Peak Period Characteris tics
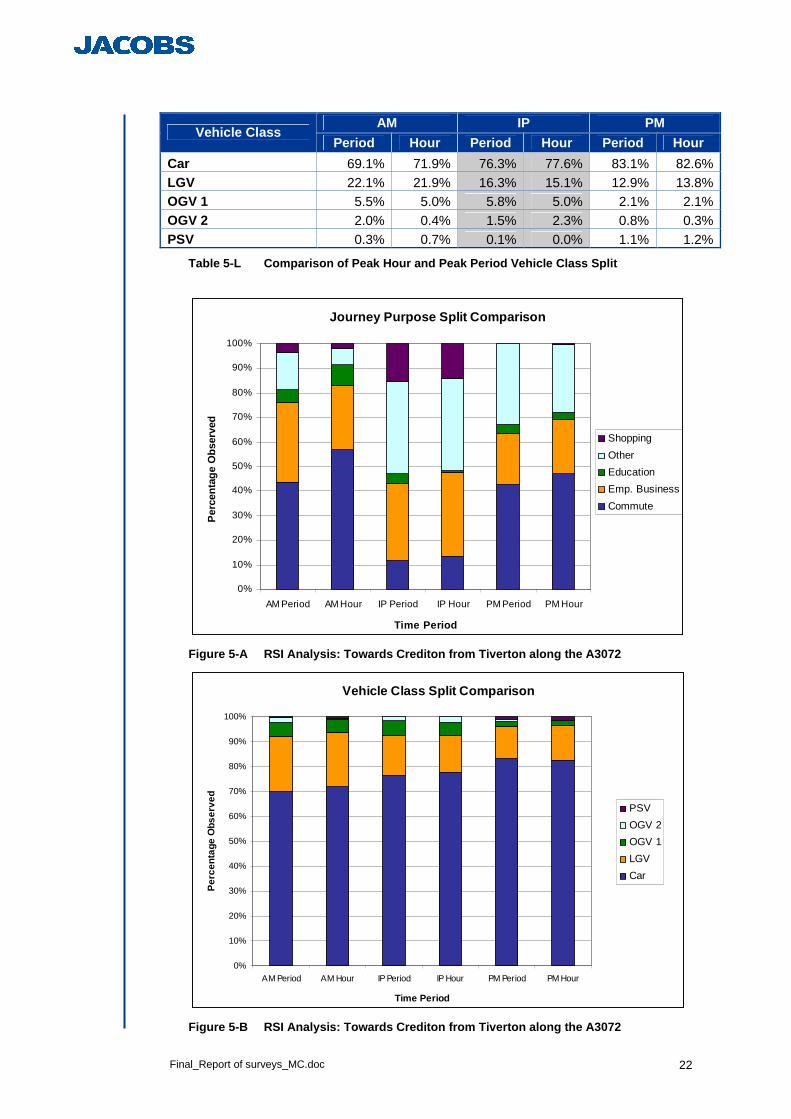
5.4.13 The RSI data was analysed for the journey purpose and vehicle class splits and trip length distributions were checked for differences between the peak hours and peak periods. Table 5-K and Table 5-L , as well as Figure 5-A and Figure 5-B , show comparisons of journey purpose and vehicle class splits for the modelled peaks.
AM IP PM Journey Purpose
Period Hour Period Hour Period Hour
Commute 43.6% 56.8% 11.8% 13.5% 39.4% 43.2% Employers Business 32.3% 25.9% 31.4% 34.1% 19.3% 20.4% Education 5.5% 8.6% 3.7% 0.9% 3.2% 2.7% Other 15.4% 6.8% 37.6% 37.2% 30.4% 25.5% Shopping 3.1% 1.8% 15.5% 14.3% 0.1% 0.3%
Total sample size 764 278 1384 223 902 333
Table 5-K Comparison of Peak Hour and Peak Period Jour ney Purpose Split
Final_Report of surveys_MC.doc 22
AM IP PM Vehicle Class
Period Hour Period Hour Period Hour
Car 69.1% 71.9% 76.3% 77.6% 83.1% 82.6% LGV 22.1% 21.9% 16.3% 15.1% 12.9% 13.8% OGV 1 5.5% 5.0% 5.8% 5.0% 2.1% 2.1% OGV 2 2.0% 0.4% 1.5% 2.3% 0.8% 0.3% PSV 0.3% 0.7% 0.1% 0.0% 1.1% 1.2%
Table 5-L Comparison of Peak Hour and Peak Period Vehi cle Class Split
Journey Purpose Split Comparison
0%
10%
20%
30%
40%
50%
60%
70%
80%
90%
100%
AM Period AM Hour IP Period IP Hour PM Period PM Hour
Time Period
Per
cent
age
Obs
erve
d
Shopping
Other
Education
Emp. Business
Commute
Figure 5-A RSI Analysis: Towards Crediton from Tiver ton along the A3072
Vehicle Class Split Comparison
0%
10%
20%
30%
40%
50%
60%
70%
80%
90%
100%
AM Period AM Hour IP Period IP Hour PM Period PM Hour
Time Period
Per
cent
age
Obs
erve
d
PSV
OGV 2
OGV 1
LGV
Car
Figure 5-B RSI Analysis: Towards Crediton from Tiver ton along the A3072

Final_Report of surveys_MC.doc 23
5.4.14 The journey purposes for the AM peak differ more than for the PM peak. However, if the commuter and employers business trips are combined the difference is 6%, and this was considered acceptable in the light of the advantages of a larger sample. The vehicle class splits differ only very slightly between the peak periods and peak hours.
5.4.15 The comparison of trip length distribution as shown in Figure 5-C , Figure 5-D and Figure 5-E indicates that the peak period and peak hour trip length distributions are very similar.
Comparison of AM Peak Trip Length Distribution(Peak Period vs Peak Hour)
0%
2%
4%
6%
8%
10%
12%
14%
16%
4
4.5 5 10 15 20 25 30 35 40 45 50 60 70 80 90 100
125
150
175
200
Mor
e
Distance (km)
Per
cent
age
of T
rips Peak Period
Peak Hour
Figure 5-C Comparison of AM Peak Hour and Peak Period Trip Distribution

Final_Report of surveys_MC.doc 24
Comparison of Interpeak Trip Length Distribution(Peak Period vs Peak Hour)
0%
2%
4%
6%
8%
10%
12%
14%
16%
4
4.5 5 10 15 20 25 30 35 40 45 50 60 70 80 90 100
125
150
175
200
Mor
e
Distance (km)
Per
cent
age
of T
rips Peak Period
Peak Hour
Figure 5-D Comparison of IP Peak Hour and Peak Period T rip Distribution
Comparison of PM Peak Trip Length Distribution(Peak Period vs Peak Hour)
0%
2%
4%
6%
8%
10%
12%
14%
16%
18%
4
4.5 5 10 15 20 25 30 35 40 45 50 60 70 80 90
100
125
150
175
200
Mor
e
Distance (km)
Per
cent
age
of T
rips Peak Period
Peak Hour
Figure 5-E Comparison of PM Peak Hour and Peak Period T rip Distribution
5.5 Analysis of RSI Data against Model Sectors
5.5.1 The peak hour and 12-hour matrices generated from the RSI data were analysed against the sectors in the model and provide an indication of the key movements from outside of Crediton through and into Crediton.
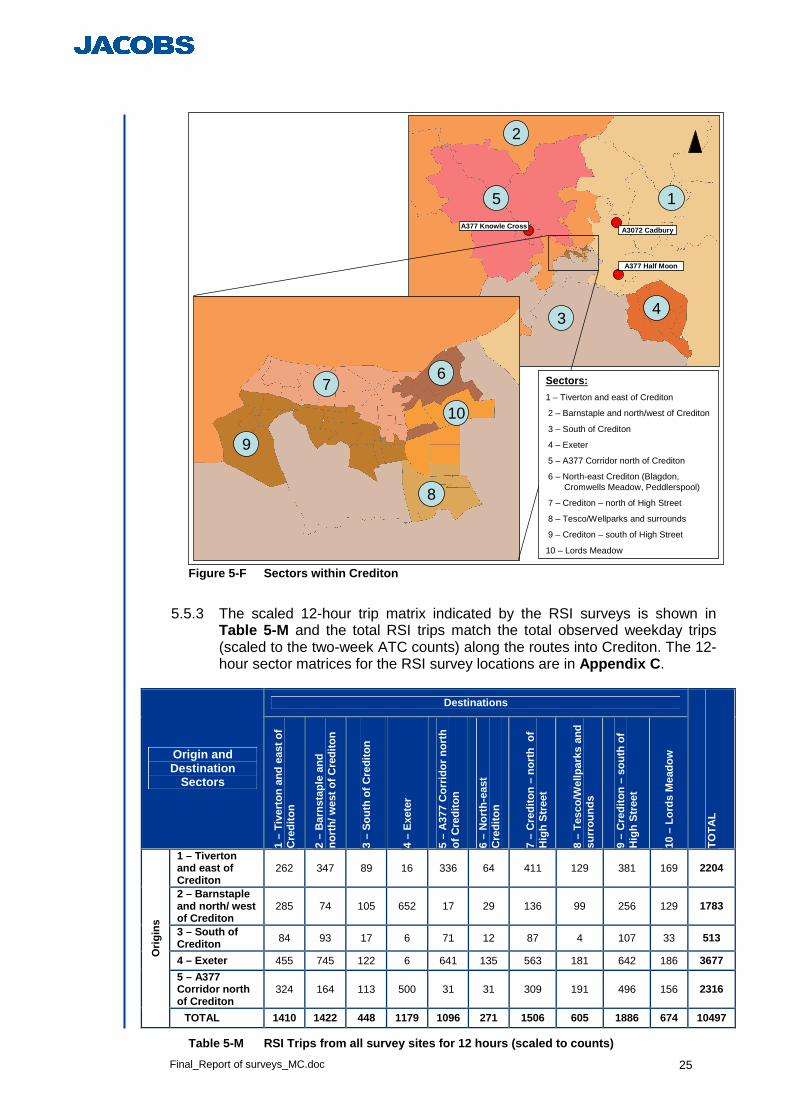
5.5.2 The model zoning system was grouped into sectors to aid the analysis of the data. The sector definition is shown in Figure 5-F .
Final_Report of surveys_MC.doc 25
6
8
7
10
9
2
1
34
Sectors:
1 – Tiverton and east of Crediton
2 – Barnstaple and north/west of Crediton
3 – South of Crediton
4 – Exeter
5 – A377 Corridor north of Crediton
6 – North-east Crediton (Blagdon, Cromwells Meadow, Peddlerspool)
7 – Crediton – north of High Street
8 – Tesco/Wellparks and surrounds
9 – Crediton – south of High Street
10 – Lords Meadow
5
A377 Knowle Cross
A377 Half Moon
A3072 Cadbury
Figure 5-F Sectors within Crediton
5.5.3 The scaled 12-hour trip matrix indicated by the RSI surveys is shown in
Table 5-M and the total RSI trips match the total observed weekday trips (scaled to the two-week ATC counts) along the routes into Crediton. The 12-hour sector matrices for the RSI survey locations are in Appendix C .
Destinations
Origin and Destination
Sectors
1 –
Tiv
erto
n an
d ea
st o
f C
redi
ton
2 –
Bar
nsta
ple
and
nort
h/ w
est o
f Cre
dito
n
3 –
Sou
th o
f Cre
dito
n
4 –
Exe
ter
5 –
A37
7 C
orrid
or n
orth
of
Cre
dito
n
6 –
Nor
th-e
ast
Cre
dito
n
7 –
Cre
dito
n –
nort
h o
f H
igh
Str
eet
8 –
Tes
co/W
ellp
arks
and
su
rrou
nds
9 –
Cre
dito
n –
sout
h of
H
igh
Str
eet
10 –
Lor
ds M
eado
w
TO
TA
L
1 – Tiverton and east of Crediton
262 347 89 16 336 64 411 129 381 169 2204
2 – Barnstaple and north/ west of Crediton
285 74 105 652 17 29 136 99 256 129 1783
3 – South of Crediton 84 93 17 6 71 12 87 4 107 33 513
4 – Exeter 455 745 122 6 641 135 563 181 642 186 3677
5 – A377 Corridor north of Crediton
324 164 113 500 31 31 309 191 496 156 2316
Orig
ins
TOTAL 1410 1422 448 1179 1096 271 1506 605 1886 674 10497
Table 5-M RSI Trips from all survey sites for 12 hou rs (scaled to counts)

Final_Report of surveys_MC.doc 26
5.5.4 Note that because the interviews were done on traffic inbound into Crediton trips originating in Sectors 1, 2, 3, 4 and 5 were recorded.
5.6 Description of Trips into Crediton
5.6.1 The RSI data was used in conjunction with ANPR data, manual and automatic traffic counts to analyse the flow of traffic into and through Crediton The results of this analysis are shown in Figure 5-G to Figure 5-I and provide an indication of the proportion of trips stopping in Crediton and travelling through Crediton to destinations beyond.
Flow through Crediton
From south-east: Roadside Interview Results – 12 Hours
Flow stopping in Crediton
Stopping = 3670 (69%)
Through = 1540 (29%)
Along A377 (from Exeter)
Total volume = 5323 (from ATC)
Through = 100 (2%)
Contains Ordnance Survey data © Crown copyright and database right 2010
279 to Lords Meadow
Figure 5-G RSI Analysis: Towards Crediton from Exeter along the A377

Final_Report of surveys_MC.doc 27
Contains Ordnance Survey data © Crown copyright and database right 2010
Flow through Crediton
From north-west: Roadside Interview Results – 12 Hours
Flow stopping in Crediton
Stopping = 2074 (51%)
Through = 1714 (42%)
Along A377 (from Barnstable)
Total volume = 4066 (from ATC)
Through = 277 (7%)
281 to Lords Meadow
Figure 5-H Towards Crediton from Barnstaple along t he A377
Contains Ordnance Survey data © Crown copyright and database right 2010
Flow through Crediton
From north-east: Roadside Interview Results – 12 Hours
Flow stopping in Crediton
Stopping = 761 (69%)
Along A3072 (from Tiverton)
Through = 160 (14%)
Through = 186 (17%)
113 to Lords Meadow
Total volume = 1108 (from ATC)
Figure 5-I RSI Analysis: Towards Crediton from Tiver ton along the A3072

Final_Report of surveys_MC.doc 28
6 Data Analysis: ANPRs and Journey Times
6.1 Introduction
6.1.1 On the same day as the manual counts (25 May 2010) a series of automatic number plate surveys were conducted. This involved a number of cameras around the town recording number plates and matching them together to see which route they took through the town.
6.1.2 All the ANPR processing was done using the software suite MicroMatch, which was used to extract matrices of trips between ANPR sites. This data was used to calculate routing and journey times through the town.
6.2 Locations of ANPR sites
6.2.1 Figure 3-D in Section 3 shows ANPR sites in the town of Crediton and Appendix D includes detailed location plans for each site.
6.3 Processing of ANPR Data
6.3.1 Each record represents the observation of one vehicle at a particular time, classified as either a light vehicle (car/LGV) or a heavy vehicle (HGV).
6.3.2 Error checks were performed by investigating the length of the vehicle registration string in the imported data files. The results of this check are summarised in Table 6-A , and indicate a very low proportion of partial matches for most of the sites.
Site No.
Location Direction 12hr ANPR Records
No. of plates with <5 chars
% of total
1 NW 4047 5 0.12%
2 A377 Barnstaple Cross
SE 4174 20 0.48%
3 E 5381 48 0.89%
4 A377 Exeter Road
W 5175 8 0.15%
5 NE 1895 0 0.00%
6 A3072 W of Creedy Bridge
SW 1880 2 0.11%
7 E 2219 8 0.36%
8 Commercial Road
W 2258 0 0.00%
9 E 2726 12 0.44%
10 Blagdon
W 2589 1 0.04%
11 W 5331 0 0.00%
12 A377 Union Road
E 4776 101 2.11%
Table 6-A Partially Captured Registration Records
6.3.3 Given that a small number of these records may be genuine, it was
concluded that two sites required further investigation, which showed that the partial records are spread throughout the day at site 3, indicating that the positioning of the camera or vehicle queueing may be responsible. At site 12 all 101 of the partial records occur in the first 47 minutes of the survey, which suggests that an initial fault may have occurred with the camera or

Final_Report of surveys_MC.doc 29
recording. This was then rectified by the survey team and a good sample rate achieved throughout the rest of the survey.
6.4 Validation of ANPR Records
6.4.1 The number of ANPR records collected was checked against available traffic count information. Traffic data for the day of survey was obtained either from nearby MCC or ATC sites. Table 6-B contains the sample rates for the AM and PM peak and all day (12-hour) time periods.
ANPR Records Traffic Flow Sample Rate (%)
Site No.
0700-1000
1600-1900
0700-1900
0700-1000
1600-1900
0700-1900
0700-1000
1600-1900
0700-1900
1 709 1427 4047 682 1410 4012 104.0% 101.2% 100.9%
2 1488 837 4175 1414 834 3881 105.2% 100.4% 107.6%
3 1808 1212 5381 1927 1257 5780 93.8% 96.4% 93.1%
4 987 1754 5175 996 1974 5926 99.1% 88.9% 87.3%
5 526 473 1895 541 509 1998 97.2% 92.9% 94.8%
6 476 563 1880 513 601 2016 92.8% 93.7% 93.3%
7 655 514 2219 680 555 2315 96.3% 92.6% 95.9%
8 372 768 2258 382 834 2403 97.4% 92.1% 94.0%
9 684 617 2726 813 655 2904 84.1% 94.2% 93.9%
10 436 955 2589 447 965 2588 97.5% 99.0% 100.0%
11 1008 1765 5331 1303 1783 5577 77.4% 99.0% 95.6%
12 1403 1124 4776 1886 1308 5550 74.4% 85.9% 86.1%
Total 10552 12009 42452 11584 12685 44950 91.1% 94.7% 94.4%
Table 6-B Comparison of ANPR Records and Traffic Flo ws
6.4.2 Sample rates greater than 100% at Barnstaple Cross indicate possible
undercounting of the traffic by the counter or can be attributed to the difference in location between the ANPR and the nearest count. This is not considered to be critical as the accepted tolerance of traffic counts at a 95% confidence interval is 10% for manual counts and 5% for automatic counts. Figure 6-A to Figure 6-C presents the same information in graphical form. Results which indicate low sample rates are highlighted.
6.4.3 For the sites along Union Road, queueing along the road upon which the ANPR camera is focussed may also result in a low sample rate as vehicles may obscure the number plate in front of or behind them.

Final_Report of surveys_MC.doc 30
ANPR Records Compared with Traffic Counts Counts - AM Peak Period0700-1000
0
500
1000
1500
2000
2500
1 2 3 4 5 6 7 8 9 10 11 12
Site No.
ANPR records
Traffic Counts
Figure 6-A Analysis of ANPR Records in the AM Peak
ANPR Records Compared with Traffic Counts Counts - PM Peak Period1600-1900
0
500
1000
1500
2000
2500
1 2 3 4 5 6 7 8 9 10 11 12
Site No.
ANPR records
Traffic Counts
Figure 6-B Analysis of ANPR Records in the PM Peak

Final_Report of surveys_MC.doc 31
ANPR Records Compared with Traffic Counts Counts - 12 Hours0700-1900
0
1000
2000
3000
4000
5000
6000
7000
1 2 3 4 5 6 7 8 9 10 11 12
Site No.
ANPR records
Traffic Counts
Figure 6-C Analysis of ANPR Records over 12 hours
6.5 Analysis of ANPR Data using MicroMatch Software
6.5.1 Table 6-C shows the number of number plate matches made between two ANPR locations within a 15 minute period between 7am to 7pm. The table represents a sample of the matches, as the data was also used to match a series of 3 sites in order to identify trips along specific routes.
From/To Barnstaple Cross
High Street Tesco Lord’s
Meadow Blagdon Exhibiton Road
Barnstaple Cross 0 1918 1174 305 340 335
High Street 2042 106 1928 306 97 282 Tesco 1431 2703 33 341 541 155
Lord’s Meadow 300 335 325 46 597 213 Blagdon 448 137 558 697 143 330
Exhibiton Road 313 355 120 177 198 35
Table 6-C ANPR Matching Matrix
6.6 Extraction of Journey Time Data
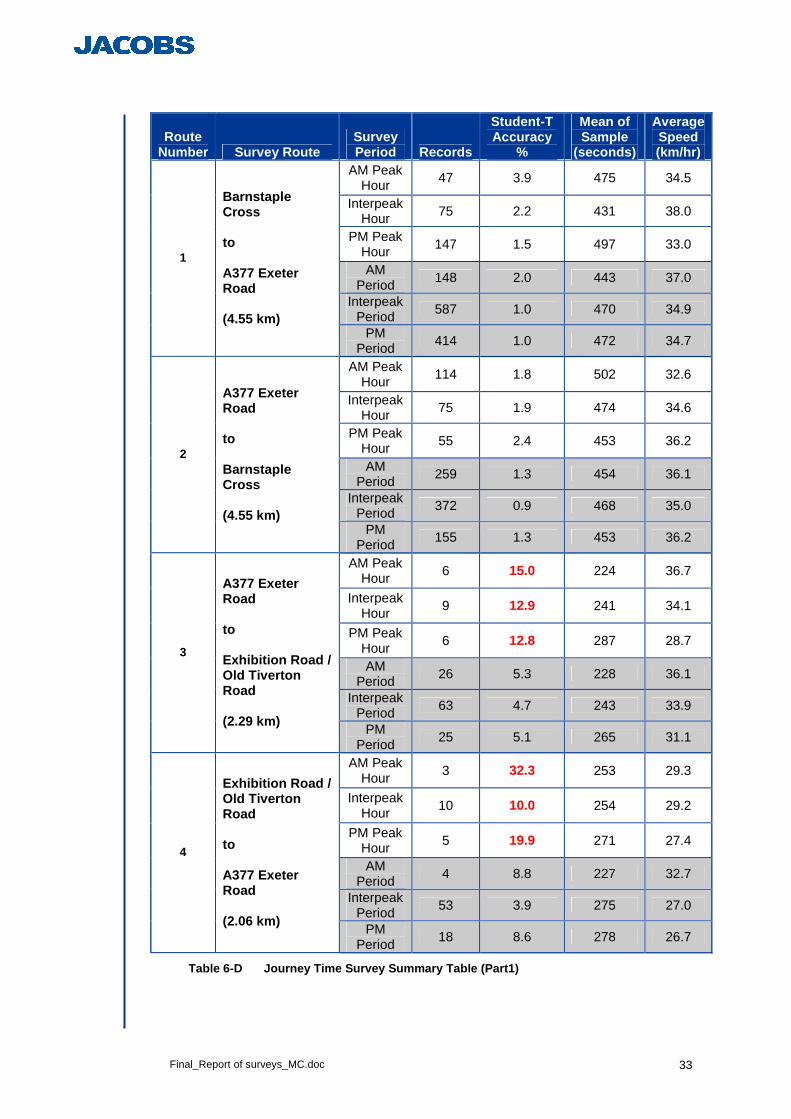
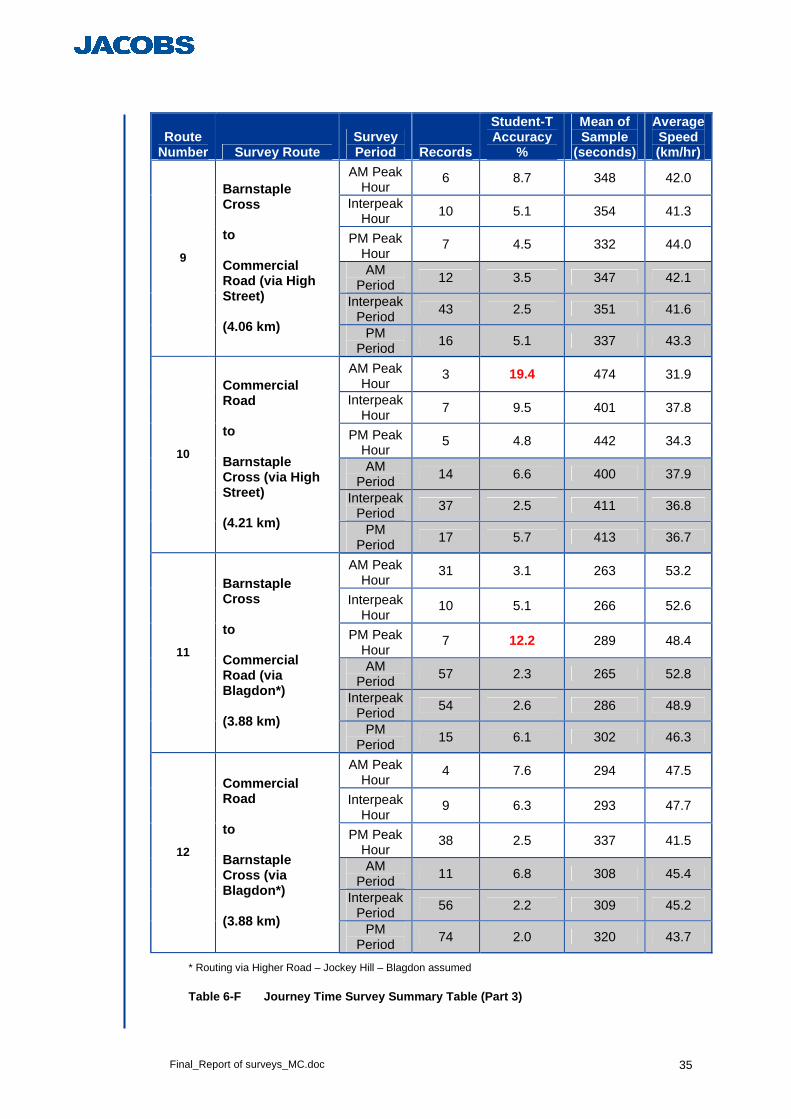
6.6.1 Table 6-D , Table 6-E and Table 6-F show the extracted journey times by time period in both directions of the journey time routes shown in Figure 6-D, Figure 6-E and Figure 6-F . The peak hours represent the following times:
• AM peak hour = 07h45 to 08h45 • IP peak hour = 13h00 to 14h00 • PM peak hour = 16h45 to 17h45

Final_Report of surveys_MC.doc 32
Contains Ordnance Survey data © Crown copyright and database right 2010
3 421
Journey Time Validation Routes (1)
Figure 6-D Journey Time Routes extracted from ANPRs (part 1)
Contains Ordnance Survey data © Crown copyright and database right 2010
65
8
7
Journey Time Validation Routes (2)
Figure 6-E Journey Time Routes extracted from ANPRs (part 2)
Contains Ordnance Survey data © Crown copyright and database right 2010
10
9
Journey Time Validation Routes (3)
Figure 6-F Journey Time Routes extracted from ANPRs (part 3)
Final_Report of surveys_MC.doc 33
Route Number Survey Route
Survey Period Records
Student-T Accuracy
%
Mean of Sample
(seconds)
Average Speed (km/hr)
AM Peak Hour
47 3.9 475 34.5
Interpeak Hour 75 2.2 431 38.0
PM Peak Hour
147 1.5 497 33.0
AM Period
148 2.0 443 37.0
Interpeak Period
587 1.0 470 34.9
1
Barnstaple Cross to A377 Exeter Road (4.55 km)
PM Period
414 1.0 472 34.7
AM Peak Hour
114 1.8 502 32.6
Interpeak Hour
75 1.9 474 34.6
PM Peak Hour 55 2.4 453 36.2
AM Period
259 1.3 454 36.1
Interpeak Period
372 0.9 468 35.0
2
A377 Exeter Road to Barnstaple Cross (4.55 km)
PM Period
155 1.3 453 36.2
AM Peak Hour
6 15.0 224 36.7
Interpeak Hour
9 12.9 241 34.1
PM Peak Hour
6 12.8 287 28.7
AM Period
26 5.3 228 36.1
Interpeak Period
63 4.7 243 33.9
3
A377 Exeter Road to Exhibition Road / Old Tiverton Road (2.29 km)
PM Period
25 5.1 265 31.1
AM Peak Hour
3 32.3 253 29.3
Interpeak Hour
10 10.0 254 29.2
PM Peak Hour
5 19.9 271 27.4
AM Period
4 8.8 227 32.7
Interpeak Period
53 3.9 275 27.0
4
Exhibition Road / Old Tiverton Road to A377 Exeter Road (2.06 km)
PM Period
18 8.6 278 26.7
Table 6-D Journey Time Survey Summary Table (Part1)

Final_Report of surveys_MC.doc 34
Route Number Survey Route
Survey Period Records
Student-T Accuracy
%
Mean of Sample
(seconds)
Average Speed (km/hr)
AM Peak Hour
43 6.8 235 22.0
Interpeak Hour 27 11.6 213 24.3
PM Peak Hour
33 6.4 261 19.8
AM Period
93 3.9 209 24.8
Interpeak Period
124 3.0 205 25.3
5
A377 Exeter Road to Commercial Road (1.44 km)
PM Period
57 4.7 243 21.3
AM Peak Hour
13 11.5 280 15.6
Interpeak Hour
31 5.2 211 20.7
PM Peak Hour
44 7.8 246 17.8
AM Period
39 6.8 223 19.6
Interpeak Period
128 2.7 207 21.1
6
Commercial Road to A377 Exeter Road (1.21 km)
PM Period
87 4.1 209 20.9
AM Peak Hour
153 3.7 188 27.8
Interpeak Hour
174 2.9 169 31.0
PM Peak Hour
292 1.9 234 22.4
AM Period
399 2.2 186 28.1
Interpeak Period
1064 1.2 180 29.1
7
A377 Exeter Road to Church Street (1.45 km)
PM Period
764 1.3 219 23.9
AM Peak Hour
181 2.8 216 24.2
Interpeak Hour
135 3.2 182 28.8
PM Peak Hour
122 3.6 197 26.6
AM Period
416 2.5 203 25.8
Interpeak Period
753 1.3 187 28.0
8
Church Street to A377 Exeter Road (1.45 km)
PM Period
350 2.0 191 27.4
Table 6-E Journey Time Survey Summary Table (Part 2)
Final_Report of surveys_MC.doc 35
Route Number Survey Route
Survey Period Records
Student-T Accuracy
%
Mean of Sample
(seconds)
Average Speed (km/hr)
AM Peak Hour
6 8.7 348 42.0
Interpeak Hour 10 5.1 354 41.3
PM Peak Hour
7 4.5 332 44.0
AM Period
12 3.5 347 42.1
Interpeak Period
43 2.5 351 41.6
9
Barnstaple Cross to Commercial Road (via High Street) (4.06 km) PM
Period 16 5.1 337 43.3
AM Peak Hour
3 19.4 474 31.9
Interpeak Hour
7 9.5 401 37.8
PM Peak Hour
5 4.8 442 34.3
AM Period
14 6.6 400 37.9
Interpeak Period
37 2.5 411 36.8
10
Commercial Road to Barnstaple Cross (via High Street) (4.21 km) PM
Period 17 5.7 413 36.7
AM Peak Hour
31 3.1 263 53.2
Interpeak Hour
10 5.1 266 52.6
PM Peak Hour
7 12.2 289 48.4
AM Period
57 2.3 265 52.8
Interpeak Period
54 2.6 286 48.9
11
Barnstaple Cross to Commercial Road (via Blagdon*) (3.88 km)
PM Period
15 6.1 302 46.3
AM Peak Hour
4 7.6 294 47.5
Interpeak Hour
9 6.3 293 47.7
PM Peak Hour
38 2.5 337 41.5
AM Period
11 6.8 308 45.4
Interpeak Period
56 2.2 309 45.2
12
Commercial Road to Barnstaple Cross (via Blagdon*) (3.88 km)
PM Period
74 2.0 320 43.7
* Routing via Higher Road – Jockey Hill – Blagdon assumed
Table 6-F Journey Time Survey Summary Table (Part 3 )

Final_Report of surveys_MC.doc 36
6.6.2 The journey time data shows that the slowest routes are between Lords Meadow and the A377 towards Exeter. The fastest route is between Barnstaple Cross and Commercial Road via Blagdon (ie. along Higher Road), and the route via the High Street demonstrates a higher average speed as well.
6.6.3 The average speed during the peaks along the High Street, derived from the routes which include the High Street (routes 1, 2, 3, 4, 9 and 10), is approximately 22mph (35kph). This speed is higher than the average speeds of between 8.6 and 18.9mph for key corridors in Exeter (as described in Chapter 4 of the “Road Transport and Casualty Statistics for Devon 2004” on the Devon County Council website).

Final_Report of surveys_MC.doc 37
7 Accident Data
7.1 Introduction
7.1.1 Accident data collected includes detailed information about the circumstances of personal injury road accidents, including the types of vehicles involved and the consequent casualties.
7.2 Accident Types and Locations
7.2.1 Summary plans showing the locations and severity of each personal injury accident can be found attached in Appendix E . The links worst affected by fatal and serious accidents are around the junction of Charlotte Street and East Street, and along the High Street. The split by severity for the last 5 years is illustrated in the Table 7-A below.
2005 2006 2007 2008 2009 Fatal 1 1 0 0 0 Serious 4 0 1 1 0 Slight 10 14 8 9 16 Total 15 15 9 10 16
Table 7-A Accidents by Severity
7.2.2 Table 7-B analyses the accidents in Crediton against the accidents
predicted by using DMRB guidelines and the length of the road network in Crediton. It shows that Crediton has had fewer accidents than predicted, which indicates that there is not a accident problem in Crediton.
Year Actual Accidents Predicted Accidents Fatal Serious Slight Fatal Serious Slight
2005 1 4 10 0 2 14 2006 1 0 14 0 2 14 2007 0 1 8 0 2 14 2008 0 1 9 0 2 14 2009 0 0 16 0 2 13
5 year total 2 6 57 1 8 69
Table 7-B Analysis of Actual vs Predicated Accidents
7.2.3 Table 7-C gives a breakdown of accidents in Crediton classified by type.
The most common causes of accidents are displayed.
Cause Number Pedestrian crossing road heedless of traffic 17 Going too fast for circumstances 9 Careless/reckless/in a hurry 13 Failed to judge other person's path or speed 3 Poor turn or manoeuvre 13 Negligent manoeuvre 5 Failed to look properly 5 Total 65
Table 7-C Accidents by Type

Final_Report of surveys_MC.doc 1
Appendix A Glossary of Terms
ATC Automatic Traffic Count
ANPR Automatic Number Plate Recognition
DfT Department for Transport
DCC Devon County Council
DMRB Design Manual for Roads and Bridges – This is a comprehensive manual system which accommodates all current standards, advise notes and other published documents relating to the design, assessment and operation of trunk roads (including motorways)
HGV Heavy Goods Vehicle (vehicle classification)
LGV Light Goods Vehicle (vehicle classification)
MCC Manual Classified Traffic Count (including turning movements)
MCL Motorcycle (vehicle classification)
OGV Other Goods Vehicle (vehicle classification)
OS Ordinance Survey
PCL Pedal Cycle (vehicle classification)
PSV Passenger Service Vehicle (vehicle classification) - Bus, Coach and Taxi
RSI Roadside Interview Survey
SATURN Simulation and Assignment of Traffic to Urban Road Networks – A suite of network analysis programs used to analyse the impact of traffic on highway networks (developed and distributed by WS Atkins)
WebTAG DfT (Department for Transport) Transport Analysis Guidance Resource – provides detailed guidance on the appraisal of transport projects and wider advise on scoping and carrying out transport studies

Final_Report of surveys_MC.doc 2
Appendix B MCC Count Turning Movement Diagrams
• Appendix B1 – 12 hour turning movements (all vehicles) • Appendix B2 – AM, IP and PM peak hour turning movements (light vehicles) • Appendix B3 – AM, IP and PM peak hour turning movements (heavy vehicles)

Final_Report of surveys_MC.doc 3
Appendix C Sector Trip Matrices from RSI Surveys
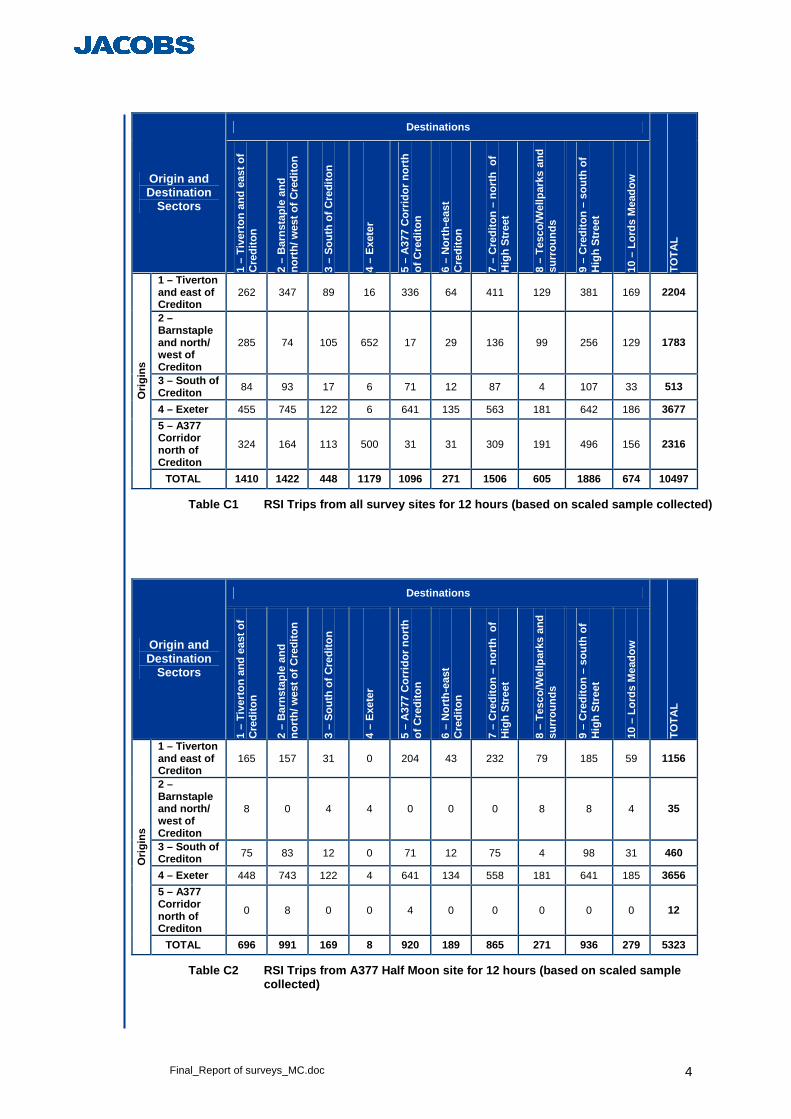
Figure C1 describes the defined sectors and Tables C1 to C4 describe the 12-hour flows for all the sites combined (Table C1) and the individual sites. Note that because the interviews were done on traffic inbound into Crediton trips originating in Sectors 1, 2, 3, 4 and 5 were recorded.
6
8
7
10
9
2
1
34
Sectors:
1 – Tiverton and east of Crediton
2 – Barnstaple and north/west of Crediton
3 – South of Crediton
4 – Exeter
5 – A377 Corridor north of Crediton
6 – North-east Crediton (Blagdon, Cromwells Meadow, Peddlerspool)
7 – Crediton – north of High Street
8 – Tesco/Wellparks and surrounds
9 – Crediton – south of High Street
10 – Lords Meadow
5
A377 Knowle Cross
A377 Half Moon
A3072 Cadbury
Figure C1 Sectors within Crediton and RSI locations
Final_Report of surveys_MC.doc 4
Destinations
Origin and Destination
Sectors
1 –
Tiv
erto
n an
d ea
st o
f C
redi
ton
2 –
Bar
nsta
ple
and
nort
h/ w
est o
f Cre
dito
n
3 –
Sou
th o
f Cre
dito
n
4 –
Exe
ter
5 –
A37
7 C
orrid
or n
orth
of
Cre
dito
n
6 –
Nor
th-e
ast
Cre
dito
n
7 –
Cre
dito
n –
nort
h o
f H
igh
Str
eet
8 –
Tes
co/W
ellp
arks
and
su
rrou
nds
9 –
Cre
dito
n –
sout
h of
H
igh
Str
eet
10 –
Lor
ds M
eado
w
TO
TA
L
1 – Tiverton and east of Crediton
262 347 89 16 336 64 411 129 381 169 2204
2 – Barnstaple and north/ west of Crediton
285 74 105 652 17 29 136 99 256 129 1783
3 – South of Crediton 84 93 17 6 71 12 87 4 107 33 513
4 – Exeter 455 745 122 6 641 135 563 181 642 186 3677
5 – A377 Corridor north of Crediton
324 164 113 500 31 31 309 191 496 156 2316
Orig
ins
TOTAL 1410 1422 448 1179 1096 271 1506 605 1886 674 10497
Table C1 RSI Trips from all survey sites for 12 hour s (based on scaled sample collected)
Destinations
Origin and Destination
Sectors
1 –
Tiv
erto
n an
d ea
st o
f C
redi
ton
2 –
Bar
nsta
ple
and
nort
h/ w
est o
f Cre
dito
n
3 –
Sou
th o
f Cre
dito
n
4 –
Exe
ter
5 –
A37
7 C
orrid
or n
orth
of
Cre
dito
n
6 –
Nor
th-e
ast
Cre
dito
n
7 –
Cre
dito
n –
nort
h o
f H
igh
Str
eet
8 –
Tes
co/W
ellp
arks
and
su
rrou
nds
9 –
Cre
dito
n –
sout
h of
H
igh
Str
eet
10 –
Lor
ds M
eado
w
TO
TA
L
1 – Tiverton and east of Crediton
165 157 31 0 204 43 232 79 185 59 1156
2 – Barnstaple and north/ west of Crediton
8 0 4 4 0 0 0 8 8 4 35
3 – South of Crediton 75 83 12 0 71 12 75 4 98 31 460
4 – Exeter 448 743 122 4 641 134 558 181 641 185 3656
5 – A377 Corridor north of Crediton
0 8 0 0 4 0 0 0 0 0 12
Orig
ins
TOTAL 696 991 169 8 920 189 865 271 936 279 5323
Table C2 RSI Trips from A377 Half Moon site for 12 h ours (based on scaled sample collected)

Final_Report of surveys_MC.doc 5
Destinations
Origin and Destination
Sectors 1
– T
iver
ton
and
east
of
Cre
dito
n
2 –
Bar
nsta
ple
and
nort
h/ w
est o
f Cre
dito
n
3 –
Sou
th o
f Cre
dito
n
4 –
Exe
ter
5 –
A37
7 C
orrid
or n
orth
of
Cre
dito
n
6 –
Nor
th-e
ast
Cre
dito
n
7 –
Cre
dito
n –
nort
h o
f H
igh
Str
eet
8 –
Tes
co/W
ellp
arks
and
su
rrou
nds
9 –
Cre
dito
n –
sout
h of
H
igh
Str
eet
10 –
Lor
ds M
eado
w
TO
TA
L
1 – Tiverton and east of Crediton
0 0 4 4 0 0 0 0 0 0 8
2 – Barnstaple and north/ west of Crediton
277 70 102 648 16 27 133 90 246 125 1734
3 – South of Crediton 4 0 4 4 0 0 4 0 4 0 20
4 – Exeter 4 0 0 0 0 0 0 0 0 0 4
5 – A377 Corridor north of Crediton
324 156 113 500 23 31 309 191 496 156 2301
Orig
ins
TOTAL 609 227 223 1156 39 59 445 281 746 281 4066
Table C3 RSI Trips from A377 Knowle Cross site for 1 2 hours (based on scaled sample collected)
Destinations
Origin and Destination
Sectors
1 –
Tiv
erto
n an
d ea
st o
f C
redi
ton
2 –
Bar
nsta
ple
and
nort
h/ w
est o
f Cre
dito
n
3 –
Sou
th o
f Cre
dito
n
4 –
Exe
ter
5 –
A37
7 C
orrid
or n
orth
of
Cre
dito
n
6 –
Nor
th-e
ast
Cre
dito
n
7 –
Cre
dito
n –
nort
h o
f H
igh
Str
eet
8 –
Tes
co/W
ellp
arks
and
su
rrou
nds
9 –
Cre
dito
n –
sout
h of
H
igh
Str
eet
10 –
Lor
ds M
eado
w
TO
TA
L
1 – Tiverton and east of Crediton
96 189 54 12 132 20 179 51 196 110 1040
2 – Barnstaple and north/ west of Crediton
0 3 0 0 2 2 3 2 2 0 14
3 – South of Crediton 5 10 2 2 0 0 8 0 5 2 34
4 – Exeter 3 2 0 2 0 2 5 0 2 2 17
5 – A377 Corridor north of Crediton
0 0 0 0 3 0 0 0 0 0 3
Orig
ins
TOTAL 105 205 56 15 137 24 196 52 205 113 1108
Table C4 RSI Trips from A3072 Cadbury site for 12 ho urs (based on scaled sample collected)

Final_Report of surveys_MC.doc 6
Appendix D Crediton ANPR Locations
Refer to the document: “Appendix D - Crediton ANPR locations.pdf” Use of Google Streetview and Mapping is acknowledged.

Final_Report of surveys_MC.doc 7
Appendix E Accident and Collision Data
Refer to the attached documents: Appendix E1 – Appendix E4