credit suisse group ag paradeplatz 8 - rns submit · credit suisse group ag paradeplatz 8 p.o ......
TRANSCRIPT
CREDIT SUISSE GROUP AG
Paradeplatz 8
P.O. Box CH-8070 Zurich Switzerland
Telephone +41 844 33 88 44
Fax +41 44 333 88 77 [email protected]
Media Release
Credit Suisse Group full-year 2012 results: underlying* core pre-tax income
of CHF 5,008 million, up from CHF 2,371 million in 2011; underlying* net
income attributable to shareholders of CHF 3,577 million, up from CHF
1,797 million in 2011 and underlying* return on equity of 10%
2012 reported core pre-tax income of CHF 2,106 million, net income
attributable to shareholders of CHF 1,483 million and return on equity of
4%, reflecting fair value charges on own debt of CHF 2,939 million before
taxes due to an improvement in own credit spreads and other significant
non-operating items
4Q12 results:
4Q12 underlying* core pre-tax income of CHF 1,173 million,
underlying* net income attributable to shareholders of CHF 816
million and underlying* return on equity of 9%
4Q12 reported core pre-tax income of CHF 596 million, net income
attributable to shareholders of CHF 397 million and return on equity
of 4%, reflecting fair value charges on own debt of CHF 376 million
before taxes due to an improvement in own credit spreads and other
significant non-operating items
4Q12 divisional results year-on-year:
Significantly stronger results in combined Private Banking & Wealth
Management with pre-tax income of CHF 911 million compared to
CHF 532 million in 4Q11
Substantially improved results in Investment Banking with pre-tax
income of CHF 298 million compared to a loss in 4Q11; with
significant benefits from a focus on market-leading, high-return
businesses
21% of Group-wide net revenues generated as collaboration
revenues from the integrated bank, exceeding KPI target of 18%-
20%
Continued delivery of capital plan:
Capital: 4Q12 Look-through Swiss Core Capital ratio of 9.4% on a pro
forma basis in line with target, on track to exceed end-2018
Media Release
February 7, 2013
Page 2/14
requirement of 10% by mid-2013
Balance sheet: Reduced total balance sheet assets by CHF 99 billion
since end of 3Q12 to CHF 924 billion, substantially ahead in progress
toward target of below CHF 900 billion by year-end 2013
Risk-weighted assets: Basel III RWA reduced by CHF 77 billion since
end of 3Q11 to CHF 293 billion, close to year-end 2013 target of
below CHF 280 billion
Progress on cost savings:
Achieved expense savings of CHF 2.0 billion, increasing 2013 interim
target to CHF 3.2 billion and raising total cost run rate reduction
target to CHF 4.4 billion by end-2015 versus adjusted* annualized
1H11 run rate
Zurich, February 7, 2013 Credit Suisse Group reports 4Q12 and 2012 full-year results.
Brady W. Dougan, Chief Executive Officer, said: “2012 was a year of transition. We took significant steps
to adapt our businesses and our organization to new regulatory requirements, changing client demands
and the current market environment. Since the beginning of 2012, we have further reduced Basel III risk-
weighted assets by CHF 55 billion across the Bank, substantially strengthened our capital position by
adding CHF 12.3 billion in pro forma Look-through Swiss Core Capital, lowered our cost base by CHF 2.0
billion compared to the adjusted* annualized run rate for the first half of 2011, and continued to invest in
key markets. Throughout this transformation, we generated solid revenues and an underlying* return on
equity of 10% for the full year of 2012, and we maintained our strong market share momentum across
businesses. In the fourth quarter, we also continued to see the benefit from our integrated bank model,
with 21% of our group-wide net revenues being generated from the collaboration between our divisions.
Our clients appreciate the swift and decisive action that we took to adapt our organization to the new
regulatory requirements and view us as a strong and reliable partner.”
Commenting on the results of the Private Banking & Wealth Management division, he continued: “We
made good progress in the fourth quarter in adapting our Private Banking & Wealth Management business
to the new environment, capturing client momentum and improving profitability. We generated good top-
line results due to solid transaction- and performance-based revenues, despite continued client risk
aversion. In the fourth quarter, we also took organizational steps to better manage the alignment of the
products, advice and services that we deliver to clients. We are confident that this will further increase our
productivity and efficiency.”
Commenting on the results of the Investment Banking division, he added: “The results for the fourth
quarter 2012 improved significantly compared to the prior year quarter. We are one of the first banks
globally to have substantially adapted our business model in Investment Banking and are now generating
higher revenues and higher returns on significantly less risk-weighted assets and on a substantially
reduced expense base. Even in a year of transition with periods of difficult market conditions, our ongoing
businesses generated a normalized* return on Basel III allocated capital in our ongoing businesses of 8%
Media Release
February 7, 2013
Page 3/14
in the fourth quarter and 14% in the full year of 2012. We have created a capital-efficient Investment
Banking business that is focused on our market-leading, high-return businesses.”
Commenting on the business development in 2013 to date, he concluded: “Going into 2013, revenues
have so far been consistent with the good starts we have seen to prior years, with profitability further
benefitting from the strategic measures we took in 2012, including our strengthened capital position and
our significantly reduced risks and cost base.”
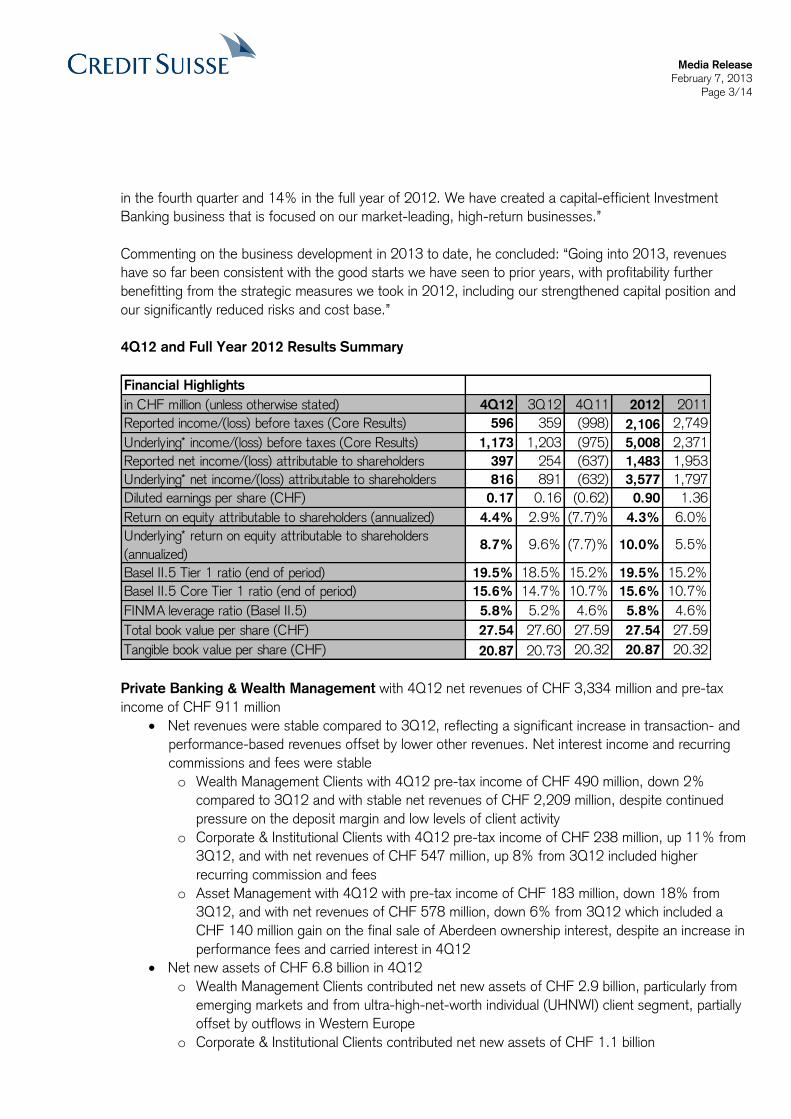
4Q12 and Full Year 2012 Results Summary
Financial Highlights
in CHF million (unless otherwise stated) 4Q12 3Q12 4Q11 2012 2011
Reported income/(loss) before taxes (Core Results) 596 359 (998) 2,106 2,749
Underlying* income/(loss) before taxes (Core Results) 1,173 1,203 (975) 5,008 2,371
Reported net income/(loss) attributable to shareholders 397 254 (637) 1,483 1,953
Underlying* net income/(loss) attributable to shareholders 816 891 (632) 3,577 1,797
Diluted earnings per share (CHF) 0.17 0.16 (0.62) 0.90 1.36
Return on equity attributable to shareholders (annualized) 4.4% 2.9% (7.7)% 4.3% 6.0%
Underlying* return on equity attributable to shareholders
(annualized)8.7% 9.6% (7.7)% 10.0% 5.5%
Basel II.5 Tier 1 ratio (end of period) 19.5% 18.5% 15.2% 19.5% 15.2%
Basel II.5 Core Tier 1 ratio (end of period) 15.6% 14.7% 10.7% 15.6% 10.7%
FINMA leverage ratio (Basel II.5) 5.8% 5.2% 4.6% 5.8% 4.6%
Total book value per share (CHF) 27.54 27.60 27.59 27.54 27.59
Tangible book value per share (CHF) 20.87 20.73 20.32 20.87 20.32
Private Banking & Wealth Management with 4Q12 net revenues of CHF 3,334 million and pre-tax
income of CHF 911 million
Net revenues were stable compared to 3Q12, reflecting a significant increase in transaction- and
performance-based revenues offset by lower other revenues. Net interest income and recurring
commissions and fees were stable
o Wealth Management Clients with 4Q12 pre-tax income of CHF 490 million, down 2%
compared to 3Q12 and with stable net revenues of CHF 2,209 million, despite continued
pressure on the deposit margin and low levels of client activity
o Corporate & Institutional Clients with 4Q12 pre-tax income of CHF 238 million, up 11% from
3Q12, and with net revenues of CHF 547 million, up 8% from 3Q12 included higher
recurring commission and fees
o Asset Management with 4Q12 with pre-tax income of CHF 183 million, down 18% from
3Q12, and with net revenues of CHF 578 million, down 6% from 3Q12 which included a
CHF 140 million gain on the final sale of Aberdeen ownership interest, despite an increase in
performance fees and carried interest in 4Q12
Net new assets of CHF 6.8 billion in 4Q12
o Wealth Management Clients contributed net new assets of CHF 2.9 billion, particularly from
emerging markets and from ultra-high-net-worth individual (UHNWI) client segment, partially
offset by outflows in Western Europe
o Corporate & Institutional Clients contributed net new assets of CHF 1.1 billion

Media Release
February 7, 2013
Page 4/14
o Asset Management contributed net new assets of CHF 2.5 billion, with inflows in credit, index
strategies and alternative investments, partially offset by outflows from fixed income products
Total operating expenses of CHF 2,355 million in 4Q12, stable from 3Q12, as lower
compensation and benefits, reflecting the efficiency measures, were offset by higher general and
administrative expenses, mainly due to investments in IT infrastructure and seasonal expenses
Achieved pre-tax income benefit of CHF 300 million for the full-year of 2012 from strategic
initiatives
Investment Banking with 4Q12 net revenues of CHF 2,664 million and pre-tax income of CHF 298
million
Net revenues were 16% lower compared to 3Q12, reflecting year-end seasonality in some
products
o Fixed income sales & trading with seasonally lower revenues of CHF 887 million, down 38%
from 3Q12, given reduced December volumes across most businesses; maintained market
leading positions in key franchises
o Equity sales & trading revenues of CHF 910 million, down 7% from 3Q12, reflecting
continued muted client activity
o Continued strong underwriting and advisory revenues of CHF 982 million, up 14% from
3Q12, driven by robust global high yield issuance volumes and completed mergers &
acquisition (M&A) activity
Total operating expenses of CHF 2,364 million, down 12% from 3Q12, with continued progress
on cost discipline; excluding certain litigation expenses of CHF 136 million recorded in 3Q12,
operating expenses were down 8%
2012 normalized* return on Basel III allocated capital for Investment Banking of 9%, compared to
a negative return in 2011; 2012 normalized* return on Basel III allocated capital in ongoing
businesses of 14%, with Fixed Income returns improved to Investment Banking division average
Further material Basel III RWA reduction in 2012, down 23% to USD 187 billion, close to year-
end 2013 target of USD 175 billion
Update on cost savings
After delivering CHF 2.0 billion of cost reductions in 2012 versus adjusted* annualized 6M11 run rate,
Credit Suisse today announced that it is increasing its 2013 cost run rate reduction target to CHF 3.2
billion and raising its total target by CHF 0.4 billion to CHF 4.4 billion by end-2015. In 4Q12, business
realignment costs of CHF 285 million were recognized in the Corporate Center. Total compensation
expenses for the full-year 2012 were down 5% compared to 2011.
Benefits of the integrated bank
In 4Q12, Credit Suisse generated CHF 1,202 million in collaboration revenues from the integrated bank.
This corresponds to 21.0% of the Group’s net revenues in 4Q12, exceeding our key performance
indicator (KPI) target of 18%-20% of net revenues.

Media Release
February 7, 2013
Page 5/14
Capital and funding
In July 2012, Credit Suisse announced a number of measures to strengthen its capital by CHF 15.3 billion
in light of the current regulatory and market environment.
As of the end of 4Q12, Credit Suisse’s Look-through Swiss Core Capital ratio on a pro forma basis stands
at 9.4%, assuming the completion of the remaining measures that were announced in July 2012. The
year-end 2012 reported Look-through Swiss Core Capital ratio stands at 9.1%. Credit Suisse is confident
it will exceed the Swiss end-2018 requirement of 10% in mid-2013. The additional strategic divestments
and remaining measures that were part of the capital plan are on track to be completed in the near term.
In January 2013 we announced the sale of the exchange-traded funds business and expect completion of
the sale by the end of 2Q13.
As of the end of 4Q12, Credit Suisse reported a Basel II.5 core tier 1 ratio of 15.6% and a Basel II.5 tier
1 ratio of 19.5%, up 0.9 and 1.0 percentage points from 3Q12 respectively. As of the end of 4Q12,
Credit Suisse reported a Basel II.5 total capital ratio of 22.3%, up 1.1 percentage points from 3Q12.
Credit Suisse in October 2012 announced targeted measures to reduce total balance sheet assets by
13% to below CHF 900 billion by end-2013 on a foreign-exchange neutral basis. As of the end of 2012,
the total balance sheet assets amounted to CHF 924 billion, down CHF 99 billion or 10% from 3Q12. As
of the end of 4Q12, Credit Suisse’s FINMA leverage ratio stood at 5.8%, up from 5.2% in 3Q12.
Credit Suisse is continuing to conservatively manage its liquidity, with an estimated long-term net stable
funding ratio in excess of 100% under the current FINMA framework and short-term liquidity under Swiss
regulation in excess of requirement as of the end of 4Q12.
Proposed distribution out of reserves from capital contributions**
At the Annual General Meeting on April 26, 2013, the Board of Directors will propose for the financial year
2012 a distribution of CHF 0.10 per share in cash out of reserves from capital contributions. In addition,
the Board of Directors will propose the distribution of new shares (stock dividend). The new shares for the
stock dividend will be paid in at the par value of CHF 0.04 per share out of reserves from capital
contributions. The distribution out of reserves from capital contributions (cash and stock) will be free of
Swiss withholding tax and will not be subject to income tax for Swiss resident individuals holding the
shares as a private investment. The ex-dividend date has been set to April 30, 2013 (for cash distribution
and stock dividend).
The stock dividend will be distributed to all shareholders as follows: for every share that they own,
shareholders will receive a non-tradable right to the receipt of a given number of new shares for free.
Following distribution, the rights will automatically be exchanged for new shares at the ratio determined by
the Board of Directors immediately prior to the Annual General Meeting. The Board of Directors will set
the subscription ratio in such a way that the theoretical value of each right will be approximately CHF 0.65.
The proposed distribution is in line with Credit Suisse Group’s capital plan as announced in July 2012. The
implementation of this plan is on track and progressing to allow for significant cash distributions after the
Look-through Swiss Core Capital ratio of 10% is reached. We target to reach this ratio in the middle of
2013.
Media Release
February 7, 2013
Page 6/14
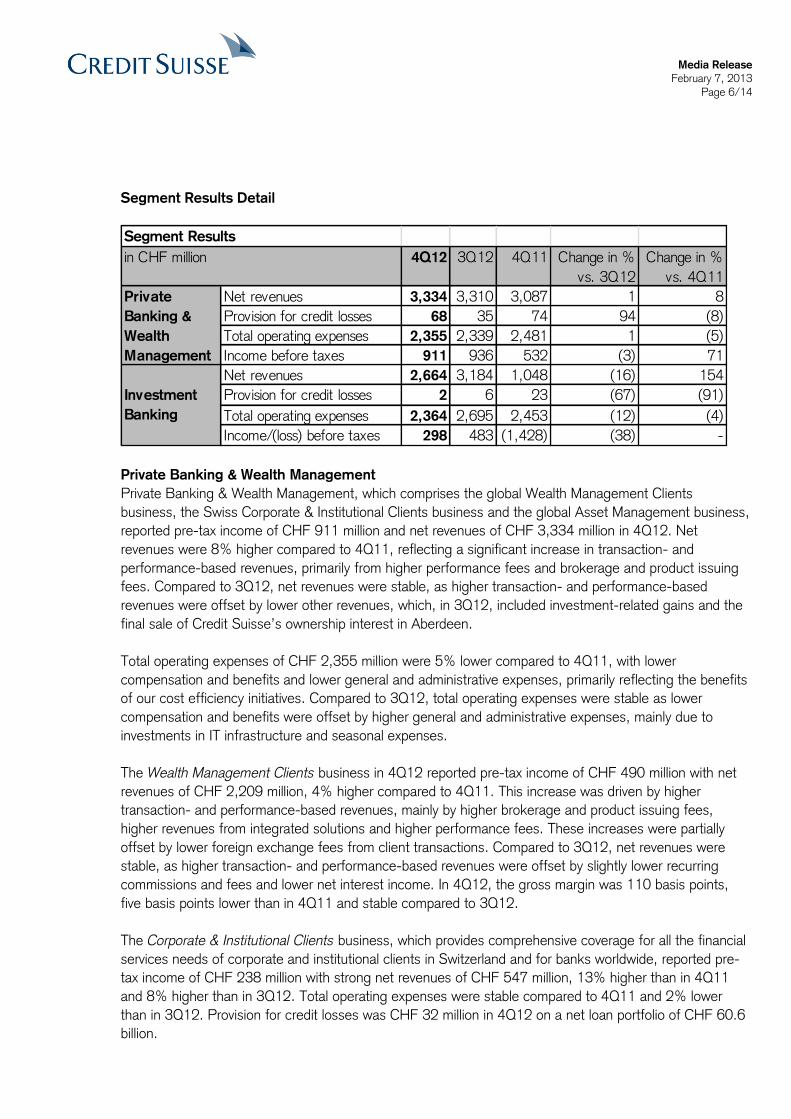
Segment Results Detail
Segment Results
in CHF million 4Q12 3Q12 4Q11 Change in % Change in %
vs. 3Q12 vs. 4Q11
Net revenues 3,334 3,310 3,087 1 8
Provision for credit losses 68 35 74 94 (8)
Total operating expenses 2,355 2,339 2,481 1 (5)
Income before taxes 911 936 532 (3) 71
Net revenues 2,664 3,184 1,048 (16) 154
Provision for credit losses 2 6 23 (67) (91)
Total operating expenses 2,364 2,695 2,453 (12) (4)
Income/(loss) before taxes 298 483 (1,428) (38) -
Private
Banking &
Wealth
Management
Investment
Banking
Private Banking & Wealth Management
Private Banking & Wealth Management, which comprises the global Wealth Management Clients
business, the Swiss Corporate & Institutional Clients business and the global Asset Management business,
reported pre-tax income of CHF 911 million and net revenues of CHF 3,334 million in 4Q12. Net
revenues were 8% higher compared to 4Q11, reflecting a significant increase in transaction- and
performance-based revenues, primarily from higher performance fees and brokerage and product issuing
fees. Compared to 3Q12, net revenues were stable, as higher transaction- and performance-based
revenues were offset by lower other revenues, which, in 3Q12, included investment-related gains and the
final sale of Credit Suisse’s ownership interest in Aberdeen.
Total operating expenses of CHF 2,355 million were 5% lower compared to 4Q11, with lower
compensation and benefits and lower general and administrative expenses, primarily reflecting the benefits
of our cost efficiency initiatives. Compared to 3Q12, total operating expenses were stable as lower
compensation and benefits were offset by higher general and administrative expenses, mainly due to
investments in IT infrastructure and seasonal expenses.
The Wealth Management Clients business in 4Q12 reported pre-tax income of CHF 490 million with net
revenues of CHF 2,209 million, 4% higher compared to 4Q11. This increase was driven by higher
transaction- and performance-based revenues, mainly by higher brokerage and product issuing fees,
higher revenues from integrated solutions and higher performance fees. These increases were partially
offset by lower foreign exchange fees from client transactions. Compared to 3Q12, net revenues were
stable, as higher transaction- and performance-based revenues were offset by slightly lower recurring
commissions and fees and lower net interest income. In 4Q12, the gross margin was 110 basis points,
five basis points lower than in 4Q11 and stable compared to 3Q12.
The Corporate & Institutional Clients business, which provides comprehensive coverage for all the financial
services needs of corporate and institutional clients in Switzerland and for banks worldwide, reported pre-
tax income of CHF 238 million with strong net revenues of CHF 547 million, 13% higher than in 4Q11
and 8% higher than in 3Q12. Total operating expenses were stable compared to 4Q11 and 2% lower
than in 3Q12. Provision for credit losses was CHF 32 million in 4Q12 on a net loan portfolio of CHF 60.6
billion.

Media Release
February 7, 2013
Page 7/14
The Asset Management business reported pre-tax income of CHF 183 million with net revenues of CHF
578 million in 4Q12, 20% higher than in 4Q11, driven by higher fee-based revenues, reflecting higher
performance fees and carried interest from realized private equity gains, partially offset by investment-
related losses. 4Q12 net revenues were 6% lower than in 3Q12, as higher fee-based revenues were
more than offset by the investment-related losses and lower equity participations and other gains.
Investment Banking
Investment Banking reported net revenues of CHF 2,664 million and pre-tax income of CHF 298 million in
4Q12. Net revenues were significantly higher compared to 4Q11, due to higher revenues in all
businesses, with substantial improvement in fixed income sales and trading, reflecting the repositioned
franchise. Compared to 3Q12, net revenues were 16% lower, driven by seasonally lower results mainly in
fixed income sales and trading. In 4Q12, the repositioned fixed income business continued to deliver more
balanced and consistent results with less volatility on materially lower risk-weighted asset levels.
Fixed income sales and trading revenues of CHF 887 million were significantly higher compared to 4Q11,
led by substantial increases in securitized products and higher results in corporate lending, global credit
products and emerging markets. Compared to a strong 3Q12, revenues declined 38% driven by
seasonally lower results across most fixed income businesses, including securitized products and global
credit products, due to weaker volumes in the quarter.
Equity sales and trading revenues of CHF 910 million were 24% higher relative to 4Q11, reflecting
increases in derivatives and cash equities. Revenues were 7% lower relative to 3Q12, as declines in fund-
linked products and equities arbitrage trading more than offset higher revenues from cash equities, prime
services and derivatives.
Underwriting and advisory revenues of CHF 982 million were 93% higher compared to 4Q11, driven by
strong debt underwriting revenues due to robust global high yield issuance volumes. M&A and advisory
revenues were also higher as increased global industry-wide completed M&A activity offset market share
declines. Revenues were 14% higher compared to 3Q12, driven by higher revenues in debt underwriting,
particularly in leveraged finance, and M&A fees.
Compensation and benefits decreased by CHF 148 million, or 11%, compared to 4Q11, primarily driven
by decreases in deferred compensation from prior-year awards. Compensation and benefits decreased by
CHF 305 million, or 21%, from 3Q12, reflecting lower discretionary performance-related compensation
expense and lower deferred compensation from prior-year awards. Total other operating expenses
increased 5% compared to 4Q11 due mainly to higher litigation provisions, but decreased 2% relative to
3Q12, primarily driven by a decrease in litigation provisions.
Corporate Center
The Corporate Center recorded a loss before taxes of CHF 613 million in 4Q12, including fair value
charges on own debt of CHF 197 million, fair value charges on stand-alone derivatives of CHF 59 million
and debit valuation adjustments losses on certain structured note liabilities of CHF 120 million, resulting in
overall losses on such items of CHF 376 million in the quarter. This compares to a loss before taxes of
CHF 102 million in 4Q11 and a loss before taxes of CHF 1,060 million in 3Q12.
Media Release
February 7, 2013
Page 8/14
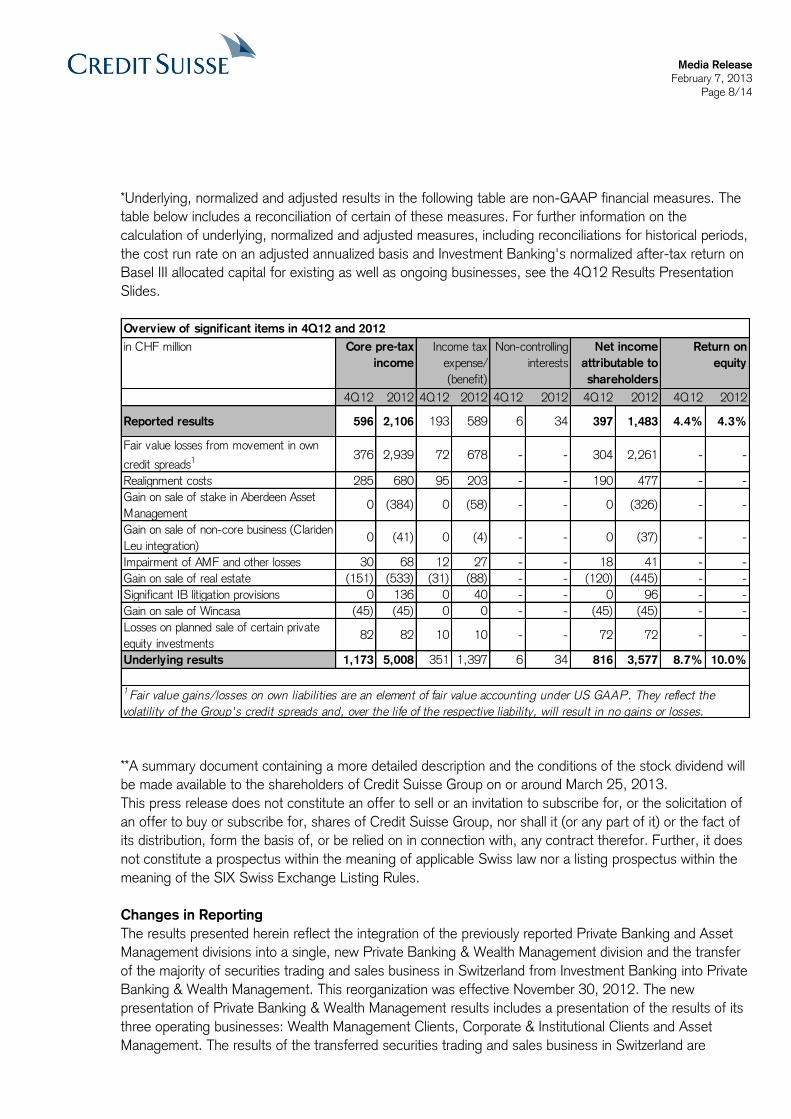
*Underlying, normalized and adjusted results in the following table are non-GAAP financial measures. The
table below includes a reconciliation of certain of these measures. For further information on the
calculation of underlying, normalized and adjusted measures, including reconciliations for historical periods,
the cost run rate on an adjusted annualized basis and Investment Banking's normalized after-tax return on
Basel III allocated capital for existing as well as ongoing businesses, see the 4Q12 Results Presentation
Slides.
in CHF million
4Q12 2012 4Q12 2012 4Q12 2012 4Q12 2012 4Q12 2012
Reported results 596 2,106 193 589 6 34 397 1,483 4.4% 4.3%
Fair value losses from movement in own
credit spreads1 376 2,939 72 678 - - 304 2,261 - -
Realignment costs 285 680 95 203 - - 190 477 - -
Gain on sale of stake in Aberdeen Asset
Management0 (384) 0 (58) - - 0 (326) - -
Gain on sale of non-core business (Clariden
Leu integration)0 (41) 0 (4) - - 0 (37) - -
Impairment of AMF and other losses 30 68 12 27 - - 18 41 - -
Gain on sale of real estate (151) (533) (31) (88) - - (120) (445) - -
Significant IB litigation provisions 0 136 0 40 - - 0 96 - -
Gain on sale of Wincasa (45) (45) 0 0 - - (45) (45) - -
Losses on planned sale of certain private
equity investments82 82 10 10 - - 72 72 - -
Underlying results 1,173 5,008 351 1,397 6 34 816 3,577 8.7% 10.0%
1 Fair value gains/losses on own liabilities are an element of fair value accounting under US GAAP. They reflect the
volatility of the Group's credit spreads and, over the life of the respective liability, will result in no gains or losses.
Overview of significant items in 4Q12 and 2012
Core pre-tax
income
Income tax
expense/
(benefit)
Non-controlling
interests
Net income
attributable to
shareholders
Return on
equity
**A summary document containing a more detailed description and the conditions of the stock dividend will
be made available to the shareholders of Credit Suisse Group on or around March 25, 2013.
This press release does not constitute an offer to sell or an invitation to subscribe for, or the solicitation of
an offer to buy or subscribe for, shares of Credit Suisse Group, nor shall it (or any part of it) or the fact of
its distribution, form the basis of, or be relied on in connection with, any contract therefor. Further, it does
not constitute a prospectus within the meaning of applicable Swiss law nor a listing prospectus within the
meaning of the SIX Swiss Exchange Listing Rules.
Changes in Reporting
The results presented herein reflect the integration of the previously reported Private Banking and Asset
Management divisions into a single, new Private Banking & Wealth Management division and the transfer
of the majority of securities trading and sales business in Switzerland from Investment Banking into Private
Banking & Wealth Management. This reorganization was effective November 30, 2012. The new
presentation of Private Banking & Wealth Management results includes a presentation of the results of its
three operating businesses: Wealth Management Clients, Corporate & Institutional Clients and Asset
Management. The results of the transferred securities trading and sales business in Switzerland are
Media Release
February 7, 2013
Page 9/14
allocated among the three operating businesses. Prior periods have been restated to conform to the
current presentation.
4Q12 Financial Release
The 4Q12 Financial Release and the related Results Presentation Slides are available for download from
06:30 CET today.
The Financial Release is available for download at:
https://www.credit-suisse.com/investors/doc/csg_financialreport_4q12.pdf
Hard copies of the Financial Release can be ordered free of charge at:
https://publications.credit-
suisse.com/app/shop/index.cfm?fuseAction=OpenShopCategory&coid=219303&lang=EN
The Results Presentation Slides are available for download at:
https://www.credit-suisse.com/investors/doc/4q12_slides.pdf
Information
Media Relations Credit Suisse AG, telephone +41 844 33 88 44, [email protected]
Investor Relations Credit Suisse AG, telephone +41 44 333 71 49, [email protected]
Credit Suisse AG
Credit Suisse AG is one of the world's leading financial services providers and is part of the Credit Suisse group of companies (referred to here
as 'Credit Suisse'). As an integrated bank, Credit Suisse offers clients its combined expertise in the areas of private banking, investment banking and asset management. Credit Suisse provides advisory services, comprehensive solutions and innovative products to companies, institutional clients and high-net-worth private clients globally, as well as to retail clients in Switzerland. Credit Suisse is headquartered in Zurich
and operates in over 50 countries worldwide. The group employs approximately 47,400 people. The registered shares (CSGN) of Credit Suisse's parent company, Credit Suisse Group AG, are listed in Switzerland and, in the form of American Depositary Shares (CS), in New York. Further information about Credit Suisse can be found at www.credit-suisse.com.
Cautionary statement regarding forward-looking information \Non-GAAP information
This press release contains statements that constitute forward-looking statements within the meaning of the Private Securities Litigation Reform Act of 1995. In addition, in the future we, and others on our behalf, may make statements that constitute forward-looking statements. Such forward-looking statements may include, without limitation, statements relating to the following:
– our plans, objectives or goals; – our future economic performance or prospects; – the potential effect on our future performance of certain contingencies; and
– assumptions underlying any such statements. Words such as “believes,” “anticipates,” “expects,” “intends” and “plans” and similar expressions are intended to identify forward-looking statements but are not the exclusive means of identifying such statements. We do not intend to update these forward-looking statements
except as may be required by applicable securities laws. By their very nature, forward-looking statements involve inherent risks and uncertainties, both general and specific, and risks exist that predictions, forecasts, projections and other outcomes described or implied in
forward-looking statements will not be achieved. We caution you that a number of important factors could cause results to differ materially from the plans, objectives, expectations, estimates and intentions expressed in such forward-looking statements. These factors include: – the ability to maintain sufficient liquidity and access capital markets;
– market and interest rate fluctuations and interest rate levels; – the strength of the global economy in general and the strength of the economies of the countries in which we conduct our operations,
in particular the risk of continued slow economic recovery or downturn in the US or other developed countries in 2013 and beyond;
– the direct and indirect impacts of continuing deterioration or slow recovery in residential and commercial real estate markets; – adverse rating actions by credit rating agencies in respect of sovereign issuers, structured credit products or other credit-related
exposures;
– the ability to achieve our strategic objectives, including improved performance, reduced risks, lower costs, and more efficient use of capital;
– the ability of counterparties to meet their obligations to us;
– the effects of, and changes in, fiscal, monetary, trade and tax policies, and currency fluctuations; – political and social developments, including war, civil unrest or terrorist activity;

Media Release
February 7, 2013
Page 10/14
– the possibility of foreign exchange controls, expropriation, nationalization or confiscation of assets in countries in which we conduct our operations;
– operational factors such as systems failure, human error, or the failure to implement procedures properly;
– actions taken by regulators with respect to our business and practices in one or more of the countries in which we conduct our operations;
– the effects of changes in laws, regulations or accounting policies or practices;
– competition in geographic and business areas in which we conduct our operations; – the ability to retain and recruit qualified personnel; – the ability to maintain our reputation and promote our brand;
– the ability to increase market share and control expenses; – technological changes; – the timely development and acceptance of our new products and services and the perceived overall value of these products and
services by users;
– acquisitions, including the ability to integrate acquired businesses successfully, and divestitures, including the ability to sell non-core assets;
– the adverse resolution of litigation and other contingencies; – the ability to achieve our cost efficiency goals and cost targets; and
– our success at managing the risks involved in the foregoing. We caution you that the foregoing list of important factors is not exclusive. When evaluating forward-looking statements, you should carefully
consider the foregoing factors and other uncertainties and events, as well as the information set forth in our Annual Report 2011 under “Risk factors” in the Appendix. This press release contains non-GAAP financial information. Information needed to reconcile such non-GAAP financial information to the most
directly comparable measures under GAAP can be found in the 4Q12 Credit Suisse Financial Release and the 4Q12 Results Presentation Slides.
Capital and liquidity disclosures
As of January 1, 2013, Basel III was implemented in Switzerland, including through the “Too Big to Fail” legislation and regulators thereunder. Our related disclosures are in accordance with the current interpretation of such requirements, including relevant assumptions. We have calculated our 4Q12 pro forma Look-through Swiss Core Capital assuming the successful completion of the remaining CHF 0.8 billion of capital
measures we announced in July 2012, on a foreign exchange neutral basis. In addition, we have calculated our Basel III net stable funding ratio (NSFR) based on the current FINMA framework. Changes in the final implementation of the Basel III framework in Switzerland or any of our assumptions or estimates could result in different numbers from those shown herein.
Media Release
February 7, 2013
Page 11/14
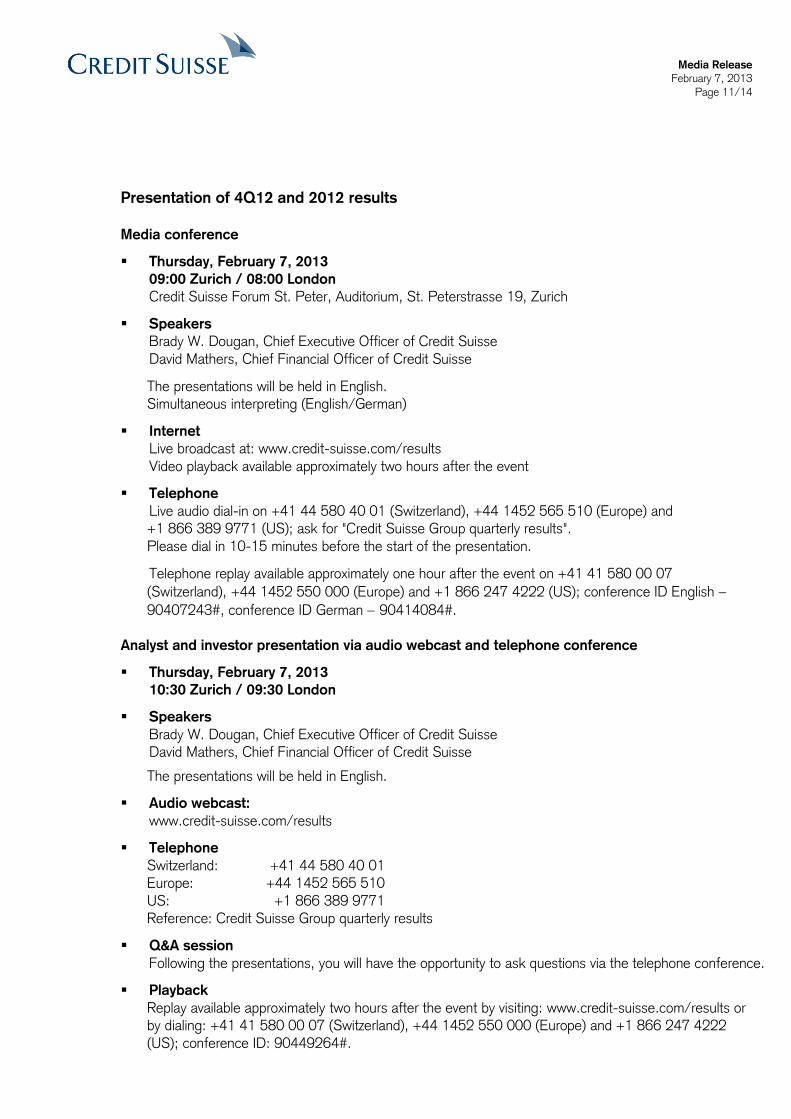
Presentation of 4Q12 and 2012 results
Media conference
Thursday, February 7, 2013
09:00 Zurich / 08:00 London
Credit Suisse Forum St. Peter, Auditorium, St. Peterstrasse 19, Zurich
Speakers
Brady W. Dougan, Chief Executive Officer of Credit Suisse
David Mathers, Chief Financial Officer of Credit Suisse
The presentations will be held in English. Simultaneous interpreting (English/German)
Internet
Live broadcast at: www.credit-suisse.com/results
Video playback available approximately two hours after the event
Telephone
Live audio dial-in on +41 44 580 40 01 (Switzerland), +44 1452 565 510 (Europe) and +1 866 389 9771 (US); ask for "Credit Suisse Group quarterly results".
Please dial in 10-15 minutes before the start of the presentation.
Telephone replay available approximately one hour after the event on +41 41 580 00 07
(Switzerland), +44 1452 550 000 (Europe) and +1 866 247 4222 (US); conference ID English
90407243#, conference ID German 90414084#.
Analyst and investor presentation via audio webcast and telephone conference
Thursday, February 7, 2013
10:30 Zurich / 09:30 London
Speakers
Brady W. Dougan, Chief Executive Officer of Credit Suisse David Mathers, Chief Financial Officer of Credit Suisse
The presentations will be held in English.
Audio webcast:
www.credit-suisse.com/results
Telephone
Switzerland: +41 44 580 40 01 Europe: +44 1452 565 510
US: +1 866 389 9771 Reference: Credit Suisse Group quarterly results
Q&A session
Following the presentations, you will have the opportunity to ask questions via the telephone conference.
Playback
Replay available approximately two hours after the event by visiting: www.credit-suisse.com/results or by dialing: +41 41 580 00 07 (Switzerland), +44 1452 550 000 (Europe) and +1 866 247 4222
(US); conference ID: 90449264#.
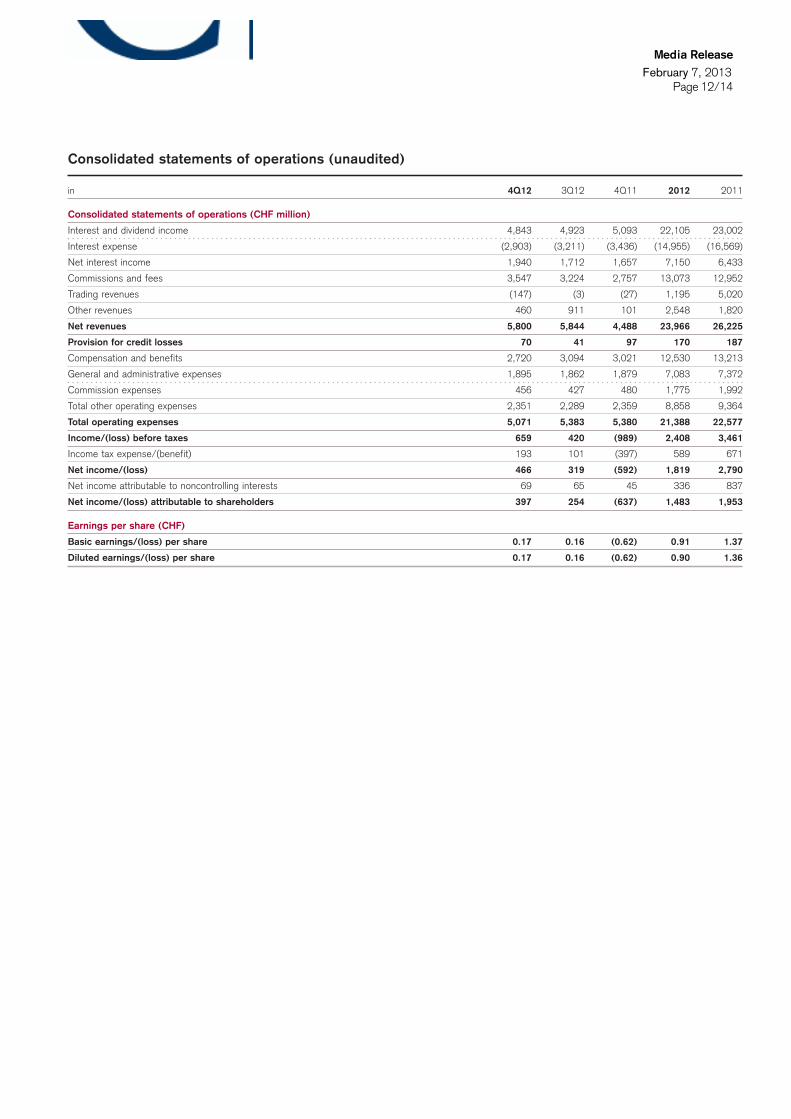
Consolidated statements of operations (unaudited)
in 4Q12 3Q12 4Q11 2012 2011
Consolidated statements of operations (CHF million)
Interest and dividend income 4,843 4,923 5,093 22,105 23,002
Interest expense (2,903) (3,211) (3,436) (14,955) (16,569)
Net interest income 1,940 1,712 1,657 7,150 6,433
Commissions and fees 3,547 3,224 2,757 13,073 12,952
Trading revenues (147) (3) (27) 1,195 5,020
Other revenues 460 911 101 2,548 1,820
Net revenues 5,800 5,844 4,488 23,966 26,225
Provision for credit losses 70 41 97 170 187
Compensation and benefits 2,720 3,094 3,021 12,530 13,213
General and administrative expenses 1,895 1,862 1,879 7,083 7,372
Commission expenses 456 427 480 1,775 1,992
Total other operating expenses 2,351 2,289 2,359 8,858 9,364
Total operating expenses 5,071 5,383 5,380 21,388 22,577
Income/(loss) before taxes 659 420 (989) 2,408 3,461
Income tax expense/(benefit) 193 101 (397) 589 671
Net income/(loss) 466 319 (592) 1,819 2,790
Net income attributable to noncontrolling interests 69 65 45 336 837
Net income/(loss) attributable to shareholders 397 254 (637) 1,483 1,953
Earnings per share (CHF)
Basic earnings/(loss) per share 0.17 0.16 (0.62) 0.91 1.37
Diluted earnings/(loss) per share 0.17 0.16 (0.62) 0.90 1.36
Media Release
Page 12/14 February 7, 2013
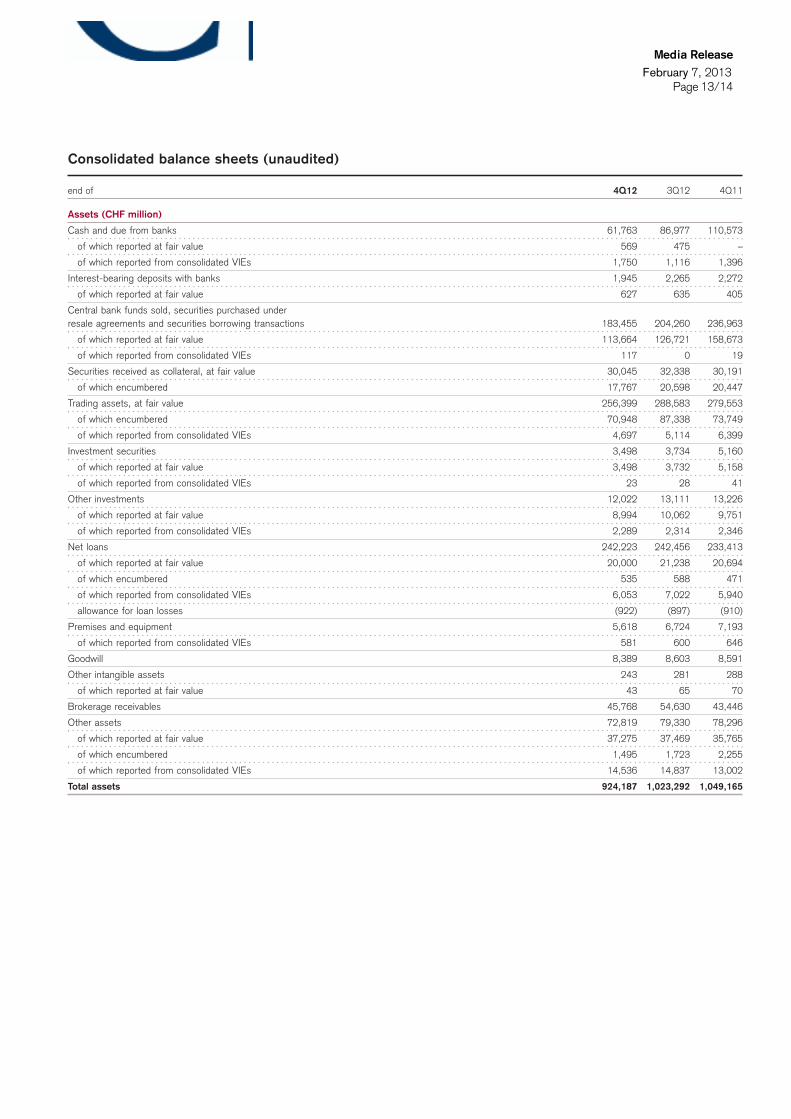
Consolidated balance sheets (unaudited)
end of 4Q12 3Q12 4Q11
Assets (CHF million)
Cash and due from banks 61,763 86,977 110,573
of which reported at fair value 569 475 –
of which reported from consolidated VIEs 1,750 1,116 1,396
Interest-bearing deposits with banks 1,945 2,265 2,272
of which reported at fair value 627 635 405
Central bank funds sold, securities purchased underresale agreements and securities borrowing transactions 183,455 204,260 236,963
of which reported at fair value 113,664 126,721 158,673
of which reported from consolidated VIEs 117 0 19
Securities received as collateral, at fair value 30,045 32,338 30,191
of which encumbered 17,767 20,598 20,447
Trading assets, at fair value 256,399 288,583 279,553
of which encumbered 70,948 87,338 73,749
of which reported from consolidated VIEs 4,697 5,114 6,399
Investment securities 3,498 3,734 5,160
of which reported at fair value 3,498 3,732 5,158
of which reported from consolidated VIEs 23 28 41
Other investments 12,022 13,111 13,226
of which reported at fair value 8,994 10,062 9,751
of which reported from consolidated VIEs 2,289 2,314 2,346
Net loans 242,223 242,456 233,413
of which reported at fair value 20,000 21,238 20,694
of which encumbered 535 588 471
of which reported from consolidated VIEs 6,053 7,022 5,940
allowance for loan losses (922) (897) (910)
Premises and equipment 5,618 6,724 7,193
of which reported from consolidated VIEs 581 600 646
Goodwill 8,389 8,603 8,591
Other intangible assets 243 281 288
of which reported at fair value 43 65 70
Brokerage receivables 45,768 54,630 43,446
Other assets 72,819 79,330 78,296
of which reported at fair value 37,275 37,469 35,765
of which encumbered 1,495 1,723 2,255
of which reported from consolidated VIEs 14,536 14,837 13,002
Total assets 924,187 1,023,292 1,049,165
Media Release
Page 13/14 February 7, 2013
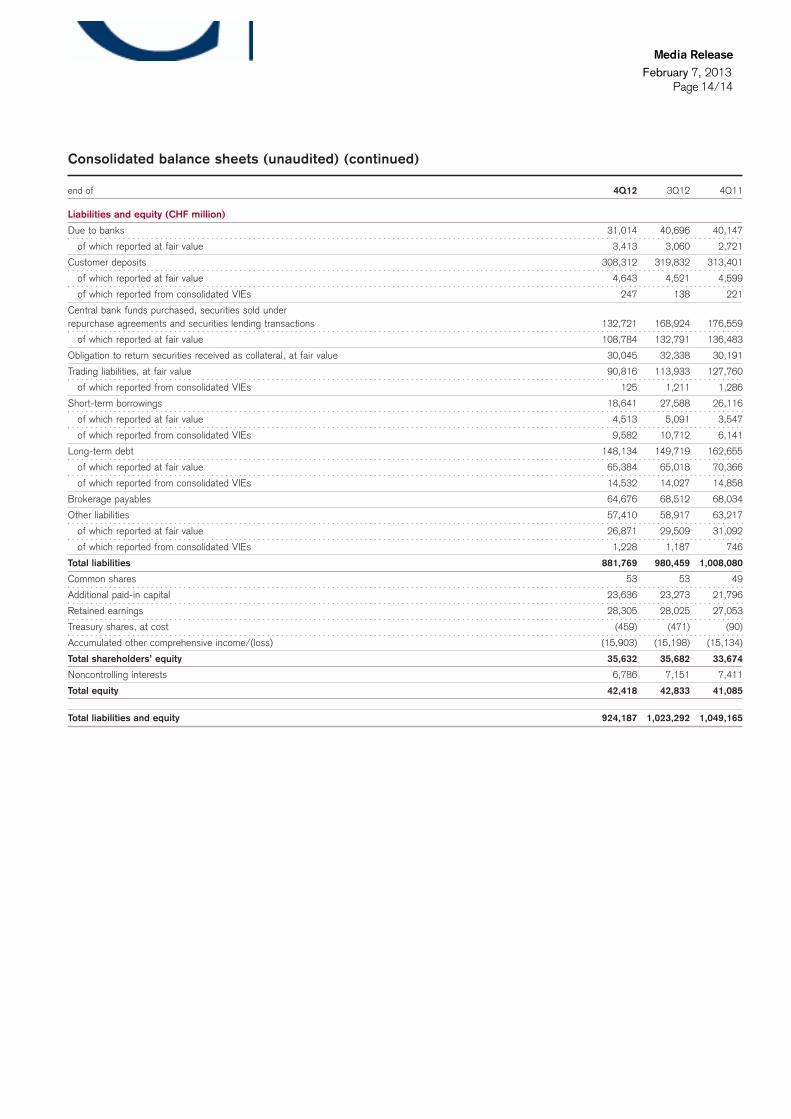
Consolidated balance sheets (unaudited) (continued)
end of 4Q12 3Q12 4Q11
Liabilities and equity (CHF million)
Due to banks 31,014 40,696 40,147
of which reported at fair value 3,413 3,060 2,721
Customer deposits 308,312 319,832 313,401
of which reported at fair value 4,643 4,521 4,599
of which reported from consolidated VIEs 247 138 221
Central bank funds purchased, securities sold underrepurchase agreements and securities lending transactions 132,721 168,924 176,559
of which reported at fair value 108,784 132,791 136,483
Obligation to return securities received as collateral, at fair value 30,045 32,338 30,191
Trading liabilities, at fair value 90,816 113,933 127,760
of which reported from consolidated VIEs 125 1,211 1,286
Short-term borrowings 18,641 27,588 26,116
of which reported at fair value 4,513 5,091 3,547
of which reported from consolidated VIEs 9,582 10,712 6,141
Long-term debt 148,134 149,719 162,655
of which reported at fair value 65,384 65,018 70,366
of which reported from consolidated VIEs 14,532 14,027 14,858
Brokerage payables 64,676 68,512 68,034
Other liabilities 57,410 58,917 63,217
of which reported at fair value 26,871 29,509 31,092
of which reported from consolidated VIEs 1,228 1,187 746
Total liabilities 881,769 980,459 1,008,080
Common shares 53 53 49
Additional paid-in capital 23,636 23,273 21,796
Retained earnings 28,305 28,025 27,053
Treasury shares, at cost (459) (471) (90)
Accumulated other comprehensive income/(loss) (15,903) (15,198) (15,134)
Total shareholders’ equity 35,632 35,682 33,674
Noncontrolling interests 6,786 7,151 7,411
Total equity 42,418 42,833 41,085
Total liabilities and equity 924,187 1,023,292 1,049,165
Media Release
Page 14/14 February 7, 2013