credit spreads in the market for highly leveraged ...pages.stern.nyu.edu/~jmei/credit.pdf · credit...
TRANSCRIPT

Credit spreads in the market for highly
leveraged transaction loans
Lazarus A. Angbazo a,1, Jianping Mei b, Anthony Saunders c,*
a Department of Finance, Purdue University, USAb Department of Finance, New York University, USA
c Leonard Stern School of Business, Salomon Brothers Center, New York University, 44 West 4th
Street, New York, NY 10012, USA
Abstract
This paper is an empirical exploration of the determinants of the required credit
spreads on highly leveraged transaction (HLT) loans. The analysis uses a multi-factor
spread model to estimate the movement of loan spreads relative to spreads required in
the (competing) corporate bond market as well as the signi®cance of loan-speci®c
characteristics in determining loan spreads. The empirical estimates are based on the
Loan Pricing Corporation's database which consists of over 4000 loan transactions
between 1987 and 1994. We ®nd a positive HLT loan spread sensitivity to changes in
spreads in the corporate bond market, but this sensitivity is signi®cantly less than unity;
indicating that the HLT loan market and high yield public debt market are not fully
integrated. Furthermore, there is evidence that lenders augment, rather than substitute,
loan yield spreads with additional fees for syndication, commitment and cancellation
risks. In general syndicated loans have lower yield spreads than other HLT loan
types. Ó 1998 Published by Elsevier Science B.V. All rights reserved.
JEL classi®cation: G21
Keywords: Loans; Debt; Yield spread; Leverage; High-yield bands
Journal of Banking & Finance 22 (1998) 1249±1282
* Corresponding author. Tel.: +1 212 998 0711; fax: +1 212 995 4220; e-mail: asaun-
[email protected] Chase Manhattan Bank. This paper was completed while this author was on the ®nance faculty
at Purdue University.
0378-4266/98/$ ± see front matter Ó 1998 Published by Elsevier Science B.V. All rights reserved.
PII: S 0 3 7 8 - 4 2 6 6 ( 9 8 ) 0 0 0 6 5 - X

1. Introduction
The objective of this paper is to examine the determinants of credit riskspreads on loans. Although there are a number of theoretical models of creditspread determinants the empirical literature is sparse. 2 This is largely due tothe fact that information on loan spreads (or bank private debt) has not beenpublicly available until recently. In this paper we employ the Loan PricingCorporation's (LPC) database on highly leveraged loans (HLT) to examine thefactors that impact the required spreads on these loans.
Economic theory suggests that if ®nancial markets are e�cient, comparableforms of ®nancing will be priced to re¯ect the law of one price, adjusted forrisk, transaction costs and embedded options. Rational borrowers will not paya higher rate than is available on a substitutable form of ®nancing. Similarly,rational investors will be unwilling to accept di�erent risk-adjusted returnsfrom similar investments.
Interestingly, one aspect of the pricing of HLT loans is that there appears tobe a persistent spread between the yields in the HLT loan market and the highyield bond market (see Fridson, 1995). Price di�erences or spreads will exist tothe extent that they re¯ect market imperfections. One imperfection is the dif-ference in borrower/investor access to the loan market compared to the bondmarket caused by regulatory and institutional barriers. The di�culties ofbringing to the market high yield bond o�erings of a size of less than $100million implies that the bond market has a barrier to entry which may be re-¯ected in price disparities in the loan and bond markets. Furthermore, regu-latory restrictions on commercial banks, insurance companies, and thriftinvestments in below-investment grade corporate bonds as well as maturityconstraints that preclude bond purchases by prime rate funds, exemplify bar-riers to access on the investor side. These constraints could a�ect the liquidityof the below-investment grade bond market, increasing price di�erences acrossloan and bond markets.
This paper explores the determinants of the ex ante credit spreads on HLTloans by estimating the systematic movements in loan spreads, relative to thespreads required in the ``competing''corporate bond market. The objective is todetermine the degree of divergence between HLT loan and bond yield spreads.We use the yields on (i) investment grade corporate bonds rated Baa byMoody's and (ii) Merrill Lynch's All-High-Yield Bond index yield to test thedegree of market divergence. The results show a loan yield spread sensitivitytowards changes in spreads in the corporate Baa bond market and the highyield (``junk'') bond market that while positive, is signi®cantly less than unity,
2 See Fisher (1959), Boardman and McEnally (1981), Roberts and Viscione (1984), and Saunders
(1997, Ch. 10), for a review.
1250 L.A. Angbazo et al. / Journal of Banking & Finance 22 (1998) 1249±1282

indicating that the HLT loan spreads do not move in direct tandem withspreads of either the corporate Baa bonds or junk bonds. Nevertheless, thesedata also show that there is greater degree of HLT loan pricing convergencewith the corporate Baa bond market than with the junk bond market.
The paper also estimates the impact of loan speci®c characteristics onHLT loan spreads based on a multi-factor model. Speci®cally, the divergencein loan-bond yield spreads may be tied to various characteristics or factorsincluding the loan amount, use of loan proceeds, maturity, collateralization,syndication and type of loan. In addition, borrower characteristics such assize and the ex ante credit rating of the borrower as well as the role of theoriginating bank may all in¯uence the pricing of new-issue loans and thepricing discrepancy observed relative to the competing corporate bondmarket.
The paper is organized as follows: In Section 2, we examine the basiccharacteristics of the HLT market. In Section 3, we discuss the sample. InSection 4, a credit spread model is speci®ed. Section 5 reports the empiricalresults and Section 6 concludes.
2. Institutional characteristics of HLT loans
The development of the market for HLT loans can be traced to the growthover the past decade in commercial lending transactions to ®nance mergers andacquisitions, leveraged buyouts, and related transactions. One measure of thegrowth in HLTs is that between January 1987 and September 1994, LPC re-ported that there were 4122 deals, with a combined dollar amount (in new-issueloans) estimated at $593.5 billion.
While HLTs are now a signi®cant portion of outstanding commercialcredits, the nature of these loans, the market participants (including borrowers,originating banks and participating investors), and the interest and fee struc-tures are not well documented.
2.1. HLT criteria
The criteria for classi®cation of a loan as an HLT were in dispute prior toOctober 1989, when highly-leverage-transaction guidelines were laid out by theO�ce of the Comptroller of Currency, the Federal Reserve Board, and theFederal Deposit Insurance Corporation (1989, 1990). These criteria de®nedHLT loans as:· all loan ®nancings used for buyouts, acquisitions, recapitalizations;· all loan ®nancings which: (i) double the borrower's liabilities and result in a
leverage ratio (total liabilities/total assets) higher than 50%; or (ii) increasethe leverage ratio higher than 75%;
L.A. Angbazo et al. / Journal of Banking & Finance 22 (1998) 1249±1282 1251

· all loan ®nancings that are designated as an HLT by the syndication agent;· all loan ®nancing to subsidiaries of HLT companies, even if the subsidiary
does not meet the HLT de®nitions above.The underlying regulatory guidelines exclude debtor-in-possession ®nancing
for businesses in Chapter 11 bankruptcy reorganization. Furthermore, someloans are excluded if they meet certain performance criteria, even if the bor-rower's leverage ratio continues to exceed 75%.
Due to a review prompted by the recession and a perceived credit crunchduring 1991±1992, bank regulators (i.e., the Federal Reserve, the FDIC, andthe Comptroller of Currency) phased out the requirement that banks disclosethe total amount of loans to highly leveraged companies in their ®nancialstatements as of 30 June 1992. This decision re¯ected regulators' ®ndings thatlarge banks were not overexposed to HLTs and that they posed little threat toeither the bank insurance fund or bank capital reserves. There was also a desireto prevent bank examinations from impeding the availability of credit toborrowers. However, the Securities and Exchange Commission (SEC) has re-quired the continuation of HLT loan exposure disclosures. 3 Given that theLPC database is constructed from loan information ®led with the SEC, thesample re¯ects the HLT designation required by the SEC which is identical tothe reporting requirements of bank regulators.
2.2. HLT loan features
High-leverage-transaction loans have traditionally being originated bybanks and syndicated to other banks in the secondary market for loans.However, in recent years, these loans have become attractive to a larger class ofinvestors. The high ex ante interest rates associated with these loans are onlyone reason for their increased attractiveness, especially, compared to high yield(``junk'') bonds. 4 In Table 1 the key features of HLT loans relative to junkbonds are summarized. In general, HLT loans have a senior priority positionover subordinated bondholders with respect to repayment of interest andprincipal. Because of their senior position in the capital structure, borrowersusually repay HLT loans ahead of all other debt obligations. Furthermore,these loans are normally secured by pledges of speci®c collateral either in theform of assets or the equity of the borrower. HLT bank loans also tend to haveshorter maturities, averaging 4.4 years (53 months) compared to an averagematurity of 10 years for high yield debt.
3 See The New York Times, 22 January 1992, Section D, Column 1, p. 17.4 For a discussion on the background on senior bank loans in general and highly-leveraged
transaction loans in particular, see Carlson and Fabozzi (1992) and Ross et al. (1990).
1252 L.A. Angbazo et al. / Journal of Banking & Finance 22 (1998) 1249±1282

There are also important di�erences with respect to pricing conventions and®nancial covenants between HLT loans and high yield debt. Loans are usually¯oating-rate based and typically allow borrowers to select a pricing formulalinked to the Prime rate, LIBOR, or a Certi®cate of Deposit rate (CDs), plus acredit spread. Borrowers are also often free to change the base index on anyrollover date (usually semiannually). Finally, HLT debt (as bank issued privatedebt) generally has more stringent protective covenants than public debt suchas high yield bonds (see Carey et al., 1994).
2.3. HLT loan market participants
The growth in leveraged loan transactions may be explained in part by anincreasing shift by banks from the origination of loans, as long term investmentvehicles, to their origination for distribution to others through loan sales orthrough participations. Through these loan sales and participations, originat-ing banks can increase the volume of their lending while simultaneously di-versifying ®rm, interest rate and geographic risks, improving liquidity, and
Table 1
HLT bank loans versus high-yield bonds
HLT bank loans Junk bonds
Seniora Subordinated
Secured Unsecured
Short maturityb (Ave. 4.4 years) Long maturity (Ave. 10 years)
Quarterly interest in cash Semiannual interest, sometimes not in cash
First claim on cash ¯ows and speci®c
claims on assets
Junior claim on cash ¯ows and no speci®c
claims on assets
Scheduled principal amortization sched-
ules
None
Speci®ed asset sale requirement None
Strong ®nancial covenants )Floating-rate-based Fixed-rate-based
This table summarizes the major di�erences in the characteristics of highly-leveraged-transaction
bank loans and high yield (junk) ®xed income instrument. Other di�erences are that HLT bank
loans require more burdensome documentation (at least until June 1992), involve higher transac-
tion costs, create more potential con¯icts of interest, and impose more severe restrictions on eligible
investors or investable loans (i.e. revolving or term loans).a This includes contractual and structural seniority. The contractual seniority results from the ac-
tual terms agreed to by the di�erent classes of lenders under various indentures. Structural seniority
occurs by placing the debt in the operating subsidiary and securing this debt with the subsidiary's
speci®c assets. If the loan is made to the holding company, seniority is conferred by guaranteeing
the loan by a subsidiary's equity pledged as security. Contractual seniority typically allows senior
lenders to block interest and principal payments to subordinated lenders for a speci®ed ``blockage
period''.b This results in less repayment risk compared to subordinated ®xed income. This is further lessened
by scheduled amortization.
L.A. Angbazo et al. / Journal of Banking & Finance 22 (1998) 1249±1282 1253

enhancing their ability to comply with capital requirements and lending con-centration restrictions. The most important of the originating banks are USmoney center and large regional banks, many of whom sell participations to agroup of buyers beyond their correspondent banks, including smaller banks,non-bank ®nancial institutions such as General Electric Capital Corporation,foreign banks and investment banks. 5
More speci®cally, the major purchasers of loans and loan participations canbe classi®ed into two groups: (passive) portfolio investors and active strategicbuyers. Portfolio investors include US banks and foreign branches, agencies offoreign banks, insurance ®rms, pension and mutual funds. These ®rms pur-chase HLT loans in anticipation of earning attractive rates of return on seniordebt. Foreign banks and smaller banks invest for product and geographic di-versi®cation to overcome the e�ects of restrictions on interstate banking.
Strategic buyers of loans and participations invest in HLT loans with theobjective of subsequently owning or obtaining a large controlling position in aborrower or its subsidiary. These investors include vulture funds which spe-cialize in purchasing distressed loans for bargaining in a restructuring deal.
Table 2 provides a listing of the top selling institutions in leveraged loantransactions over the past decade. The LPC database lists the originatinglender (and major participants) for 4122 deals. An institution is classi®ed as a``lead'' lender if it retains primary administrative, monitoring, and contractenforcement responsibilities. These banks also typically retain the largest stakein the loan. Some banks perform administrative oversight duties, althoughthese are relatively minor, and their share ownership in the loan is smaller, onaverage, than lead banks. These banks are generally referred to as loan man-agers. A third group is referred to as participants, to re¯ect the fact that theydo not perform special functions other than being signatories to the originalloan agreement.
The top 20 lead banks in Table 2 are ordered by the number of transactions.Citibank was the top originator with 323 HLT deals, with an average deal sizeof $203.36 million, over half of which was sold in participation agreementswith other ®rms (53.0%). The bank's share represents about 11.23% of the totalamount of HLT loans issued, a ®gure that is second only to the 11.43% re-ported by (the since-merged) Manufacturers Hanover Trust (MHT). In 190 ofthe 4122 deal sample, MHT was the lead bank with the highest average dealsize of $356.99 million. The table also shows that Bank of America retains thelargest portion of HLT deals, with an average of 70.9% share per deal. Overall,the top 20 institutions are lead lenders in 2573 (or 62.42%) deals, which indollar terms represents 66.13% of the HLT outstanding. Second-tier institu-
5 See Ch. 25 in Saunders (1997) and Gorton and Pennacchi (1995) for a description of recent
trends in the loan sales market.
1254 L.A. Angbazo et al. / Journal of Banking & Finance 22 (1998) 1249±1282

tions (i.e., the next 20 leading ``lead'' ®rms) accounted for a further 12.70% ofthe amounts originated.
3. Sample description
3.1. General description of sample
The sample is based on 4122 HLT deals reported by LPC between January1987 and September 1994, with a total volume of new issue HLT loans of
Table 2
Top 20 lenders in HLT bank loans
Institution No.of
deals lead
Average deal
size (US $)
Average
deal share
(%)
Percentage
of total $$
Citi Bank 323 206361808 46.0 11.23
Chemical Banking 249 111750856 47.1 4.69
Bankers Trust 231 151923233 52.7 5.91
Chase Manhattan Bank 195 101898445 38.0 3.35
Manufacturers Hanover
Trust
190 356998146 29.5 11.43
Bank of Boston 135 73315436 60.8 1.67
Nova Scotia Bank 133 193081432 23.8 4.33
Nations Bank 128 93608317 50.9 2.02
Wells Fargo 118 158458830 40.8 3.15
Bank of America 107 117080903 70.9 2.11
CIBC 103 107635783 57.6 1.87
Continental Illinois 99 62091672 39.1 1.04
Secucity Paci®c NB 94 138562191 39.2 2.19
Tor-Dominion Banks 88 270934305 39.0 4.02
Banque Paribas 83 51426371 53.5 0.72
First Chicago 70 161423925 61.2 1.90
LTCB Ltd. 63 223309524 22.8 2.37
Bank of Montreal 60 111272800 32.7 1.12
Bank of New York 53 81617241 57.1 0.37
Barclays Bank Plc 51 196094960 23.5 1.69
This table shows the top 20 Lead banks by the number deals, average deal size, average deal share,
and share of total HLT loan originated. The lead bank is the primary lender as identi®ed in the Gold
Sheet announcement. The sample is based on 4122 deals announced between January 1987 and
December 1994. For the total sample, the number of deals led by Lead banks range from 1 to 323,
while the average share of the Lead banks ranges from 0% to 100%. The next 20 leading Lead banks
and number of deals led are : Morgan Guaranty (48), General Electric Capital Corp. (45), Credit
Lyonnais (44), Citicorp (40), NatWest Banks USA (38), TCB (34), CiticorpUSA (31), Heller Fi-
nancial (30), First Interstate (26), Sumitomo Bank Ltd. (25), ABN AMRO (24), Mellon Bank (24),
INT-Neder (23), BTCom (20), Creditan (20), Harris Trust Bank (20), Marine Midland (20), NBD
Bank (20), and Swiss Bank Corp. (19). These banks account for 12.70% of all HLT origination's.
L.A. Angbazo et al. / Journal of Banking & Finance 22 (1998) 1249±1282 1255

$593.5 billion. The LPC database is compiled from the LPCs weekly GoldSheets which cover the loan syndication market borrowers, loan amounts,facility type, maturity, credit rating, credit spreads, fees, as well as lenders'shares and role (lead manager, loan manager, etc.). Gold Sheets are in turnconstructed from loan information ®led with the Security Exchange Com-mission (SEC) covering large corporate, middle market, and internationalloans with sizes varying from $100,000 to over $13 billion.
We show the annual volume of new issue HLT bank loans strati®ed by HLTdesignation in Fig. 1. The ®rst three years of the sample covering 1987±1989 ischaracterized by HLT growth from $50 billion in 1987 to over $150 billion by1989. However, after 1990 the annual volumes of new HLT loans started tofall, partly due to a decline in mergers and LBO activity and partly due toincreased regulation of HLT loan by bank supervising authorities after Oc-tober 1989. Although bank regulators' requirement regarding HLT loan dis-closures ceased on 30 June 1992, the SEC has required the continuation of suchdisclosures.
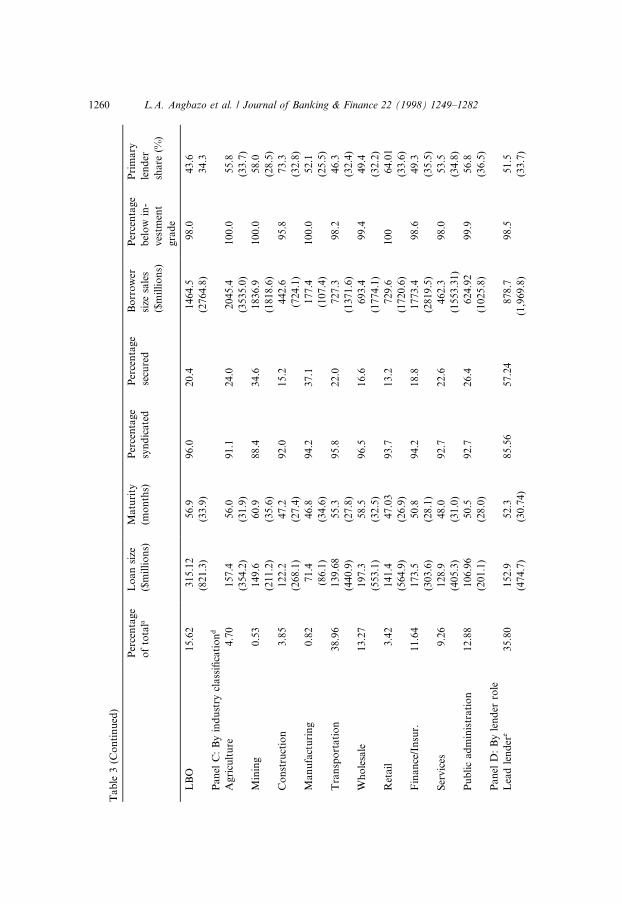
HLT loan characteristics, for new issues during 1987±1994 period, areshown in Table 3 by loan type, HLT designation (i.e., purpose), by industrytype of the borrower (based on the one digit SIC code), and by lender role.For the full sample, the average loan size is $145.8 million, with loansranging in size from as low as $234,000 to $13.6 billion. The maturity ofthese loans averages 53.38 months, but ranges between 1 and 204 months.Approximately 94.5% of the loans are syndicated with the lead lenders re-taining a share averaging 51.42%. This indicates that originating lendersgenerally retain only about half of these loans in their portfolio. Contrary topopular perception, only 21.3% of these loans are secured by a pledge ofassets. The corporate rating of the borrower is almost always below invest-ment grade, with 98.6% of the ratings at the time of the deal below Standardand Poor's BBB rating. Borrower size, as measured by sales in the yearimmediately preceding the deal, ranges from $440,000 to $21.35 billion, withaverage sales of $843.08 million.
3.2. Loan type, HLT designation, and industry groups
In general HLT loans may be allocated to term loan or revolving facilities.Term loans are installment loans which cannot be reborrowed once repaid.These funds are typically drawn down at one time, but occasionally do have atakedown or delayed take-down period. Another feature is that the loanprincipal is usually amortized, although the loan may be prepaid without ad-ditional fees. Attributes of term loans and their di�erences with revolving fa-cilities are highlighted in Panel A of Table 3. Term loans constitute about37.28% of all new issues and on average are larger in size ($154.5 million), andhave longer maturities (65.7 months).
1256 L.A. Angbazo et al. / Journal of Banking & Finance 22 (1998) 1249±1282

Fig
.1.
Vo
lum
eo
fn
ewis
sue
HL
Tlo
an
s.
L.A. Angbazo et al. / Journal of Banking & Finance 22 (1998) 1249±1282 1257

Revolving facility loans may be drawn down (up to the commitment amount),repaid and reborrowed any number of times. An interest fee is charged on theoutstanding loan amount as is a commitment fee (on any commitment unused)and a facility fee (on the total commitment amount available). These loanscomprise 46.43% of the HLT total, are relatively smaller in size ($107.33 mil-lion), and have shorter maturities (51.6 months) than term loans. There arestatistically no di�erences in the level of syndication, the proportion of loanssecured, the share retained by the originating lenders, or the corporate ratingsof the borrowers between revolving loans and term loans.
The ®nal category of loans, classi®ed as ``other'' in Table 3, comprises ofvery short-term facilities such as bridge loans, 365-day facility, and demandloans. This loan group, which also includes loans made to support letters ofcredit (or bankers acceptances), tends to be larger, with an average size of$292.5 million, shorter-term (27.94 months), less frequently syndicated, butmore often secured, compared to both term loans and revolving facilities.Borrowers' security is large and their credit ratings are generally below in-vestment grade.
The LPC database also provides the primary designation of each loan. Table3 Panel B shows that the most common use of loan proceed is debt repayment(22.10% of the sample which includes all facilities for re®nancing or consoli-dation of existing debt prior to maturity). Approximately 99.5% of these loansare below investment grade. On average, LBO loans (15.62% of the sample) arethe largest sized (an average of $315.12 million), and are made to the biggest®rms (mean sales of $1.4645 billion).
The shortest maturity loans are for working capital needs such as fundinginventory purchases (12.44% of the sample). These loans also have the smallestdeal size ($68.6 million on average). Loans for recapitalizations comprise8.76% of the sample and are used to support changes in a corporate borrowers'capital structure. These loans are often made simultaneously with a debt orequity o�ering. Recapitalization loans have the lowest syndication rate but aremost often secured. General corporate loans are a catch-all purpose loancategory that can be used for various activities related to general operations,purchases or working capital. A unique characteristic of these loans is the lackof security, with only about 12.8% being secured. Originating lenders retaintheir greatest shares (60.2%) in these loan categories.
General acquisition loans (also called ``hunting lines'') comprise 6.3% of thesample, and may be di�erentiated from takeover loans in that these loans aredesignated for unspeci®ed asset acquisitions, while takeover loans are used tosupport purchase of speci®c assets or a company. The average loan size andmaturity of general acquisition loans is less than that of takeover loans. Inaddition lenders tend to syndicate a higher proportion of takeover loans. Fi-nally, loan characteristics by industry group and lender role are shown in Table3, panels C and D, respectively.
1258 L.A. Angbazo et al. / Journal of Banking & Finance 22 (1998) 1249±1282

Ta
ble
3
Su
mm
ary
sta
tist
ics
of
HL
Tb
an
klo
an
s
Per
cen
tag
e
of
tota
la
Lo
an
size
($m
illi
on
s)
Matu
rity
(mo
nth
s)
Per
cen
tage
syn
dic
ate
d
Per
cen
tage
secu
red
Bo
rro
wer
size
sale
s
($m
illi
on
s)
Per
cen
tage
bel
ow
in-
ves
tmen
t
gra
de
Pri
mary
len
der
share
(%)
Pa
nel
A:
By
typ
eo
flo
an
b
To
tal
10
01
45
.853.3
894.5
21.3
843.0
898.6
51.4
2
(40
1.3
)(2
9.4
1)
(1771.8
)(3
4.0
5)
Rev
olv
er4
6.4
31
07
.33
51.6
94.7
22.1
5761.1
098.8
250.6
(23
5.3
)(2
5.9
3)
(1587.1
)(3
3.3
)
Ter
m3
7.2
81
54
.565.7
95.3
20.1
7833.5
98.6
50.5
(37
0.2
)(2
6.2
)(1
864.8
)(3
3.7
)
Oth
er1
2.0
82
92
.527.9
492.6
24.0
1298.0
97.7
51.2
5
(85
6.5
)(2
9.1
7)
(2217.9
)(3
5.6
)
Pa
nel
B:
By
loa
np
urp
ose
c
Rec
ap
.8
.76
15
4.9
58.2
90.5
41.6
1048.6
98.2
53.7
(25
9.0
)(2
4.4
)(1
614.5
)(3
5.2
)
Ta
ke
ov
er1
6.7
21
52
.758.3
96.8
27.0
751.8
99.0
46.6
0
(35
9.9
)(3
0.6
)(1
453.8
)(3
0.9
)
Gen
.a
cqu
i.6
.30
90
.653.9
94.3
19.2
353.4
98.3
56.1
(13
3.9
)(2
9.2
)(9
91.7
)(3
3.0
)
Wo
rkin
gca
p.
12
.44
68
.644.2
91.2
18.8
779.8
99.5
59.9
(10
9.5
)(2
6.6
)(1
806.4
)(3
3.4
)
Deb
tre
pa
y.
22
.10
11
8.9
55.9
96.3
17.9
705.8
99.5
45.0
(23
1.7
)(2
5.7
)(1
469.2
)(3
1.6
)
Gen
.co
rp.
14
.58
85
.244.8
93.7
12.8
614.3
97.5
60.2
(29
1.6
)(2
6.0
)(1
419.1
)(3
6.1
2)
L.A. Angbazo et al. / Journal of Banking & Finance 22 (1998) 1249±1282 1259
Ta
ble
3(C
on
tin
ued
)
Per
cen
tag
e
of
tota
la
Lo
an
size
($m
illi
on
s)
Matu
rity
(mo
nth
s)
Per
cen
tage
syn
dic
ate
d
Per
cen
tage
secu
red
Bo
rro
wer
size
sale
s
($m
illi
on
s)
Per
cen
tage
bel
ow
in-
ves
tmen
t
gra
de
Pri
mary
len
der
share
(%)
LB
O1
5.6
23
15
.12
56.9
96.0
20.4
1464.5
98.0
43.6
(82
1.3
)(3
3.9
)(2
764.8
)34.3
Pa
nel
C:
By
ind
ust
rycl
ass
i®ca
tio
nd
Ag
ricu
ltu
re4
.70
15
7.4
56.0
91.1
24.0
2045.4
100.0
55.8
(35
4.2
)(3
1.9
)(3
535.0
)(3
3.7
)
Min
ing
0.5
31
49
.660.9
88.4
34.6
1836.9
100.0
58.0
(21
1.2
)(3
5.6
)(1
818.6
)(2
8.5
)
Co
nst
ruct
ion
3.8
51
22
.247.2
92.0
15.2
442.6
95.8
73.3
(26
8.1
)(2
7.4
)(7
24.1
)(3
2.8
)
Ma
nu
fact
uri
ng
0.8
27
1.4
46.8
94.2
37.1
177.4
100.0
52.1
(86
.1)
(34.6
)(1
07.4
)(2
5.5
)
Tra
nsp
ort
ati
on
38
.96
13
9.6
855.3
95.8
22.0
727.3
98.2
46.3
(44
0.9
)(2
7.8
)(1
371.6
)(3
2.4
)
Wh
ole
sale
13
.27
19
7.3
58.5
96.5
16.6
693.4
99.4
49.4
(55
3.1
)(3
2.5
)(1
774.1
)(3
2.2
)
Ret
ail
3.4
21
41
.447.0
393.7
13.2
729.6
100
64.0
1
(56
4.9
)(2
6.9
)(1
720.6
)(3
3.6
)
Fin
an
ce/I
nsu
r.1
1.6
41
73
.550.8
94.2
18.8
1773.4
98.6
49.3
(30
3.6
)(2
8.1
)(2
819.5
)(3
5.5
)
Ser
vic
es9
.26
12
8.9
48.0
92.7
22.6
462.3
98.0
53.5
(40
5.3
)(3
1.0
)(1
553.3
1)
(34.8
)
Pu
bli
ca
dm
inis
tra
tio
n1
2.8
81
06
.96
50.5
92.7
26.4
624.9
299.9
56.8
(20
1.1
)(2
8.0
)(1
025.8
)(3
6.5
)
Pa
nel
D:
By
len
der
role
Lea
dle
nd
ere
35
.80
15
2.9
52.3
85.5
657.2
4878.7
98.5
51.5
(47
4.7
)(3
0.7
4)
(1,9
69.8
)(3
3.7
)
1260 L.A. Angbazo et al. / Journal of Banking & Finance 22 (1998) 1249±1282

Ma
na
ger
f1
.26
33
3.9
657.0
482.6
944.2
31,0
78.0
3100
45.0
3
(54
6.6
)(2
8.5
0)
(1,3
35.9
)(4
2.0
7)
Pa
rtic
ipa
ntg
62
.93
13
5.1
53.7
599.9
60.0
7750.3
98.6
23.7
4
(36
6.1
)(2
8.6
8)
(1,4
13.8
6)
(53.7
1)
Th
ista
ble
pre
sen
tssu
mm
ary
sta
tist
ics
(av
era
ge)
an
dst
an
dard
dev
iati
on
on
sele
cted
no
n-p
rice
chara
cter
isti
cso
fn
ewis
sue
HL
Tb
an
klo
an
so
rigin
ate
d
du
rin
gth
ep
erio
dJa
nu
ary
19
87±
Dec
emb
er1
99
4.
Fig
ure
sin
pare
nth
eses
are
stan
dard
dev
iati
on
s.a
Th
esu
mo
fo
bse
rva
tio
ns
inea
chsu
bg
rou
pm
ay
no
tad
du
pto
100%
inea
chp
an
elb
ecau
sece
rtain
dea
lsare
no
tcl
ass
i®ed
into
spec
i®c
cate
go
ries
.b
See
tex
tfo
rlo
an
typ
es.
cS
eete
xt
for
HL
Td
esig
na
tio
n.
dS
eete
xt
for
ind
ust
ryg
rou
pin
gs.
eIn
clu
des
len
der
role
ssu
cha
sa
rra
ng
er,
CO
-arr
an
ger
,ad
min
istr
ati
ve
agen
t,agen
tan
dC
O-a
gen
t.T
hes
eo
rigin
ati
on
'sle
nd
ers
reta
inth
ela
rges
tco
m-
mit
men
tre
ma
inth
ep
rim
ary
mo
nit
ors
of
the
bo
rro
wer
s.fT
hes
eb
an
ks
reta
ina
sma
ller
share
inth
eco
mm
itm
ent
tole
nd
an
dp
lay
ase
con
dary
role
inse
rvic
ing
an
dm
on
ito
rin
g.
Th
ese
are
iden
ti®
edas
lead
ma
na
ger
,C
O-l
ead
ma
na
ger
,m
an
ag
er,
CO
-ma
nag
eran
dse
nio
rm
an
ager
.g
Th
ese
ba
nk
sd
on
ot
per
form
an
ysp
ecia
lro
les
exce
pt
tob
esi
gn
ato
ries
toth
eo
rigin
al
loan
agre
emen
t.
L.A. Angbazo et al. / Journal of Banking & Finance 22 (1998) 1249±1282 1261

3.3. Credit spreads and fee structure
A leveraged loan transaction typically involves two types of revenues to abanker; interest and fees. Interest revenues usually are based on one or more¯oating rate-index plus a credit spread. In Table 4, we show the distribution ofthe three most commonly-used indices by the year of loan origination. These
Table 4
HLT loan credit spreads versus corporate yield spreads
Year N HLT
spread
Baa spread Junk bond
spread
Panel A: 6-month LIBOR index
1987 214 238.48 320.50 509.90
1988 590 250.64 251.65 467.81
1989 578 237.37 93.29 447.04
1990 379 250.79 206.99 751.52
1991 331 258.59 402.83 832.05
1992 505 254.01 507.73 749.93
1993 501 245.55 435.76 643.36
1994 706 234.92 369.78 540.12
Total 3804 247.02 316.32 598.43
Panel B: Prime index
1987 222 139.92 242.95 432.35
1988 610 149.55 143.08 359.24
1989 556 144.16 73.58 280.17
1990 364 140.61 33.09 577.62
1991 275 140.68 148.81 578.03
1992 405 133.15 273.99 516.19
1993 303 121.75 180.39 388.53
1994 294 103.10 170.63 340.98
Total 3029 136.49 130.44 412.93
Panel C: 6-month CD-index
1987 85 253.74 359.51 548.91
1988 210 257.58 282.55 498.71
1989 170 253.74 109.26 463.01
1990 68 257.50 215.48 760.00
1991 49 253.06 407.99 837.21
1992 51 249.56 525.31 767.51
1993 29 239.92 397.29 658.08
1994 20 235.63 393.23 563.58
Total 682 253.82 329.31 617.88
This table shows the distribution (mean) of credit spreads for HLT bank loans by the di�erent
indices of the pricing options. The sample consists of all HLT deals reported by LPC's data base,
for the period 1987±1994.
1262 L.A. Angbazo et al. / Journal of Banking & Finance 22 (1998) 1249±1282

include the Prime rate, 6-month LIBOR, and 6-month Certi®cate of deposit(CD) rates. (Note that since the loans are frequently priced o� of more thanone of the indexes, as alternative choices for borrowers, the sum of the pro-portions of the loans based on the Prime, LIBOR, and CD rates exceeds100%.)
In Panel A we show that about 92.28% of the loans have the 6-monthLIBOR rate benchmark. The credit spread (above the libor) was widest in 1991at 258.59 basis points and narrowest in 1994 (234.92 basis points); by com-parison, the average yield spreads on corporate Baa and junk bonds are 316.32and 298.43 basis points, respectively. In Panel B, we show that 73.5% of HLTloans in the sample have the lead bank's Prime rate as the benchmark rate. Theaverage spread of the loans over the prime is 136.49 basis points, compared toan average 130.44 and 412.13 basis points for the corporate Baa and the All-High-Yield bond indexes, respectively. The prime-based interest rate ``¯oat-s''only to the extent that banks change their rates. The least frequently-usedoption is the CD-based pricing, with only about 16.54% all the loans issuedduring the period. It is interesting to see that the yield spreads on Baa and junkbonds vary quite a lot over time, while the spreads on HLT loans are somewhat``sticky'' with less variation over time (Fig. 2).
The second source of revenue is derived from fees. In Table 5, a descriptionof fee structures and their distribution is shown. Upfront fees are one time feeswhich are collected at deal closing time to compensate the originating bank forproviding immediacy and for the risk of not being able to sell participations inthe loans made. The average upfront fee is 55.714 basis points. Annual fees areannual charges against the commitment amount for loan administration costs;commitment fees compensate for providing the line of credit (a callable optionfrom which the borrower can draw), while the cancellation fee is chargedagainst termination or commitment reduction. A letter of credit fee may also becharged. Table 5 shows that the fees are charged regularly and the cross-sec-tional variation in the size of the fees is fairly large. In general, the correlationamong these fees is positive and statistically signi®cant, indicating that lendersuse these fees in a complementary, rather than an o�setting, fashion.
4. The determinants of loan spreads
4.1. A theoretical model
In this paper, we use an augmented multi-factor model to model the de-terminants of the ex ante yield spread on loans. We assume that yield spreadsare determined by the following model:
yit � Xitbi � Zitc� eit; �1�
L.A. Angbazo et al. / Journal of Banking & Finance 22 (1998) 1249±1282 1263

Fig
.2
.N
ewis
sue
HL
Tlo
an
vs.
coro
po
rate
bo
nd
rate
s.
1264 L.A. Angbazo et al. / Journal of Banking & Finance 22 (1998) 1249±1282

Tab
le5
Dis
trib
uti
on
of
HL
Tb
an
klo
an
fees
Fee
typ
eN
Mea
nS
tdd
ev.
Min
imu
mM
axim
um
Pa
nel
A:
19
87±
19
94
Up
fro
nt
fee
4122
55.7
14
84.5
45
0570
An
nu
al
fee
4122
3.7
23
11.9
26
0212
Co
mm
itm
ent
fee
4122
23.9
625.2
74
0300
Ca
nce
lla
tio
nfe
e4122
5.5
84
33.5
92
0800
LC
(Let
ter
of
Cre
dit
)4122
39.9
01
82.9
70
375
Yea
rN
Up
fro
nt
An
nu
al
Co
mm
itm
ent
Can
cell
ati
on
LC
Pa
nel
B:
Av
era
ge
fees
by
yea
r1
98
7238
85.2
4.3
28.5
8.6
27.5
19
88
661
91.2
4.7
32.1
6.2
42.9
19
89
651
73.2
4.5
26
4.3
29.4
19
90
422
47.3
321.9
8.1
39.3
19
91
353
46.9
521.2
7.2
49.6
19
92
532
46.7
2.9
21.9
3.8
55.5
19
93
520
34
3.5
20.9
5.6
43.8
19
94
745
30.1
2.4
19.5
4.2
32.2
Up
fro
nt
An
nu
al
Co
mm
itm
ent
Can
cell
ati
on
LC
Pa
nel
C:
Co
rrel
ati
on
coe�
cien
tsU
pfr
on
t1.0
000
0.0
000
An
nu
al
0.0
796
1.0
000
0.0
001
0.0
000
Co
mm
itm
ent
0.1
345
0.0
148
1.0
000
0.0
001
0.0
000
0.0
000
Ca
nce
lla
tio
n0.1
055
0.0
270
0.0
513
1.0
000
0.0
001
0.0
837
0.0
010
0.0
000
LC
0.0
333
0.0
505
0.3
396
0.0
465
1.0
000
0.0
326
0.0
012
0.0
001
0.0
028
0.0
000
Th
ista
ble
pro
vid
esa
dis
trib
uti
on
of
the
fee
stru
ctu
reo
fth
eH
LT
ban
klo
an
s.T
he
sam
ple
isb
ase
do
n4122
dea
lsre
po
rted
by
LP
Cb
etw
een
1978
an
d
19
94.
Pa
nel
Ap
rov
ides
the
dis
trib
uti
on
ag
gre
ga
ted
over
the
8-y
ear
per
iod
.P
an
elB
pro
vid
esth
eaver
age
fee
for
each
yea
r.P
an
elC
pro
vid
esth
e
corr
ela
tio
nm
atr
ix.
All
fee
am
ou
nts
are
inb
asi
sp
oin
tsp
read
s.
L.A. Angbazo et al. / Journal of Banking & Finance 22 (1998) 1249±1282 1265

where yit is the loan yield spread over a benchmark market index rate at time oforigination (time t). Xit is a 2� 1 vector which includes the Baa yield spread andjunk bond yield spread over the benchmark rate at time t. These spreads varyaccording to the date of origination of the loan over the 1987±1994 period. Thecoe�cient bi is the ith loan's spread sensitivity to the spreads of the two corporatebonds (i.e., Baa and junk). Zit is a vector of loan-speci®c characteristics, while cmeasures the impact of these loan-speci®c characteristics on HLT loan spreads.
The intuition underlying the model is that a loan's yield spread is deter-mined, in part, by its systematic relationship �bi� to the spreads required in(competing) corporate bond markets. That is, the Baa bond (and junk bond)yield spread re¯ects required credit risk compensation for a competingbenchmark corporate bond. The higher a loan's systematic risk exposure, thehigher its ex ante loan spreads or risk premium.
However, bi is incapable of capturing all the determinants of a borrower'scredit risk. Thus, we allow loan-speci®c characteristics to a�ect loan pricing.This essentially assumes that (bi, Zit) span the same pricing space as the un-derlying systematic risk exposure factors. This use of ®rm-speci®c variables asproxies for factor loadings has been used recently by Fama and French (1992,1995), Berk (1995) and Mei (1993). Nevertheless, Eq. (1) is not directly esti-mable in a cross-section of loan spreads, since bi is not observable and variesacross individual loans. Thus, we estimate the following regression:
yit � Xitb� Zitc� git; �2�where b is the population mean of the bi sensitivity coe�cients. In Appendix A,we show the conditions under which the OLS estimator of Eq. (2) is statisticallyunbiased and consistent.
The b in Eq. (2) measures the average loan sensitivity towards changes inspreads in the corporate bond (Baa or junk debt) market. If these loans are of asimilar credit quality and maturity as the benchmark bond, we would expectthe loan bi to be close to one. 6 This is similar in spirit to equity pricing, wherewe would expect, in a cross-sectional regression similar to that of Eq. (2), witha well diversi®ed sample of stocks, that the beta should be close to one if themarket portfolio is used as Xit.
4.2. Empirical determinants
As discussed above, HLT loans may be priced based either o� the Prime,LIBOR, or CD rates. The dependent variable we use in the regressions thatfollow is the ex ante (percentage) credit spreads which is calculated as
6 The quality and maturity di�erences are directly accounted for through Zit, the vector of loan-
speci®c characteristics.
1266 L.A. Angbazo et al. / Journal of Banking & Finance 22 (1998) 1249±1282

spread � Loan rateÿ Base rate
Base rate�3�
at time of origination. Here the base rate is the monthly average Prime, 6-month LIBOR, or 6-month CD rate at the time of loan origination (as reportedby the Federal Reserve). The independent variables which are used to explainthe percentage spread are described below (listed in Table 6).
4.2.1. The independent variablesThe independent variables fall into ®ve categories: the bond market yield
spread, loan characteristics, borrower characteristics, lender role, and HLTdesignation.
BaaYield: It represents the ex ante yield on the portfolio of corporate bondswith Moody's corporate rating of Baa at time of loan origination obtainedfrom federal Reserve Statistical Release H15.
Junkb_Yield: It represents the ex ante yield on Merrill Lynch's All-High-Yield (``junk'') bond portfolio index obtained from Bloomberg InformationServices.
Ln(Sales): It represents borrower size, as measured by the natural loga-rithm of total sales in the year immediately preceding the closing of the deal.
Ln(Amount): It represents the natural logarithm of the loan commitmentamount at origination.
Syndicate: This is a dummy variable equal to 1 (0 otherwise) if the loan issyndicated.
Secured: This is a dummy variable equal to 1 (0 otherwise) if the loan issecured by a pledge of speci®c assets (or equity) of the borrower.
Maturity: It is represented by three dummy variables based on the maturityof the loan. LOWMAT is 1 (0 otherwise) if the loan's contractual maturity is 60months or less; MEDMAT is 1 (0 otherwise) if maturity is greater than 60months but less than 180 months; HIMAT is 1 (0 otherwise) if the maturity isgreater than 180 months.
Lender Role: Three dummy variables re¯ect the role of the originatinglender. AGENT-LEAD is 1 (0 otherwise) if the originating bank is the leadlender. This group is usually identi®ed in the LPC database by titles such asarranger, co-arranger, administrative agent, agent or co-agent. MANAGER isa dummy variable equal to 1 (0 otherwise) if the primary lender has a lowerlevel of commitment or syndication risk. This is identi®ed in the LPC databaseas the bank being a lead manager, co-lead manager, manager, co-manager,senior manager. Finally, PARTICIPANT is a dummy variable equal to 1 (0otherwise) if originating lender performs no speci®c role other than being asignatory to the original loan agreement and funding a share of the loan.
Loan type: Stands for three dummy variables based on the type of the loan.TERM is 1 (0 otherwise) if the loan is a term loan; REVOLVER is 1
L.A. Angbazo et al. / Journal of Banking & Finance 22 (1998) 1249±1282 1267

Table 6
Description of independent variables
Variable Description
BAAYIELD Ave. ex ante yield of Moody's Baa corporate bonds over the base rate
(Prime, Libor, or CD rates); e.g. (Baa-Prime)/Prime
JUNKB_YIELD Ave. ex ante yield on All-High-Yield (``Junk'') bonds over the base
rate (Prime, Libor, or CD rates); e.g. (JUNK-Prime)/Prime
LN (SALES) Natural logarithm of borrower sales revenue
LN (AMOUNT) Natural logarithm of loan amount
SYNDICATE Dummy variable equal 1 (0 otherwise) if the loan is underwritten by a
syndicate of banks
LOWMAT Dummy variable equal 1 (0 otherwise) if loan matures in 6 60 months
MEDMAT Dummy variable equal 1 (0 otherwise) if loan matures between 60 and
180 months
UNRATED Dummy variable equal 1 (0 otherwise) if borrower's bond rating
outstanding is unrated
INVGRD Dummy variable equal 1 (0 otherwise) if borrower's bond rating is
S&P BBB and above
BB-B Dummy variable equal 1 (0 otherwise) if borrower's bond rating is
S&P BB-B
CCC-D Dummy variable equal 1 (0 otherwise) if borrower's bond rating is
S&P CCC-D
AGENT-LEAD Dummy variable equal 1 (0 otherwise) if primary lender's role is agent
(including administrative) or lead bank or manager
MANAGER Dummy variable equal 1 (0 otherwise) if primary lender's role is a CO-
agent, arranger or CO-arranger
PARTICIPANT Dummy variable equal 1 (0 otherwise) if primary lenders role is a
participant
SECURED Dummy variable equal 1 (0 otherwise) if the loan is secured
TERM Dummy variable equal 1 (0 otherwise) if the loan is a term loan
REVOLVER Dummy variable equal 1 (0 otherwise) if the loan is a revolving loan
OTHER Dummy variable equal 1 (0 otherwise) if loan is a standby, demand,
bridge or other loan agreement
RECAPITAL-
IZATION
Dummy variable equal 1 (0 otherwise) if loan purpose is recapital-
ization
TAKEOVER Dummy variable equal 1 (0 otherwise) if loan purpose is acquisition
with speci®c collateral
GEN. ACQUISI-
TION
Dummy variable equal 1 (0 otherwise) if loan purpose is for general
acquisition program
WORKING
CAPITAL
Dummy variable equal 1 (0 otherwise) if loan purpose is working
capital
DEBT
REFINANCE
Dummy variable equal 1 (0 otherwise) if loan purpose is to repay
existing debt
GEN.CORP
FINANCE
Dummy variable equal 1 (0 otherwise) if loan purpose is general
corporate purpose
LBO Dummy variable equal 1 (0 otherwise) if loan purpose is for leveraged-
buy-out
This table contains a description of all the independent variables used in the cross-sectional analysis
of the determinants of the ex ante yield of highly-leveraged-transactions bank loans. All data
pertain to the sample of 4122 loans originated in 1987±1994.
1268 L.A. Angbazo et al. / Journal of Banking & Finance 22 (1998) 1249±1282

(0 otherwise) if the loan is a revolving facility; and OTHER is 1 (0 otherwise) ifthe loan is a short-term facility such as demand, bridge, standby LC orbankers' acceptances loans.
Corporate rating: This represents corporate debt ratings (based on Standardand Poor's Classi®cation) of the outstanding debentures of the borrower at thetime of the loan transaction. INVGRD is 1 (0 otherwise) if the borrower isinvestment grade (BBB and above in Standard and Poor's rating ); NOGRD is1 (0 otherwise) if the borrower is unrated; SUBGRD is 1 (0 otherwise) if theborrower is below-investment grade but within the range BB-B. SPECUGRDis 1 (0 otherwise) if the borrower is a speculative issue with a rating betweenCCC and D.
HLT designation: Seven dummy variables re¯ect the designated purposes ofthe leveraged loan. These dummy variables are Recapitalization, Takeover,General Acquisition, Working Capital, Debt Re®nancing, and General Cor-porate Purposes, and Leverage-Buy-Outs (LBO).
4.3. Discussion of empirical determinants
The objective of the analysis is to model the determinants of the ex antespreads (and fees) of new issue HLT loans relative to the ex ante yield spreadsin the competing corporate bond markets as well as speci®c loan characteristicsor features. The ex ante market yield spreads are the yield spreads on corporatebonds rated Baa by Moody's (taken from the Federal Reserve System H.15release) and the yield spread on Merrill Lynch's All-High-Yield bond index(obtained from Bloomberg).
A loan feature that may be an important determinant of spreads is the sizeof the loan. Larger loans tend to be associated with large public borrowers andthere is more public information available regarding such borrowers. As such,default risk may be lower than for smaller loans; leading to a lower yieldspread. Alternatively, a larger loan size can lead to enhanced credit risk con-centration at the originating bank (to the extent that the bank cannot syndi-cate/sell-o� all of the loans). That is, the lender is exposed to a higher level ofborrower-speci®c risk. This suggests a higher loan yield spread may be de-manded by the originating lender. Therefore, one might expect either a nega-tive or positive relationship between borrower size and loan yield spreads.
The ex ante credit rating of the borrower is clearly an important factor indetermining the risk and price of a new-issue loan. One would expect thathigher credit rated corporations will have lower default risk and hence loweryield spreads. Credit quality di�erences may be even more important, after thebank regulators' disclosure requirements were phased out, as the incentives forlending to highly indebted borrowers may have increased. Longer maturityloans should be expected to have a higher risk of principal repayment com-pared to the short-term loans (this should lead to higher yields); see Flannery
L.A. Angbazo et al. / Journal of Banking & Finance 22 (1998) 1249±1282 1269

(1986). A revolving facility provides an on-going line of credit that may bedrawn down, repaid and re-borrowed many times over the life of the line.Compared to the ®xed term loan facilities, the revolver is more likely to beassociated with takedown risk. This should lead to higher required yieldspreads (see Ho and Saunders, 1983).
If the loan is underwritten by a syndicate, it is more likely to be successfullydistributed to other lenders until the lead bank's target share is reached. This isequivalent to a reduction in syndication risk for the originating bank and to areduction in ®rm-speci®c risk associated with individual loans. This suggeststhat one should expect lower yield spread on syndicated loans. 7 If a loan issecured by a pledge of speci®c assets or equity of the borrower, the risk ofprincipal and interest default is likely to be lower, leading to lower yieldspreads. 8
The role of the primary or originating lender is used to di�erentiate com-mitment levels and a bank's exposure to syndication, commitment, and can-cellation risks. An agent-lead bank by de®nition has a higher commitment leveland thus greater credit risk exposure. This should lead to a higher requiredyield spread. O�setting this e�ect is the fact that a lead bank has the primaryresponsibility for monitoring and covenant enforcement. As such the uncer-tainty associated with the loan is reduced±leading to a lower spread. 9
Finally, the relationship between loan proceed use (designation) and loanspreads will be in¯uenced by di�erences in the lenders' ability to extract higherrates of return for di�erent use of proceeds. In otherwords, the purpose of theloan has useful information content beyond the signals about credit-worthinessthat are conveyed in loan origination announcements (see James (1987) andLummer and McConnell (1989)). In the tests, seven categories of proceed use areincluded. Loans for ®nancing acquisition may earn higher yields than generalcorporate loans because lenders are able to charge higher rates for providingimmediacy. 10 Loans for debt re®nancing or recapitalization are viewed as
7 Note, however, that the originating banks may earn fees associated with syndication. These are
more likely to be re¯ected in upfront or commitment fees, rather than in higher yields.8 However, arguably only high risk borrowers have to pledge collateral. As such collateral may
be viewed as a signal of being a higher (rather than lower) risk.9 In Diamond (1984, 1991), it is shown that direct lender±borrower liaison will result in costly or
inadequate information production, either because of duplication of e�ort, if each lender monitors,
or a free-rider problem in which no lender acts. However, if a delegated monitor has primary
responsibility for monitoring and enforcing loan contracts on behalf of the whole syndicate, the
uncertainty associated with a borrower is reduced, and this should lead to a lower risk default.10 Megginson et al. (1995) show that lending syndicates are able to extract higher loan rates for
®nancing transactions where the borrower needs to acquire ®nancing quickly (e.g., takeover and
leveraged buyout). In another study, Kracaw and Zenner (1994) show that there are signi®cant
di�erences in borrowing ®rms' abnormal returns at the announcement of bank ®nancing of LBOs
compared to announcements of bank ®nancing for recapitalizations.
1270 L.A. Angbazo et al. / Journal of Banking & Finance 22 (1998) 1249±1282
negative NPV investments since they are usually utilized for defensive purposesin corporate control contests (Denis, 1990). This should lead to higher yieldspreads. Debt re®nancing and recapitalization loans can be viewed as renewalswhich provide positive signals about the borrower's prospects. Lenders may beable to earn a higher yield through higher rates or from equity-kicker featuresthat allow lenders to share in upside returns with borrowers.
5. Empirical results
Various speci®cations of the yield spread model are reported in Tables 7±12and are based on LIBOR, Prime and CD benchmark rates to generate spreads.Discussions of results focus mainly on the LIBOR-based model since mostHLT loans (92.28%) are priced-o� of the 6-month LIBOR. 11
5.1. Loan-bond price divergence
One consistent ®nding from the regression tests with the di�erent modelspeci®cations is that the ex ante corporate bond yield spread variable (Baa-Yield) has a positive and generally signi®cant impact on loan yield spreads.However, we ®nd this sensitivity is much smaller than one (b � 0:299). Whilequality characteristics/factors and institutional features may impact the degreeof divergence (see Section 5.2), the ®nding that b is signi®cantly less than onecould in part be due to ``loan interest spread stickiness'', i.e., a time lag on thepart of banks to adjust loan spreads to re¯ect changing spreads in the cor-porate debt markets. It is worth noting that the ``spread stickiness'' referred tohere is di�erent from the general interest rate stickiness examined in previousstudies (e.g., Berger and Udell, 1992; Mester and Saunders, 1995). Here we arenot talking about stickiness with respect to the general level of interest rates orbank rates (e.g., prime rate), but rather with respect to changes in yield spreads,i.e., to changes in the risk premium. Table 7 also shows a mean b for junkbonds which is signi®cantly smaller than that of the corporate Baa bond,suggesting that there is relatively greater price divergence between the HLTloan and junk bond markets than between the HLT loan an corporate bondmarkets 12.
11 However, where there are important di�erences with the Prime and CD rates models, the
di�erences are noted appropriately.12 We also ran the regression with Baa yield or junk bond yield only. The results are quite
similar. We ®nd the b for Baa yields is larger than the for junk bond, but they are both less than 1.
We also computed the t-statistic for the linear hypothesis that the coe�cients on BaaYield and
Junkb_Yield are equal to 1. In both cases the hypothesis that the coe�cient is equal to 1 is rejected.
The t-statistic is 40.44 for the BaaYield and 68.75 for Junkb_Yield, both of which are signi®cant.
L.A. Angbazo et al. / Journal of Banking & Finance 22 (1998) 1249±1282 1271

5.2. Loan speci®c e�ects and lender characteristics
In this section we summarize the ®ndings regarding the e�ects of other loancharacteristics on the HLT spreads. Borrower size (Ln(Sales)) is insigni®cant,but loan size (Ln(Amount)) is negative and signi®cantly correlated with ex anteyields, indicating that larger loans have a borrowing cost advantage. We also®nd that longer maturity loans (MEDMAT) generate higher yields. Loanswhich are secured by a pledge of assets (SECURED) have higher, rather thanlower, yields. On average, secured issues generate 3.2 basis points in higherexpected yields, which is statistically signi®cant. 13 This con®rms the view (see
Table 7
The convergence of HLT loan and corporate bond prices
Spread (LIBOR) Spread (Prime) Spread (CD)
INTERCEPT 0.327 )0.009 0.183
(10.060)� ()0.451) (3.383)�
BAAYIELD 0.299 0.116 0.222
(18.264)� (8.411)� (8.748)�
JUNKB_YLD 0.048 0.044 0.083
(3.636)� (3.744)� (4.161)�
LN(SALES) )0.002 0.005 )0.001
()1.040) (4.639)� ()0.163)
LN(AMOUNT) )0.006 0.001 )0.006
()2.871)� (0.320) ()0.183)
SECURED 0.032 0.007 0.006
(5.887)� (2.043)� (0.750)
MEDMAT 0.013 0.008 0.011
(2.893)� (2.937)� (1.724)��
INVGRD )0.047 )0.017 )0.015
()2.743)� ()1.530) ()0.841)
SYNDICATE )0.009 0.017 0.021
()0.912) (2.642)� (4.161)�
N 3050 2582 572
R2 0.6878 0.1465 0.7657
This table shows estimates of the relationship of the ex ante yield spread on HLT loans and the
required spreads in the competing Baa corporate and high-yield-bond market. The regression es-
timates in each column re¯ect the three pricing options available. Figures in parenthesis are t-ratios.
The e�ects of loan and borrower characteristics are re¯ected through secured (SECURED), loan
size (LN(AMOUNT)), maturity (MEDMAT), corporate rating (INVGRD), and borrower size
(LN(SALES)). The syndication variable is a dummy variable (SYNDICATE) takes the value of 1
(0 otherwise) if the loan is underwritten by two or more lenders.* Indicates signi®cance at 5%.** Indicates signi®cance at 10%.
13 Note however that in the CD regression, secured loans are associated with lower yields (about
2.0 basis points) on average.
1272 L.A. Angbazo et al. / Journal of Banking & Finance 22 (1998) 1249±1282

Battacharya and Thakor, 1993) that collateral backing signals a more (ratherthan less) risky borrower.
The coe�cient for loan syndication versus sole-lender (SYNDICATE) isnegative but insigni®cant. The sign of the coe�cient can be interpreted as(weak) evidence in support of the hypothesis that syndicated lending lowers therisk of an unsuccessful distribution of loans. The syndicated loan sample is alsodisaggregated into three subcategories re¯ecting the existence of di�erent in-centives for lenders to monitor and, if necessary, to enforce contract terms. InTable 8, we substitute the SYNDICATE variable with two interactive dummyvariables. The ®rst interactive dummy variable is SYNDICATE � LEAD ±the interaction between SYNDICATE and AGENT-LEAD. This variable isincluded to measure the e�ect on yield spreads when there is a lead lenderwithin the syndicate who retains the largest share. If the incentive to monitor iscorrelated with the share of the loan retained as well as with the lender'sdesignation, this variable should have a negative sign, consistent with a re-duction of credit risk. The second interactive variable SYNDI-CATE � MANAGER measures the e�ect of reduced monitoring incentiveswhen the originating bank retains a lower share. 14 The role of MANAGER isassociated with a lower share in the loan retained, and therefore with narroweroversight authority (and monitoring incentives). This variable is predicted tohave a more positive e�ect on credit spreads than SYNDICATE � LEAD. 15
By comparison, syndicated loans where both SYNDICATE � LEAD andSYNDICATE � MANAGER dummies are zero should have a relativelyhigher spread.
In Table 9, we report estimates from a multivariate regression of the ex anteyield spreads with several modi®cations to the models estimated in Tables 7and 8. First, since credit rating is important, we include a broader set of creditratings in order to exploit the additional information that may be implied bythe ratings di�erences. Speci®cally, three credit rating dummies for unratedissues (UNRATED), sub-investment issues (BB-B), and speculative issues(CCC-D) are included. The estimated coe�cients are all positive, with thelargest being for the speculative issues.
The use of the loan proceeds is also more ®nely partitioned, with six out ofseven dummy variables included (where the dummy for general corporate ®-nancing is excluded to avoid linear dependency). All dummy variables arepositive with the exception of general acquisition loans. The positive signs for
14 Also a lower share would be consistent with an enhanced moral hazard risk to loan buyers
since there is an incentive for an originating bank (with private information) to sell more of bad
loans (retaining a lower share) than good loans.15 SYNDICATE � PARTICIPANT is excluded since it is linearly dependent with the other two
interaction variables.
L.A. Angbazo et al. / Journal of Banking & Finance 22 (1998) 1249±1282 1273
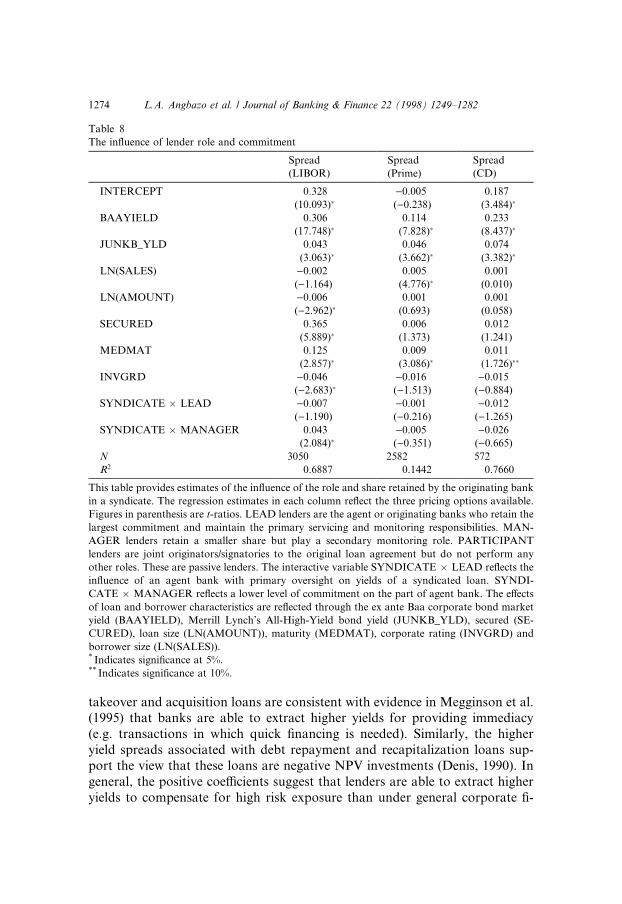
takeover and acquisition loans are consistent with evidence in Megginson et al.(1995) that banks are able to extract higher yields for providing immediacy(e.g. transactions in which quick ®nancing is needed). Similarly, the higheryield spreads associated with debt repayment and recapitalization loans sup-port the view that these loans are negative NPV investments (Denis, 1990). Ingeneral, the positive coe�cients suggest that lenders are able to extract higheryields to compensate for high risk exposure than under general corporate ®-
Table 8
The in¯uence of lender role and commitment
Spread
(LIBOR)
Spread
(Prime)
Spread
(CD)
INTERCEPT 0.328 )0.005 0.187
(10.093)� ()0.238) (3.484)�
BAAYIELD 0.306 0.114 0.233
(17.748)� (7.828)� (8.437)�
JUNKB_YLD 0.043 0.046 0.074
(3.063)� (3.662)� (3.382)�
LN(SALES) )0.002 0.005 0.001
()1.164) (4.776)� (0.010)
LN(AMOUNT) )0.006 0.001 0.001
()2.962)� (0.693) (0.058)
SECURED 0.365 0.006 0.012
(5.889)� (1.373) (1.241)
MEDMAT 0.125 0.009 0.011
(2.857)� (3.086)� (1.726)��
INVGRD )0.046 )0.016 )0.015
()2.683)� ()1.513) ()0.884)
SYNDICATE � LEAD )0.007 )0.001 )0.012
()1.190) ()0.216) ()1.265)
SYNDICATE � MANAGER 0.043 )0.005 )0.026
(2.084)� ()0.351) ()0.665)
N 3050 2582 572
R2 0.6887 0.1442 0.7660
This table provides estimates of the in¯uence of the role and share retained by the originating bank
in a syndicate. The regression estimates in each column re¯ect the three pricing options available.
Figures in parenthesis are t-ratios. LEAD lenders are the agent or originating banks who retain the
largest commitment and maintain the primary servicing and monitoring responsibilities. MAN-
AGER lenders retain a smaller share but play a secondary monitoring role. PARTICIPANT
lenders are joint originators/signatories to the original loan agreement but do not perform any
other roles. These are passive lenders. The interactive variable SYNDICATE � LEAD re¯ects the
in¯uence of an agent bank with primary oversight on yields of a syndicated loan. SYNDI-
CATE � MANAGER re¯ects a lower level of commitment on the part of agent bank. The e�ects
of loan and borrower characteristics are re¯ected through the ex ante Baa corporate bond market
yield (BAAYIELD), Merrill Lynch's All-High-Yield bond yield (JUNKB_YLD), secured (SE-
CURED), loan size (LN(AMOUNT)), maturity (MEDMAT), corporate rating (INVGRD) and
borrower size (LN(SALES)).* Indicates signi®cance at 5%.** Indicates signi®cance at 10%.
1274 L.A. Angbazo et al. / Journal of Banking & Finance 22 (1998) 1249±1282
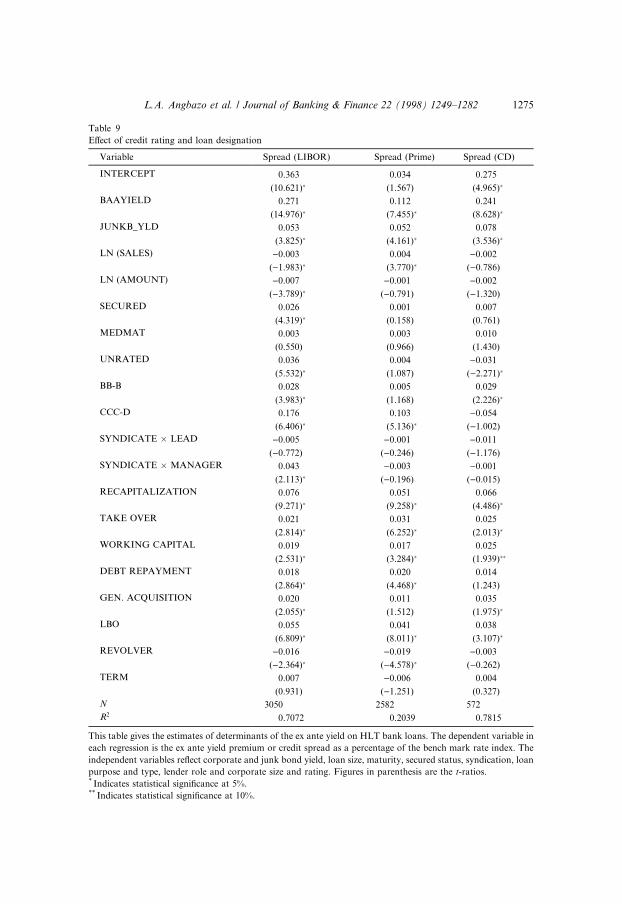
Table 9
E�ect of credit rating and loan designation
Variable Spread (LIBOR) Spread (Prime) Spread (CD)
INTERCEPT 0.363 0.034 0.275
(10.621)� (1.567) (4.965)�
BAAYIELD 0.271 0.112 0.241
(14.976)� (7.455)� (8.628)�
JUNKB_YLD 0.053 0.052 0.078
(3.825)� (4.161)� (3.536)�
LN (SALES) )0.003 0.004 )0.002
()1.983)� (3.770)� ()0.786)
LN (AMOUNT) )0.007 )0.001 )0.002
()3.789)� ()0.791) ()1.320)
SECURED 0.026 0.001 0.007
(4.319)� (0.158) (0.761)
MEDMAT 0.003 0.003 0.010
(0.550) (0.966) (1.430)
UNRATED 0.036 0.004 )0.031
(5.532)� (1.087) ()2.271)�
BB-B 0.028 0.005 0.029
(3.983)� (1.168) (2.226)�
CCC-D 0.176 0.103 )0.054
(6.406)� (5.136)� ()1.002)
SYNDICATE � LEAD )0.005 )0.001 )0.011
()0.772) ()0.246) ()1.176)
SYNDICATE � MANAGER 0.043 )0.003 )0.001
(2.113)� ()0.196) ()0.015)
RECAPITALIZATION 0.076 0.051 0.066
(9.271)� (9.258)� (4.486)�
TAKE OVER 0.021 0.031 0.025
(2.814)� (6.252)� (2.013)�
WORKING CAPITAL 0.019 0.017 0.025
(2.531)� (3.284)� (1.939)��
DEBT REPAYMENT 0.018 0.020 0.014
(2.864)� (4.468)� (1.243)
GEN. ACQUISITION 0.020 0.011 0.035
(2.055)� (1.512) (1.975)�
LBO 0.055 0.041 0.038
(6.809)� (8.011)� (3.107)�
REVOLVER )0.016 )0.019 )0.003
()2.364)� ()4.578)� ()0.262)
TERM 0.007 )0.006 0.004
(0.931) ()1.251) (0.327)
N 3050 2582 572
R2 0.7072 0.2039 0.7815
This table gives the estimates of determinants of the ex ante yield on HLT bank loans. The dependent variable in
each regression is the ex ante yield premium or credit spread as a percentage of the bench mark rate index. The
independent variables re¯ect corporate and junk bond yield, loan size, maturity, secured status, syndication, loan
purpose and type, lender role and corporate size and rating. Figures in parenthesis are the t-ratios.* Indicates statistical signi®cance at 5%.** Indicates statistical signi®cance at 10%.
L.A. Angbazo et al. / Journal of Banking & Finance 22 (1998) 1249±1282 1275

nancing loans. An interesting piece of evidence is that revolving loans have alower yield spread than term loans, the latter are generally larger in size andhave a longer maturity.
5.3. E�ect of fees
Table 10 presents regression estimates of the relationship between fees andthe ex ante yield premium of HLT loans, controlling for loan characteristics.The fee variable is included to examine whether fees and spreads are potentialsubstitute or complementary sources of revenues for originating banks. If feesand loan spreads are substitutes then a negative relationship should be ex-pected between fees and yield spreads.
Fees are speci®ed as a percentage of the underlying facility expressed in basispoints, and refer to upfront, commitment, cancellation, and letter of credit(LC) fees. We present here only the results for upfront fees as the relationshipwith the spread is similar for the other fees.
The main result is that upfront fees have a positive and signi®cant coe�cientin the HLT yield spread regression, which is inconsistent with the hypothesisthat loan rates and fees are substitutes. That is , banks do not appear to chargelower loan rates with the expectation of extracting higher upfront fees fromborrowers. We explored this relationship further by analyzing the character-istics of borrowers who were charged upfront fees compared to those who werenot charged fees. Table 11 indicates that, on average, upfront fees are chargedon larger loans, and the loans are often designated for LBO ®nancing. Our®nding is consistent with recent empirical evidence that lenders are able toextract relatively higher gross returns on loans for takeover and leveragebuyouts (see Megginson et al., 1995; Kracaw and Zenner, 1994). In general,our results provide evidence that one way banks extract higher returns onriskier loans is through the incidence of upfront fees in addition to higher loanrates, more security, and shorter maturity. 16
5.4. Deregulation of HLT lending
Table 12 presents results of the impact of the easing of bank regulators'reporting requirements on HLT lending. Regression coe�cients are estimatedfor two periods corresponding to regulation (January 1987±June 1992), andpost-regulation (July 1992±September 1994). The regulation period representsthe period in which banks were required to disclose the total amount of loanswith HLT designation (see Section 2.1). This reporting requirement was phased
16 When we include these variables in the regressions with upfront fees, the coe�cients of the
upfront fees are still signi®cant.
1276 L.A. Angbazo et al. / Journal of Banking & Finance 22 (1998) 1249±1282

Table 10
Relationship of ex ante yield spreads and upfront fees
Variable Spread (LIBOR) Spread (Prime) Spread (CD)
INTERCEPT 0.371 0.041 0.275
(10.044)� (1.890)�� (4.956)�
BAAYIELD 0.271 0.112 0.241
(15.044)� (7.544)� (8.597)�
JUNKB_YLD 0.054 0.052 0.079
(3.892)� (4.220)� (3.583)�
LN(Sales) )0.004 0.004 )0.002
()2.180)� (3.579)� ()0.817)
LN(Amount) )0.008 )0.001 )0.004
()4.098)� ()1.180) ()1.343)
MEDMAT 0.003 0.003 0.010
(0.602) (1.119) (1.437)
SECURED 0.023 )0.001 0.007
(3.748)� ()0.289) (0.720)
UNRATED 0.039 0.006 )0.029
(5.928)� (1.456) ()2.189)�
BB-B 0.031 0.008 0.029
(4.417)� (1.766)�� (2.236)�
CCC-D 0.164 0.086 )0.057
(5.979)� (4.303)� ()1.050)
SYNDICATE � LEAD )0.005 )0.003 )0.012
()0.920) ()0.688) ()1.263)
SYNDICATE � MANAGER 0.040 )0.004 )0.005
(1.971)� ()0.264) ()0.124)
RECAPITALIZATION 0.072 0.048 0.065
(8.740)� (8.784)� (4.398)�
TAKE OVER 0.018 0.028 0.024
(2.457)� (5.829)� (1.987)�
WORKING CAPITAL 0.018 0.016 0.025
(2.375)� (3.130)� (1.934)�
DEBT REPAYMENT 0.020 0.020 0.015
(2.831)� (4.440)� (1.338)
GEN. ACQUISITION 0.047 0.011 0.036
(2.069)� (1.569) (2.043)�
LBO 0.047 0.036 0.036
(5.749)� (6.886)� (2.953)�
REVOLVER )0.014 )0.018 )0.002
()2.105)� ()4.154)� ()0.183)
TERM 0.008 )0.004 0.004
(1.171) ()0.895) (0.369)
UPFRONT FEES 1.449 1.074 0.411
(5.515)� (6.681)� (1.009)
N 3050 2582 572
R2 0.7101 0.2175 0.7819
This table estimates the relationship between the ex ante yield and upfront fees. The dependent variable in each
regression is the ex ante premium or credit spread as a percentage of the bench mark rate index. The control
variables re¯ect corporate and junk bond yield, loan size, maturity, secured status, syndication, loan purpose and
type, lender role and corporate size and rating. Figures in parenthesis are the t-ratios.* Indicates signi®cance at 5%.** Indicates signi®cance at 10%.
L.A. Angbazo et al. / Journal of Banking & Finance 22 (1998) 1249±1282 1277

out to prevent regulation from impeding credit creation toward the end of1991±1992 credit crunch. The computed F-statistic, for the null hypothesis ofstable parameters across time, F(18, 3039)� 14.0433, is statistically signi®cantat the 5% level, rejecting the hypothesis of a stable structural model deter-mining spreads during the pre- and post-``regulatory'' periods.
Speci®cally, loan yield spreads were slightly more sensitive to junk bondyield spreads movements than corporate Baa yield spread movements in thepost-deregulation period. By contrast, during the period of regulation, loanyield spreads were more sensitive to Baa yield spread (b � 0:281) than to junkbond yield spreads (b � 0:023). 17 The relative sizes of the coe�cients on Baayield and junk bond yield variables were more similar in absolute value in thepost-regulation period, perhaps re¯ecting the improved credit quality of thejunk bonds. 18 The spreads on HLT loans also appear to have declined inrecent years (i.e., spreads during regulation were an average 2.53%, comparedto 2.42% in the post-regulation period).
6. Conclusion
In this paper, we employ the Loan Pricing Corporation's database on HLTloans to analyze the determinants of ex ante yield spreads. The data baseconsists of 4122 deals between 1989±1994, with a combined dollar amount (innew-issue loans) estimated at $593.5 billions. The results show that, on aver-age, HLT loan yield spread sensitivity to yield spreads in the Baa corporate
Table 11
Characteristics of HLT borrowers strati®ed by incidence of upfront fees
Firms
without
fees
Firms
with
fees
Borrower sales size ($millions) 717.25 895.05
Loan size ($millions) 120.17 171.7
Loan maturity (months) 55.03 51.3
Pct. of loan serviced 14.70 28.50
Pct. of borrowers with speculative credit rating ± (CCC-D) 2.25 6.8
Pct. of loans for LBOs 10.10 22.04
Pct. of loans which are standby or demand loans 9.83 14.7
17 As in Section 5.1, we also computed t-statistics for the linear hypothesis that the coe�cient on
BaaYield and Junkb_Yield variables are equal to 1. Across the two subperiods ± regulation
(January 1987±June 1992) and post-regulation (post-June 1992) ± the computed t-statistics reject
the hypothesis of unit coe�cients for both variables.18 The correlation coe�cient between BaaYield and Junkb_Yield in the regulation is 0.8708
compared to 0.9073 in the post-regulation period.
1278 L.A. Angbazo et al. / Journal of Banking & Finance 22 (1998) 1249±1282

Table 12Deregulation of HLT lending
Variable Full sample 1987±1992 1992±1994
INTERCEPT 0.371 0.253 0.636
(10.044)� (8.976)� (7.746)�
BAAYIELD 0.271 0.281 0.111
(15.044)� (18.529)� (1.407)JUNKB_YLD 0.054 0.023 0.173
(3.892)� (2.091)� (3.066)�
LN(Sales) )0.004 0.003 )0.015
()2.180)� (2.185)� ()4.166)�
LN(Amount) )0.008 )0.006 )0.013
()4.098)� ()3.645)� ()2.960)�
MEDMAT 0.003 0.004 0.005
(0.602) (0.996) (0.490)SECURED 0.023 )0.003 0.027
(3.748)� ()0.426) (2.346)�
UNRATED 0.039 0.008 0.019
(5.928)� (1.142) (1.047)BB-B 0.031 0.012 0.033
(4.417)� (1.939)�� (1.683)��
CCC-D 0.164 0.112 0.142
(5.979)� (3.014)� (3.124)�
SYNDICATE � LEAD )0.005 )0.031 0.025
()0.920) ()5.432)� (2.368)�
SYNDICATE � MANAGER 0.040 )0.020 0.080
(1.971)� ()1.044) (2.188)�
RECAPITALIZATION 0.072 0.035 0.081
(8.740)� (4.261)� (5.444)�
TAKE OVER 0.018 0.008 0.009
(2.457)� (1.283) (0.599)WORKING CAPITAL 0.018 0.004 0.024
(2.375)� (0.576) (1.595)DEBT REPAYMENT 0.020 0.011 0.015
(2.831)� (1.826) (1.228)GEN. ACQUISITION 0.047 0.027 )0.001
(2.069)� (2.605)� ()0.076)LBO 0.047 0.023 0.137
(5.749)� (3.481)� (4.449)�
REVOLVER )0.014 )0.021 )0.003
()2.105)� ()3.791)� ()0.220)TERM 0.008 )0.014 0.048
(1.171) ()2.460)� (2.974)�
UPFRONT FEES 1.449 1.742 2.988
(5.515)� (8.548)� (4.118)�
N 3050 1848 1181R)2 0.7101 0.6852 0.4195SUM OF SQUARES 128.189 31.267 42.504Mean Spread 14.0433�
CHOW TEST F(18,3039)
This table shows the determinants of the ex ante yield on HLT loans to test for a parametric shift after dereg-
ulation of HLT lending. The dependent variable is the ex ante premium or credit spread as a percentage of the
benchmark rate index. The independent variables re¯ect loan size, maturity, collateral, syndication, loan purpose
and type, lender role and size and rating.* Indicates signi®cance at 5%.** Indicates signi®cance at 10%.
L.A. Angbazo et al. / Journal of Banking & Finance 22 (1998) 1249±1282 1279

bond market and junk bond market has been positive, but signi®cantly lessthan unity; indicating that pricing in the HLT loan and corporate bond mar-kets diverge. Interestingly, we ®nd that over the whole sample period that loanyields are more sensitive to movements in investment grade bond (Baa) yieldspreads than junk bond yield spreads.
Our study also ®nds several other important borrower quality characteristicsthat are important determinants of HLT loan spreads. In particular, there isevidence that lenders augment, rather than substitute, loan yield spreads withadditional fees for syndication, commitment and cancellation risks. Moreover,syndicated loans have lower yield spreads and spreads are further lowered bythe presence of a lead lender who retains a large share (and thus retains broadmonitoring responsibilities).
The use of loan proceeds are also important determinants of HLT loanspreads. Speci®cally, loans for acquisitions and debt restructurings have rela-tively larger yield spreads to compensate for immediacy (i.e., transactions thatrequire quick ®nancing), and for increased borrower leverage. Term loans whichare generally larger in size and have longer maturities also have larger yieldspreads than revolving loan facilities. We also found that secured loans generatehigher expected yields, con®rming the view that more risky loans require col-lateral to be pledged. Finally, HLT spreads on average appear to have fallen inthe post-July 1992 (deregulation period) and to be relatively more closely linkedto movements in junk bond yield than in the pre-July 1992 period.
Acknowledgements
We thank Ed Altman and Manju Puri for useful comments and suggestions,Martin Fridson for providing data on Merrill Lynch All High-Yield-Bonds,Beverly Christenson and Christopher Balian for valuable research assistance.All remaining errors are ours. LAA gratefully acknowledges ®nancial supportfrom the Center for International Business Education and Research (CIBER),Purdue University.
Appendix A
Assume loan pricing is determined by the following linear pricing equation:
yi � xibi � zic� ei; �A:1�
where bi � N�b; r2b�, and bi is uncorrelated with xi and zi. Under the above
condition, the OLS estimator,
1280 L.A. Angbazo et al. / Journal of Banking & Finance 22 (1998) 1249±1282

�̂ � b̂
c
!� ��X Z�0 �X Z��ÿ1�X Z�0Y �A:2�
is an unbiased estimator ofbc
� �.
Proof.
E��̂ � � E��X Z�0�X Z��ÿ1�X Z�0 �X Z� b
c
!� e
!�
x1�b1 ÿ b�...
xN �bN ÿ b�
26643775
26643775
� b
c
!� E��X Z�0�X Z��ÿ1�X Z�
x1�b1 ÿ b�...
xN �bN ÿ b�
26643775
� b
c
!� �X Z�0�X Z�ÿ1�X Z�0
Ex1�b1 ÿ b�...
ExN �bN ÿ b�
26643775
� b
c
!: �A:3�
By the same token, it is also easy to show that under fairly general assump-tions, the above OLS estimator is also consistent.
References
Berger, A., Udell, G., 1992. Some evidence on the empirical signi®cance of credit rationing. Journal
of Political Economy 100 (5), 1047±1077.
Berk, J., 1995. A critique of size-related anomalies. Review of Financial Studies 8, 275±286.
Bhattacharya, S., Thakor, A.V., 1993. Contemporary banking theory. Journal of Financial
Intermediation 3, 2±50.
Boardman, C.M., McEnally, R.W., 1981. Factors a�ecting seasoned corporate bond prices.
Journal of Financial and Quantitative Analysis 16, 207±226.
Carlson, J.H., Fabozzi, F.J., 1992. The Trading and Securitization of Senior Bank Loans. Probus
Publishing Company.
Carey, M. et al., 1994. The economics of private placements: A new look. Financial Markets,
Institutions and Instruments 2 (3).
Diamond, D., 1984. Financial intermediation and delegated monitoring. Review of Economic
Studies 51, 393±414.
Diamond, D., 1991. Monitoring and reputation: The choice between bank loans and directly placed
debt. Journal of Political Economy 99 (4), 689±721.
L.A. Angbazo et al. / Journal of Banking & Finance 22 (1998) 1249±1282 1281

Denis, D., 1990. Defensive changes in corporate payout policy: Share repurchases and special
dividends Journal of Finance 45, 1433±1456.
Fisher, L., 1959. Determinants of risk premiums on corporate bonds. Journal of Political Economy
76, 217±237.
Flannery, M., 1986. Asymmetric information and risky debt maturity choice. Journal of Finance
XLI, 19±37.
Fridson, M.S., 1995. Why the leveraged loan and high yield bond markets must converge. The
Journal of Global High Yield Bond Research, May/June.
James, C., 1987. Some evidence on the uniqueness of bank loans. Journal of Financial Economics,
217±235.
Fama, E., French, K., 1992. The cross-section of expected returns. Journal of Finance 47, 427±465.
Fama, E., French, K., 1995. Size and book-to-market factors in earnings and returns. Journal of
Finance 50, 131±157.
Kracaw, W.A., Zenner, M., 1994. The wealth e�ects of bank ®nancing announcements in highly
leveraged transactions. Working paper, Pennsylvania State University.
Gorton, G.B., Pennacchi, G.G., 1995. Banks and loan sales: Marketing non-marketable assets.
Journal of Monetary Economics 35 (3).
Ho, T., Saunders, A., 1983. Fixed-rate loan commitments, takedown risk, and the dynamics of
hedging with futures. Journal of Financial and Quantitative Analysis 18, 499±516.
Lummer, S.L., McConnell, J.J., 1989. Further evidence on the bank lending process and the capital
market response to the bank loan agreements. Journal of Financial Economics 25, 99±122.
Mei, J., 1993. A semiautoregression approach to arbitrage pricing theory. Journal of Finance 48,
599±620.
Megginson, W.L. et al., 1995, Syndicated loan announcements and the market value of the banking
®rm. Journal of Money, Credit and Banking 27 (2).
Mester, L.J., Saunders, A., 1995. When does the prime rate change. Journal of Banking and
Finance 19, 743±764.
Roberts, G.S., Viscione, J.A., 1984. The impact of seniority and security covenants on bond yields:
A note. Journal of Finance 39, 1597±1602.
Ross, P.H. et al., 1990. HLT bank loans: A new market for relative value investors. Salomon
Brothers High Yield Research.
Saunders, A., 1997. Financial Institution Management: A Modern Perspective. Irwin.
1282 L.A. Angbazo et al. / Journal of Banking & Finance 22 (1998) 1249±1282