credit research foundation research foundation’s statistical benchmarking report statistical...
TRANSCRIPT
Credit Research FoundationBenchmarking Report
Company Report for:
Report Prepared:4/27/2012
The information contained in this report remains the property of the Credit Research Foundation.
No part of this data may be transmitted, photocopied or used in any other form other than as displayed in this report.
Sample Data Company
The Credit Research Foundation (CRF) appreciates Grant Thornton LLP's assistance and sponsorship of this benchmarking project.CRF holds the work that Grant Thornton LLP experts have lent to this effort in high regard, and is grateful for the funding thatbrought the project to completion.
Grant Thornton LLP is the U.S. member firm of Grant Thornton International, one of the six global accounting, tax and business advisoryorganizations. Through member firms in 110 countries, including 49 offices in the United States, the partners and employees of Grant Thornton member firms provide personalized attention and the highest quality service to public and private clients around the globe.Visit Grant Thornton LLP at www.GrantThornton.com.For more information about how Grant Thornton can assist you, please call Mary Ropes, Partner at (212) 542-9630.
Credit Research Foundation’s Statistical Benchmarking Report
Statistical Benchmarking is an important element of the quality process for improving performance. By comparing selected business results among a group of companies, an organization can:
• Determine its relative position within a peer group;• Gather a baseline against which to measure its operations; and• Identify the activities required to raise its organization’s level of performance.
This CRF report analyzes your company's results alongside other company’s data for ease of comparison. In addition, the report also displays the high, low and median result to give you an idea of the performance range.The objective of the Credit Research Foundation in this initiative is three-fold:
(1) Information Clearing House - As a third party organization, CRF's interest is to offer an opportunity for companies to exchange information, benchmark with each other on performance issues and, at the same time, ensure the confidentiality of data.
(2) Communication Link - When data is obtained for a particular group (such as various divisions of a corporation or a special project of an industry group), participating companies are encouraged to discuss with each other the results and potential strategies for improvement. CRF can facilitate that communication.
(3) Education - For those that are new to the benchmarking concept, it is hoped that this report will enhance your understanding of the role of benchmarking and its potential benefit to the credit, collection and accounts receivable functions.
The Role of the Credit Research Foundation We believe this benchmarking study, started by CRF in 1990, is the most comprehensive work produced in this area. CRF has gained expertise in the area of credit, accounts receivable and related disciplines through its broad network of respected and top-level members who have given the Foundation an unrivaled reputation for carrying out research by contributing their time and talent for the benefit of the profession. The purpose of our benchmarking is to help generate a hypothesis of why one organization’s performance is better or worse than another's. This is the first step in improving practices, not the last step in judging them. To this end, our role is to not only to provide statistical information, but to give you information in useful, understandable ways so you can make your practices better. CRF’s benchmarking system deals with statistical information related to business performance. In order for us to be able to provide accurate benchmarks of business performance we need to gather information about individual businesses and aggregate it into a central database. This information may be commercially sensitive and as such we have taken a number of steps to ensure the information is handled appropriately. A key factor in the protection of individual business information is ensuring any statistical data provided for comparisons cannot be used to identify or find information on an individual business. Credit Research Foundation agrees not to disclose to any party (corporation, partnership, proprietorship orindividual) the company name, individual name, address, city, state or zip code of any participant in Credit Research Foundation’s Benchmarking Study.
i
TABLE OF CONTENTSEXECUTIVE SUMMARY 1
II. FINANCIAL PERFORMANCE 3DSO, Best Possible DSO, Average Days Delinquent, Collection Effectiveness Index, Percent Current, Percent AR Greater Than 60 Days, Percent AR Greater Than 180 Days, Gross Bad Debt as % of Sales, Bad Debt Recovery as % of Sales, Net Bad Debt as % of Sales, Deductions as % of AR $, Deductions as % of AR items
III. CUSTOMER METRICS 4Top 10 Customers as % of Sales, Top 20 Customers as % of Sales, Invoice Size, Number of Invoices Per Customer, Number of Active Customers, Primary Customer Type
IV. DEDUCTION METRICS 5Number of Deductions Processed Per Deduction Processing Employee, Deduction Processing Costs as % of Sales, Deduction Turnover, Deductions Salary Per Deductions Employee, Deductions as % of Sales, Deduction Balances Included in AR Portfolio
V. EFFICIENCY METRICS 6Various costs per transaction, employee, salary for Credit/Risk, Cash Application, Collections, Miscellaneous
VI. OUTSOURCING METRICS 10Percent of Workload that is Outsourced for Credit Risk, Cash Application, Collections, Deduction Processing, Other
VII. COST ANALYSIS METRICS 11Collection expenses, Outside Services, Outsourcing, Travel, Occupancy or Rent, IT Systems Depreciation/Amortization and Total Cost as %of Sales, % of FTE Salary Benefits, Per Customer and Per Employee
IX. BUSINESS PRACTICES METRICS 13% of Companies Charging Late Payment Fee, % of Companies that Accept Credit Cards, % of Companies Allowing Anticipation Payment Discount, % of Late Payment Charges Ultimately Collected, Annual $ of Credit Card Sales as % of Sales, Electronic Invoicing, Electronic Payments, Auto Write-off, % of Companies using Auto-cash Systems and Auto-cash Hit Rates, $ Amount Shipped Automatically to New Customers with No Credit Investigation, % of Customers in Highest (Top Third) Risk Category
X. ORGANIZATIONAL STRUCTURE / RESPONSIBILITIES 19Reporting Relationships, Where Various Functions are Primarily Performed within the Organization, Department Responsibilities
XI. SYSTEMS INFORMATION 24AR Systems Used, % of Companies Using Bolt-on Deduction Management and/or Collection Management Systems, Credit Scoring Systems
ii
I. DATA DEMOGRAPHICS 2
XII. YOUR FIRM'S DATA 26
XIII. BENCHMARKING DEFINITIONS AND FORMULAS 31A reiteration of the data that was submitted by your firm for benchmarking
VIII. PERSONNEL COSTS AND VOLUME METRICS SUMMARY 12

EXECUTIVE SUMMARY
AREA PERFORMANCEMEASURE
FIRM’S DATA
ALL INDUSTRIES# Of companies = 287
Sample Group# Of companies = 40
Median Median63.11 30.93 41.82 53.85
FINANCIAL
PERFORMANCE
CUSTOMER
METRICS
DEDUCTION
METRICS
BUSINESS
PRACTICES
DSO (Days Sales Outstanding)
Best Possible DSO
Percent Current
Percent AR Greater Than 60 Days
Gross Bad Debt as % of Sales
Deductions as % of AR ($)
Avg # of invoices per customer
Number of active customers
Deduction Turnover
Deductions processing cost per deduction processed
% of Late Payment Charges Collected
Auto Write-off Per
Auto-cash hit rate per check
% of Customers in Highest Risk Category
24.42 38.25 43.08
YOUR
49.96 24.91 32.43 43.59 16.73 28.49 32.82
79.2% 72.7% 84.4% 93.5% 69.3% 77.6% 79.4%
0.6% 0.4% 1.7% 5.0% 1.0% 1.4% 4.7%
1.0396% 0.0172% 0.0602% 0.1373% 0.0649% 0.1077% 0.1574%
0.039% 0.494% 1.853% 4.904% 0.014% 0.683% 9.605%
450 1,500 5,126 383 5,690 9,150
1.92 4.18 7.21 13.21 2.13 4.98 6.70
$0.42 $5.76 $14.62 $57.16 $0.61 $28.33 $88.38
97% 21% 45% 72% 97%
$25N/A
$10$10
$25$50
$75$100 $20
$25$50 $55
N/A 46% 70% 84% 36% 80% 88%
2% 5% 10% 20% 1% 3% 3%
CheckInvoice
10,528
Accounts Receivable Turnover 5.78 11.778.736.75 12.329.566.36
Lower Upper Lower Upper
12 24 61 152 12 27 55
Quartile Quartile Quartile Quartile
1
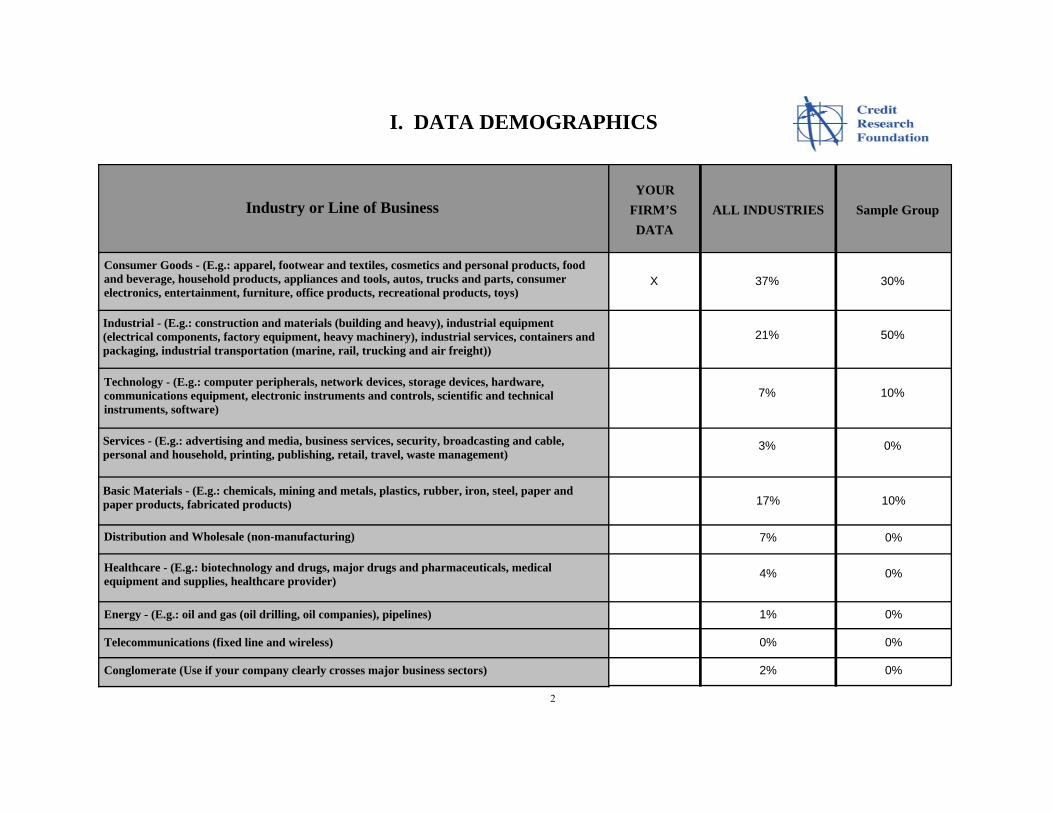
I. DATA DEMOGRAPHICS
2
Consumer Goods - (E.g.: apparel, footwear and textiles, cosmetics and personal products, food and beverage, household products, appliances and tools, autos, trucks and parts, consumer electronics, entertainment, furniture, office products, recreational products, toys)
Industrial - (E.g.: construction and materials (building and heavy), industrial equipment (electrical components, factory equipment, heavy machinery), industrial services, containers and packaging, industrial transportation (marine, rail, trucking and air freight))
Technology - (E.g.: computer peripherals, network devices, storage devices, hardware, communications equipment, electronic instruments and controls, scientific and technical instruments, software)
Services - (E.g.: advertising and media, business services, security, broadcasting and cable, personal and household, printing, publishing, retail, travel, waste management)
Basic Materials - (E.g.: chemicals, mining and metals, plastics, rubber, iron, steel, paper and paper products, fabricated products)
Distribution and Wholesale (non-manufacturing)
FIRM’S DATA
YOURALL INDUSTRIES Sample GroupIndustry or Line of Business
X 37% 30%
21% 50%
7% 10%
3% 0%
17% 10%
7% 0%
4% 0%
1% 0%
0% 0%
2% 0%
Healthcare - (E.g.: biotechnology and drugs, major drugs and pharmaceuticals, medical equipment and supplies, healthcare provider)
Energy - (E.g.: oil and gas (oil drilling, oil companies), pipelines)
Telecommunications (fixed line and wireless)
Conglomerate (Use if your company clearly crosses major business sectors)
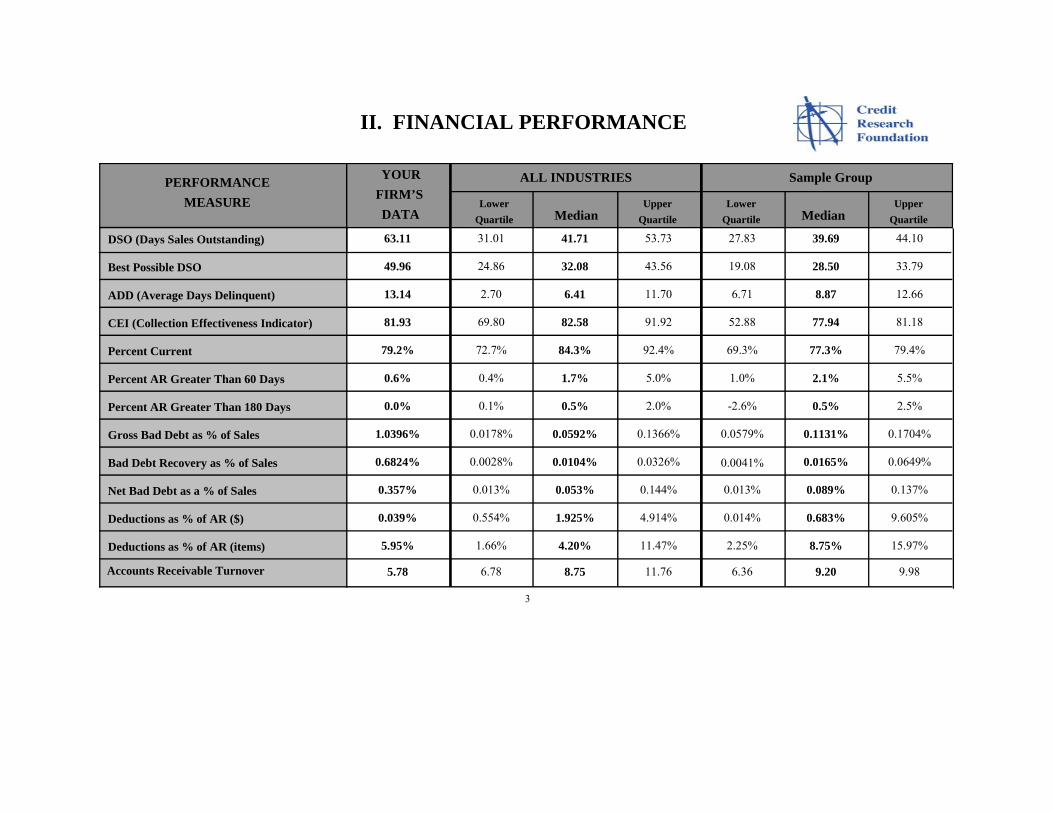
II. FINANCIAL PERFORMANCE
DSO (Days Sales Outstanding)
Best Possible DSO
ADD (Average Days Delinquent)
CEI (Collection Effectiveness Indicator)
Percent Current
Percent AR Greater Than 60 Days
Percent AR Greater Than 180 Days
Gross Bad Debt as % of Sales
Bad Debt Recovery as % of Sales
Net Bad Debt as a % of Sales
Deductions as % of AR ($)
Deductions as % of AR (items)
PERFORMANCEMEASURE FIRM’S
DATA
YOUR
Median Median
ALL INDUSTRIES Sample Group
63.11 31.01 41.71 53.73 27.83 39.69 44.10
49.96 24.86 32.08 43.56 19.08 28.50 33.79
13.14 2.70 6.41 11.70 6.71 8.87 12.66
81.93 69.80 82.58 91.92 52.88 77.94 81.18
79.2% 72.7% 84.3% 92.4% 69.3% 77.3% 79.4%
0.6% 0.4% 1.7% 5.0% 1.0% 2.1% 5.5%
0.0% 0.1% 0.5% 2.0% -2.6% 0.5% 2.5%
1.0396% 0.0178% 0.0592% 0.1366% 0.0579% 0.1131% 0.1704%
0.6824% 0.0028% 0.0104% 0.0326% 0.0041% 0.0165% 0.0649%
0.357% 0.013% 0.053% 0.144% 0.013% 0.089% 0.137%
0.039% 0.554% 1.925% 4.914% 0.014% 0.683% 9.605%
5.95% 1.66% 4.20% 11.47% 2.25% 8.75% 15.97%
3
Accounts Receivable Turnover 5.78 11.768.756.78 9.989.206.36
Lower Upper Lower UpperQuartile Quartile Quartile Quartile

III. CUSTOMER METRICS
Top 10 customers as % of sales
PERFORMANCEMEASURE FIRM’S
DATA
YOUR
Median Median
ALL INDUSTRIES Sample Group
Top 20 customers as % of sales
Average invoice size
Average number of invoices per customer within 1 year
Number of active customers
60% 30% 51% 70% 36% 52% 60%
82% 40% 68% 82% 48% 70% 78%
$14,653 $1,192 $3,127 $9,220 $1,032 $3,842 $10,309
12 23 59 131 14 27 55
487 1,719 5,452 383 2,685 8,655
Retailers that sell to end consumers (such as dept. stores, chains, grocery, discount “clubs”)
Distributors / Wholesalers / Resellers that are high unit value / low unit volume
Distributors / Wholesalers / Resellers that are low unit value / high unit volume
Contractors / Construction Companies
Manufacturers
Service Providers (telecom, health care, legal, personnel, etc)
FIRM’S DATA
YOURALL INDUSTRIES Sample GroupPERCENT OF RESPONDENTS WHOSE
CUSTOMERS ARE:
X 29%
14%
23%
6%
22%
6%
30%
10%
10%
10%
30%
10%
4
10,528
Lower Upper Lower UpperQuartile Quartile Quartile Quartile
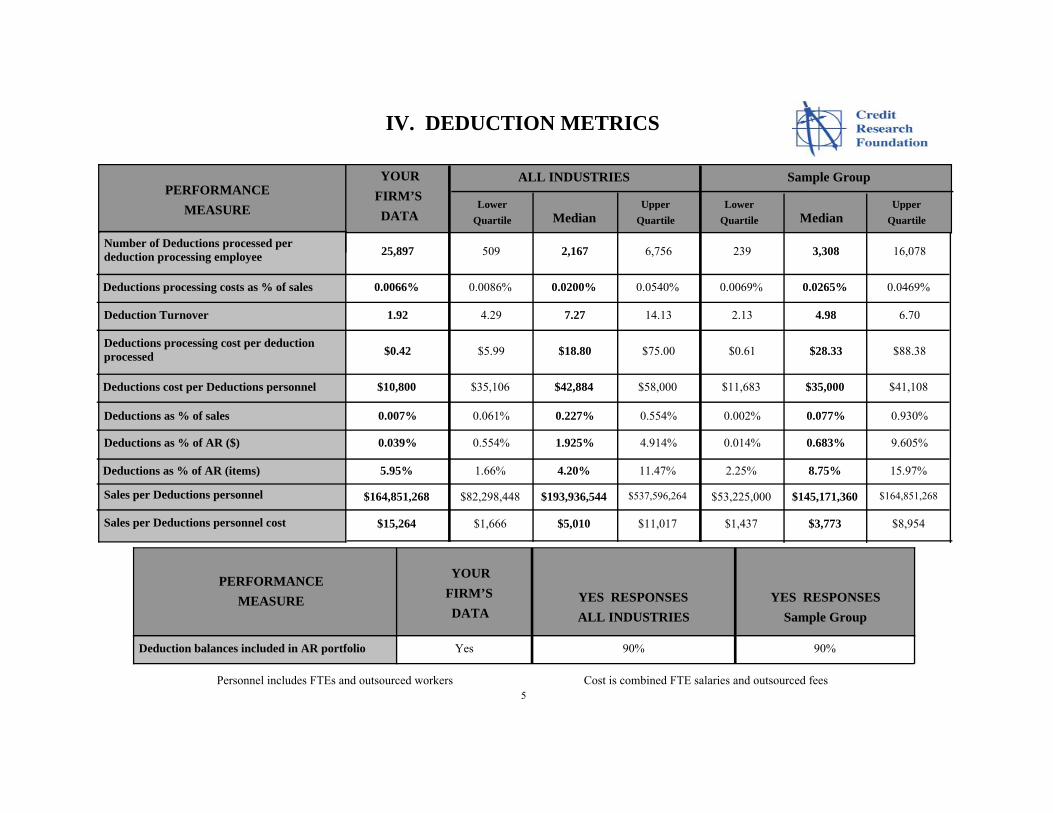
IV. DEDUCTION METRICS
Number of Deductions processed per deduction processing employee
PERFORMANCEMEASURE
FIRM’S DATA
YOUR
Median Median
ALL INDUSTRIES Sample Group
Deductions processing costs as % of sales
Deduction Turnover
Deductions processing cost per deduction processed
Deductions cost per Deductions personnel
25,897 509 2,167 6,756 239 3,308 16,078
0.0066% 0.0086% 0.0200% 0.0540% 0.0069% 0.0265% 0.0469%
1.92 4.29 7.27 14.13 2.13 4.98 6.70
$0.42 $5.99 $18.80 $75.00 $0.61 $28.33 $88.38
$10,800 $35,106 $42,884 $58,000 $11,683 $35,000 $41,108
Deduction balances included in AR portfolio
PERFORMANCEMEASURE FIRM’S
DATA
YOUR
ALL INDUSTRIES Sample GroupYES RESPONSES YES RESPONSES
Yes 90% 90%
5
Deductions as % of sales 0.007% 0.061% 0.227% 0.554% 0.002% 0.077% 0.930%
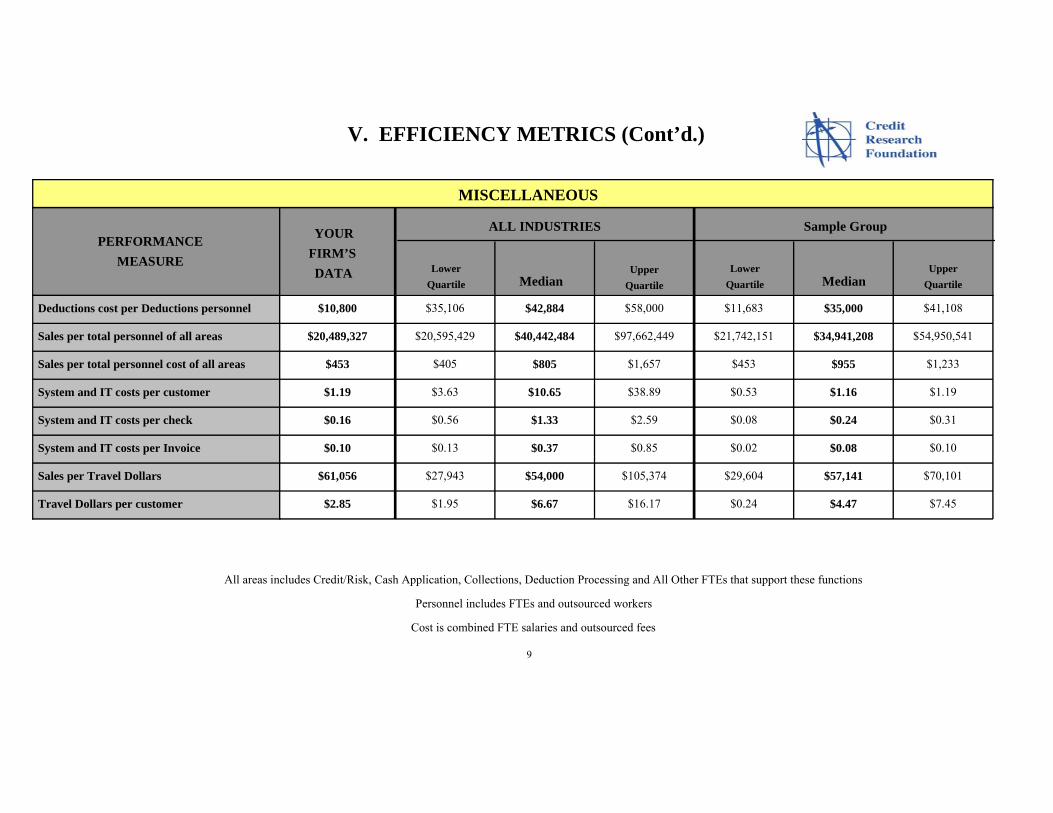
Personnel includes FTEs and outsourced workers Cost is combined FTE salaries and outsourced fees
Lower Upper Lower UpperQuartile Quartile Quartile Quartile
Deductions as % of AR ($)
Deductions as % of AR (items)
0.039% 0.554% 1.925% 4.914% 0.014% 0.683% 9.605%
5.95% 1.66% 4.20% 11.47% 2.25% 8.75% 15.97%
$164,851,268 $82,298,448 $193,936,544 $537,596,264 $53,225,000 $145,171,360 $164,851,268
$15,264 $1,666 $5,010 $11,017 $1,437 $3,773 $8,954
Sales per Deductions personnel
Sales per Deductions personnel cost

V. EFFICIENCY METRICS
CREDIT / RISK
PERFORMANCEMEASURE FIRM’S
DATA
YOUR
Median Median
ALL INDUSTRIES Sample Group
Sales per Credit / Risk personnel
Sales per Credit / Risk personnel cost
Number of customers per Credit / Risk personnel
Credit / Risk cost per Credit / Risk personnel
Credit / Risk cost per customer
$48,202,125 $103,374,346 $254,352,832 $674,433,024 $62,561,994 $493,012,064 $555,986,792
$675 $1,514 $3,507 $7,648 $675 $6,245 $10,281
277 352 1,000 2,685 219 1,146 2,675
$71,434 $50,000 $70,160 $84,526 $47,600 $52,500 $63,400
$258 $25 $58 $196 $10 $50 $58
Personnel includes FTEs and outsourced workers
Cost is combined FTE salaries and outsourced fees
6
Lower Upper Lower UpperQuartile Quartile Quartile Quartile
Credit / Risk cost as % of Sales 0.148% 0.013% 0.029% 0.064% 0.007% 0.027% 0.052%
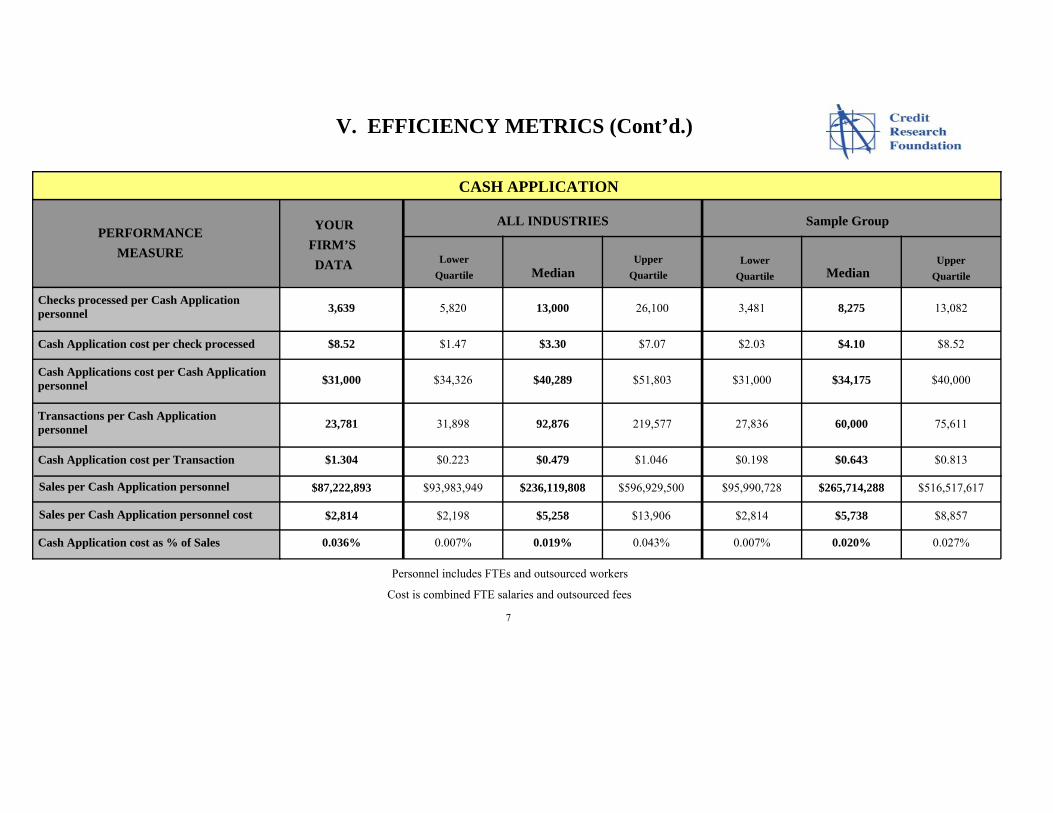
V. EFFICIENCY METRICS (Cont’d.)
Personnel includes FTEs and outsourced workers
Cost is combined FTE salaries and outsourced fees
7
CASH APPLICATION
PERFORMANCEMEASURE FIRM’S
DATA
YOUR
Median Median
ALL INDUSTRIES Sample Group
Checks processed per Cash Application personnel
Cash Application cost per check processed
Cash Applications cost per Cash Application personnel
Transactions per Cash Application personnel
Cash Application cost per Transaction
3,639 5,820 13,000 26,100 3,481 8,275 13,082
$8.52 $1.47 $3.30 $7.07 $2.03 $4.10 $8.52
$31,000 $34,326 $40,289 $51,803 $31,000 $34,175 $40,000
23,781 31,898 92,876 219,577 27,836 60,000 75,611
$1.304 $0.223 $0.479 $1.046 $0.198 $0.643 $0.813
Sales per Cash Application personnel
Sales per Cash Application personnel cost
$87,222,893 $93,983,949 $236,119,808 $596,929,500 $95,990,728 $265,714,288 $516,517,617
$2,814 $2,198 $5,258 $13,906 $2,814 $5,738 $8,857
Lower Upper Lower UpperQuartile Quartile Quartile Quartile
Cash Application cost as % of Sales 0.036% 0.007% 0.019% 0.043% 0.007% 0.020% 0.027%

V. EFFICIENCY METRICS (Cont’d.)
Personnel includes FTEs and outsourced workers
Cost is combined FTE salaries and outsourced fees8
COLLECTIONS
PERFORMANCEMEASURE FIRM’S
DATA
YOUR
Median Median
ALL INDUSTRIES Sample Group
Number of Invoices per Collection personnel
Least number of customers handled by a Collector
Most number of customers handled by a Collector
Number of customers handled per Collection personnel
Sales per Collection personnel
Sales per Collection personnel cost
Collection cost per Collection personnel
Collection cost per customer
8,750 17,956 36,264 103,600 9,813 23,529 42,583
32 105 400 16 150 425
192 450 1,099 110 700 1,614
737 239 667 1,500 139 681 927
$128,217,653 $59,375,170 $132,635,048 $334,166,667 $87,557,518 $128,217,656 $233,689,249
$3,330 $1,271 $2,679 $6,000 $2,188 $2,875 $4,563
$38,500 $39,581 $45,652 $59,586 $32,500 $41,750 $47,600
$52.24 $27.80 $67.00 $179.05 $12.53 $43.17 $99.88
5
3,700
Lower Upper Lower UpperQuartile Quartile Quartile Quartile
Collection cost as % of Sales 0.030% 0.016% 0.037% 0.076% 0.008% 0.036% 0.045%
V. EFFICIENCY METRICS (Cont’d.)
Personnel includes FTEs and outsourced workers
Cost is combined FTE salaries and outsourced fees
9
MISCELLANEOUS
PERFORMANCEMEASURE FIRM’S
DATA
YOUR
Median Median
ALL INDUSTRIES Sample Group
Deductions cost per Deductions personnel
Sales per total personnel of all areas
Sales per total personnel cost of all areas
System and IT costs per customer
System and IT costs per check
System and IT costs per Invoice
Sales per Travel Dollars
Travel Dollars per customer
$10,800 $35,106 $42,884 $58,000 $11,683 $35,000 $41,108
$20,489,327 $20,595,429 $40,442,484 $97,662,449 $21,742,151 $34,941,208 $54,950,541
$453 $405 $805 $1,657 $453 $955 $1,233
$1.19 $3.63 $10.65 $38.89 $0.53 $1.16 $1.19
$0.16 $0.56 $1.33 $2.59 $0.08 $0.24 $0.31
$0.10 $0.13 $0.37 $0.85 $0.02 $0.08 $0.10
$61,056 $27,943 $54,000 $105,374 $29,604 $57,141 $70,101
$2.85 $1.95 $6.67 $16.17 $0.24 $4.47 $7.45
Lower Upper Lower UpperQuartile Quartile Quartile Quartile
All areas includes Credit/Risk, Cash Application, Collections, Deduction Processing and All Other FTEs that support these functions
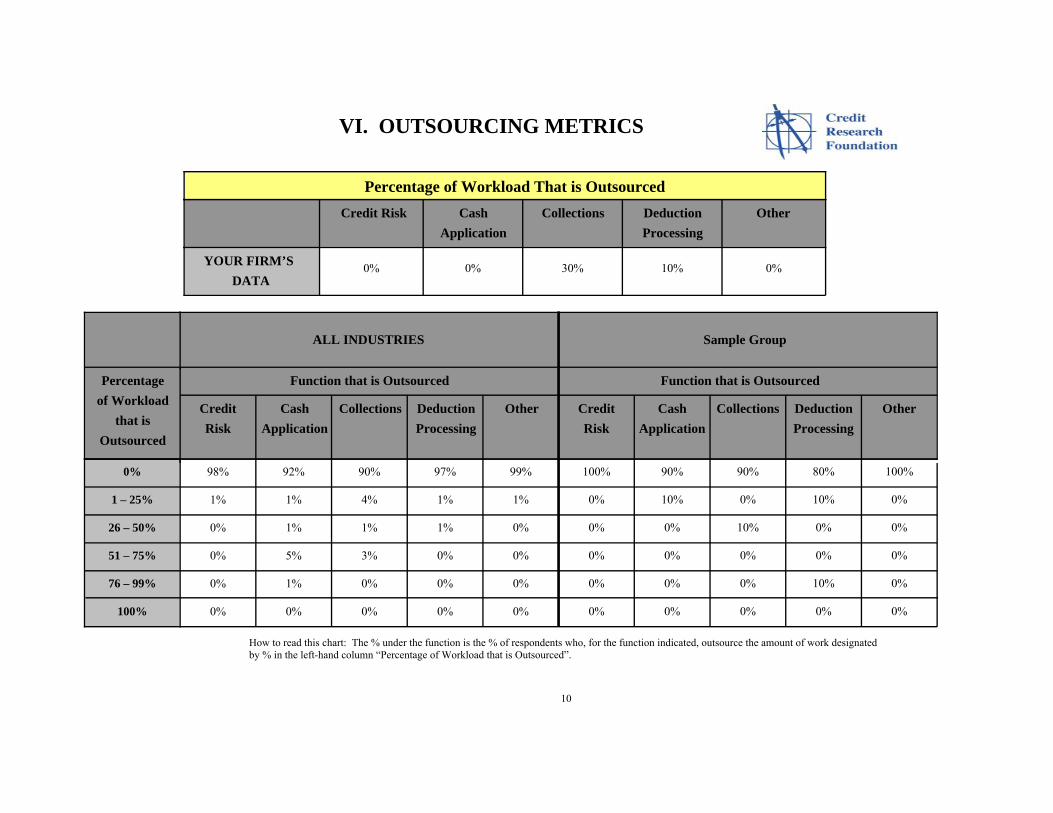
VI. OUTSOURCING METRICS
Percentage of Workload That is Outsourced
YOUR FIRM’S DATA
Credit Risk CashApplication
Collections DeductionProcessing
Other
0% 0% 30% 10% 0%
Function that is Outsourced Function that is Outsourced
Credit CashApplication
Collections DeductionProcessing
OtherRisk
Credit CashApplication
Collections DeductionProcessing
OtherRisk
Percentageof Workload
that isOutsourced
0%
1 – 25%
26 – 50%
51 – 75%
76 – 99%
100%
98%
1%
0%
0%
0%
0%
92%
1%
1%
5%
1%
0%
90%
4%
1%
3%
0%
0%
97%
1%
1%
0%
0%
0%
99%
1%
0%
0%
0%
0%
100%
0%
0%
0%
0%
0%
90%
10%
0%
0%
0%
0%
90%
0%
10%
0%
0%
0%
80%
10%
0%
0%
10%
0%
100%
0%
0%
0%
0%
0%
10
How to read this chart: The % under the function is the % of respondents who, for the function indicated, outsource the amount of work designated by % in the left-hand column “Percentage of Workload that is Outsourced”.
ALL INDUSTRIES Sample Group

VII. COST ANALYSIS METRICS
COST ELEMENT % of Sales % of Personnel Per CustomerCost
Per Personnel
Collection Expenses
Outside Services
Outsourcing
Travel
Occupancy or Rent
IT System Depreciation / Amortization
TOTAL COST
0.0071%
0.0004%
0.0082%
0.0016%
0.0027%
0.5105%
0.0007%
3.21%
0.19%
3.71%
0.74%
1.24%
0.31%
231.12%
$12.35
$0.71
$14.25
$2.85
$4.75
$1.19
$888.11
$1,454
$84
$1,678
$336
$559
$140
$104,590
ALL INDUSTRIES Sample Group
COST ELEMENT % of Sales % of Personnel Per CustomerCost
Per Personnel
Collection Expenses
Outside Services
Outsourcing
Travel
Occupancy or Rent
IT System Depreciation / Amortization
TOTAL COST
0.0040% 3.57% $7.12 $1,667 0.0035% 2.27% $7.64 $736
% of Sales % of Personnel Per CustomerCost
Per Personnel
0.0090%
0.0099%
0.0019%
0.0093%
0.0062%
0.1691%
7.45%
5.43%
1.82%
5.67%
7.14%
117.19%
$21.16
$27.78
$6.67
$9.45
$10.65
$279.71
$3,750
$4,477
$982
$2,850
$2,940
$63,590
0.0098%
0.0117%
0.0018%
0.0015%
0.0027%
0.1332%
12.50%
12.67%
1.25%
1.24%
1.47%
112.50%
$25.53
$95.85
$4.47
$4.75
$1.16
$291.19
$2,682
$6,250
$501
$559
$606
$46,667
Personnel includes FTEs and outsourced workers Cost is combined FTE salaries and outsourced fees11
(Medians)
TOTAL COST includes all above noted cost elements and all other operating expenses
YOUR FIRM’S DATA

VIII. PERSONNEL COSTS AND VOLUME METRICS SUMMARY
Sales per Credit / Risk personnel
PERFORMANCEMEASURE
FIRM’S DATA
YOUR
Median Median
ALL INDUSTRIES Sample Group
Sales per Cash Application personnel
Sales per Collection personnel
Sales per Deductions personnel
No. of customers per Credit / Risk personnel
12
Checks processed per Cash App personnel
Personnel includes FTEs and outsourced workers Cost is combined FTE salaries and outsourced fees
Lower Upper Lower UpperQuartile Quartile Quartile Quartile
Transactions per Cash Application personnel
Number of Invoices per Collection personnel
No. of customers per Collection personnel
Least no. of customers handled by a Collector
$48,202,125 $103,374,346 $254,352,832 $674,433,024 $62,561,994 $493,012,064 $555,986,792
$87,222,893 $93,983,949 $236,119,808 $596,929,500 $95,990,728 $265,714,288 $516,517,617
$128,217,653 $59,375,170 $132,635,048 $334,166,667 $87,557,518 $128,217,656 $233,689,249
$164,851,268 $82,298,448 $193,936,544 $537,596,264 $53,225,000 $145,171,360 $164,851,268
Sales per total personnel of all areas $20,489,327 $20,595,429 $40,442,484 $97,662,449 $21,742,151 $34,941,208 $54,950,541
277 352 1,000 2,685 219 1,146 2,675
3,639 5,820 13,000 26,100 3,481 8,275 13,082
23,781 31,898 92,876 219,577 27,836 60,000 75,611
8,750 17,956 36,264 103,600 9,813 23,529 42,583
737 239 667 1,500 139 681 927
5 32 105 400 16 150 425
Most no. of customers handled by a Collector 3,700 192 450 1,099 110 700 1,614
No. of Deductions per deduction employee 25,897 509 2,167 6,756 239 3,308 16,078
Credit / Risk cost per Credit / Risk personnel $71,434 $50,000 $70,160 $84,526 $47,600 $52,500 $63,400
Cash App cost per Cash Application personnel $31,000 $34,326 $40,289 $51,803 $31,000 $34,175 $40,000
Collection cost per Collection personnel
Deductions cost per Deductions personnel
Total Personnel cost per total personnel
$38,500 $39,581 $45,652 $59,586 $32,500 $41,750 $47,600
$10,800 $35,106 $42,884 $58,000 $11,683 $35,000 $41,108
$45,253 $41,758 $49,778 $62,571 $36,875 $42,043 $45,253
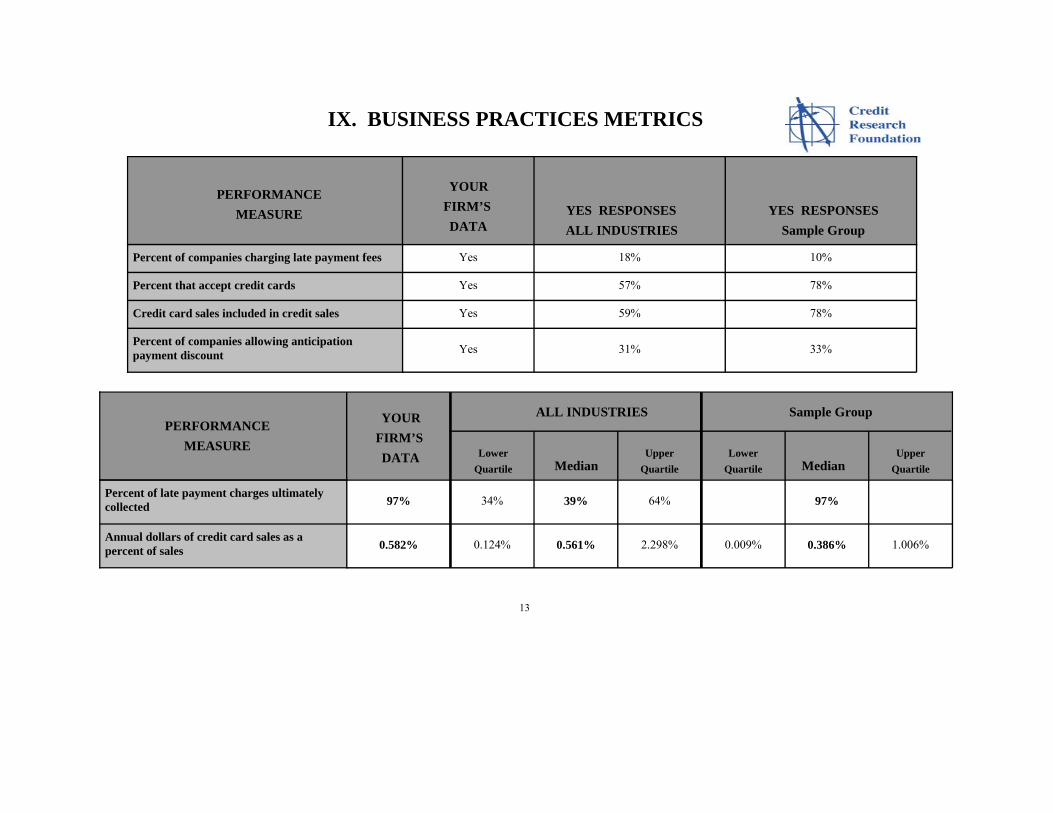
IX. BUSINESS PRACTICES METRICS
PERFORMANCEMEASURE FIRM’S
DATA
YOUR
ALL INDUSTRIES Sample GroupYES RESPONSES YES RESPONSES
Percent of companies charging late payment fees
Percent that accept credit cards
Credit card sales included in credit sales
Percent of companies allowing anticipation payment discount
Yes 18% 10%
Yes 57% 78%
Yes 59% 78%
Yes 31% 33%
PERFORMANCEMEASURE FIRM’S
DATA
YOUR
Median Median
ALL INDUSTRIES Sample Group
Percent of late payment charges ultimately collected
Annual dollars of credit card sales as a percent of sales
97% 34% 39% 64% 97%
0.582% 0.124% 0.561% 2.298% 0.009% 0.386% 1.006%
13
Lower Upper Lower UpperQuartile Quartile Quartile Quartile

IX. BUSINESS PRACTICES METRICS (Cont’d.)
YOUR FIRM’S DATA
Using % Electronic versus paper
Volume has Increased in last 12 months
Electronic Invoicing
Electronic Payments(Wire transfers, EFT)
Yes 32% Yes
Yes 20% Yes
Electronic Invoicing
Electronic Payments(Wire transfers, EFT)
ALL INDUSTRIES Sample Group
Using % Electronic versus paper
Volume has Increased in
81% 30% 73% 80% 32% 56%
99% 18% 68% 100% 25% 70%
last 12 months
Using % Electronic versus paper
Volume has Increased in
last 12 months
14Electronic Invoicing is any method of non-paper invoicing

IX. BUSINESS PRACTICES METRICS (Cont’d.)
YOUR FIRM’S DATA
AUTO WRITE-OFFPOLICIES
$ Per Check % of Check
$ Per Invoice % of Invoice
Yes $25 N/A
N/A 2%
ALL INDUSTRIES Sample Group
15
% WITHAUTO
WRITE-OFFPOLICIES
% WITHAUTO
WRITE-OFFPOLICIES
78% $10 $38 $100 0% 0% 1%
$10 $50 $100 0% 1% 3%
80% $38 10%
$50 $50 $55 2%
$ Per Check % of Check $ Per Check % of Check
$ Per Invoice % of Invoice $ Per Invoice % of Invoice
Median Median Median MedianLower Upper Lower UpperQuartile Quartile Quartile Quartile
Lower UpperQuartile Quartile
Lower UpperQuartile Quartile
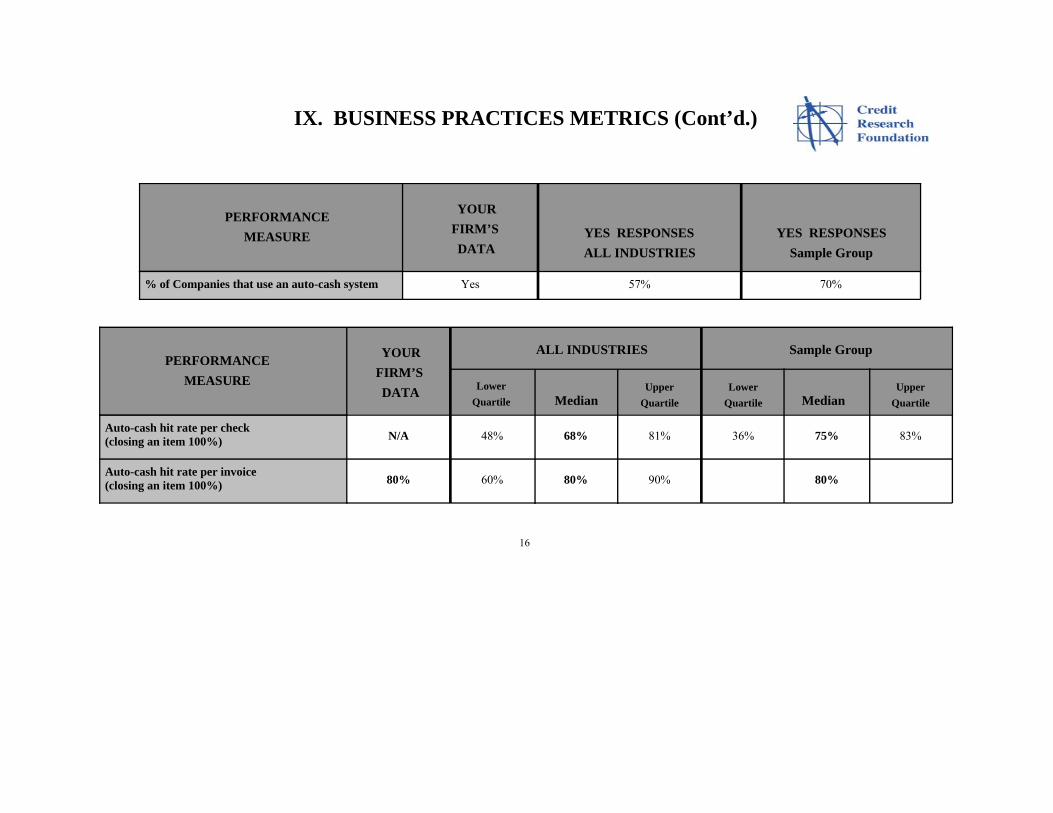
IX. BUSINESS PRACTICES METRICS (Cont’d.)
% of Companies that use an auto-cash system
PERFORMANCEMEASURE FIRM’S
DATA
YOUR
ALL INDUSTRIES Sample GroupYES RESPONSES YES RESPONSES
Yes 57% 70%
PERFORMANCEMEASURE FIRM’S
DATA
YOUR
Median Median
ALL INDUSTRIES Sample Group
Auto-cash hit rate per check (closing an item 100%)
Auto-cash hit rate per invoice (closing an item 100%)
16
N/A 48% 68% 81% 36% 75% 83%
80% 60% 80% 90% 80%
Lower Upper Lower UpperQuartile Quartile Quartile Quartile
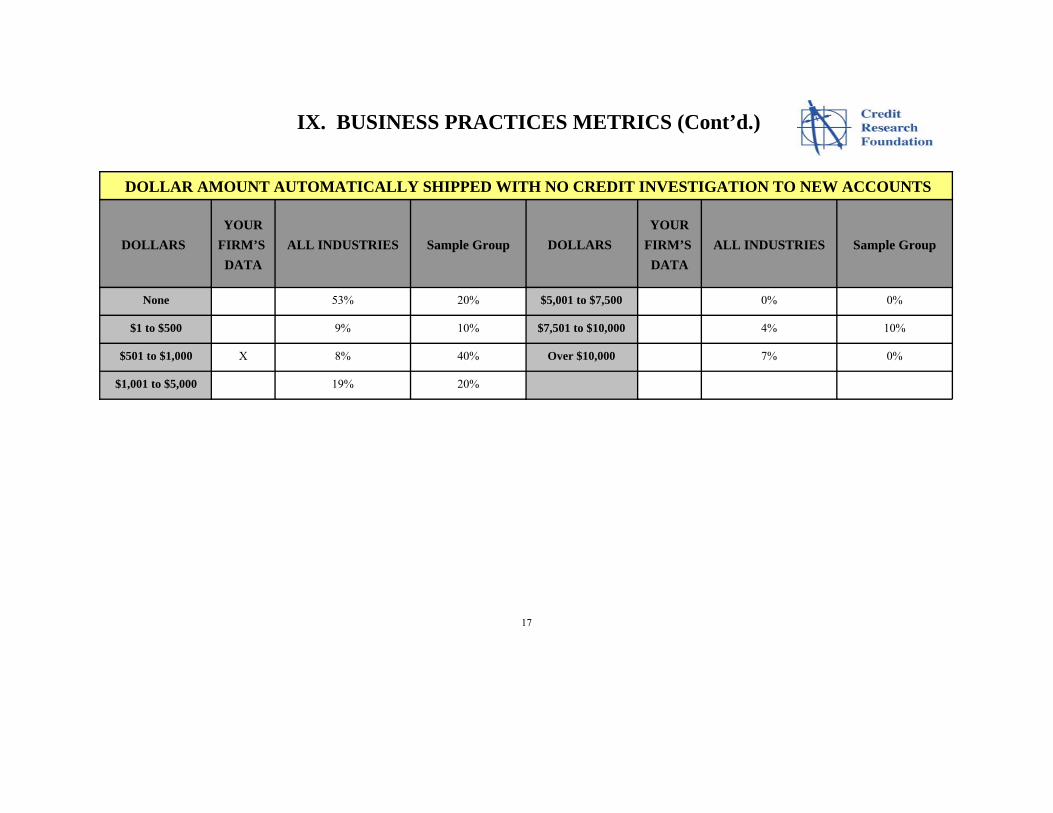
IX. BUSINESS PRACTICES METRICS (Cont’d.)
DOLLAR AMOUNT AUTOMATICALLY SHIPPED WITH NO CREDIT INVESTIGATION TO NEW ACCOUNTS
FIRM’S DATA
YOURFIRM’S DATA
YOURDOLLARS DOLLARS ALL INDUSTRIES Sample Group
None
$1 to $500
$501 to $1,000
$1,001 to $5,000
$5,001 to $7,500
$7,501 to $10,000
Over $10,000
17
ALL INDUSTRIES Sample Group
X
9%
8%
19%
0%
4%10%
40%
20%
0%
10%
53% 20%
7% 0%
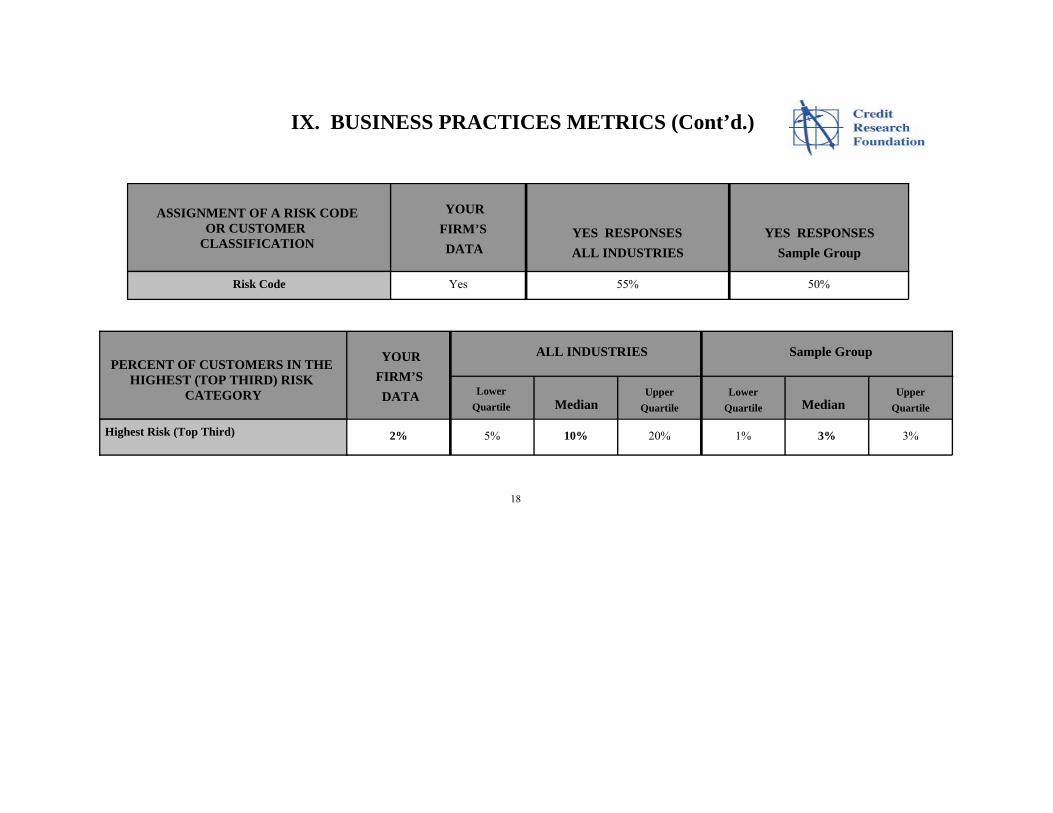
IX. BUSINESS PRACTICES METRICS (Cont’d.)
Risk Code
ASSIGNMENT OF A RISK CODEOR CUSTOMER
CLASSIFICATIONFIRM’S DATA
YOUR
ALL INDUSTRIES Sample GroupYES RESPONSES YES RESPONSES
Yes 55% 50%
PERCENT OF CUSTOMERS IN THE HIGHEST (TOP THIRD) RISK
CATEGORYFIRM’S DATA
YOUR
Median Median
ALL INDUSTRIES Sample Group
Highest Risk (Top Third) 2% 5% 10% 20% 1% 3% 3%
18
Lower Upper Lower UpperQuartile Quartile Quartile Quartile

X. ORGANIZATIONAL STRUCTURE / RESPONSIBILITIES
YOUR FIRM’S DATAREPORTING TO
Controller Treasurer CustomerService
VP Sales /Marketing
Chief ARExecutive
VP Finance /CFO
Chief CreditExecutive
CompanyPresident
Other
Chief Credit Executive
Chief AR Executive
X
X
REPORTING TO
Controller Treasurer CustomerService
VP Sales /Marketing
Chief ARExecutive
VP Finance /CFO
Chief CreditExecutive
CompanyPresident
Other
Chief Credit Executive
Chief AR Executive
Chief Credit Executive
Chief AR Executive
19
ALL INDUSTRIES
Sample Group
23% 19% 0% 0% 1% 39% 4% 12%
28% 11% 2% 0% 28% 14% 2% 13%
20% 20% 10% 0% 0% 20% 10% 20%
30% 10% 10% 0% 20% 10% 0% 20%

X. ORGANIZATIONAL STRUCTURE / RESPONSIBILITIES (Cont’d.)
WHERE THE FOLLOWING FUNCTIONS ARE PRIMARILY PERFORMED
Order Processing
Billing
Credit
HeadquartersShared
Business Unit (Decentralized)
Regional Office Plant / Facility Outsourced Other
Collections
YOUR FIRM'S DATA
ALL INDUSTRIES
Sample Group
X
YOUR FIRM'S DATA
ALL INDUSTRIES
Sample Group
YOUR FIRM'S DATA
ALL INDUSTRIES
Sample Group
YOUR FIRM'S DATA
ALL INDUSTRIES
Sample Group
20
47% 7% 30% 5% 9% 0% 1%
60% 10% 0% 20% 10% 0% 0%
X
60% 14% 16% 2% 7% 1% 0%
60% 10% 10% 0% 20% 0% 0%
X
73% 16% 5% 3% 3% 0% 0%
80% 10% 0% 0% 10% 0% 0%
X
67% 12% 13% 4% 3% 1% 0%
70% 10% 0% 10% 10% 0% 0%
(Centralized)Services
(Consolidated)FUNCTION

X. ORGANIZATIONAL STRUCTURE / RESPONSIBILITIES (Cont’d.)
WHERE THE FOLLOWING FUNCTIONS ARE PRIMARILY PERFORMED
Customer Payments
(Cash Applications)
Dispute Resolution
Customer Data
Management
Business Unit (Decentralized)
Regional Office Plant / Facility Outsourced Other
YOUR FIRM'S DATA
ALL INDUSTRIES
Sample Group
YOUR FIRM'S DATA
ALL INDUSTRIES
Sample Group
YOUR FIRM'S DATA
ALL INDUSTRIES
Sample Group
21
X
68% 18% 7% 2% 3% 1% 1%
70% 20% 0% 0% 10% 0% 0%
X
55% 9% 23% 6% 5% 1% 0%
50% 10% 10% 10% 10% 10% 0%
X
67% 12% 14% 3% 3% 0% 0%
80% 10% 0% 0% 10% 0% 0%
HeadquartersShared
(Centralized)Services
(Consolidated)FUNCTION

X. ORGANIZATIONAL STRUCTURE / RESPONSIBILITIES (Cont’d.)
% Reporting Area ResponsibleCredit, Accounting, AR,
Finance, Treasury Operations, Logistics Sales, Marketing
FIRM’S
DATA
YOUR
ALL INDUSTRIES Sample Group
Maintain Customer Master File (Database)
FIRM’S
DATA
YOUR
ALL INDUSTRIES Sample Group FIRM’S
DATA
YOUR
ALL INDUSTRIES Sample Group
Customer Analysis and Investigation
Approval or establishment of credit lines
Enforcement of credit lines
Routine Collections
Cash Application
G/L Entries (if not automated)
Deduction research
Deduction collection
22
TASK
54% 44% 20% 11% X 27% 44%
X
X
X
X
X
X
X
X
95% 2% 3%
100% 0% 0%
99% 1% 0%
93% 2% 5%
99% 1% 0%
97% 2% 0%
63% 16% 21%
87% 6% 7%
100% 0% 0%
100% 0% 0%
100% 0% 0%
89% 0% 11%
89% 11% 0%
89% 11% 0%
50% 13% 38%
88% 0% 13%
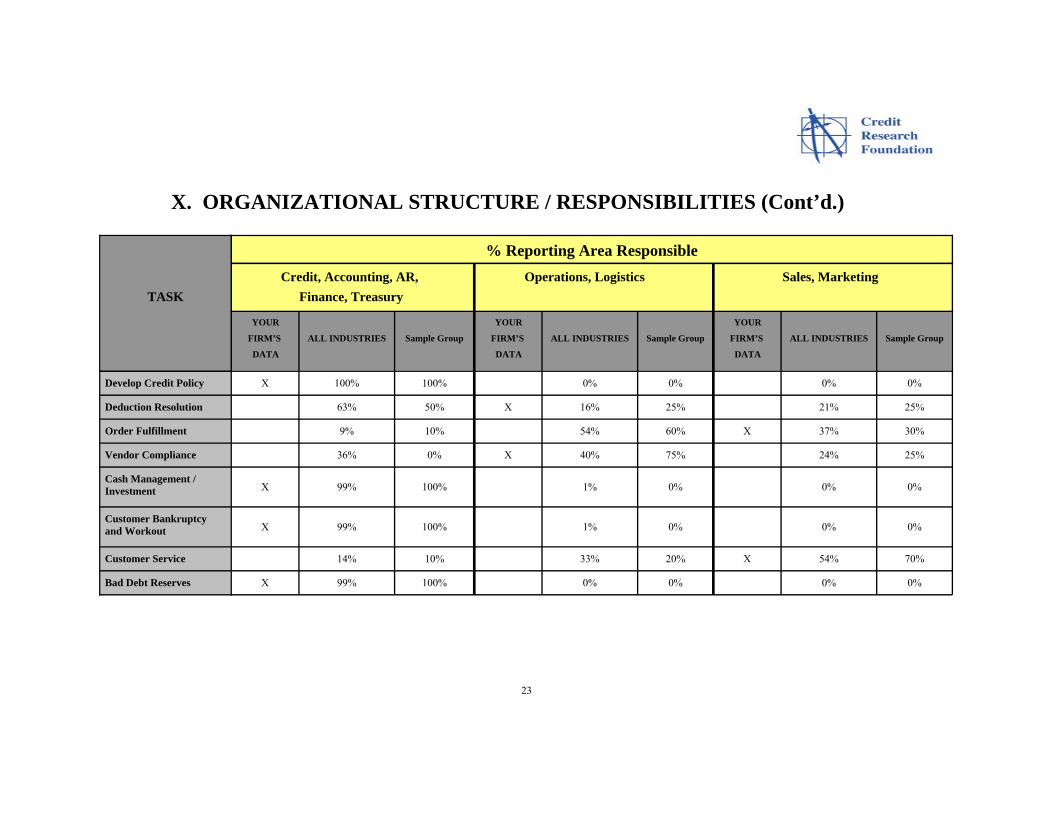
X. ORGANIZATIONAL STRUCTURE / RESPONSIBILITIES (Cont’d.)
23
% Reporting Area ResponsibleCredit, Accounting, AR,
Finance, TreasuryOperations, Logistics Sales, Marketing
FIRM’S
DATA
YOUR
ALL INDUSTRIES Sample Group
Develop Credit Policy
FIRM’S
DATA
YOUR
ALL INDUSTRIES Sample Group FIRM’S
DATA
YOUR
ALL INDUSTRIES Sample Group
TASK
Deduction Resolution
Order Fulfillment
Vendor Compliance
Cash Management / Investment
Customer Bankruptcy and Workout
Customer Service
Bad Debt Reserves
X
X
X
X
X
X
X
X
63% 16% 21%
36% 40% 24%
99% 1% 0%
99% 1% 0%
14% 33% 54%
99% 0% 0%
100% 0% 0%
9% 54% 37%
50% 25% 25%
0% 75% 25%
100% 0% 0%
100% 0% 0%
10% 20% 70%
100% 0% 0%
100% 0% 0%
10% 60% 30%
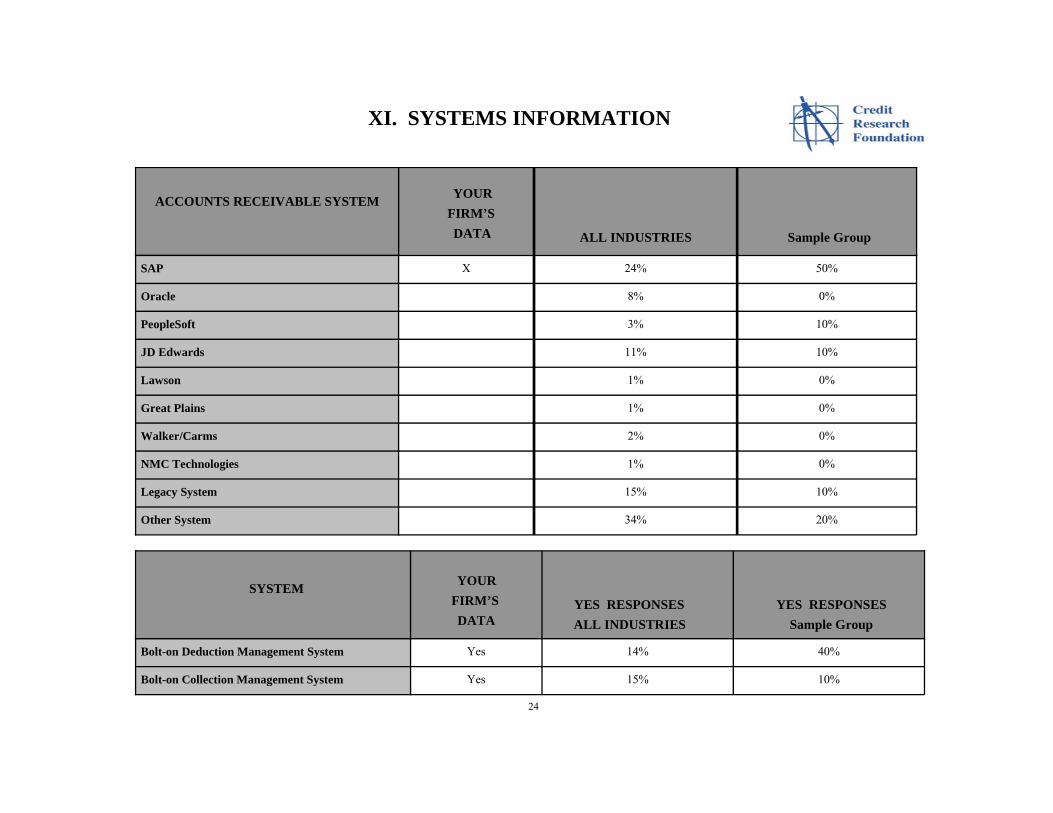
XI. SYSTEMS INFORMATION
SAP
ACCOUNTS RECEIVABLE SYSTEMFIRM’S DATA
YOUR
ALL INDUSTRIES Sample Group
Oracle
PeopleSoft
JD Edwards
Lawson
Great Plains
Walker/Carms
NMC Technologies
Legacy System
Other System
X 24% 50%
8% 0%
3% 10%
11% 10%
1% 0%
1% 0%
2% 0%
1% 0%
15% 10%
34% 20%
SYSTEMFIRM’S DATA
YOUR
ALL INDUSTRIES Sample GroupYES RESPONSES YES RESPONSES
Bolt-on Deduction Management System
Bolt-on Collection Management System
Yes 14% 40%
Yes 15% 10%
24
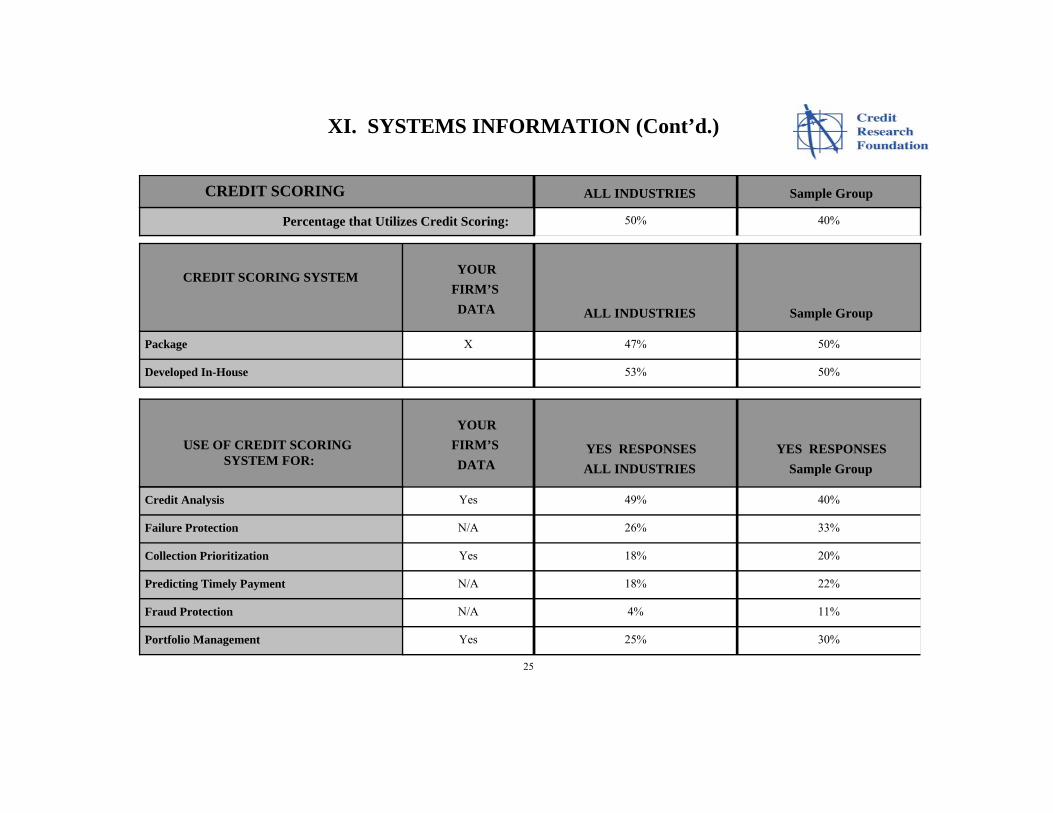
XI. SYSTEMS INFORMATION (Cont’d.)
CREDIT SCORING SYSTEMFIRM’S DATA
YOUR
ALL INDUSTRIES Sample Group
Package
Developed In-House
X 47% 50%
53% 50%
USE OF CREDIT SCORING SYSTEM FOR:
FIRM’S DATA
YOUR
ALL INDUSTRIES Sample Group
Credit Analysis
Failure Protection
YES RESPONSES YES RESPONSES
Collection Prioritization
Predicting Timely Payment
Fraud Protection
Portfolio Management
25
Yes 49% 40%
N/A 26% 33%
Yes 18% 20%
N/A 18% 22%
N/A 4% 11%
Yes 25% 30%
50% 40%
CREDIT SCORING ALL INDUSTRIES Sample Group
Percentage that Utilizes Credit Scoring:

Industry or Line of Business Consumer Goods
Primary SIC
SIC Code 2
SIC Code 3
SIC Code 4
SIC Code 5
SIC Code 6
Are you willing to discuss your results with other CRF members
Yes
Your company’s primary source of revenue comes from customers who are:
Retailers that sells to end consumers
Your primary system for managing the A/R cash application:
SAP
Where is the Order Processing function primarily performed within your organization
Where is the Billing function primarily performed within your organization
Where is the Credit function primarily performed within your organization
Where is the Collections function primarily performed within your organization
Where is the Customer Payments function primarily performed within your organization
Where is the Dispute Resolution function primarily performed within your organization
Where is the Customer Data Management function primarily performed within your organization
Shared Services
Shared Services
Headquarters
Headquarters
Shared Services
Shared Services
Headquarters
YOUR FIRM'S DATA
XII. YOUR FIRM'S DATA
Month and Year of the reported data
1 2004
Beginning Gross Receivables
Annual Credit Sales
Ending Gross Total Receivables
Ending Total A/R of Deductions ONLY
463,240,009
1,831,680,752
316,700,650
125,000
26
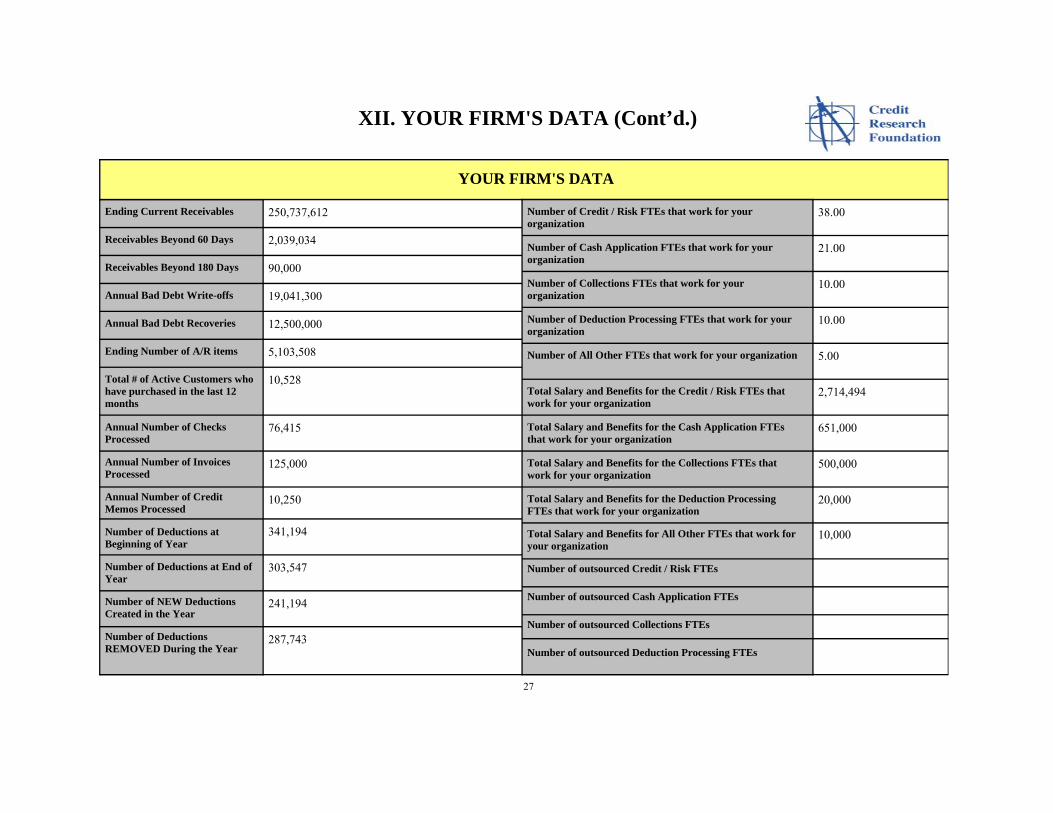
XII. YOUR FIRM'S DATA (Cont’d.)
Ending Current Receivables
Receivables Beyond 60 Days
Receivables Beyond 180 Days
Annual Bad Debt Write-offs
Annual Bad Debt Recoveries
Ending Number of A/R items
Total # of Active Customers who have purchased in the last 12 months
Annual Number of Checks Processed
Annual Number of Invoices Processed
Annual Number of Credit Memos Processed
Number of Deductions at Beginning of Year
Number of Deductions at End of Year
Number of NEW Deductions Created in the Year
Number of Deductions REMOVED During the Year
Number of Credit / Risk FTEs that work for your organization
Number of Cash Application FTEs that work for your organization
Number of Collections FTEs that work for your organization
Number of Deduction Processing FTEs that work for your organization
Number of All Other FTEs that work for your organization
Total Salary and Benefits for the Credit / Risk FTEs that work for your organization
Total Salary and Benefits for the Cash Application FTEs that work for your organization
Total Salary and Benefits for the Collections FTEs that work for your organization
Total Salary and Benefits for the Deduction Processing FTEs that work for your organization
250,737,612
2,039,034
90,000
19,041,300
12,500,000
5,103,508
10,528
76,415
125,000
10,250
341,194
303,547
241,194
287,743
38.00
21.00
10.00
10.00
5.00
2,714,494
651,000
500,000
20,000
Total Salary and Benefits for All Other FTEs that work for your organization
YOUR FIRM'S DATA
Number of outsourced Credit / Risk FTEs
Number of outsourced Cash Application FTEs
Number of outsourced Collections FTEs
Number of outsourced Deduction Processing FTEs
10,000
27
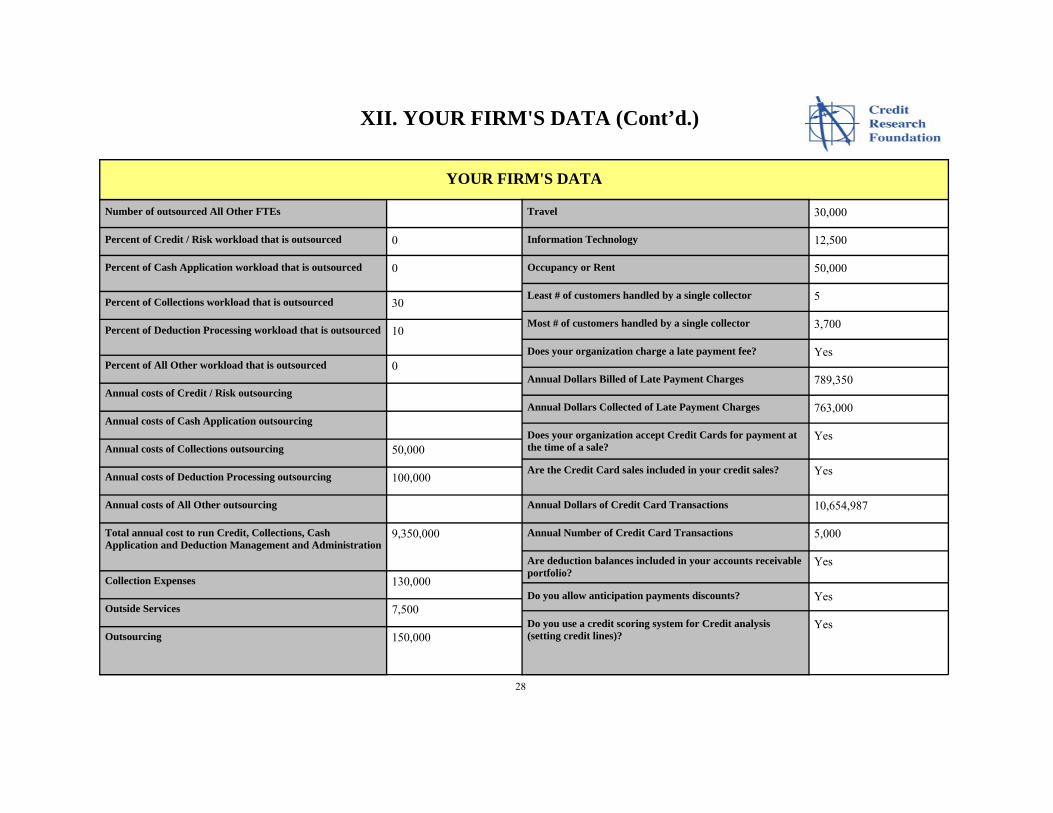
XII. YOUR FIRM'S DATA (Cont’d.)
28
YOUR FIRM'S DATA
Number of outsourced All Other FTEs
Percent of Credit / Risk workload that is outsourced
Percent of Cash Application workload that is outsourced
Percent of Collections workload that is outsourced
Percent of Deduction Processing workload that is outsourced
Percent of All Other workload that is outsourced
Annual costs of Credit / Risk outsourcing
Annual costs of Cash Application outsourcing
Annual costs of Collections outsourcing
Annual costs of Deduction Processing outsourcing
Annual costs of All Other outsourcing
Total annual cost to run Credit, Collections, Cash Application and Deduction Management and Administration
Collection Expenses
Outside Services
Outsourcing
Travel
Information Technology
Occupancy or Rent
Least # of customers handled by a single collector
Most # of customers handled by a single collector
Does your organization charge a late payment fee?
Annual Dollars Billed of Late Payment Charges
Annual Dollars Collected of Late Payment Charges
Does your organization accept Credit Cards for payment at the time of a sale?
Are the Credit Card sales included in your credit sales?
Annual Dollars of Credit Card Transactions
Annual Number of Credit Card Transactions
Are deduction balances included in your accounts receivable portfolio?
Do you allow anticipation payments discounts?
Do you use a credit scoring system for Credit analysis (setting credit lines)?
0
0
30
10
0
50,000
100,000
9,350,000
130,000
7,500
150,000
30,000
12,500
50,000
5
3,700
Yes
789,350
763,000
Yes
Yes
10,654,987
5,000
Yes
Yes
Yes
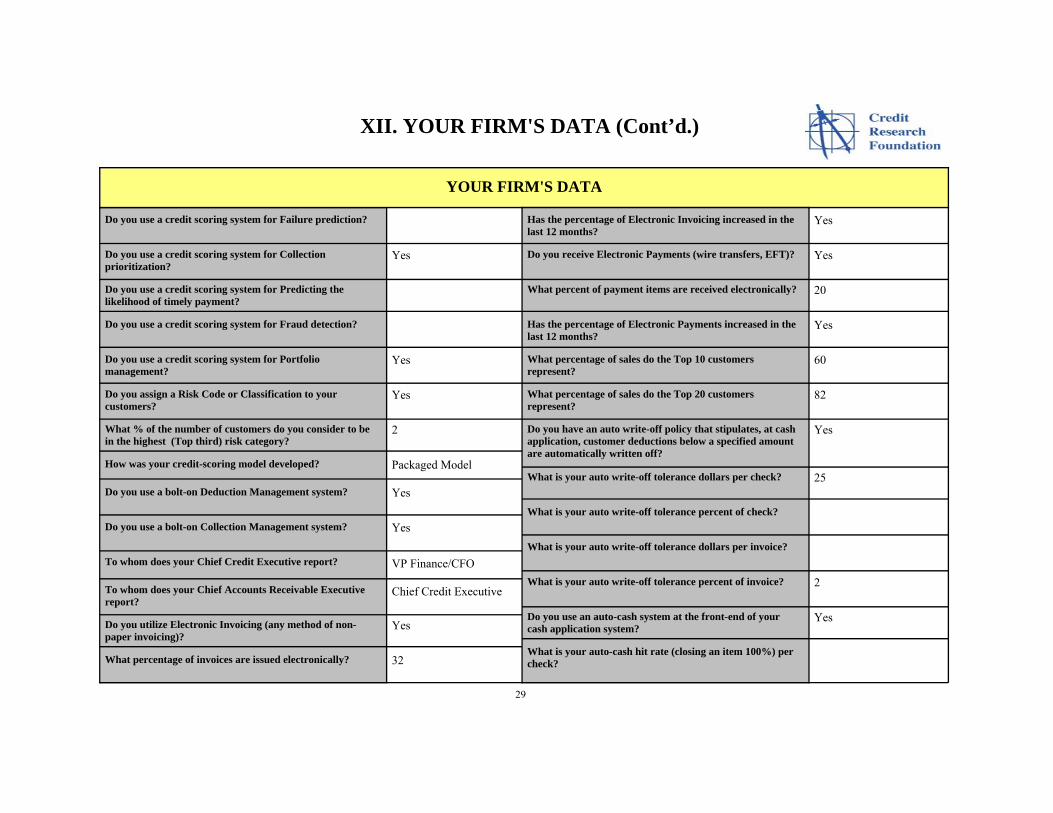
XII. YOUR FIRM'S DATA (Cont’d.)
YOUR FIRM'S DATA
Do you use a credit scoring system for Failure prediction?
Do you use a credit scoring system for Collection prioritization?
Do you use a credit scoring system for Predicting the likelihood of timely payment?
Do you use a credit scoring system for Fraud detection?
Do you use a credit scoring system for Portfolio management?
Do you assign a Risk Code or Classification to your customers?
What % of the number of customers do you consider to be in the highest (Top third) risk category?
How was your credit-scoring model developed?
Do you use a bolt-on Deduction Management system?
Do you use a bolt-on Collection Management system?
To whom does your Chief Credit Executive report?
To whom does your Chief Accounts Receivable Executive report?
Do you utilize Electronic Invoicing (any method of non-paper invoicing)?
What percentage of invoices are issued electronically?
Has the percentage of Electronic Invoicing increased in the last 12 months?
Do you receive Electronic Payments (wire transfers, EFT)?
What percent of payment items are received electronically?
Has the percentage of Electronic Payments increased in the last 12 months?
What percentage of sales do the Top 10 customers represent?
What percentage of sales do the Top 20 customers represent?
Do you have an auto write-off policy that stipulates, at cash application, customer deductions below a specified amount are automatically written off?
What is your auto write-off tolerance dollars per check?
What is your auto write-off tolerance percent of check?
What is your auto write-off tolerance dollars per invoice?
What is your auto write-off tolerance percent of invoice?
Do you use an auto-cash system at the front-end of your cash application system?
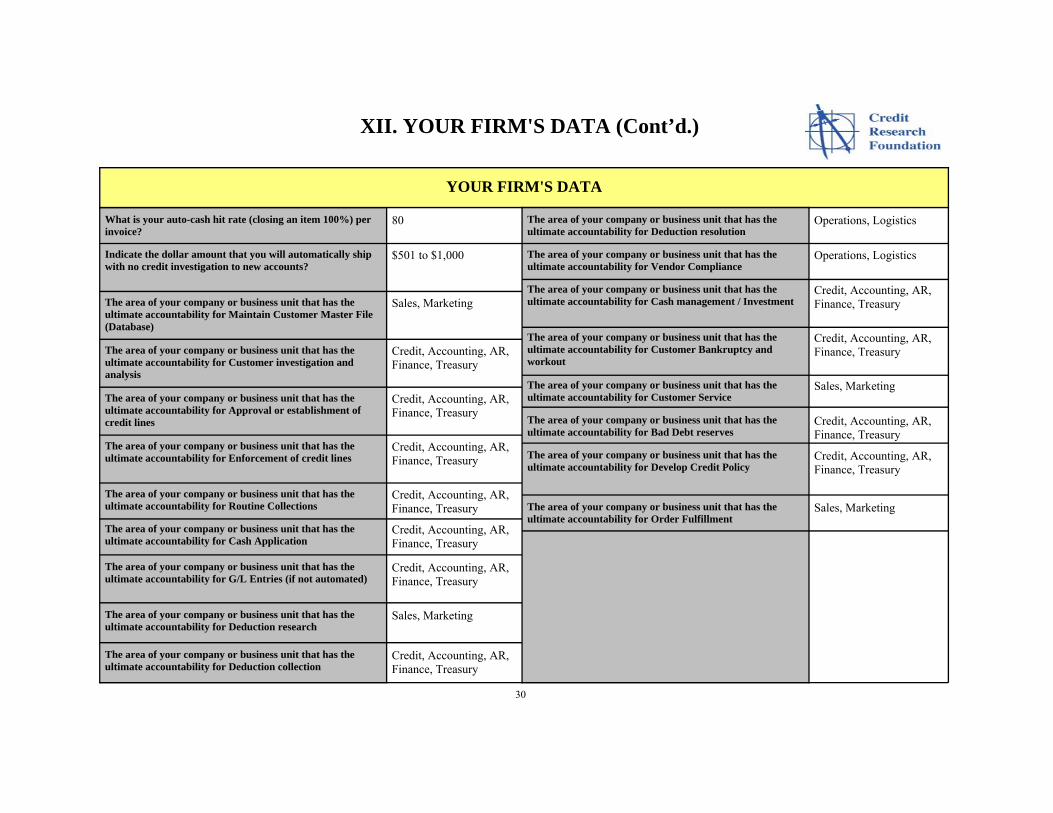
What is your auto-cash hit rate (closing an item 100%) per check?
Yes
Yes
Yes
2
Packaged Model
Yes
Yes
VP Finance/CFO
Chief Credit Executive
Yes
32
Yes
Yes
20
Yes
60
82
Yes
25
2
Yes
29
XII. YOUR FIRM'S DATA (Cont’d.)
30
YOUR FIRM'S DATA
What is your auto-cash hit rate (closing an item 100%) per invoice?
Indicate the dollar amount that you will automatically ship with no credit investigation to new accounts?
The area of your company or business unit that has the ultimate accountability for Maintain Customer Master File (Database)
The area of your company or business unit that has the ultimate accountability for Customer investigation and analysis
The area of your company or business unit that has the ultimate accountability for Approval or establishment of credit lines
The area of your company or business unit that has the ultimate accountability for Enforcement of credit lines
The area of your company or business unit that has the ultimate accountability for Routine Collections
The area of your company or business unit that has the ultimate accountability for Cash Application
The area of your company or business unit that has the ultimate accountability for G/L Entries (if not automated)
The area of your company or business unit that has the ultimate accountability for Deduction research
The area of your company or business unit that has the ultimate accountability for Deduction collection
The area of your company or business unit that has the ultimate accountability for Deduction resolution
The area of your company or business unit that has the ultimate accountability for Vendor Compliance
The area of your company or business unit that has the ultimate accountability for Cash management / Investment
The area of your company or business unit that has the ultimate accountability for Customer Bankruptcy and workout
The area of your company or business unit that has the ultimate accountability for Customer Service
The area of your company or business unit that has the ultimate accountability for Bad Debt reserves
The area of your company or business unit that has the ultimate accountability for Develop Credit Policy
The area of your company or business unit that has the ultimate accountability for Order Fulfillment
80
$501 to $1,000
Sales, Marketing
Credit, Accounting, AR, Finance, Treasury
Credit, Accounting, AR, Finance, Treasury
Credit, Accounting, AR, Finance, Treasury
Credit, Accounting, AR, Finance, Treasury
Credit, Accounting, AR, Finance, Treasury
Credit, Accounting, AR, Finance, Treasury
Sales, Marketing
Credit, Accounting, AR, Finance, Treasury
Operations, Logistics
Operations, Logistics
Credit, Accounting, AR, Finance, Treasury
Credit, Accounting, AR, Finance, Treasury
Sales, Marketing
Credit, Accounting, AR, Finance, Treasury
Credit, Accounting, AR, Finance, Treasury
Sales, Marketing
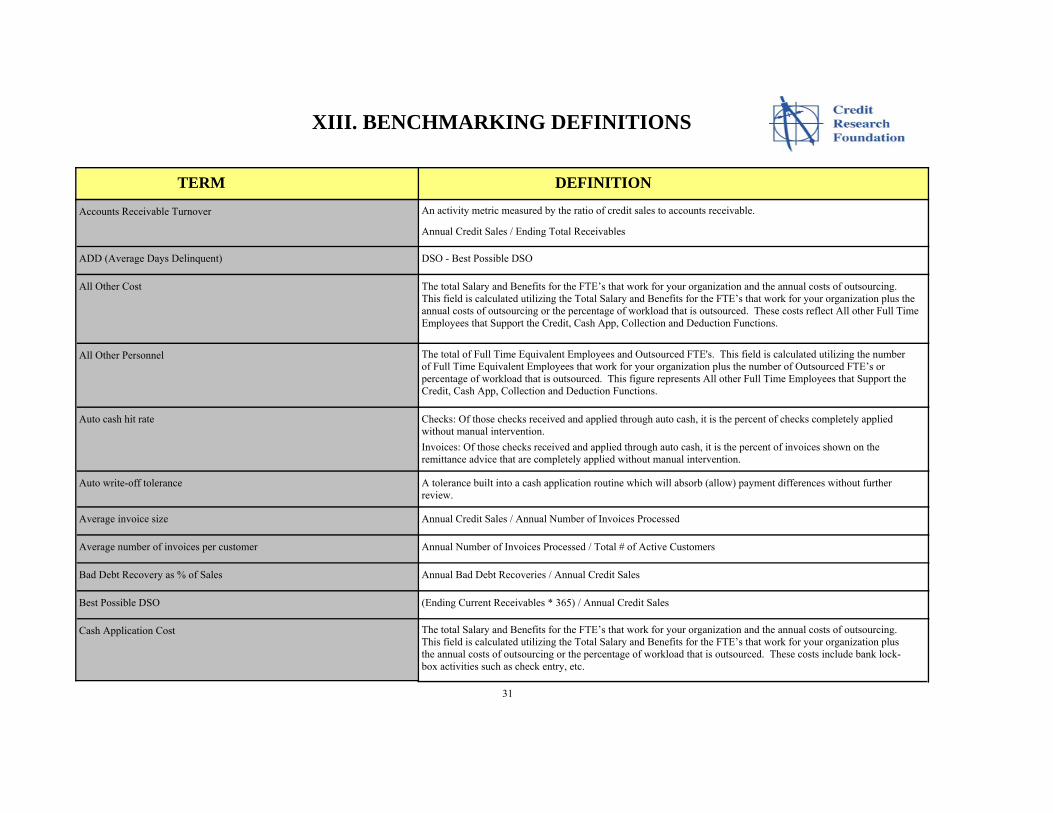
XIII. BENCHMARKING DEFINITIONS
ADD (Average Days Delinquent)
31
DSO - Best Possible DSO
TERM DEFINITION
All Other Cost The total Salary and Benefits for the FTE’s that work for your organization and the annual costs of outsourcing. This field is calculated utilizing the Total Salary and Benefits for the FTE’s that work for your organization plus the annual costs of outsourcing or the percentage of workload that is outsourced. These costs reflect All other Full Time Employees that Support the Credit, Cash App, Collection and Deduction Functions.
All Other Personnel The total of Full Time Equivalent Employees and Outsourced FTE's. This field is calculated utilizing the number of Full Time Equivalent Employees that work for your organization plus the number of Outsourced FTE’s or percentage of workload that is outsourced. This figure represents All other Full Time Employees that Support the Credit, Cash App, Collection and Deduction Functions.
Auto cash hit rate
Auto write-off tolerance
Bad Debt Recovery as % of Sales
Best Possible DSO
Checks: Of those checks received and applied through auto cash, it is the percent of checks completely applied without manual intervention.Invoices: Of those checks received and applied through auto cash, it is the percent of invoices shown on the remittance advice that are completely applied without manual intervention.
A tolerance built into a cash application routine which will absorb (allow) payment differences without further review.
Annual Bad Debt Recoveries / Annual Credit Sales
(Ending Current Receivables * 365) / Annual Credit Sales
Annual Credit Sales / Annual Number of Invoices ProcessedAverage invoice size
Average number of invoices per customer Annual Number of Invoices Processed / Total # of Active Customers
Cash Application Cost The total Salary and Benefits for the FTE’s that work for your organization and the annual costs of outsourcing. This field is calculated utilizing the Total Salary and Benefits for the FTE’s that work for your organization plus the annual costs of outsourcing or the percentage of workload that is outsourced. These costs include bank lock-box activities such as check entry, etc.
Accounts Receivable Turnover An activity metric measured by the ratio of credit sales to accounts receivable.
Annual Credit Sales / Ending Total Receivables

XIII. BENCHMARKING DEFINITIONS (Cont’d.)
32
TERM DEFINITION
Cash Application costs as indicated by survey / Annual Number of Checks Processed
Cash Application cost per Transaction
Cash Applications cost per Cash Application personnel
Cash Application costs as indicated by survey / (Annual Number of Checks Processed + Annual Number of Invoices Processed + Annual Number of Credit Memos Processed + Number of Deductions REMOVED During the Year)
Cash Application costs as indicated by survey / Cash Application personnel as indicated by survey
Cash Application Personnel The total of Full Time Equivalent Employees and Outsourced FTE's. This field is calculated utilizing the number of Full Time Equivalent Employees that work for your organization plus the number of Outsourced FTE’s or percentage of workload that is outsourced. This figure includes FTE’s that perform bank lock-box activities such as check entry, etc.
CEI (Collection Effectiveness Indicator)
Checks processed per Cash Application personnel
Collection cost per Collection personnel
Collection cost per customer
(Beginning Receivables + (Annual Credit Sales/12) - Ending Total Receivables) /(Beginning Receivables + (Annual Credit Sales/12) - Ending Current Receivables)
Annual Number of Checks Processed / Cash Application personnel as indicated by survey
Collection costs as indicated by survey / Collection personnel as indicated by survey
Collection costs as indicated by survey / Total # of Active Customers
Collection Expenses Collection agencies, lawyers fees, etc.
Collections Cost The total Salary and Benefits for the FTE’s that work for your organization and the annual costs of outsourcing. This field is calculated utilizing the Total Salary and Benefits for the FTE’s that work for your organization plus the annual costs of outsourcing or the percentage of workload that is outsourced. These costs reflect only routine collection activities.
Collections Personnel The total of Full Time Equivalent Employees and Outsourced FTE's. This field is calculated utilizing the number of Full Time Equivalent Employees that work for your organization plus the number of Outsourced FTE’s or percentage of workload that is outsourced. These FTE’s only perform routine collection activities.
Cash Application cost per check processed
Collection cost as % of sales Collection costs as indicated by survey / Annual Credit Sales
Cash Application cost as % of sales Cash Application costs as indicated by survey / Annual Credit Sales

XIII. BENCHMARKING DEFINITIONS (Cont’d.)
33
TERM DEFINITION
Credit Risk costs as indicated by survey / Total # of Active CustomersCredit / Risk cost per customer
Credit Risk costs as indicated by survey / Credit Risk personnel as indicated by surveyCredit / Risk cost per Credit / Risk personnel
The total of Full Time Equivalent Employees and Outsourced FTE's. This field is calculated utilizing the number of Full Time Equivalent Employees that work for your organization plus the number of Outsourced FTE’s or percentage of workload that is outsourced.
Credit Risk Personnel
The total Salary and Benefits for the FTE’s that work for your organization and the annual costs of outsourcing. This field is calculated utilizing the Total Salary and Benefits for the FTE’s that work for your organization plus the annual costs of outsourcing or the percentage of workload that is outsourced.
Deduction Cost
The total of Full Time Equivalent Employees and Outsourced FTE's. This field is calculated utilizing the number of Full Time Equivalent Employees that work for your organization plus the number of Outsourced FTE’s or percentage of workload that is outsourced.
Deduction Personnel
Deduction Turnover
Deductions as % of AR ($)
Deductions as % of AR (items)
Deductions as % of sales
Deductions cost per Deductions personnel
Deductions processing cost per deduction processed
(Number of Deductions at Beginning of Year + Number of NEW Deductions Created in the Year) / Number of Deductions at End of Year
Ending Total A/R of Deductions ONLY / Ending Total Receivables
Number of Deductions at End of Year / Ending Number of A/R items
Ending Total A/R of Deductions ONLY / Annual Credit Sales
Deduction costs as indicated by survey / Deductions personnel as indicated by survey
Deduction costs as indicated by survey / Number of Deductions REMOVED During the Year
Credit / Risk cost as % of sales Credit Risk costs as indicated by survey / Annual Credit Sales
Credit Risk Cost The total Salary and Benefits for the FTE’s that work for your organization and the annual costs of outsourcing. This field is calculated utilizing the Total Salary and Benefits for the FTE’s that work for your organization plus the annual costs of outsourcing or the percentage of workload that is outsourced.

XIII. BENCHMARKING DEFINITIONS (Cont’d.)
Number of active customers
Number of customers handled per Collection personnel
Number of customers per Credit / Risk personnel
Number of Deductions processed per deduction processing employee
Number of Invoices per Collection personnel
34
As indicated by survey
Total # of Active Customers / Collection personnel as indicated by survey
Total # of Active Customers / Credit Risk personnel as indicated by survey
Number of Deductions REMOVED During the Year / Deductions personnel as indicated by survey
Annual Number of Invoices Processed / Collection personnel as indicated by survey
TERM DEFINITION
Net bad debt as a % of Sales (Annual Bad Debt Write-offs - Annual Bad Debt Recoveries) / Annual Credit Sales
Least number of customers handled by a Collector
Most number of customers handled by a Collector
As indicated by survey
As indicated by survey
Information Technology Includes systems costs or allocation, hardware and depreciation and amortization
Highest Value The largest value (maximum) in the data set.
Lower Quartile The first quartile. Cuts off at lowest 25% of data. The value between the first and second quartiles.
Lowest Value The smallest value (minimum) in the data set.
Median The number that appears midway between the highest and lowest numbers in the array.
In the example array: 2, 7, 10, 25, 50 -- 10 is the median
Deductions processing costs as % of sales Deduction costs as indicated by survey / Annual Credit Sales
DSO (Days Sales Outstanding)
Gross Bad Debt as % of Sales
(Ending Total Receivables * 365) / Annual Credit Sales
Annual Bad Debt Write-offs / Annual Credit Sales
XIII. BENCHMARKING DEFINITIONS (Cont’d.)
35
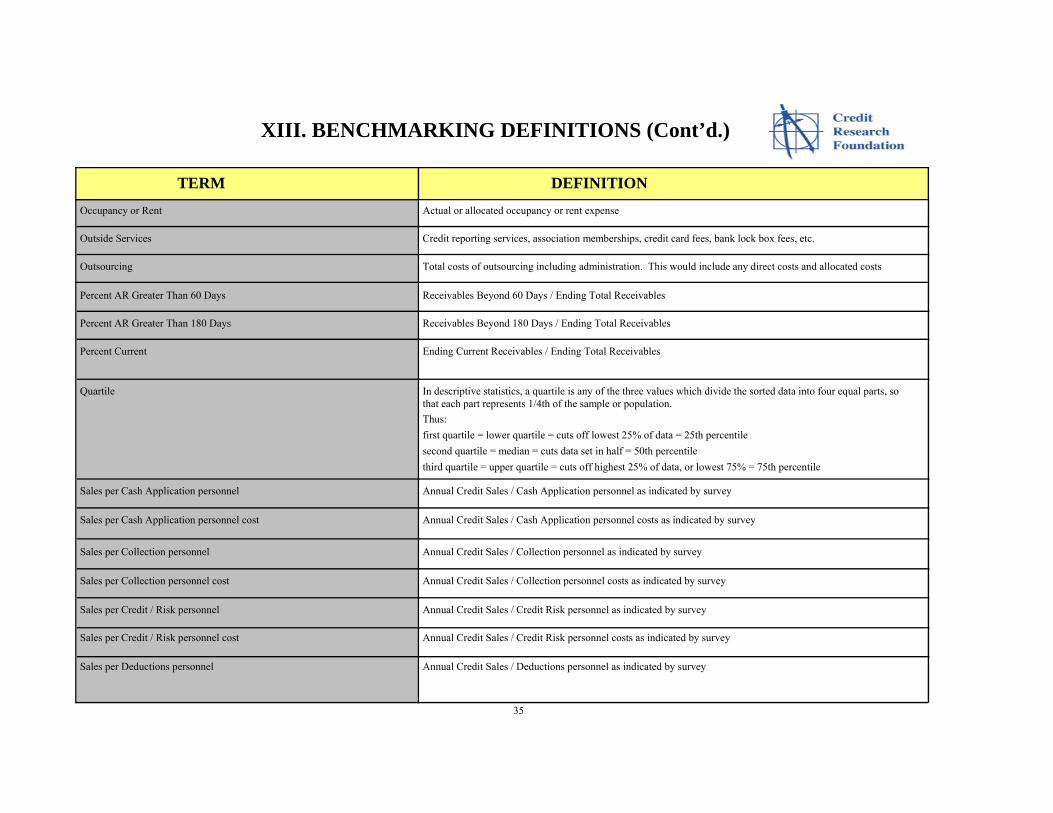
Annual Credit Sales / Credit Risk personnel as indicated by survey
Annual Credit Sales / Credit Risk personnel costs as indicated by survey
TERM DEFINITION
Sales per Credit / Risk personnel
Sales per Credit / Risk personnel cost
Annual Credit Sales / Deductions personnel as indicated by surveySales per Deductions personnel
Sales per Collection personnel cost
Sales per Collection personnel
Annual Credit Sales / Collection personnel costs as indicated by survey
Annual Credit Sales / Collection personnel as indicated by survey
Sales per Cash Application personnel cost
Sales per Cash Application personnel
Annual Credit Sales / Cash Application personnel costs as indicated by survey
Annual Credit Sales / Cash Application personnel as indicated by survey
Quartile In descriptive statistics, a quartile is any of the three values which divide the sorted data into four equal parts, so that each part represents 1/4th of the sample or population.Thus:first quartile = lower quartile = cuts off lowest 25% of data = 25th percentilesecond quartile = median = cuts data set in half = 50th percentilethird quartile = upper quartile = cuts off highest 25% of data, or lowest 75% = 75th percentile
Percent AR Greater Than 180 Days
Percent Current
Receivables Beyond 180 Days / Ending Total Receivables
Ending Current Receivables / Ending Total Receivables
Percent AR Greater Than 60 Days Receivables Beyond 60 Days / Ending Total Receivables
Occupancy or Rent Actual or allocated occupancy or rent expense
Outside Services Credit reporting services, association memberships, credit card fees, bank lock box fees, etc.
Outsourcing Total costs of outsourcing including administration. This would include any direct costs and allocated costs

XIII. BENCHMARKING DEFINITIONS (Cont’d.)
36
TERM DEFINITION
Total Annual Cost Total annual cost to run Credit, Collections, Cash Application and Deduction Management and Administration. Includes FTE salaries, benefits and all other expenses charged to your operation.
Transactions Annual Number of Checks Processed + Annual Number of Invoices Processed + Annual Number of Credit Memos Processed + Number of Deductions REMOVED During the Year
Sales per Travel Dollars
System and IT costs per check
System and IT costs per customer
System and IT costs per Invoice
Top 10 customers as % of sales
Top 20 customers as % of sales
Annual Credit Sales / Travel costs
Information Technology costs / Annual Number of Checks Processed
Information Technology costs / Total # of Active Customers
Information Technology costs / Annual Number of Invoices Processed
As indicated by survey
As indicated by survey
Sales per total personnel of all areas Annual Credit Sales / (Credit Risk personnel as indicated by survey + Cash Application personnel as indicated by survey + Collection personnel as indicated by survey + Deductions personnel as indicated by survey + All Other personnel as indicated by survey)
Annual Credit Sales / (Credit Risk costs as indicated by survey + Cash Application costs as indicated by survey + Collection costs as indicated by survey + Deductions costs as indicated by survey + All Other costs as indicated by survey)
Sales per total personnel cost of all areas
Annual Credit Sales / Deductions personnel costs as indicated by surveySales per Deductions personnel cost
Total Personnel cost per total personnel (Credit Risk costs as indicated by survey + Cash Application costs as indicated by survey + Collection costs as indicated by survey + Deductions costs as indicated by survey + All Other costs as indicated by survey) /
(Credit Risk personnel as indicated by survey + Cash Application personnel as indicated by survey + Collection personnel as indicated by survey + Deductions personnel as indicated by survey + All Other personnel as indicated by survey)

XIII. BENCHMARKING DEFINITIONS (Cont’d.)
Transactions per Cash Application personnel
Travel
37
(Annual Number of Checks Processed + Annual Number of Invoices Processed + Annual Number of Credit Memos Processed + Number of Deductions REMOVED During the Year) / Cash Application personnel as indicated by survey
Annual travel expense
TERM DEFINITION
Travel Dollars per customer Travel costs / Total # of Active Customers
Upper Quartile The third quartile, cuts off highest 25% of data. The value between the third and fourth quartiles.