credit cards, race, and entrepreneurship
TRANSCRIPT
Credit Cards, Race, and Entrepreneurship
AARON K. CHATTERJI* Fuqua School of Business
Duke University 1 Towerview Drive Durham, NC 27708 Tel: (919) 660-7903 Fax: (919) 681-6244
ROBERT C. SEAMANS
NYU Stern School of Business 44 W. 4th Street
New York, NY 10012 Tel: (510) 847-1026
March 29, 2010
Abstract: We use the decision by 14 states to remove credit card interest rate caps after the U.S. Supreme Court's 1978 Marquette decision as a natural experiment to explore the impact of credit card availability on black entrepreneurship. Using self-employment as a measure of entrepreneurship, we use Current Population Survey data from 1971-1985 to show that removing state-level rate caps led to increases in self-employment among black individuals. We verify this pattern using Survey of Consumer Finance data from 1977-1986 and find additional evidence that credit cards may have enabled black entrepreneurs to overcome financial discrimination and access needed capital.
* The authors would like to thank William Darity, J. P. Eggers, David Mowery, Ramana Nanda, Gabriel Natividad, Alicia Robb, Jason Snyder, Victor Stango, Catherine Wolfram, Jonathan Zinman, and participants in seminars at the UC Berkeley Haas School of Business, Duke University Law School, NYU Stern School of Business, and American Economic Association annual meeting for thoughtful comments. The authors also thank Chris Knittel and Victor Stango for generously sharing data on state banking characteristics and Randall Kroszner and Philip Strahan for generously sharing data on state banking laws.
Credit Cards, Race, and Entrepreneurship
2
The role of liquidity constraints in entrepreneurial financing has presented a persistent
puzzle for scholars. While several prior academic studies have explored the importance of
liquidity constraints for entrepreneurs, they yield contradictory results. For example, David G.
Blanchflower and Andrew J. Oswald (1998), Robert Fairlie (1999), Thomas Lindh and Henry
Ohlsson (1996), and Ramana Nanda (2009) all demonstrate that wealth constraints hinder
entrepreneurship and that shocks that remove these constraints lead to higher entrepreneurship.
Erik Hurst and Annamaria Lusardi (2004) and Mitchell A. Peterson and Rajan G. Raghuram,
(2002), on the other hand, argue that wealth constraints are likely small. In particular, Hurst and
Lusardi (2004) find that the probability of entering self employment is broadly similar across
most of the wealth distribution. It may be possible to shed light on these contradictory results if
scholars explore the relative importance of different types of financing for different types of
entrepreneurs. For example, prior research has shown that black entrepreneurs have a harder time
obtaining financing than white entrepreneurs. This difficultly appears to be driven in part by
racial discrimination when applying for loans (Robert Fairlie and Alicia Robb, 2008). However,
there is also evidence that black entrepreneurs might be more likely to finance their ventures
using credit cards than white entrepreneurs, presumably because of differences in their ability to
access credit cards versus traditional bank loans (Fairlie and Robb, 2008).
Our paper investigates whether credit cards, which eliminate the need for face-to-face
interactions with a loan officer, are a mechanism that black entrepreneurs use to overcome
business financing frictions arising from discrimination. We accomplish this by evaluating the
impact of state-level credit card interest rate caps on black transitions into entrepreneurship in the
United States. Exogenous variation in state-level interest rate caps was created by the Marquette
decision, a 1978 Supreme Court ruling that effectively eliminated state-level caps on credit card
Credit Cards, Race, and Entrepreneurship
3
interest rates for a group of states over several years. A number of states eliminated caps after the
decision, allowing credit card companies in those states to charge much higher rates and extend
credit to more borrowers. We focus on the elimination of credit card interest rate caps and show
that eliminating caps increased black transitions into self-employment. These results are
consistent across two different data sets. Furthermore, we show that black individuals who
owned credit cards in states without caps were more likely to be self-employed, that blacks in
states with a history of racial discrimination were more likely to enter self-employment after caps
were eliminated, and that eliminating caps had a much larger effect on black transitions into
entrepreneurship than other types of bank deregulation in the same period. These findings
suggest that black individuals faced discrimination-based barriers to entrepreneurship in the
1970s and 1980s and used credit cards as a mechanism to overcome those barriers.
Prior work has found that blacks generally enter entrepreneurship at lower rates than
whites (Robert W. Fairlie, 1999). Several explanations have been offered to explain this
disparity, including family structure (Michael Hout and Harvey S. Rosen, 2000), liquidity
constraints, and consumer discrimination (Bruce D. Meyer, 1990). Even after becoming
entrepreneurs, black individuals face more challenges in running a successful business. Alicia M.
Robb, Robert W. Fairlie and David T. Robinson (2009) show that black entrepreneurs have more
trouble accessing external capital markets, and rely more heavily on owner financing. David G.
Blanchflower, Phillip B. Levine and David J. Zimmerman (2003) find that black-owned small
businesses are more likely to be denied bank credit than other groups, and when they do obtain
credit, they pay higher interest rates. Other work (George J. Borjas and Stephen G. Bronars,
1989; Meyer, 1990; Daiji Kawaguchi, 2005) has suggested that consumer discrimination may
decrease returns for black entrepreneurs. Enrichetta Ravina (2008) studies an online lending
Credit Cards, Race, and Entrepreneurship
4
market and finds that, while black borrowers are as likely to obtain a loan as white borrowers,
black borrowers pay significantly more basis points than white borrowers even though
delinquency rates are similar. The literature examining black individuals and entrepreneurship
indicates that blacks may have less access than whites to credit through standard lending
channels. In an appendix, we confirm this empirical finding using data from on black borrowers
in the 1970s and 1980s. However, the goal of this article is to understand the response of black
entrepreneurs to these frictions. Our argument is that when the Marquette decision removed
interest rate caps and credit card availability increased, black individuals may have been more
likely than whites to use credit cards as a mechanism to finance entrepreneurial entry. While
previous work has explained the dynamics of competition between credit card companies (Victor
Stango, 2002; Victor Stango 2003), no published paper to our knowledge has systematically
addressed the impact of credit cards on entrepreneurship. This is in sharp contrast to other forms
of financing such as venture capital, which has received significant attention in the literature
(David Hsu, 2004) but which is rarely available to small business entrepreneurs.
In the next section, we discuss the Marquette decision. Section II describes our methods
and data. Section III describes the main results: that black individuals were more likely to
transition into self-employment if they resided in a state that eliminated its credit card interest
rate cap. Section III also provides additional results showing how discrimination affected lending
patterns, and how black individuals used credit cards to overcome that discrimination. Section IV
concludes and discusses the implications of our analysis.
Credit Cards, Race, and Entrepreneurship
5
I. The Marquette Decision
In December 1978, the Supreme Court considered the case of Marquette National Bank
of Minneapolis v. First Omaha Service Corp. The case centered around First Omaha’s marketing
of credit cards to Minnesota customers. During this period, states were allowed to set their own
caps on credit card interest rates, so First Omaha was charging a higher rate (as allowed by
Nebraska law) than Minnesota-based banks could offer to customers in their own state. As a
result, the Minnesota attorney general contended that these activities interfered with the state’s
ability to enforce its usury laws (Diane Ellis, 1998). The Court ruled that the National Bank Act
stipulated that banks could charge the highest allowable rate in their home state, regardless of the
interest rate cap in the customer’s state of residence (Lawrence M. Ausubel, 1997; Ellis, 1998).
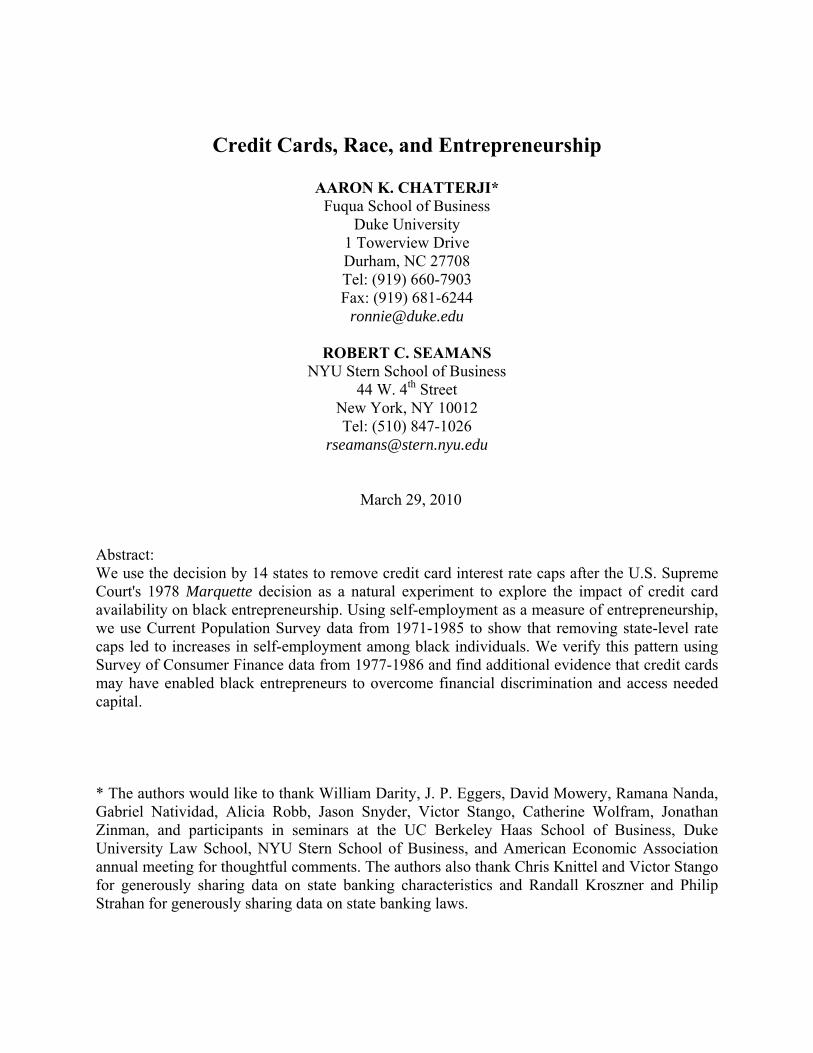
Starting in 1980, and particularly in 1981, a number of states removed credit card interest
rate caps (see Figure 1; New Hampshire was the one state that had no cap for the entire period).
Note that the removal of interest rate caps did not immediately follow the Supreme Court ruling
in December 1978, but instead occurred over a four year period from 1980 – 1983. According to
some accounts, states removed interest rate caps in an attempt to attract and retain banks, and
major banks like Citibank moved to high rate or no limit states such as South Dakota (Ausubel,
1997; Ellis, 1998). However, despite Citibank’s high profile move to South Dakota, there was
not an immediate migration to no limit states because of legal restrictions on interstate banking.
Many of these restrictions remained in place until the mid-1980s (Randall S. Kroszner and Philip
E. Strahan, 1999). As a result, there was not an immediate saturation of interstate credit cards
marketed from banks in no limit states to individuals in states with limits. Individuals living in
states that eliminated interest rate caps were immediately affected, but not individuals residing in

Credit Cards, Race, and Entrepreneurship
6
states with limits. In fact, Christopher R. Knittel and Victor Stango (2003) report that, as of
1984, only 8 to 9 percent of customers with incomes above $15,000 held out-of-state bank cards.
Following Marquette, credit card lending has increased and banks have extended more
credit to high risk borrowers, since they can compensate for increased risk of default with higher
rates of interest (W. F. Baxter, 1985; Ellis, 1998). Bringing together the past literature on
financing entrepreneurship, including liquidity constraints, the role of credit cards, and the
specific challenges faced by black entrepreneurs, we expect that black entrepreneurship
increased after the state removes its credit card interest rate cap following the Marquette
decision, as more black individuals were given access to credit to finance entrepreneurial
ventures. We test this proposition using two different data sets and information on credit card
interest rates from before and after the state removed its credit card interest rate cap. The only
other paper that uses the Marquette decision as a natural experiment is unpublished work by
Jonathan Zinman (2002), which uses the Marquette decision to study changes in consumer use of
credit cards with data from the Federal Reserve Board’s Survey of Consumer Finance (SCF).
The emphasis in Zinman’s paper is the change in credit card use following the Marquette
decision. We view Zinman’s work as complementary to ours because he shows that individuals
are more likely to have a credit card post-Marquette.
II. Data and Empirical Strategy
We hypothesize that access to credit cards is an important determinant of entrepreneurial
activity. Our prediction is that removing state level credit card interest rate caps will lead to
increased entrepreneurship, and that this effect will be especially pronounced among blacks. We
Credit Cards, Race, and Entrepreneurship
7
treat these state-level changes in credit card interest rates as exogenous and use them to proxy for
changes in the availability of credit card financing. Raw data confirm that state-level changes in
credit card interest rates affected the type of capital: individuals living in states with no limit on
the allowable interest rate paid a statistically significantly greater APR on their outstanding
balances.1 In addition, according to the SCF and as shown in Zinman (2002), there was a higher
percentage of credit card ownership in no-limit states: by 1986, 73 percent of individuals living
in limit states owned a credit card, compared to 80 percent of individuals living in no-limit states.
Finally, we use data on the state-level HHI of credit card companies to show that HHI levels are
lower in states with no limit on credit card interest rates.2 While this result is not statistically
significant, it suggests that there is a greater supply of credit cards in no limit states. The goal of
our empirical strategy is to take advantage of the state-level changes in maximum credit card
interest rates brought about by the Marquette decision to explain transitions into self-
employment and black self-employment, while controlling for other individual characteristics.
More specifically, we use a difference-in-difference approach to compare self-employment in
states that eliminate credit card interest rate caps to self-employment in states that do not
eliminate caps.3
Data on the interest rate cap for each state during our sample period was hand-collected
from annual volumes of The Cost of Personal Borrowing in the United States. Figure 1 shows
that the number of states with no limits increased from one to fourteen following the 1978
1 The 1983 Survey of Consumer Finances contains data on self reported credit card APRs. Based on data from 1699 individuals, we can reject the null hypothesis that the credit card APR is the same in no limit states as in other states at the 99 percent confidence level. 2 This data was generously provided by Christopher Knittel and Victor Stango. 3 An alternate strategy would compare black transitions into self-employment before and after the December 1978 Marquette decision. We have verified that the basic results hold under this alternative strategy.

Credit Cards, Race, and Entrepreneurship
8
Marquette decision. We use two surveys of individual characteristics and employment for our
analysis. We first use the Current Population Survey (CPS) data from 1971-1975, 1977-1981,
and 1983-19854 to establish the link between changes in the maximum allowable credit card
interest rate and self-employment rates. The CPS is ideal for this analysis because it includes
many variables that we use to control for alternative explanations. We then use the Survey of
Consumer Finances (SCF) data from 1977, 1983, and 1986 to investigate credit card ownership
patterns and evidence of discrimination. Both the CPS and SCF data cover the periods before and
after the Marquette decision. However, the SCF data does not include information from all
states.5 The SCF is the only data source we could find that predates the Marquette decision and
has information on credit card use; however, the SCF has few annual observations. The CPS data
has many annual observations, but lacks personal financial information. Hence, we use data from
both surveys, making every effort to collect similar individual characteristics across the two
surveys. We restrict our observations in both surveys to individuals who are between ages 18 and
65, who work full time, and who do not work for the military or on a farm. Consistent with other
work in this area (Fairlie, 1999), transition into self-employment is our dependent variable in all
regressions. Self-employment is commonly used to identify entrepreneurs, and is the best
variable we have given the nature of the CPS data.6 We identify transitions into self-employment
by restricting the sample to individuals who were employed full time in a wage-paying job in the
prior year. We also collect a number of individual characteristics that previous studies have
4 CPS does not have data for 1976 and 1982. SCF does not have data for 1978-1982 or 1984-1985. 5 SCF data does not include information from the following states: DC, HI, ID, KS, MD, MT, ND, NH, NM, NV, RI, VT, WV and WY. 6 It would be interesting to distinguish between self-employed individuals who work in a single-person firm and self-employed individuals who employ others. Nanda (2009) has a dataset that allows him to perform such a study, but we are unaware of any U.S. dataset that pre-dates the Marquette decision.
Credit Cards, Race, and Entrepreneurship
9
shown are important predictors of self-employment. These variables include indicators for black,
female, married, home owner, urban, high school graduate and low-income (indicating a
household income in the bottom 20th percentile) as well as continuous variables for age and its
square.7 Several studies have found that interstate banking deregulation led to increases in
entrepreneurship (Sandra E. Black and Philip E. Strahan, 2002; Nicola Cetorelli and Philip E.
Strahan, 2006; William R. Kerr and Ramana Nanda, 2009). We include four dummy variables
indicating whether the state passed any banking deregulation that could affect the availability of
credit. These variables are dummies for deregulation of intrastate branching through M&A
(merger restrictions), full intrastate branching (unit branching), interstate bank branching
(interstate branching), and multi-state holding companies (holding company).8
The CPS and SCF data differ in several ways. With the CPS data, we construct
demographic variables by location for unemployment and farm population. From the SCF we use
demographics at the county level which were collected from the 1980 census.9 Demographic
variables are county unemployment rate and county farm population. For the SCF, individuals in
the “high income” sample are excluded because the SCF does not include geographic identifiers
for these individuals and we cannot map them to a state. The CPS data includes various weights.
However, similar to Manju Puri and David T. Robinson (2009), we do not use weights in any of
the reported results because our intent is to measure the effect of changes in credit card
7 The results are robust to the exclusion of homeowner and income, the two variables that are most at risk of being endogenous to the self-employment decision. 8 The data on these deregulations were generously provided by Kroszner and Strahan. 9 We use the same county demographic values for each year in our sample, and because of the lack of county identification in the 1977 SCF, we aggregate county-level information to the primary sampling unit (PSU) level.
Credit Cards, Race, and Entrepreneurship
10
regulation on an individual’s decision to become an entrepreneur.10 Table 1 presents summary
statistics of all variables used. The main specification is:
(1) transition into self-employmentimt = α + λm + TIMEt + βnolimitnolimitmt +
βblack*nolimitblack*nolimitimt + Ximtβ + eimt
Ximt is a vector of individual characteristics (including a dummy for black), county
demographics and state banking deregulations. The actual covariates depend on the survey used,
and are described in more detail below. We include market (λm) and year (TIMEt) fixed effects.
Market is defined differently across regressions, but in most cases is at the metropolitan-state
level.11 For all regressions, we use the variable no limit to indicate whether the individual is
located in a state that has no limit on credit card interest rates. We expect that individuals who
live in states that remove interest rate caps are more likely to transition into self-employment,
and so we expect βnolimit to be positive. We expect that black individuals who live in states that
remove interest rate caps will be even more likely to transition into self-employment, and so we
expect βblack*nolimit to be positive.
III. Results
A. Effect of Changes in Interest Rate Caps on Transitions into Self-employment
We first use the Current Population Suvey (CPS) data to investigate the effect of interest
rate caps on transitions from a wage-paying job into self-employment. In Table 2, we report the
10 The results are robust to the use of weights. 11 For example, the boundary of the Philadelphia PA/NJ metro area crosses into two states, and so is divided into two mutually exclusive areas: Philadelphia PA and Philadelphia NJ. In addition, areas in each state not part of a metro area are grouped into a statewide non-metro area. The urban dummy controls for whether the individual resides in a metro area or not.

Credit Cards, Race, and Entrepreneurship
11
results of OLS fixed-effects regressions with a dummy variable for self-employment as our
dependent variable. For convenience, coefficients on explanatory variables other than no limit
and black*no limit have been suppressed. All results are clustered at the metropolitan-state level.
Column 1 includes personal characteristic information, 366 metropolitan-state fixed effects and
13 year dummies. The coefficient on black*no limit is positive and significant at the 5 percent
level. This result confirms our basic hypothesis. The coefficient on no limit is negative but
insignificant. These results suggest that removing credit card interest rates caps was an important
determinant of black transition into self-employment. Columns (2) through (5) add in more fixed
effects and interactions, including 145 industry fixed effects, to examine how the coefficient on
black*no limit changes. These fixed effects are included to control for different financing needs
across industries. For example, according to the Federal Reserve Board’s 1987 National Survey
of Small Business Finance, the median starting capital in the construction industry was $9,500,
whereas the median starting capital in retail trade was $55,200.12 Column 3 includes interactions
between no limit and industry dummies to control for differential effects of the no limit
legislation across industries. Column 4 includes interactions between black and industry
dummies to control for the fact that black individuals may be more likely to work in certain
industries. Column 5 includes both the interactions between black and industry dummies and
between no limit and industry dummies. The results are remarkably consistent across the five
columns: the coefficient on black*no limit is positive and significant while the coefficient on no
limit is insignificant. The results in columns (1) through (5) show that black individuals who
resided in a state with no limit on credit card rates and who were not self-employed at t-1 were
12 NSSBF statistics cited in Hurst and Lusardi (2004). 1987 is the earliest data for the NSSBF data.
Credit Cards, Race, and Entrepreneurship
12
significantly more likely to enter self-employment by time t than non-black individuals. In
contrast, there is no evidence that non-black individuals were likely to enter self-employment
after a state removed its interest rate cap.
One concern may be that black would-be entrepreneurs moved to no-limit states to take
advantage of credit card availability. In order to address this concern, we confirm that there was
no significant difference between the share of black individuals before and after a state removed
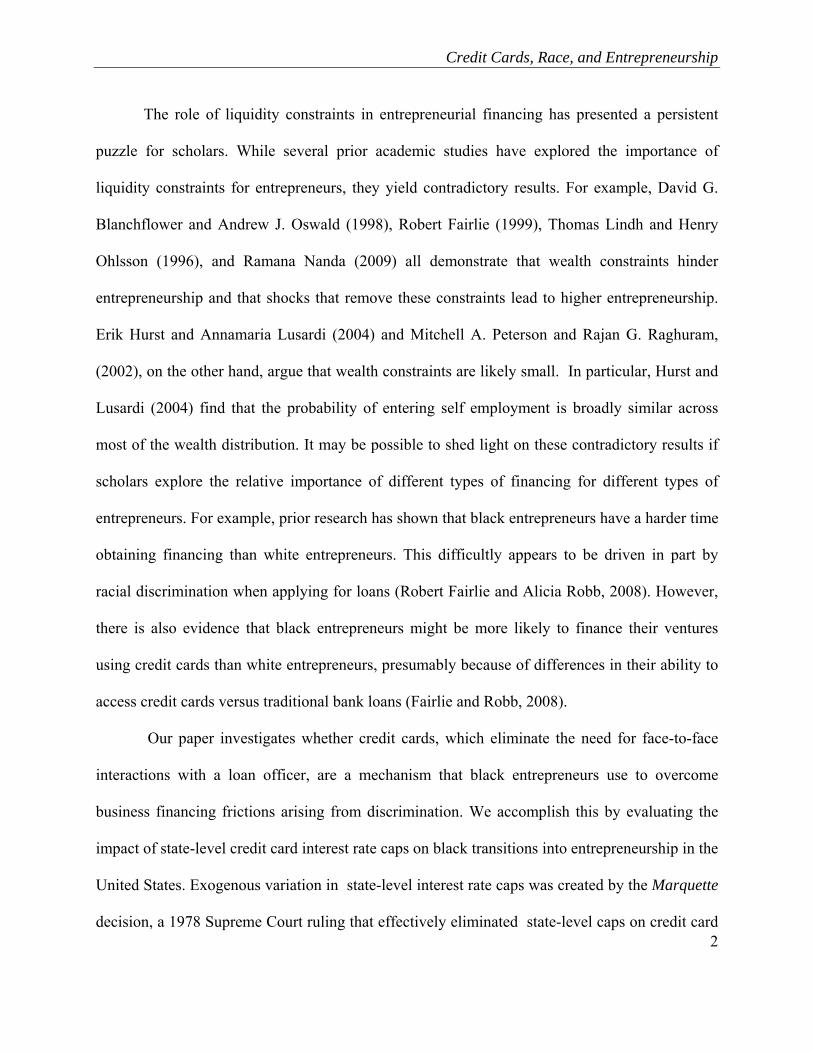
its rate cap. Figure 2 depicts the results of a regression of black on dummy variables for one to
four years before and after a state removed its rate cap as well as a year dummies and location
dummies. The figure shows that the share of black in a state did not significantly change in the
four-year window around that state’s decision to remove interest rate caps.
B. Other Financial Deregulation
One concern with the positive results on black*no limit is that there may be other
contemporaneous state-level changes driving the results, or other sources of endogeneity
between the probability of self-employment and the probability of a state removing its interest
rate cap. We first investigate the extent to which bank deregulation might explain the results.
Black and Strahan (2002), Cetorelli and Strahan (2006), and Kerr and Nanda (2009) all show
that bank deregulation led to an increase in entrepreneurship. One might worry that states which
were more likely to undergo bank deregulation were also more likely to remove interest rate
caps. If that were the case, the coefficient on black*no limit could be driven by changes to bank
competition rather than by changes in credit card availability. Dummy variables indicating
whether a bank deregulated were included in all regressions to control for this possibility.
Credit Cards, Race, and Entrepreneurship
13
Nevertheless, in Table 3 we report results of regressions that include both black*no limit and an
interaction between black and each type of bank deregulation. The coefficient on black*no limit
is positive and significant in all regressions, while the coefficients on the other interaction terms
are not significant.
The results presented in Table 3 are important for another reason. We argue that the
expanded availability of credit cards would be more likely to affect black entrepreneurs because
it allows black individuals to avoid face-to-face interactions with bank lenders. The
counterfactual test would show that the expanded availability of credit that requires face-to-face
interaction is no more likely to affect black entrepreneurs (or may even negatively affect black
entrepreneurs). Hence, the fact that the coefficients on the interactions between black and the
measures for bank deregulation are insignificant, small in magnitude, and in some cases
negative, provides additional support for our contention.13
In addition to bank deregulation, a number of states also passed bankruptcy exemption
reforms during this time. We next use data from the Current Population Survey (CPS) and Cost
of Personal Borrowing together with information on bankruptcy exemptions levels in no-limit
states from Reint Gropp, John Karl Scholz and Michelle White (1997) to examine the effect of
no credit card rate caps and no-limit bankruptcy exemptions on the probability of self-
employment. Using data sets from 1993-1998, Wei Fan and Michelle White (2003) have shown
that higher bankruptcy exemption levels are correlated with a higher probability of being self-
employed. In order to rule out that state bankruptcy exemption levels are driving the results, we
13 The coefficient on interstate branching is positive and significant whereas the interaction black*interstate branching is negative but not significant. However, a Wald test of the coefficients cannot reject that interstate branching + black*interstate branching = 0.
Credit Cards, Race, and Entrepreneurship
14
create dummies for state "no limit" bankruptcy exemption levels and include these in similar
regressions models to those shown in Table 2. To create the no limit bankruptcy exemption
variable, we use information on whether the state has any no limit bankruptcy exemptions from
Table 1 of Gropp, Scholz and White (1997). There are nine such states: Arkansas, Florida,
Kansas, Louisiana, Minnesota, Oklahoma, South Dakota, Texas and Vermont.
The results are presented in Table 4. In columns (1) and (2) we assume that these states
pass their bankruptcy exemption laws in late 1979, and investigate whether including the
indicator no limit bankruptcy exemption has any effect on our previous findings. The coefficient
on no limit bankruptcy exemption is insignificant, as is the coefficient on the interaction black*
no limit bankruptcy exemption, but the coefficient on black*nolimit credit card rate (called
black*no limit in Table 2 above) remains positive and significant. According to Fan and White
(2003), most states had adopted their own bankruptcy exemptions by 1982, and few states
changed their bankruptcy exemption level after 1982. Hence, in columns (3) and (4), we redefine
the variable no limit bankruptcy exemption by assuming that the exemptions went into effect in
early 1982 and repeat the analysis. We find that the coefficient on no limit bankruptcy exemption
is again insignificant. The results differ from the results found by Fan and White (2003), but it
should be noted that Fan and White study a different time period and use a different data set.14
More important for our study, the coefficient on the interaction black* no limit bankruptcy
exemption is insignificant, but the coefficient on black*no limit credit card rate (called black*no
limit in Table 2 above) remains positive and significant. This result suggests that
14 Fan and White (2003) use the Survey of Income and Program Participation data sets from 1993-1998.

Credit Cards, Race, and Entrepreneurship
15
contemporaneous state-level changes are not driving the strong result on black*no limit reported
in Table 2
C. Access to Finance and the Role of Race
In order to further understand the role of race in access to credit, we also investigate
whether the impact of no limit differentially affects black individuals in states with a history of
discrimination. To do this, we rely on historical institutional and legal details for each state. We
first identify states which allowed slavery at the start of the Civil War (slave state) and states
which were part of the Confederacy (confederate state).15 A word of caution is necessary here.
We understand that there may have been other socio-economic considerations that determined
whether a state was a Confederate or Union state in the Civil War, and we certainly do not mean
to imply that all individuals currently living in states which were part of the Confederacy a
century ago are racist. Instead, the goal is to identify variation in institutions and norms across
state types from a century ago. As other research has argued, initial conditions of institutions and
norms in an area can explain variation across areas in later periods (Daron Acemoglu, Simon
Johnson and James A. Robinson, 2001). We also identify states which were among the last to
remove anti-miscegenation laws. We obtain information on the states which repealed anti-
miscegenation laws only after the U.S. Supreme Court’s 1967 decision in Loving v. Virginia
from Roland G. Fryer (2007). Finally, we identify states which did not have fair housing laws
until the federal Fair Housing Act of 1968. We obtain this information from William J. Collins
15 Confederate states include Arkansas, Florida, Georgia, Louisiana, Mississippi, North Carolina, South Carolina, Tennessee, Texas, Virginia. Slave states include the Confederate states as well as Delaware, Kentucky, Maryland, Missouri.

Credit Cards, Race, and Entrepreneurship
16
(2004). Table 5 replicates the regressions in Table 2 on transitions into self-employment using
CPS data, and splits the results by state type. Column (1) focuses on states that were not slave
states immediately prior to the Civil War; the coefficient on black*no limit is 0.0054 and
significant at the 10 percent level. Column (2) focuses on states that were slave states
immediately prior to the Civil War; the coefficient on black*no limit is 0.0126 and significant at
the 1 percent level. The results in these two columns suggest that black individuals residing in
former slave states were more likely to transition into self-employment following an increase in
credit availability than were black individuals in non-slave states. We can reject the null
hypothesis that the coefficients on black*no limit are the same across the two samples at the 18
percent level. Columns (3) and (4) present results from splitting the sample into Confederate and
non-Confederate states; Columns (5) and (6) present results from splitting the sample into states
with and without anti-miscegenation laws in 1967; Columns (7) and (8) present results from
splitting the sample into states with and without fair housing laws in 1968. We find similar
results across all four of these measures for discrimination: black individuals residing in states
with higher levels of discrimination were more likely to transition into self-employment
following an increase in credit card availability. We can reject the null hypotheses that the
coefficients for black*no limit are the same across the two samples for the confederate state
measure (at the 30 percent level), for the anti-miscegenation law state measure (at the 18 percent
level), and for the no fair housing law state measure (at the 2 percent level). This suggests to us
that credit cards were a mechanism used to overcome discrimination-based barriers to
entrepreneurial entry for black individuals in the 1970s and 1980s.

Credit Cards, Race, and Entrepreneurship
17
D. The Role of Credit Cards in Self-employment
We finally use the Survey of Consumer Finances (SCF) data set to investigate whether
credit cards were indeed the mechanism by which black individuals financed self-employment.
It is important to point out that the SCF includes data on levels of self-employment, not
transitions into self-employment, and that the SCF is a smaller dataset covering fewer states and
years.16 Note from the summary statistics in Table 1 that about 25 individuals in the sample are
black and self-employed; this low number limits the power of any statistical analysis.
In Table 6, we present regression results from the SCF data set. State and year fixed
effects are included in all regressions, and results are clustered at the state level. In column (1)
we verify the relationship between black*no limit and self-employment that we found using the
CPS data. The results show that changing the state credit card interest rate cap to no limit
negatively affects the probability of being self-employed, and that black individuals living in a
no limit state (black*no limit ) have a significantly higher probability of being self-employed. In
columns (2) and (3) we investigate the effect of credit card ownership on self-employment. To
do this, we split the sample into individuals who own a credit card (column 2) and individuals
who do not own a credit card (column 3). The coefficient on black*no limit is positive and
significant for the subsample that owns a credit card and positive but not significant for the
subsample that does not own a credit card. We interpret this result as weak evidence that black
individuals who own a credit card are more likely to be self-employed if they live in a state with
no limit on credit card interest rates. While consistent with our argument, the difference in
16 We also verified that the basic results from the CPS data hold when using a smaller subsample of the CPS that more closely resembles the sample found in the SCF dataset.
Credit Cards, Race, and Entrepreneurship
18
coefficients is not statistically significant;17 as discussed above, the lack of statistical power from
the small amount of data in the SCF dataset is unsurprising. A limitation to this approach is that
while we observe credit card ownership, we do not have detailed data on credit card use, so we
cannot ascertain whether individuals were actually using their credit cards to finance
entrepreneurial activity as opposed to other non-business activity. However, the SCF data do
show that self-employed individuals own a greater number of credit cards than non self-
employed individuals.18
V. Conclusion
No previous study to our knowledge has empirically documented how variation in credit
card interest rates influenced entrepreneurship across different demographic groups. This
question is crucial, since prior work has documented that black individuals are more likely to
encounter friction when trying to obtain financing. The Marquette decision provides an
exogenous shock to credit access by essentially deregulating the credit card markets in many
states, allowing credit card companies to extend credit to new borrowers. We find strong
evidence that black individuals were more likely to transition into self-employment after a state
eliminated its interest rate cap, and weak evidence that black individuals with credit cards were
more likely to be self-employed. Consistent with Blanchflower et al. (2003), we offer qualitative
evidence that black entrepreneurs face financial frictions when dealing with lenders. We link
17 The p-value in a two-tailed test is approximately 0.20. 18 The 1983 and 1986 SCF data include information on the number of bank and general purpose credit cards owned by an individual. Based on data from over 4,000 individuals, the average non-self-employed individual owns 0.9 credit cards; the average self-employed individual owns 1.4 credit cards. We can reject the null hypothesis that these numbers are the same at the 99 percent confidence level.
Credit Cards, Race, and Entrepreneurship
19
these results by showing that, after a state eliminates its interest rate cap, blacks in that state are
more likely to transition into self-employment if that state has historically had higher levels of
discrimination. Our evidence is consistent with a scenario in which blacks face discrimination
through regular lending channels; this discrimination is a barrier to entry that results in higher
finance costs. Credit cards are a mechanism that black entrepreneurs can use to overcome this
barrier because it does not require face-to-face interactions with a lender. While the result is
especially pronounced for black entrepreneurs, there is no evidence of a similar effect for non-
black entrepreneurs. We believe this is because credit cards allow black entrepreneurs to
circumvent discrimination, or the fear of discrimination, by avoiding face-to-face applications
for financing.
There are several important limitations to our analysis. For the purposes of our empirical
analysis, we assume that within-state changes to credit card limits had an immediate effect on the
rates offered to individuals with credit cards in that state, and that rate changes in other states had
little to no effect on the rates offered within state. Evidence from Knittel and Stango (2003) is
consistent with this assumption, but further investigation is warranted. However, because our
analysis compares states with large changes in rates to states with small changes in rates, this
assumption means that any effect we find may be attenuated from the actual effect. For example,
while a state may have retained an 18 percent cap, individuals in that state may, in later periods,
be using out of state credit cards with much higher limits issued by a bank in a “no limit” state.
Hence, any difference in self-employment or credit card use between such a state and a state that
changes from an 18 percent limit to no limit will be reduced. The direction of this bias works
against us finding a result. Another limitation is that while we treat states’ elimination of caps as
an exogenous shock following the Marquette decision, we cannot explain why some states

Credit Cards, Race, and Entrepreneurship
20
remove rate caps and others do not, let alone predict when a state will remove its cap. It may be
that states removing rate caps and subsequent increases in black transitions into entrepreneurship
are endogenous. However, we surmise that it is unlikely that states removed interest rate caps
because black entrepreneurs or black would-be entrepreneurs were credit constrained and
lobbied the statehouse to change the law. After all, the text of the Marquette decision never
mentions the impact of credit cards on black entrepreneurs. In any case, results provided in the
appendix show that the same basic pattern emerges if the analysis instead compares black
transitions before and after the Marquette decision.
Finally, due to data limitations, we cannot directly observe that black entrepreneurs who
obtained credit cards after the Marquette decision actually used those cards to finance
entrepreneurial ventures. We instead rely on several pieces of evidence that suggest this scenario
occurred. We should point out that there may be a demand-related explanation for our results, as
well. Namely, it could be that the increased availability of credit cards to black individuals lead
to increased spending by black individuals on goods and services sold by firms owned by self-
employed blacks, which in turn lead to the creation of more firms owned by self-employed
blacks.19 However, the fact that entrepreneurs own more credit cards than non-entrepreneurs
argues against this demand-related explanation.
Our results have several implications for the academic literature and for public policy.
First, this work makes a significant contribution to the empirical work on financing
entrepreneurship because it is one of the few studies to focus on credit cards, which are one of
the most important financing tools used by small-business entrepreneurs. While prior research
19 A demand shock could also arise if there are non-black individuals with similar preferences who also experience an increase in credit card availability.

Credit Cards, Race, and Entrepreneurship
21
has focused on venture capital financing, our paper provides a more representative view of how
entrepreneurship is financed in the United States. In doing so, we have demonstrated that
variation in credit card interest rates can influence entrepreneurial entry, most likely because
credit card companies extend more credit when rates are uncapped. This effect may be most
pronounced among individuals who are most likely to be denied credit prior to the increase in
rates, namely black individuals. Thus, our results support the notion that public policies can have
a significant impact on black self-employment rates, as found by others. Aaron K. Chatterji,
Kenneth Y. Chay and Robert W. Fairlie (2010) investigate the impact of affirmative action in
government contracting and find that the programs had a significant impact on black self-
employment and employment in the targeted cities. While the Marquette decision was not aimed
specifically at increasing black entrepreneurship, it appears to have indirectly stimulated
entrepreneurial activity by making credit more available to black entrepreneurs. Finally, our
work provides additional support for the notion that black entrepreneurs face liquidity
constraints. Future work should examine whether the entrepreneurs who created businesses in
Marquette’s wake went on to succeed in their ventures and successfully paid back their credit
card loans.
Credit Cards, Race, and Entrepreneurship
22
References
Acemoglu, Daron, Simon Johnson and James A. Robinson. 2001. “The Colonial Origins of Comparative Development: An Empirical Investigation.” American Economic Review, 91(5): 1369-1401. Ausubel, Lawrence M. 1997. “Credit Card Defaults, Credit Card Profits, and Bankruptcy.” The American Bankruptcy Law Journal, 71(Spring): 249-270. Baxter, W. F. 1995. “Section 85 of the National Bank Act and Consumer Welfare.” 1995 Utah Law Review. Black, Sandra E., and Philip E. Strahan. 2002. “Entrepreneurship and Bank Credit Availability.” Journal of Finance, 57(6): 2807-2833. Blanchflower, David G., Andrew J. Oswald. 1998. “What Makes an Entrepreneur?” Journal of Labor Economics, 16(1): 26-60. Blanchflower, David G., Phillip B. Levine and David J. Zimmerman. 2003. “Discrimination in the Small Business Credit Market.” Review of Economics and Statistics, 85(4): 930-943. Borjas, George J., and Stephen G. Bronars. 1989. “Consumer Discrimination and Self-Employment.” Journal of Political Economy, 97: 581-605. Cetorelli, Nicola, and Philip E. Strahan. 2006. “Finance as a Barrier to Entry: Bank Competition and Industry Structure in Local U.S. Markets.” Journal of Finance, 61(1): 437-461. Chatterji, Aaron K., Kenneth Y. Chay, and Robert W. Fairlie. 2010. “The Impact of City Contracting Set-Asides on black Self-Employment and Employment.” Unpublished. Collins, William J. 2004. “The Housing Market Impact of State-level Anti-discrimination Laws, 1960--1970.” Journal of Urban Economics, 55: 534-564. Ellis, Diane. 1998. “The Effect of Consumer Interest Rate Deregulation on Credit Card Volumes, Charge-Offs, and the Personal Bankruptcy Rate.” FDIC Report 98-05. Fairlie, Robert W. 1999. “The Absence of the African American Owned Business: An Analysis of the Dynamics of Self-employment.” Journal of Labor Economics, 17(1): 80-108. Fairlie, Robert and Alicia Robb. 2008. “Race and Entrepreneurial Success: Black-, Asian-, and White-Owned Businesses in the United States.” Cambridge: MIT Press. Fan, Wei, and Michelle White. 2003. “Personal Bankruptcy and the Level of Entrepreneurial Activity.” Journal of Law and Economics, 46: 543-567.
Credit Cards, Race, and Entrepreneurship
23
Fryer, Roland G., Jr. 2007. “Guess Who's Been Coming to Dinner? Trends in Interracial Marriage over the 20th Century.” Journal of Economic Perspectives, 21(2): 71-90. Gropp, Reint, John Karl Scholz and Michelle White. 1997. "Personal Bankruptcy and Credit Supply and Demand." Quarterly Journal of Economics, 112: 217-251. Hout, Michael, and Rosen, Harvey S. 2000 “Self-Employment, Family Background, and Race.” Journal of Human Resources, 35(4):670-92. Hsu, David. 2004. “What Do Entrepreneurs Pay for Venture Capital Affiliation?” Journal of Finance, 59(4): 1805-1844. Hurst, Erik, and Annamaria Lusardi. 2004. “Liquidity Constraints, Household Wealth, and Entrepreneurship.” Journal of Political Economy, 112(21): 319-347. Kawaguchi, Daiji. 2005. “Negative Self Selection into Self-employment Among African Americans.” Topics in Economic Analysis & Policy, 5(1). Kerr, William R., and Ramana Nanada. 2009. “Democratizing Entry: Banking Deregulation, Financing Constraints, and Entrepreneurship.” Journal of Financial Economics, 94(1): 124-149. Knittel, Christopher R., and Victor Stango. 2003. “Price Ceilings as Focal Points for Tacit Collusion: Evidence from Credit Cards.” American Economic Review, 93(5): 1703-1729. Krosnzer, Randall S. and Philip E. Strahan. 1999. “What Drives Deregulation? Economics and Politics of the Relaxation of Bank Branching Restrictions.” Quarterly Journal of Economics, 114 (4): 1437-1467. Lindh, Thomas and Henry Ohlsson. 1996. “Self-employment and Windfall Gains: Evidence from the Swedish Lottery.” The Economic Journal, 106(439): 1515-1526. Meyer, Bruce D. 1990. “Why Are There So Few Black Entrepreneurs?” NBER Working Paper 3537. Nanda, Ramana. 2009. “Entrepreneurship and the Discipline of External Finance.” Harvard Business School Working Paper 08-047. Petersen, Mitchell A., and Rajan G. Raghuram. 2002. “Does Distance Still Matter? The Information Revolution in Small Business Lending.” Journal of Finance, 57(6): 2533-2570. Puri, Manju, and David T. Robinson. 2006. “Who are Entrepreneurs and Why Do They Behave That Way?” http://www.lse.ac.uk/collections/RICAFE/pdf/Puri_Manju.pdf.
Credit Cards, Race, and Entrepreneurship
24
Ravina, Enrichetta. 2008. “Love & Loans. The Effect of Beauty and Personal Characteristics in Credit Markets.” http://ssrn.com/abstract=1107307. Robb, Alicia M., Robert W. Fairlie and David T. Robinson. 2009. “Financial Capital Injections among New Black and White Business Ventures: Evidence from the Kauffman Firm Survey.” Unpublished. Stango, Victor. 2002. “Pricing with Consumer Switching Costs: Evidence from the Credit Card Market.” The Journal of Industrial Economics, 50(4): 475-492. Stango, Victor. 2003. “Strategic Responses to Regulatory Threat in the Credit Card Market.” The Journal of Law and Economics, 46(2): 427-452. Zinman, Jonathan. 2002. “Liquidity and Consumer Behavior: Some Evidence from the Deregulation of Credit Card Interest Rate Ceilings.” http://dspace.mit.edu/bitstream/handle/1721.1/8171/51909744.pdf?sequence=1.
Credit Cards, Race, and Entrepreneurship
25
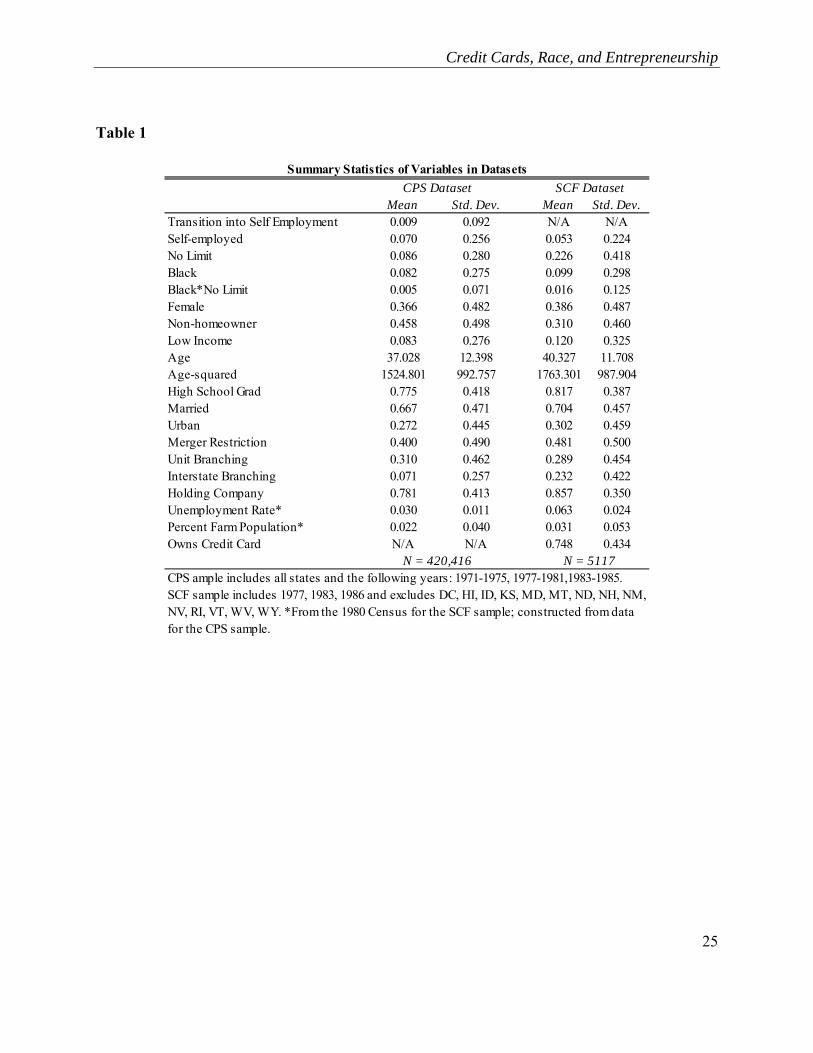
Table 1
Mean Std. Dev. Mean Std. Dev.Transition into Self Employment 0.009 0.092 N/A N/ASelf-employed 0.070 0.256 0.053 0.224No Limit 0.086 0.280 0.226 0.418Black 0.082 0.275 0.099 0.298Black*No Limit 0.005 0.071 0.016 0.125Female 0.366 0.482 0.386 0.487Non-homeowner 0.458 0.498 0.310 0.460Low Income 0.083 0.276 0.120 0.325Age 37.028 12.398 40.327 11.708Age-squared 1524.801 992.757 1763.301 987.904High School Grad 0.775 0.418 0.817 0.387Married 0.667 0.471 0.704 0.457Urban 0.272 0.445 0.302 0.459Merger Restriction 0.400 0.490 0.481 0.500Unit Branching 0.310 0.462 0.289 0.454Interstate Branching 0.071 0.257 0.232 0.422Holding Company 0.781 0.413 0.857 0.350Unemployment Rate* 0.030 0.011 0.063 0.024Percent Farm Population* 0.022 0.040 0.031 0.053Owns Credit Card N/A N/A 0.748 0.434
CPS ample includes all states and the following years: 1971-1975, 1977-1981,1983-1985. SCF sample includes 1977, 1983, 1986 and excludes DC, HI, ID, KS, MD, MT, ND, NH, NM, NV, RI, VT, WV, WY. *From the 1980 Census for the SCF sample; constructed from data for the CPS sample.
Summary Statistics of Variables in DatasetsSCF DatasetCPS Dataset
N = 420,416 N = 5117
Credit Cards, Race, and Entrepreneurship
26
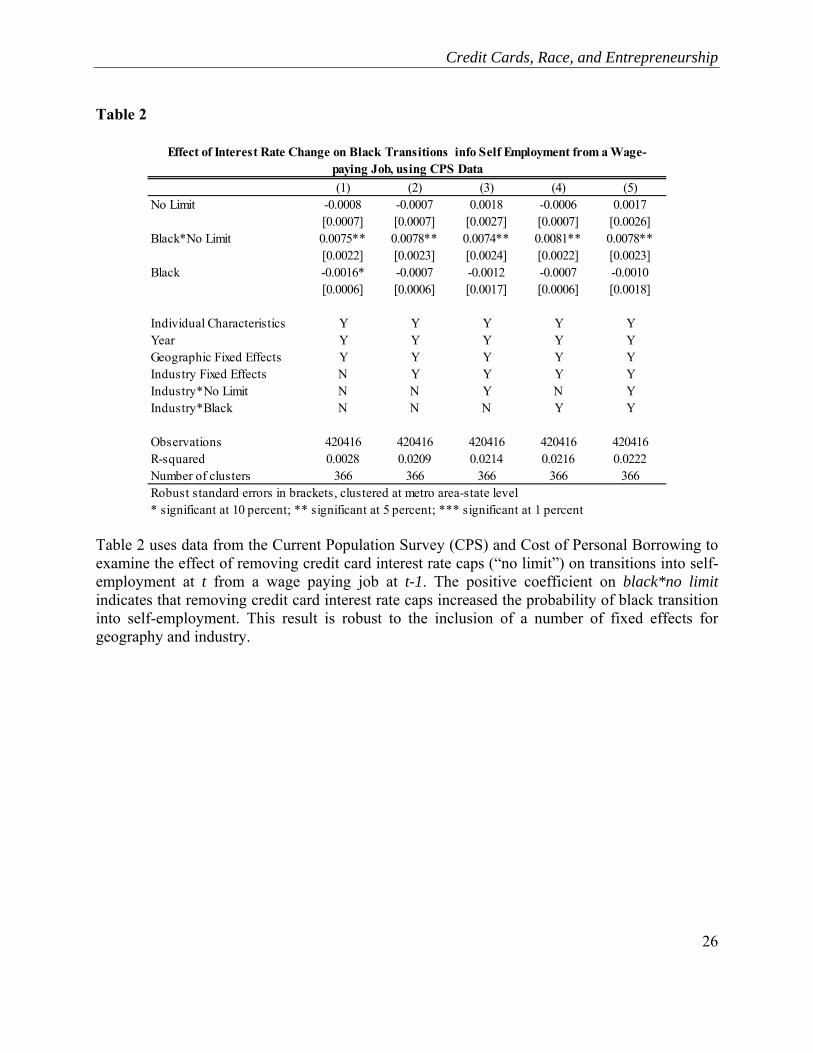
Table 2
(1) (2) (3) (4) (5)No Limit -0.0008 -0.0007 0.0018 -0.0006 0.0017
[0.0007] [0.0007] [0.0027] [0.0007] [0.0026]Black*No Limit 0.0075** 0.0078** 0.0074** 0.0081** 0.0078**
[0.0022] [0.0023] [0.0024] [0.0022] [0.0023]Black -0.0016* -0.0007 -0.0012 -0.0007 -0.0010
[0.0006] [0.0006] [0.0017] [0.0006] [0.0018]
Individual Characteristics Y Y Y Y YYear Y Y Y Y YGeographic Fixed Effects Y Y Y Y YIndustry Fixed Effects N Y Y Y YIndustry*No Limit N N Y N YIndustry*Black N N N Y Y
Observations 420416 420416 420416 420416 420416R-squared 0.0028 0.0209 0.0214 0.0216 0.0222Number of clusters 366 366 366 366 366Robust standard errors in brackets, clustered at metro area-state level* significant at 10 percent; ** significant at 5 percent; *** significant at 1 percent
Effect of Interest Rate Change on Black Transitions info Self Employment from a Wage-paying Job, using CPS Data
Table 2 uses data from the Current Population Survey (CPS) and Cost of Personal Borrowing to examine the effect of removing credit card interest rate caps (“no limit”) on transitions into self-employment at t from a wage paying job at t-1. The positive coefficient on black*no limit indicates that removing credit card interest rate caps increased the probability of black transition into self-employment. This result is robust to the inclusion of a number of fixed effects for geography and industry.

Credit Cards, Race, and Entrepreneurship
27
Table 3
(1) (2) (3) (4) (5)No Limit -0.0008 -0.0008 -0.0008 -0.0008 -0.0008
[0.0007] [0.0007] [0.0007] [0.0007] [0.0007]Black*No Limit 0.0078*** 0.0077*** 0.0078*** 0.0080*** 0.0077***
[0.0022] [0.0023] [0.0022] [0.0023] [0.0025]Black*Interstate Branching -0.0023 -0.0024
[0.0016] [0.0017]Black*Merger Restriction 0.0003 0.0018
[0.0012] [0.0017]Black*Unit Branching 0.0000 -0.0005
[0.0013] [0.0017]Black*Holding Company -0.0016 -0.0021
[0.0011] [0.0014]Black -0.0019*** -0.0021*** -0.0020*** -0.0008 -0.0008
[0.0007] [0.0008] [0.0007] [0.0008] [0.0008]Interstate Branching 0.0019** 0.0019**
[0.0008] [0.0008]Merger Restriction 0.0002 0.0001
[0.0007] [0.0007]Unit Branching 0.0007 0.0007
[0.0010] [0.0010]Holding Company -0.0003 -0.0002
[0.0008] [0.0008]
Individual Characteristics Y Y Y Y YYear Y Y Y Y YGeographic Fixed Effects Y Y Y Y Y
Observations 420416 420416 420416 420416 420416R-squared 0.0032 0.0032 0.0032 0.0032 0.0032Number of clusters 366 366 366 366 366Robust standard errors in brackets, clustered at metro area-state level* significant at 10 percent; ** significant at 5 percent; *** significant at 1 percent
Effect of Interest Rate Changes and Bank Deregulation on Black Transitions into Self Employment from a Wage-paying Job, using CPS Data
Table 3 uses data from the Current Population Survey (CPS), Cost of Personal Borrowing, and state banking deregulation from Kroszner and Strahan (1999) to examine the effect of removing credit card interest rate caps (“no limit”) and four types of bank deregulation (“interstate branching”, “merger restriction”, “unit branching” and “holding company”) on transitions into self-employment at t from a wage paying job at t-1.
Credit Cards, Race, and Entrepreneurship
28
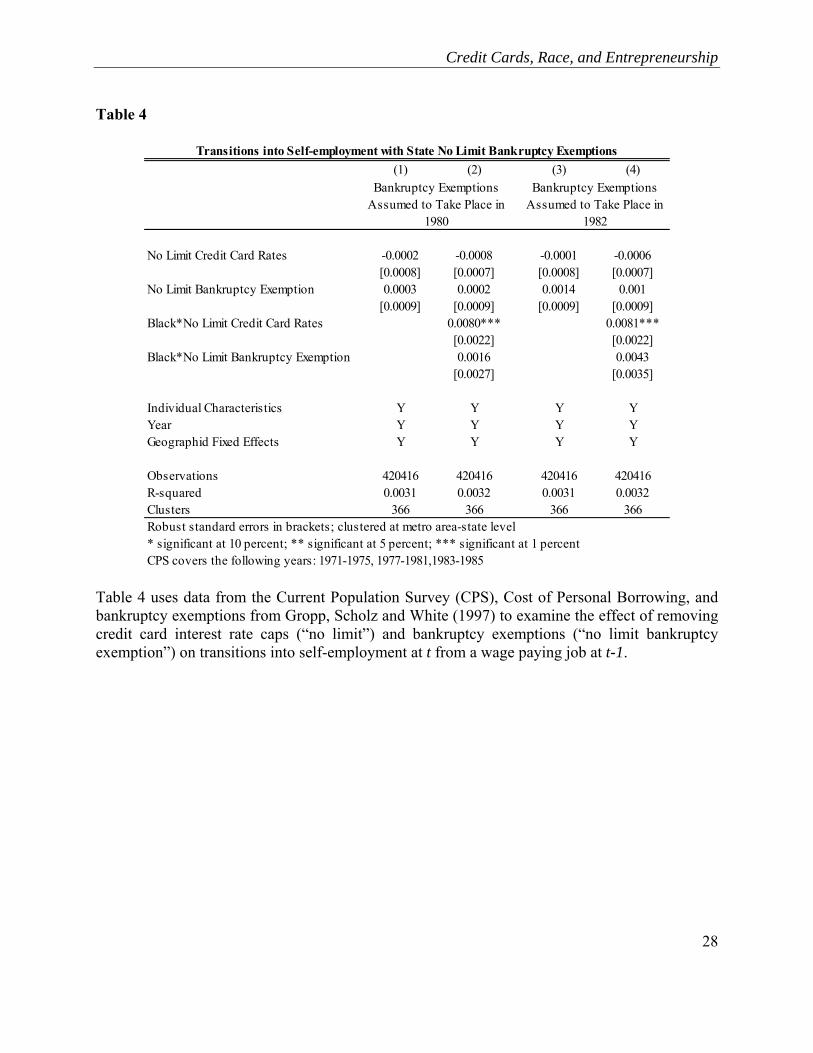
Table 4
(1) (2) (3) (4)
No Limit Credit Card Rates -0.0002 -0.0008 -0.0001 -0.0006[0.0008] [0.0007] [0.0008] [0.0007]
No Limit Bankruptcy Exemption 0.0003 0.0002 0.0014 0.001[0.0009] [0.0009] [0.0009] [0.0009]
Black*No Limit Credit Card Rates 0.0080*** 0.0081***[0.0022] [0.0022]
Black*No Limit Bankruptcy Exemption 0.0016 0.0043[0.0027] [0.0035]
Individual Characteristics Y Y Y YYear Y Y Y YGeographid Fixed Effects Y Y Y Y
Observations 420416 420416 420416 420416R-squared 0.0031 0.0032 0.0031 0.0032Clusters 366 366 366 366Robust standard errors in brackets; clustered at metro area-state level* significant at 10 percent; ** significant at 5 percent; *** significant at 1 percentCPS covers the following years: 1971-1975, 1977-1981,1983-1985
Transitions into Self-employment with State No Limit Bankruptcy Exemptions
Bankruptcy Exemptions Assumed to Take Place in
1980
Bankruptcy Exemptions Assumed to Take Place in
1982
Table 4 uses data from the Current Population Survey (CPS), Cost of Personal Borrowing, and bankruptcy exemptions from Gropp, Scholz and White (1997) to examine the effect of removing credit card interest rate caps (“no limit”) and bankruptcy exemptions (“no limit bankruptcy exemption”) on transitions into self-employment at t from a wage paying job at t-1.

Credit Cards, Race, and Entrepreneurship
29
Table 5
(1) (2) (3) (4) (5) (6) (7) (8)
No Yes No Yes No Yes No Yes
No Limit -0.0007 -0.0025 -0.0005 -0.0059*** -0.0005 -0.0024 0.0000 -0.0013[0.0008] [0.0026] [0.0008] [0.0022] [0.0008] [0.0025] [0.0009] [0.0010]
Black*No Limit 0.0054* 0.0126*** 0.0060** 0.0146* 0.0055* 0.0127*** 0.0024 0.0110***[0.0029] [0.0046] [0.0025] [0.0079] [0.0029] [0.0047] [0.0025] [0.0027]
Black -0.0005 -0.0037*** -0.0008 -0.0038*** -0.0006 -0.0038*** -0.0005 -0.0034***[0.0007] [0.0010] [0.0006] [0.0011] [0.0006] [0.0010] [0.0006] [0.0009]
Individual Characteristics Y Y Y Y Y Y Y YYear Fixed Effects Y Y Y Y Y Y Y YGeographic Fixed Effects Y Y Y Y Y Y Y Y
Observations 304747 115669 324077 96339 306334 114082 242039 178377R-Squared 0.003 0.0036 0.003 0.0038 0.0031 0.0035 0.0032 0.003Clusters 236 130 258 108 237 129 188 178Robust standard errors in brackets; clustered at metro area-state level* significant at 10 percent; ** significant at 5 percent; *** significant at 1 percent
Anti-miscegenation Law? No Fair Housing Law?
Effect of "No Limit" Regulations on Black Transitions into Self Employment, by State Type, using CPS Data
Sample Restriction: Former Slave State? Former Confederate State?
Table 5 uses data from the Current Population Survey (CPS), Cost of Personal Borrowing, and state history to examine variation across state types of the effect of removing credit card interest rate caps (“no limit”) on transitions into self-employment at t from a wage paying job at t-1. The four state types considered are: states which allowed slavery at the start of the Civil War (slave state), states which were part of the Confederacy (confederate state), states which repealed anti-miscegenation laws only after the U.S. Supreme Court’s 1967 decision in Loving v. Virginia (anti-miscegenation law) and states which did not have fair housing laws until the federal Fair Housing Act of 1968 (no fair housing law). Sources for the latter two are Fryer (2007) and Collins (2004), respectively.

Credit Cards, Race, and Entrepreneurship
30
Table 6
(1) (2) (3)Sample Restriction: Owns Credit Card? No Restriction Yes No
No Limit -0.0309* -0.0239 -0.0481[0.0182] [0.0192] [0.0306]
Black*No Limit 0.0774** 0.1011* 0.0045[0.0377] [0.0520] [0.0243]
Black -0.0425*** -0.0441*** -0.0424***[0.0083] [0.0072] [0.0151]
Individual Characteristics Y Y YDemographic Information Y Y YYear Fixed Effects Y Y YState Fixed Effects Y Y Y
Observations 4889 3686 1203R-Squared 0.0319 0.0367 0.0592Clusters 36 36 35
Effect of Race on Self Employment Levels, by Credit Card Ownership, using SCF Data
SCF excludes DC, HI, ID, KS, MD, MT, ND, NH, NM, NV, RI, VT, WV, WY; SCF includes only 1977, 1983, 1986. Robust standard errors in brackets; clustered at state. * significant at 10 percent; ** significant at 5 percent; *** significant at 1 percent.
Table 6 uses data from the Survey of Consumer Finances (SCF) and Cost of Personal Borrowing to examine the effect of removing credit card interest rate caps (“no limit”) on self-employment, and the extent to which this effect varies by credit card ownership.
Credit Cards, Race, and Entrepreneurship
31
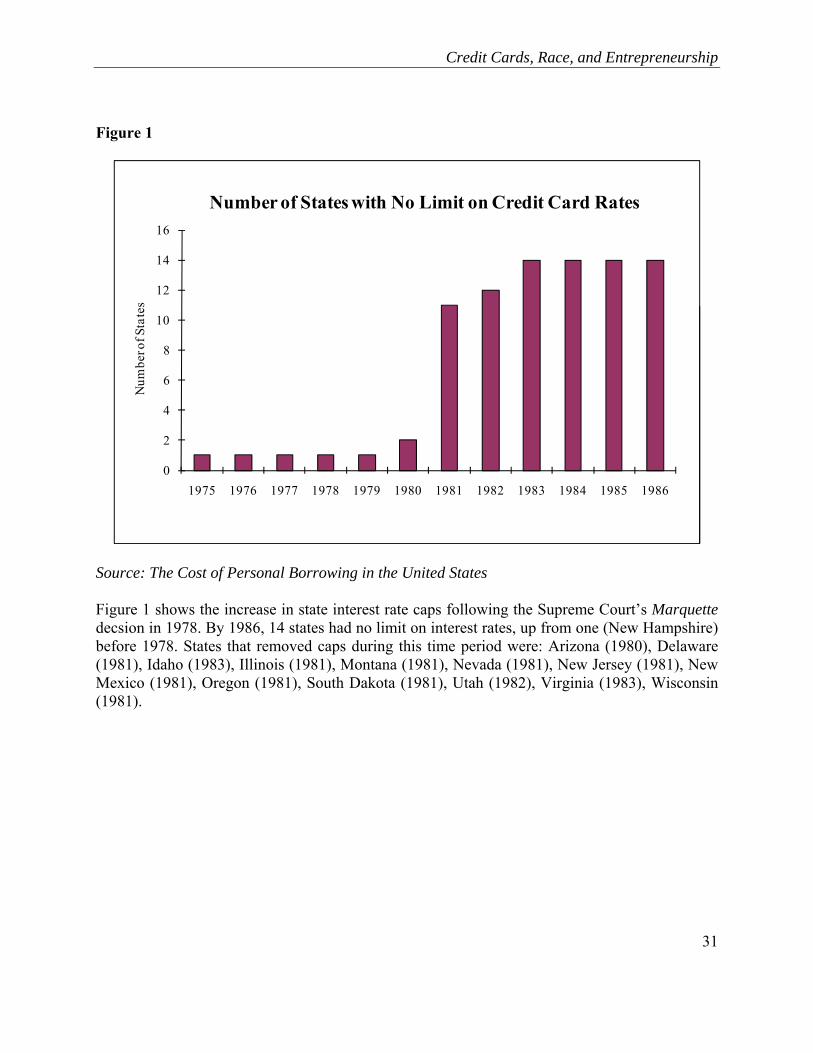
Figure 1
0
2
4
6
8
10
12
14
16
1975 1976 1977 1978 1979 1980 1981 1982 1983 1984 1985 1986
Num
ber o
f Sta
tes
Number of States with No Limit on Credit Card Rates
Source: The Cost of Personal Borrowing in the United States
Figure 1 shows the increase in state interest rate caps following the Supreme Court’s Marquette decsion in 1978. By 1986, 14 states had no limit on interest rates, up from one (New Hampshire) before 1978. States that removed caps during this time period were: Arizona (1980), Delaware (1981), Idaho (1983), Illinois (1981), Montana (1981), Nevada (1981), New Jersey (1981), New Mexico (1981), Oregon (1981), South Dakota (1981), Utah (1982), Virginia (1983), Wisconsin (1981).

Credit Cards, Race, and Entrepreneurship
32
Figure 2
-0.02
0
0.02
0.04
-4 -3 -2 -1 0 1 2 3 4
Changes in Population Share of Black Individuals Before and After States Remove Caps
Source: Current Population Survey 1971-1975, 1977-1981, 1983-1985
Figure 2 shows the changes in black population in a state for four years before and after it removed its interest rate cap. Dashed lines represent the 95 percent confidence interval.
Credit Cards, Race, and Entrepreneurship
33
Appendix 1: Race and Liquidity Constraints
Prior literature (Blanchflower, Levine and Zimmerman, 2003; Robb, Fairlie and
Robinson, 2009) shows that blacks were more likely than whites to be turned down by bank
lenders. In this appendix we verify that blacks were more likely than whites to be turned down,
or feared being turned down, by bank lenders in the late 1970s and early 1980s. To do this, we
report correlations between black and answers to selected questions from the 1977 and 1983
Survey of Consumer Finances (SCF). The questions differ across the two surveys. For the 1977
survey, respondents were asked about their opinions on institutions that lend money or extend
credit, including stores, banks, finance companies, and credit unions. Respondents were not
asked to distinguish between lenders and creditors.20 In column 1, we report results of answers to
the question, “In your opinion, have you ever been treated unfairly in your credit transactions?”
Black individuals were more likely to answer yes to the question, but this result is not
statistically significant. In column 2, we report results of answers to the question, “Are there any
(other) practices of creditors or lenders that you think are unfair and would like to see changed?”
Black individuals were more likely to answer yes to the question, but again this result is not
statistically significant. For the 1983 survey, respondents were asked about their experience
obtaining loans or credit. In column 3, we report results of answers to the question, “In the past
few years, has a particular lender or creditor turned down any request you (or your husband/wife)
made for credit or have you been unable to get as much credit as you applied for?” Black
individuals were more likely to answer yes to the question, and this result is statistically
significant at the 10 percent level. In column 4, we report results of answers to the question,
20 The specific language is: “In this interview please think of the terms ‘creditors’ and lenders’ as the same thing.”

Credit Cards, Race, and Entrepreneurship
34
“Was there any time in the past few years that you (or your husband/wife) thought of applying
for credit at a particular place, but changed your mind because you thought you might be turned
down?” (Emphasis in SCF survey questionnaire). Black individuals were more likely to answer
yes to the question, and this result is statistically significant at the 1 percent level. Taken
together, survey answers suggest that black individuals encountered frictions, or believed they
would encounter frictions, in their access to financing. However, because of the way the
questions were asked, we cannot distinguish if the frictions were primarily from lenders
requiring face-to-face interactions, or from lenders such as credit card companies which did not
require such interactions. It is worth noting that Blanchflower et al. (2003), using Survey of
Small Business Finance data from 1993 and 1998, reported similar qualitative findings: that
black-owned firms were more likely to report being concerned about credit market problems and
less likely to apply for credit because of fear of being turned down.
(1) (2) (3) (4)
Dependent Variable:Treated
Unfairly?
Unfair Practices You Want to
Change?
Turned Down or Unable to Obtain?
Afraid of being Turned Down?
Black 3.7915 2.1454 0.0692* 0.1155***[2.2671] [1.5042] [0.0370] [0.0221]
Year 1977 1977 1983 1983Individual Characteristics X X X XDemographic Information X X X XState Fixed Effects X X X X
Observations 1534 1534 2077 2080R-Squared 0.032 0.047 0.090 0.071Clusters 35 35 35 35
SCF Survey Questions on Fairness of Lenders and Availability of Loans
Robust standard errors in brackets; clustered at state. * significant at 10 percent; ** significant at 5 percent; *** significant at 1 percent. SCF excludes DC, HI, ID, KS, MD, MT, ND, NH, NM, NV, RI, VT, WV, WY.
Credit Cards, Race, and Entrepreneurship
35
Not for Publication
Appendix 2: Additional Results
This appendix contains additional results from the datasets not reported in the article.
A. Effect of post Marquette dummy on Black Transitions into Self-Employment
In this appendix we investigate whether the main results of the analysis hold when
focusing only on the Marquette decision instead of on changes to state-level credit card interest
rate caps. The main coefficient of interest is the interaction black*post Marquette, which we
expect to be positive, as was the coefficient on black*no limit. In fact, the coefficient on
black*post Marquette is positive in all regressions. However, the results are sensitive to the year
considered for the post period. The Marquette decision was passed in December 1978. The
results are not significant when 1979 is considered the first year of the post period, but are
significant for 1980, 1981, 1982.
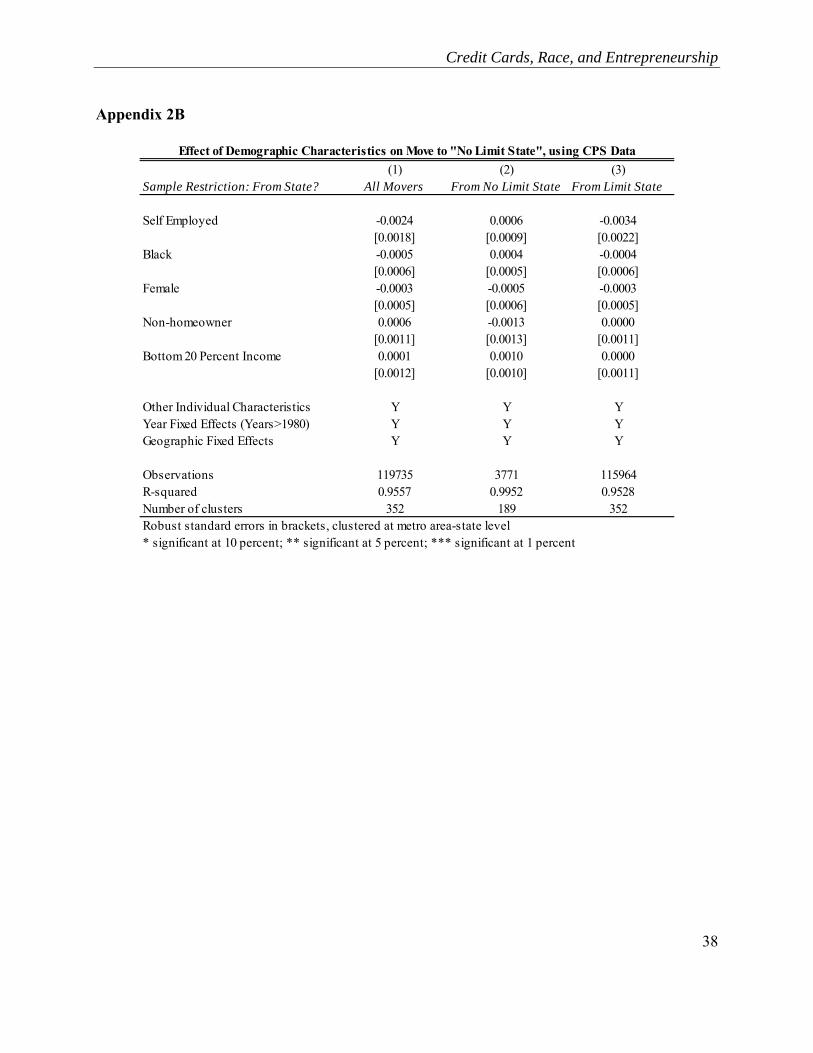
B. Relationship between Individual Moves and Demographic Characteristics
In this appendix we investigate the demographics of individuals who undertake interstate
moves. We use data from the CPS from 1980-1985 (data not available for earlier time periods).
The coefficient on black is insignificant in all regressions, indicating that black individuals were
no more likely to move than non-black individuals. These results give us confidence that the
effects we report are not driven by a propensity of black entrepreneurs to move to states which
have recently removed interest rate caps.

Credit Cards, Race, and Entrepreneurship
36
C. CPS Results on Smaller Subsamples
In this appendix, we verify the basic relationship between black*no limit and self-
employment for smaller subsamples of the CPS data. The smaller subsamples more closely
match the year and states for which Survey of Consumer Finance (SCF) data are available. For
convenience, coefficients on explanatory variables other than no limit and black*no limit have
been suppressed. Column (1) replicates the basic model used in Table 2 above, but uses fixed
effects at the state level. Column (2) restricts the sample to only those states that are common
across the CPS and SCF dataset. Column (3) further restricts the sample to only those states and
years that are common across the CPS and SCF dataset.21 In general, the results show that when
interest rates are allowed to rise individuals identified as black are more likely to be self-
employed. The coefficient on black*nolimit increases as the sample is increasingly more
restricted, suggesting the possibility that the SCF sub-sample over-represents states that were
positively affected by the change in regulation.
21 The SCF covers years 1977, 1983, and 1986, but there is no CPS data from 1986, so 1985 is used instead. Also, as noted above, the SCF does not include information for DC, HI, ID, KS, MD, MT, ND, NH, NM, NV, RI, VT, WV, WY.

Credit Cards, Race, and Entrepreneurship
37
Appendix 2A.
(1) (2) (3) (4)t>1978 t>1979 t>1980 t>1981
Post Marquette -0.0006 -0.0007 -0.0007 -0.0007[0.0011] [0.0010] [0.0011] [0.0011]
Black*Post Marquette 0.0014 0.0018* 0.0026** 0.0027**[0.0011] [0.0010] [0.0011] [0.0013]
Black -0.0024*** -0.0024*** -0.0024*** -0.0023***[0.0008] [0.0007] [0.0006] [0.0006]
Individual Characteristics Y Y Y YYear Fixed Effects Y Y Y YGeographic Fixed Effects Y Y Y Y
Observations 420416 420416 420416 420416R-Squared 0.0031 0.0031 0.0031 0.0031Clusters 366 366 366 366Robust standard errors in brackets; clustered at metro area-state level* significant at 10 percent; ** significant at 5 percent; *** significant at 1 percent
Effect of Post Marquette on Black Transitions into Self-employment (CPS Data)
Post-Period Defined as:
Credit Cards, Race, and Entrepreneurship
38
Appendix 2B
(1) (2) (3)Sample Restriction: From State? All Movers From No Limit State From Limit State
Self Employed -0.0024 0.0006 -0.0034[0.0018] [0.0009] [0.0022]
Black -0.0005 0.0004 -0.0004[0.0006] [0.0005] [0.0006]
Female -0.0003 -0.0005 -0.0003[0.0005] [0.0006] [0.0005]
Non-homeowner 0.0006 -0.0013 0.0000[0.0011] [0.0013] [0.0011]
Bottom 20 Percent Income 0.0001 0.0010 0.0000[0.0012] [0.0010] [0.0011]
Other Individual Characteristics Y Y YYear Fixed Effects (Years>1980) Y Y YGeographic Fixed Effects Y Y Y
Observations 119735 3771 115964R-squared 0.9557 0.9952 0.9528Number of clusters 352 189 352Robust standard errors in brackets, clustered at metro area-state level* significant at 10 percent; ** significant at 5 percent; *** significant at 1 percent
Effect of Demographic Characteristics on Move to "No Limit State", using CPS Data

Credit Cards, Race, and Entrepreneurship
39
Appendix 2C
(1) (2) (3)
No Limit 0.0038 0.0008 -0.0003[0.0032] [0.0030] [0.0035]
Black*No Limit 0.0109** 0.0131** 0.0159**[0.0039] [0.0040] [0.0037]
Individual Characteristics Y Y YYear Y Y YState Fixed Effects Y Y YState Subsample CPS SCF SCFYear Subsample CPS CPS SCF
Observations 571034 496588 134711R-squared 0.0288 0.0281 0.0266Clusters 51 37 37
Robust standard errors in brackets; clustered at state* significant at 10 percent; ** significant at 5 percent; *** significant at 1 percent
SCF Year Subsample includes only 1977, 1983, 1986CPS Year Subsample includes 1971-1975, 1977-1981,1983-1985CPS State Subsample includes all states.
Effect of Interest Rate Changes on Self-employment Using CPS Data Sub-Samples
SCF State Subsample excludes DC, HI, ID, KS, MD, MT, ND, NH, NM, NV, RI, VT, WV, WY