creating improved survey data products using linked
TRANSCRIPT
Creating Improved Survey Data Products Using Linked Administrative-Survey Data
Michael Davern Bruce D Meyer Nikolas Mittag
Davern NORC at the University of Chicago 55 East Monroe Street 30th Floor Chicago IL 60603Davern-Michaelnorcorg
Meyer Harris School of Public Policy Studies University of Chicago 1155 E 60th Street Chicago IL 60637 bdmeyeruchicagoedu
Mittag CERGE-EI Politickyacutech vězňů 7 Prague 1 110 00 Czech Republic nikolasmittagcerge-eicz
Any opinions and conclusions expressed here are those of the authors and do not necessarily represent the views of the New York Office of Temporary and Disability Assistance (OTDA) or the US Census Bureau The CPS-OTDA data analysis was conducted at the Chicago Census Research Data Center by researchers with Special Sworn Status and the results were reviewed to prevent the disclosure of confidential information
1
Introduction
Survey researchers catalogue the potential sources of survey errors that can influence the estimates derived from surveys (Federal Committee on Statistical Methodology (FCSM 2001) These survey errors can enter the survey at many different points and in different ways The goal of a good survey design is to make conscious decisions about what types of error you are willing to reduce given the level of funding and the specific question you would like the data to answer The five basic sources of error are (1) Sampling error (2) Sample coverage error (3) Non-response error ndashincluding both unit and item non-response (4) Measurement error and (5) Processing error (FCSM 2001) In this paper we focus specifically on the improvements to survey estimate quality that are possible through data linkage by reducing the substantial amount of measurement error and bias that has been observed in critical policy relevant estimates derived from surveys in Medicaid enrollment and Supplemental Nutrition Assistance Program (SNAP) receipt A similar approach could also be used to reduce bias from non-response
Past research has demonstrated substantial measurement error and bias in the estimates for the policy relevant concepts of Medicaid enrollment and SNAP receipt derived from surveys Work done on the Current Population Survey found that 43 of those linked to administrative data showing Medicaid coverage to not self-report having the coverage (false negatives) On the other hand one percent of respondents in the CPS reported having Medicaid coverage that could not be confirmed through the linkage With the substantial portion of Medicaid enrollees not reporting Medicaid in the CPS there is a substantial overall undercount (Davern et al 2009a) Research on survey misreporting of SNAP has found that a substantial share of true recipients do not report receipt in the survey For New York Celhay et al (2015) find false negative rates of 42 and 26 percent in the CPS and ACS Meyer et al (2014) find even higher rates in the same surveys for Illinois (48 and 32 percent) and Maryland (53 and 37 percent) On the other hand the false positive rates (true non-recipients reporting SNAP receipt) are low at around one percent (eg 12 percent for the NY ACS) resulting in the substantial net underreporting of food assistance that is documented in Meyer et al (2015ab) and Meyer and Mittag (2015)
This amount of survey error and estimate bias for Medicaid and SNAP is a serious problem for the policy research community and the Federal Statistical system as these survey estimates are used for critical purposes Medicaid and SNAP are two critical noncash benefits provided by states and funded through a federal-state partnership and they are critical for surveys to measure accurately for several reasons First those people who receive these benefits are better off than a similar family or individual who does not receive these benefits as they have more resources to acquire food and access to medical care When measuring concepts like the Supplemental Poverty Measure having accurate knowledge of who has and who has not received these benefits is critical to coming up with a complete picture of the resources that a person or family has access to provide for their needs (US Census 2015) The impact of making adjustments for these noncash benefits on poverty measures can have large demographic and overall poverty rate implications for understanding who is in or not in poverty (US Census 2015) The problem associated with making these kinds of adjustments for non-cash benefits is that they often rely on survey estimates known to have significant measurement error and that undercount the participation in these programs
In addition to measuring poverty these data are critical for (1) providing general knowledge and statistics on the programs (2) evaluating these programs to see whether specific policy objectives are met over time (3) aiding official budgeting by the Congressional Budget Office as they ldquoscorerdquo legislation and provide cost estimates for critical legislative initiatives such as the Affordable Care Act (Congressional Budget Office 2007) as well as simulation models used by federal agencies such as the Urban TRIM model (Urban Institute 2015) They are also used for official purposes by agencies to develop important health expenditure estimates for the country and states (Cuckler et al 2013) Given these important uses of the survey data and the evidence that these data have considerable measurement error and bias it is critical that the survey research community take steps to improve the data products for the data that are used for these purposes In this paper we use past research findings to estimate the magnitude of data quality gains that would be possible if agencies or policy research began to routinely use the partially corrected estimates that can be obtained using linked data methods
2
Linking Data as a Way to Reduce Measurement Error in Estimates
One way to try to improve on the potential limitations of any data system is to combine it with other sources of data through linkage in an attempt to estimate error and minimize bias For example by combining survey reported data with program administrative data we can create improvements in the ultimate estimates and data products used for important policy related purposes Linked data have been used to assess and potentially improve sample coverage (Celhay Meyer and Mittag 2015 Bee Gathright and Meyer 2015) the linked data have been used to impute variables (Davern et al 2009a) substituting administrative values for reported values (Nicholas and Wiseman2010 Hokayem et al forthcoming Meyer and Mittag 2015) supplement survey reported data (Abowd et al 2006) and for making simple corrections (Davern et al 2009a Mittag 2013 Schenker et al 2010) In this paper we explore one of the potential benefits of combining administrative data with survey data by estimating bias and reducing the measurement error in survey responses
We use methodologies that have been used by survey researchers to validate self-reported survey data against some other external or validated standards The approach takes survey reported data and uses them in an equation to predict some external or validated standard for a sub-set of cases or all the cases that could be linked Then the model developed using this approach is used to develop a partial correction for survey data that are not able to be linked to the external source or validated An example of the method is Schenker et al (2010) who start with a set of data from NHANES that has both the self-reported survey items and clinically measured items to diagnose hypertension diabetes and obesity They then model the clinically diagnosed values using the self-reported values along with potential covariates of measurement error Once the model is developed on the NHANES data they use the model to multiply impute clinical outcomes for data on which they do not have the actual clinical outcomes in the National Health Interview Survey using a model based multiple imputation methodology Davern et al (2009a) used a similar procedure where they linked Medicaid administrative data to earlier releases of the Current Population Survey (CPS) data and then used the model developed on these earlier years of linked data to impute an administrative data indication of Medicaid enrollment given self-reported Medicaid status and other measurement error related covariates Mittag (2013) used a similar approach using food stamp (SNAP) administrative data linked to the American Community Survey (ACS) data to correct estimates of receipt of food stamps out of sample in the ACS We discuss the advantages and disadvantages of these methods compared to other approaches such as direct substitution further below
To illustrate the impact these models can have on improving the data and reducing measurement error we use a Mean Squared Error (MSE) metric of the gains in estimator quality that would be possible using linked data Survey research often aggregates estimator bias and variance into MSE The MSE is defined by
MSE=Bias Squared + Variance
The MSE of an estimator is the expected value of the square of its deviation from the true parameter of interest so when evaluating the quality of different survey estimators preference is given to the one with the smaller MSE In our tables below we take the square root of the MSE or the Root Mean Squared Error (RMSE) in order to put the measure on the same scale as the original statistics It is more accurate to say that we report an estimate of the RMSE since our bias and variance are estimates but the result of such calculations is often just referred to as the RMSE
We use findings from past administrative-survey linked research with policy relevant estimates of Medicaid and SNAP receipt to make the case that data producers should continue to invest in data linkage research More importantly they should start to take advantage of the large measureable improvements in survey estimate quality by creating enhancements to existing survey data products (including microdata summary data and report tabulations) that partially correct for the known measurement errors
3
Table 1 presents results from our application to Medicaid receipt The first four columns of numbers in Table 1 are drawn from Davern et al (2009a)1 In that paper the authors used the 2001-2002 Current Population Survey (CPS) linked to Medicaid Statistical Information System (MSIS) data from 2000-2002 to create a person level logistic regression model of Medicaid receipt Of the CPS respondents linked to MSIS and who show Medicaid enrollment at some point during the reference period roughly 43 do not report having Medicaid resulting in a Medicaid undercount (Davern et al 2009b) However because 47 of those linked do correctly self-report Medicaid enrollment is a critical variable to use in the regression model Stratifying on self-reported Medicaid status Davern et al (2009a) estimated two models to partially correct for survey measurement error (See Appendix A for the estimated model parameters) The first used logistic regression to predict whether a person received Medicaid in MSIS given that they did not report having Medicaid in the survey (ie a false-negative model) The second predicted whether a person received Medicaid given that they had reported Medicaid coverage in the survey (a true positive model) The coefficients from these two logistic regression models were used to predict each personrsquos probability of being enrolled in Medicaid in the 2007 and 2008 CPS given their self-reported coverage and other key co-variates such as age sex income and state of residence (representing coverage for calendar years 2006 and 2007) This process generated a predicted probability for each person in the 2007 and 2008 CPS and these person level predicted probabilities were used to develop estimates by state of having Medicaid (details of the model are presented in Davern et al 2009a)
The point of this reanalysis of those data is to add the last four columns below The estimated bias is measured as the difference between the state estimate of enrollment in 2006-2007 and the Medicaid enrollment numbers found on Kaiser State Health facts This number is likely biased as well and that bias can vary from state to state given how Kaiser compiles the estimates Nevertheless the numbers are an independent estimate of enrollment in those years for comparison purposes The first column RMSEs are for the unadjusted CPS (ie what you would get if you simply tabulated the CPS public use file for those two years and created a two-year average) Bias is estimated as the difference between the Kaiser rate and the CPS rate The second column of RMSEs represents the RMSEs from comparing the Kaiser rate to the CPS imputation rate based on the individual level predicted probabilities The final column is the percent reduction (negative numbers are the percent increase) between the two RMSEs for any given state
1 The standard errors for the imputed Medicaid Enrollment estimates in Davern et al (2009a) were incorrect and did not appropriately adjust for the design effect of the CPS complex sample design The standard errors in Table 1 of this paper for imputed Medicaid by state have been adjusted using the design effect of the CPS direct survey estimates
4
Table 1 Comparison of Medicaid Enrollment Estimates from our Partially Corrected Imputation Model to the Regular CPS Estimates by Selected Characteristics and State Average of Calendar Year 2006 and 2007
State
Medicaid Enrollment Estimate ‐ CPS
Medicaid Enrollment Estimate ‐ Imputed
Kaiser Medicaid Enrollment
Root Mean Squared Errors (RMSE)
Percent Reduction from RMSE‐CPS to RMSE‐Imputed Percent SE Percent SE Percent RMSE‐CPS RMSE‐Imputed
Alabama 112 085 139 093 147 358 124 6539 Alaska 79 068 103 077 119 406 177 5640 Arizona 150 098 175 105 158 126 200 ‐5820 Arkansas 153 093 174 098 179 275 110 5991 California 138 035 165 038 177 392 127 6769 Colorado 76 050 87 054 80 064 094 ‐4803 Connecticut 79 056 90 059 114 359 248 3098 Delaware 100 074 137 085 169 698 337 5171 District of Columbia 185 109 205 114 218 353 179 4938 Florida 83 040 117 047 116 335 047 8591 Georgia 98 059 129 067 134 370 086 7667 Hawaii 96 065 126 073 145 496 209 5782 Idaho 99 078 109 082 113 156 090 4219 Illinois 103 054 134 060 153 500 199 6020 Indiana 103 071 125 078 125 233 078 6657 Iowa 110 067 122 070 107 071 159 ‐12522 Kansas 85 069 108 077 91 094 187 ‐9870 Kentucky 136 084 147 086 167 317 221 3035 Louisiana 128 100 156 108 204 763 485 3638 Maine 182 084 216 089 197 175 210 ‐2005 Maryland 70 051 83 055 95 253 135 4657 Massachusetts 147 086 139 084 161 160 232 ‐4466 Michigan 119 064 127 065 151 324 247 2395 Minnesota 103 060 122 065 113 120 106 1209 Mississippi 167 113 165 112 180 168 184 ‐940 Missouri 115 072 158 083 125 123 343 ‐17824 Montana 107 090 66 072 92 178 269 ‐5101 Nebraska 78 066 116 079 100 223 181 1894 Nevada 52 054 71 062 68 171 068 6039 New Hampshire 56 042 73 048 83 277 116 5811 New Jersey 74 052 86 056 88 152 059 6133 New Mexico 147 101 181 109 203 566 246 5652 New York 156 053 162 054 216 602 536 1092 North Carolina 119 066 168 076 133 147 361 ‐14480 North Dakota 80 068 103 076 84 076 211 ‐17857 Ohio 120 063 135 066 141 220 093 5791 Oklahoma 123 084 155 092 147 259 120 5356 Oregon 100 074 118 080 91 113 279 ‐14614 Pennsylvania 93 051 133 060 153 603 210 6512 Rhode Island 171 090 167 089 157 173 135 2211 South Carolina 132 087 168 096 146 160 240 ‐4970 South Dakota 88 070 98 073 115 284 188 3365 Tennesse 141 095 220 113 206 654 179 7260 Texas 109 038 132 042 120 123 120 309 Utah 80 077 98 084 72 108 271 ‐15151 Vermont 172 093 209 100 192 221 195 1174 Virginia 71 052 81 055 85 146 066 5460 Washington 111 069 151 079 134 236 189 2006 West Virginia 140 091 163 097 167 288 106 6338 Wisconsin 115 079 120 080 122 104 083 2068 Wyoming 75 070 90 076 109 340 199 4161 Total - United States 114 011 138 012 143 289 054 8129 Source 2007 and 2008 CPS ASEC data files
Independent Medicaid Enrollment Estimate Downloaded September 2015 from Kaiser State Health Facts Downloaded Notes See httpkfforgmedicaidstate-indicatormonthly-medicaid-enrollment-in-thousands for notes and sources
5
For the US as a whole the RMSE for the model based imputed direct estimate is 81 lower than the RMSE for the direct CPS estimate This is a substantial reduction in RMSE which results mainly from the bias being reduced The direct CPS estimate is 114 and the imputed estimate is 138 which is much closer to the 143 in the Kaiser State Health Facts In most states the MSE decreased between the CPS direct survey estimate and imputed estimate There are however 12 states that saw an increase in bias with the imputed estimate The largest were in Utah Arizona North Dakota North Carolina and Missouri There is not a uniform reason explaining why these statesrsquo estimates do not improve with the current model but future research can look for potential reasons and attempt to improve on the fit of the model for these states For the state of Montana the increase in the bias in the modeled results derives from the fact that over half of those on Medicaid were missing the linking information Thus in Montanarsquos case too few people are imputed to have Medicaid as over half the enrollees were not linkable to the CPS (US Census Bureau 2008a) One way to fix this problem would be to not add a state specific fixed effect for Montana Other reasons for the decrease seem to be states with significantly lower than the national average Medicaid enrollment rate (North Dakota and Utah) and also could be due to how the states set up their Childrenrsquos Health Insurance Program--future work should examine this
Our second illustration of how simulations based on models from validation data can improve survey estimates examines SNAP receipt for small geographic areas2 in New York State The results in Table 2 are similar to those for Medicaid in Table 1 They are based on the model and results in Mittag (2013) which uses administrative SNAP records linked to the ACS to develop a method of correcting survey estimates for measurement error The validation data were created by linking administrative records on monthly SNAP payments for all recipients in New York State from the New York State Office of Temporary and Disability Assistance (OTDA) to the 2008-2012 ACS survey data The administrative records are based on actual payments that have been validated and the two data sources are linked at the household level with a high match rate Thus even though they are not free of error the linked data appear accurate enough that we consider them to be the unbiased estimate of receipt For further descriptions of the data and its accuracy see eg Celhay et al (2015) Harris (2014) Mittag (2013) and Scherpf et al (2014) As Celhay et al (2015) show the linked data reveal substantial error in reported SNAP receipt and amounts at the household level For example 26 percent of true recipient households do not report SNAP receipt in the ACS (false negatives) On the other hand the false positive rate (true non-recipients reporting SNAP receipt) is low at 12 percent resulting in the substantial net underreporting of government transfers that is documented in Meyer et al (2015ab) and Meyer and Mittag (2015)
The fifth column of Table 2 provides estimates of receipt rates and the number of recipients using the linked data that we consider to be the unbiased estimate for the 39 county groups that can be identified in the ACS public use data Comparing receipt rates to the survey based estimates in the first two columns underlines that there is net underreporting in all but one area and that reporting rates vary between these areas Harris (2014) examines reporting rates at the county level in detail
The main objective of this paper is to assess how the survey estimates compare to the results in columns three and four which contain estimates of the receipt rate and number of recipients using an imputation model to partial correct the survey reports The imputations are based on the method in Mittag (2013) who uses the linked ACS data to estimate the conditional distribution of administrative SNAP receipt and amounts received given reported receipt and a large set of covariates The conditional distribution of SNAP amounts can be seen as a continuous distribution with a mass point at 0 However we are only concerned with receipt and not with amounts received here so we only use the estimate of the binary part of the distribution We discuss extensions to continuous or mixed distributions below Using the estimated parameters of this conditional distribution we predict a probability of SNAP receipt for each household as with Medicaid above We then generate a receipt variable by taking 20 random draws from a Bernoulli distribution with the predicted probability for every household in the New York ACS sample Since we are interested in subgroup means here which are consistent under classical measurement error the estimates are
2 We use the counties that can be identified in the public use ACS data and pool counties that cannot be separated in the public use data
6
consistent with one imputation and standard multiple imputation yields the same results as the procedure we use here3 However taking multiple draws makes simulation error negligible and thus avoids having to correct the SEs for it
Table 2 Comparison of Estimated SNAP Receipt Rates in New York State and Counties From 2010 ACS Survey Reports and Imputation
Counties
SNAP Receipt Rate Estimate ‐ ACS
SNAP Receipt Rate Estimate ‐ Imputed Linked Data
Root Mean Squared Errors (RMSE)
Percent Reduction from RMSE‐ACS to RMSE‐Imputed Percent SE Percent SE Percent RMSE‐ACS RMSE‐Imputed
Albany 116 149 156 166 146 33 19 4085 Allegany Cattaraugus 146 183 184 197 193 50 22 5695 Bronx 411 102 477 104 521 110 45 5894 Broome Tioga 153 159 193 180 188 39 19 5169 Cayuga Madison Onondaga 126 092 166 103 164 40 10 7398 Chautauqua 159 194 192 218 215 59 32 4648 Chemung Schuyler 171 235 194 247 217 52 34 3555 Chenango Cortland 182 228 206 247 196 27 27 177 Clinton Essex Franklin Hamil 169 205 197 217 192 31 22 2705 Columbia Greene 94 226 145 272 102 24 50 ‐10730 Delaware Otswego Schoharie 108 161 160 206 151 46 23 5068 Dutchess 85 134 124 162 113 31 20 3672 Erie 174 095 205 100 209 36 11 7042 Fulton Montgomery 146 207 195 263 283 138 92 3337 Genesee Orleans 113 226 156 251 164 56 27 5274 Herkimer Oneida 166 155 196 165 218 54 28 4886 Jefferson Lewis 191 239 220 245 195 24 34 ‐4132 Kings (Brooklyn) 261 068 328 073 359 99 32 6774 Livingston Wyoming 122 242 161 264 138 29 35 ‐1951 Monroe Wayne 142 082 184 092 181 40 10 7595 Nassau 42 042 95 067 70 28 26 978 New York (Manhattan) 165 069 203 073 212 47 12 7507 Niagara 159 179 187 190 194 39 20 4805 Ontario 86 278 130 298 106 34 38 ‐1209 Orange 111 144 172 185 110 14 64 ‐34291 Oswego 181 263 209 271 221 48 30 3736 Putnam Westchester 60 062 106 081 94 34 15 5678 Queens 172 065 244 074 239 67 09 8691 Rensselaer 147 232 175 242 171 33 24 2625 Richmond (Staten Island) 110 121 155 141 169 60 19 6751 Rockland 138 159 181 178 151 20 35 ‐6877 Saratoga 80 165 106 176 93 21 21 ‐212 Schenectady 102 193 139 216 173 73 40 4577 Seneca Tompkins 110 270 155 291 134 36 36 ‐068 St Lawrence 164 341 203 344 215 62 36 4112 Steuben Yates 107 172 141 190 186 81 49 3979 Suffolk 56 053 107 073 91 36 17 5193 Sullivan Ulster 131 170 174 193 181 52 20 6084 Warren Washington 111 178 138 195 159 51 28 4451 Total - New York State 161 020 211 022 214 53 04 9286 Note Source is the 2010 American CommunitySurvey The measure of truth in the first two columns and the parameters of the imputation model are from NY
OTDAadministrative data linked to the 2010 ACS RMSE is ((estimate-truth)2+Var(estimate))05
The last three columns of Table 2 contain RMSE defined the same way as for Medicaid above We compute the bias in the survey and imputation based estimates as the difference in the numbers from the linked data in the fifth column Thus contrary to the Medicaid application the imputation model has been estimated using the same sample Mittag (2013) further discusses extrapolation across time and geography Our main statistic of interest is the percent reduction in RMSE when replacing the survey reports by the imputations in the last column ie by how
3 As discussed in Mittag (2013) correlations and model parameters as in Schenker et al (2010) are inconsistent under single and standard multiple imputation but the methods discussed here yields consistent estimates
7
much the imputations reduce error compared to uncorrected survey based estimates The numbers for the entire state of New York in the last row show that the imputation procedure reduces RMSE by an impressive 93 percent This is similar in magnitude to the reduction in RMSE for Medicaid and again mainly driven by the reduction in bias The survey understates receipt by 25 percent while the imputations fall short of the actual number of recipients by 1 percent only Standard errors are of a similar magnitude but slightly higher for the imputation
This pattern also drives the results at the local level The survey numbers underestimate receipt rates in all but one county while the imputation based numbers do not seem to be systematically biased They are larger than the true numbers in 21 out of 39 areas and smaller in 18 areas While the standard errors are slightly larger than in the survey the reduction in bias more than makes up for this Consequently the imputation based rates are more accurate than the survey in terms of estimated RMSE in 31 out of 39 areas The reductions in RMSE are substantial In 29 of these 31 areas RMSE is reduced by 25 percent or more and in 15 areas the imputation based measure cuts the error by more than half However RMSE of the imputed receipt rate is larger than the survey RMSE in 8 of the 39 areas Note that this result is primarily due to the fact that the survey closely replicates the numbers from the linked data for these 8 areas ie it is mainly driven by the good performance of the survey
Limitations of the Analysis
The Davern et al (2009a) model does not account for variance added as a result of imputation so that the MSEs for the imputed model are too small though the amount of variance due to imputation modeling will be minimal relative to the reduction in bias Future enhancements to the method should account for imputation model variance through using for example multiple imputation (Shenker et al 2007 2010 Rubin 1996) and corrections for the fact that the parameters of the imputation model are estimates (Murphy and Topel 2002)
The Kaiser State health Facts estimates of Medicaid enrollment are not measured without bias and each state has different ways they compile the data for Kaiser
There is not perfect concept alignment between the CPS measure and the Kaiser measure (the Kaiser measure is an average monthly enrollment and the CPS is a measure of Medicaid enrollment at any point in the last year) In general this would mean the administrative data counts should be even higher than the Kaiser counts
Universes between CPS and Kaiser are not the same Kaiser includes people in group quarters and who may have died during the year who would not be counted in CPS The impacts of these adjustments are important although will not significantly impact the findings of the paper (see US Census Bureau 2008 to better understand the magnitude)
The model was created using 2000-2001 MSIS data linked to 2000-2002 CPS data and was applied to microdata from the 2007-2008 COPS Several states experienced changes in their Medicaid program over this time span leading to some (but not all) of the anomalous findings In addition in many states the State Childrenrsquos Health Insurance Program (CHIP) was also changing and can often be confused or misreported as Medicaid coverage (Plotzke et al 2011)
One final limitation is that these types of techniques are only useful when there is an administrative data source with high quality linking variables available to link to the survey data
Discussion
In this discussion we address the immediate advantages and disadvantages of the model based imputation approach using linked survey and administrative data We then look at this approach to reduce measurement error and compare it to the survey costs and error reduction achieved through other commonly used approaches to reduce survey MSEs and address survey error
Policy researchers and survey researchers have advocated approaches to improve survey data using linked data One approach that has been considered is the direct substitution of administrative data for survey data In this case instead of asking the survey respondent whether they have received food stamps the receipt indicator would come directly from the administrative data While this approach has advantages such as accuracy and the potentially better
8
maintenance of correlations between variables it also has disadvantages that may include timeliness (the speed at which the linkage can be done can sometimes delay the overall release of the data and estimates) and confidentiality of the survey data Someone with access to the administrative data could more easily identify individuals on the survey data with such linkage and therefore access to the linked data is usually restricted Our approach is not a direct substitution but a model so that it allows for some uncertainty in imputed estimate ensuring a higher level of confidentiality The model based imputation allows for models to be developed and improved on older vintages of the data and then implemented quickly on new data and could be incorporated toward the end of the processingediting system assuming the program itself and the mechanisms that result in measurement error do not change significantly over time (an assumption that needs to be continually evaluated) A final advantage of the modelling approach is that if the data production agency (eg the Census Bureau) did not want to produce these imputed estimates due to increased cost and complexity in producing and processing the data they could simply produce model coefficients based on linked data (similar to those used by Davern 2009b and Mittag 2013 that are included in Appendix A) that policy researchers could use to create their own imputations and edits (and could potentially be distributed through data systems such as IPUMS) 4
Beyond the binary variables explored in this paper on SNAP receipt and Medicaid enrollment these types of models could be used to partially correct measurement error in amounts received or other continuous variables as well Mittag (2013) imputes both receipt and amounts received by estimating an otherwise continuous distribution with a mass point at zero This estimation can be done by combining a Probit-type model for being a recipient (ie being at the mass point) with a continuous model such as the truncated normal model in Mittag (2013) One could also use the simpler approach of estimating a regression model for amounts in addition to the take-up model of receipt in the validation data See Scholz Moffitt and Cowan (2009) for further discussion of this approach and an application to receipt of transfer programs but without access to validation data The work we referenced earlier by Schenker et al (2007 and 2010) explored these types of models for continuous variables such as height weight and body mass index as well
Comparisons to Other MSE Reduction Approaches
Most survey researchers use a standard set of tools to ensure a quality survey data collection In this vein to reduce non-response bias we need to increase response rates and we need to post-stratify the data to known census control totals we need to reduce item non-response and impute missing data using high quality imputation procedures to reduce coverage bias we need to increase coverage to reduce measurement error we need to conduct record check studies compare estimates to alternative sources and conduct cognitive interviews and pre-test to reduce processing error we need to check for errors being introduced during processing ndash making sure input data match output data and errors are not introduced during editing weighting imputation and disclosure editing processes Sampling error is measured using survey sample design variance estimates and is reduced by increasing the sample size and decreasing the design effect
Table 3 below highlights these approaches along with a rough assessment of the cost associated with reducing the MSE using these methods It is not meant to be an exhaustive list nor provide excessive detail on how these corrections are implemented but it is meant to provide the context for understanding where data linkage used to reduce measurement error can fit in with other commonly used approaches
4 As a final note on modelling to have high quality models both Mittag (2013) and Davern et al (2009a) found the most important predictor variable for these imputation models to be the self-reported indicator of receipt or enrollment from the survey data For these models to work well it would be important for agencies collecting the data to retain a minimal set of indicator items on the survey despite the high level of known measurement error
9
Table 3 Relative Cost of Selected Commonly Used Corrections for Survey Errors
Type of Survey Error Correction
Rough Relative Cost ($ to $$$$$)
Sampling increase sample size $$$$$ reduce design effect $
Non‐response (item and unit) increase Response Rate $$$$$ impute item missing data $ Post‐stratification weights $
Coverage increase coverage $$$$$ listing $$$$
Measurement cognitive interviews $ validate against other sources $ link to other data $
Processing transformation data checks $ data disclosure editing $ metadata checks $ variable output checks $ imputation checks $ editing checks $
Reducing sampling error is possible by increasing sample size but this option is expensive and grows less effective at reducing variance with each additional case that is added On the other hand decreasing the design effect of a survey can be a very cost effective way to reduce variance and MSEs A very commonly employed approach to reducing the MSE is to attempt to reduce unit level non-response in surveys Attempting to reduce unit level non-response has come under considerable scrutiny as of late as it is costly and there is little evidence it improves accuracy We have learned that spending a considerable amount of project funds on strategies aimed at increasing response rates (through working sample hard and incentives etc) can increase response rates However survey research is concerned with response bias and not response rates These expensive efforts have demonstrated little impact on final estimates and non-response bias (Groves 2006 Groves et al 2008) Survey researchers were optimizing the intermediate measure of response rate but it had little demonstrated impact on the ultimate measure of response bias (Groves 2006 Davern et al 2010 Davern 2013) In addition to addressing the problem of misreporting evidence from linkages to administrative data can also reassure us that unit nonresponse bias is small for key policy relevant variables such as income (Bee Gathright and Sullivan 2015 Celhay Meyer and Mittag 2015)
In light of the recent response rate research findings additional work should also be done on other expensive attempts to reduce bias in estimates (such as coverage error) to make sure the costs of reducing coverage error is justified by a reduction in bias We know that survey listing operations for example lead to improved coverage But the question is how significantly does improved coverage reduce non-response bias5 From our two analysis of Medicaid and Food Stamps we argue that in the realm of survey errors that (a) we can do something about and (b)
5 Data linkage to administrative data can facilitate other survey improvements besides reducing measurement error For example there is strong evidence that linking the sample frame to other sources of data can help surveys more efficiently allocate resources used in household listing (Montaquila 2011)
10
have a measureable impact on increasing the data quality (as measured by Mean Squared Error) reducing measurement error through linkage of administrative data to survey data seems to be an attractive area for achieving substantial MSE reductions And the cost of such measures is low compared to other approaches so that it would seem funds to pay for the linkage programs and modeling could be pulled from efforts that cost substantially more but do not have the same MSE impact such as overly aggressive measures to increase a surveyrsquos response rate
Current Infrastructure to Support this Work Exists but Needs Enhancement
Federal statistical agencies routinely get administrative data from agencies that run administrative programs for linkage purposes This arrangement works well for some programs which are operated by the federal government like social security and Medicare However many programs like TANF Food Stamps Medicaid and unemployment insurance are state run and acquiring the data from all states will require intense efforts over many years (with a good example being the LEHD program) While some of these state programs have useful national level data systems such as Medicaid many of them do not (such as TANF) Thus the bottom line is that the infrastructure exists and some data linking and sharing is occurring Also the modelling is advanced as well What has been lacking is the incorporation of the results from this research into the most widely used and circulated data products produced by the Federal Statistical Agencies In our opinion the additional funds needed to make this happen should be invested and will pay off not only in terms of higher quality estimates but also will allow critical policy research organizations such as the Congressional Budget Office the Congressional Research Service and the Office of the Actuary at CMS to have access to better estimates and microdata as they score legislation and forecast costs of programs into the future The CBO and the CMS Office of the Actuary already use the results of Davern et al (2009a) in their modeling but they would appreciate the consistent production of these kinds of estimates and data sets year after year rather than having them as one-off research projects
Conclusion
The federal statistical community should do more to correct for known survey measurement error It is convenient to create official estimates of uninsurance Medicaid enrollment and food stamp participation based on data from a single survey (eg the Current Population Survey or the American Community Survey) We know these data products have pronounced measurement error for policy relevant variables and we have also developed approaches that allow analysts to partially correct the measurement errors The examples of Medicaid and SNAP receipt underline that the improvements can be substantial as they reduce RMSE by 81 and 93 percent compared to estimates based on the survey data The corrections we propose do not compromise confidentiality of the data privacy of the respondents or violate the terms of the data sharing agreements among the agencies We know that all data (including survey and administrative data) have errors However it is critical we move beyond acknowledging the datarsquos limitations and begin to create new data products which blend the strengths of each data system in innovative ways to correct for known errors in one or the other set of data We need to use innovative methods to mitigate the flaws in any one data system to make better public policy related decisions
The reasons why it is now imperative for the Federal Statistical system to use linked data in the creation of official statistics reports and data products are (1) the foundational research for use of linked administrative data and survey data has been conducted for several potential sources (2) there is clear evidence from these research projects studying linked survey and administrative data that the amount of bias due to measurement error in the survey data responses could be significantly reduced (3) the unit level and item level non-response to household surveys is growing over time putting more pressure on our models (eg post-stratification adjustments) that adjust for unit level non-response and impute missing item data (4) a substantial sum of funds is being spent on surveys to reduce unit level non-response through expensiveaggressive follow-up that have demonstrated little improvement in reducing bias (5) the necessary infrastructure for sharing data among federal agencies and directives have been supplied by the Office of Management and Budget (Burwell 2014) Now is the time to start building the data products that use administrative data in production as it will improve official statistics reports and data products While not all linked administrative data and survey data are ready for production we believe that there are substantive areas of policy research (Medicaid enrollment Medicare enrollment SNAP Social Security Public Assistance and uninsurance) that have needed agreements in place and ongoing linkage projects that could be leveraged for improving our ability to make policy relevant estimates to evaluate and cost out policy proposals
11
References
Abowd J M Stinson M and Benedetto G (2006) Final report to the social security administration on the SIPPSSAIRS public use file project US Census Bureau Working Paper
Alexander J Trent Michael Davern and Betsey Stevenson (2010) ldquoInaccurate Age and Sex Data in the Census PUMS Files Evidence and Implicationsrdquo Public Opinion Quarterly 74 (3) 551-569
Bee C Adam Graton Gathright and Bruce D Meyer (2015) ldquoBias from Unit Non-Response in the Measurement of Income in Household Surveysrdquo University of Chicago working paper
Burwell Sylvia 2014 ldquoM-14-06 MEMORANDUM FOR THE HEADS OF EXECUTIVE DEPARTMENTS AND AGENCIES Guidance for Providing and Using Administrative Data for Statistical Purposesrdquo Office of Management and Budget httpswwwwhitehousegovsitesdefaultfilesombmemoranda2014m-14-06pdf
Congressional Budget Office 2007 ldquoBackground Paper CBOrsquos Health Insurance Simulation Model A Technical Descriptionrdquo Congressional Budget Office October 2007 Washington DC httpswwwcbogovpublication19224index=8712
Celhay Pablo Bruce D Meyer and Nikolas Mittag 2015 ldquoMeasurement Error in Program Participationrdquo Working Paper
Cuckler Gigi and Andrea Sisko 2013 ldquoModeling Per Capita State Health Expenditure Variation State-Level Characteristics Matterrdquo Medicare and Medicaid Research and Review 3(4)E1-E24 httpswwwcmsgovmmrrDownloadsMMRR2013_003_04_a03pdf
Davern Michael Holly Rodin Timothy J Beebe and Kathleen Thiede Call (2005) ldquoThe Effect of Income Question Design in Health Surveys on Family Income Poverty and Eligibility Estimatesrdquo Health Services Research 40(5)1534-1552
Davern Michael Holly Rodin Kathleen Thiede Call and Lynn A Blewett (2007) ldquoAre the CPS Uninsurance Estimates Too High An Examination of Imputationrdquo Health Services Research 42(5) 2038-2055
Davern Michael Jacob Alex Klerman David Baugh Kathleen Call and George Greenberg (2009b) ldquoAn Examination of the Medicaid Undercount in the Current Population Survey (CPS) Preliminary Results from Record Linkingrdquo Health Services Research 44(23) 965-87
Davern Michael Jacob Klerman Jeanette Ziegenfuss Victoria Lynch and George Greenberg (2009a) ldquoA Partially Corrected Estimate of Medicaid Enrollment and Uninsurance Results from an Imputational Model Developed off Linked Survey and Administrative Datardquo Journal of Economic and Social Measurement 34(4)219-240
Davern Michael Donna McAlpine Timothy J Beebe Jeanette Ziegenfuss Todd Rockwood and Kathleen Thiede Call (2010) ldquoAre Lower Response Rates Hazardous to Your Health Survey An Analysis of Three State Health Surveysrdquo Health Services Research 45 (5) 1324ndash1344
Davern Michael 2013 ldquoNonresponse Rates are a Problematic Indicator of Nonresponse Bias in Survey Researchrdquo Health Services Research 48(3)905-912
Federal Committee on Statistical Methodology (FCSM) 2001 ldquoMeasuring and Reporting Sources of Error in Surveysrdquo Washington DC Statistical Policy Office Office of the Management and Budget httpwwwfcsmgov01papersSPWP31_finalpdf Groves RM 2006 Nonresponse Rates and Nonresponse Bias in Household Surveys Public Opinion Quarterly 70 (4) 646-75
12
Groves RM E Peytcheva 2008 ldquoThe Impact of Nonresponse Rates on Nonresponse Bias A Meta-Analysisrdquo Public Opinion Quarterly 72 167-189
Harris B C (2014) Within and Across County Variation in SNAP Misreporting Evidence from Linked ACS and Administrative Records CARRA Working Paper 2014-05 US Census Bureau
Kaiser State Health Facts ldquo2006-2007 total monthly Medicaid enrollment December avgrdquo Downloaded from Kaiser state health facts 9202015 httpkfforgmedicaidstate-indicatormonthly-medicaid-enrollment-in-thousands for notes and sources
Kish Leslie 1965 Survey Sampling Wiley and Sons New York New York
Montaquila Jill Hsu Valerie and Brick J Michael (2011) Using a match rate model to predict areas where USPS-Based address lists may be used in place of traditional listing Public Opinion Quarterly 75 317-335
Meyer Bruce D and Nikolas Mittag 2015 ldquoUsing Linked Survey and Administrative Data to Better Measure Income Implications for Poverty Program Effectiveness and Holes in the Safety Netrdquo NBER Working Paper 21676 October
Meyer BD Mok WKC and Sullivan JX 2015a The Under-Reporting of Transfers in Household Surveys Its Nature and Consequences Harris School of Public Policy Studies University of Chicago Working Paper
Meyer BD Mok WKC and Sullivan JX 2015b Household Surveys in Crisis Journal of Economic Perspectives forthcoming Fall 2015
Mittag Nikolas 2013 ldquoA Method of Correcting for Misreporting Applied to the Food Stamp Programrdquo Harris School of Public Policy University of Chicago Chicago IL
Nicholas J and Wiseman M 2010 Elderly Poverty and Supplemental Security Income 2002-2005 Social Security Bulletin Vol 70(2)
Plotzke Michael Jacob Alex Klerman and Michael Davern 2011 ldquoHow Similar Are Different Sources of CHIP Enrollment Data Journal of Economic and Social Measurement 36(3) 213 ndash 25
Rubin Donald B 1996 ldquoMultiple Imputation after 18+ yearsrdquo Journal of the American Statistical Association 9(434)473-89
Schenker N and Raghunathan T E (2007) Combining information from multiple surveys to enhance estimation of measures of health Statist Med 26 1802ndash1811 doi 101002sim2801
Schenker N Raghunathan T E and Bondarenko I (2010) Improving on analyses of self-reported data in a large-scale health survey by using information from an examination-based survey Statist Med 29 533ndash545 doi 101002sim3809
Scherpf E Newman C and Prell M (2014) ldquoTargeting of Supplemental Nutrition Assistance Program Benefits Evidence from the ACS and NY SNAP Administrative Recordsrdquo Working Paper
Scholz JK Moffitt R and Cowan B 2009 Trends in income support In Changing poverty changing policies M Cancian and S Danzigereds Washington DC Russell Sage Foundation
Urban Institute 2015 TRIM3 project website trim3urbanorg downloaded on November 13 2015
US Census Bureau 2015 The Supplemental Poverty Measure 2014 P60-254 September 2015
US Census Bureau 2008a ldquoPhase II Research Results Examining Discrepancies between the National Medicaid Statistical Information System (MSIS) and the Current Population Survey (CPS) Annual Social and Economic
13
Supplement (ASEC)rdquo US Census Bureau Washington DC httpswwwcensusgovdidwwwsnaccdocsSNACC_Phase_II_Full_Reportpdf
US Census Bureau 2008b ldquoPhase III Research Results Refinement in the Analysis of Examining Discrepancies between the National Medicaid Statistical Information System (MSIS) and the Current Population Survey (CPS) Annual Social and Economic Supplement (ASEC)rdquo US Census Bureau Washington DC httpswwwcensusgovdidwwwsnaccdocsSNACC_Phase_III_Executive_Summarypdf
Actuary paper that uses the imputation model
httpswwwcmsgovmmrrDownloadsMMRR2011_001_04_a03-pdf
This approach has already been used by several health policy researchers to inform their work and the early working paper version was cited as a key source in the Congressional Budget Officersquos health reform model in 2009 and is currently being used to by the office of the actuary at CMS the CBO work can be seen here (httpwwwcbogovftpdocs87xxdoc871210-31-HealthInsurModelpdf) and the CMS work can be seen here (httpwwwcmsgovMMRRDownloadsMMRR2011_001_04_A03pdf) The Office of the Actuary at CMS offered the following comments
After studying the impact of using the unadjusted and adjusted Current Population Survey estimates of the uninsured population [using the method proposed by Davern et al 2010] in our per capita health spending model we believe that your Medicaid enrollment adjustments represent an improvement to our analysis of health spending behavior by state By adjusting Medicaid enrollment the uninsured population is reduced somewhat resulting in a smaller magnitude for the coefficient that represents the impact of the uninsured on health spending Although both the adjusted and unadjusted estimates of the uninsured have a negative impact on health expenditures the Medicaid adjustments from your models help us refine the magnitude of that effect
14
Variable Model 1 SE Model 2 SE
Intercept -06089 00424 07521 00635
Age
Age 00 - 05 13364 00391 0396 00465
Age 06 - 14 08797 00359 04068 00554
Age 15 - 17 06517 00411 01538 00629
Age 18 - 44 -00311 00253 01553 00411
Age 45 - 64 -10515 00434 -02539 00578
Age 65 + -17853 00669 -08579 00717
Health Insurance Allocation Status
Medicaid Status Edited -03439 00471
Health Insurance Status Imputed 03617 00174 -07819 00402
Health Insurance Status Reported -03617 00174 11258 00318
CPS Health Insurance Codes
Only Another Public Insurance Program Reported on CPS
11714 00383
Only Private Insurance Reported on CPS
-10714 00344
Other Public and Private Insurance Reported on CPS
00936 00549
Uninsured Reported on CPS -01936 00352
Only Medicaid Reported on CPS 01033 00474
Race and Ethnicity
Hispanic 01155 0046 -00447 00615
Black 05177 00364 01324 00606
American Indian 01917 00932 00797 01306
Asian or Pacific Islander -02467 00619 -000385 01035
White -05782 00341 -01635 00501
Sex
Appendix Model Parameter Estimates for the models used to impute Table 1 are in Table A1 and estimates used to impute Table 2 are in Table A2
Table A1 Logistic Regression Coefficients for Those CPS Cases Without Medicaid Recorded on the CPS (Model 1) and Those Cases With Medicaid Recorded (Model 2) Predicting the Probability o f Being Linked to the Medicaid Statistical Information System (MSIS) (Model 1) or Not Being Linked to the MSIS (Model 2)
15
Variable Model 1 SE Model 2 SE
Male -05109 00205 -03084 00358
Relationship to Reference Person
Parent
0888
00859
08454
01277
Spouse
Child
-05062
-02866
00424
00392
-06605
-01461
00603
00561
Other 01965 00344 01694 00675
Self -02917 00286 -02083 00501
Income
Zero Family Income Reported
Ratio to Poverty Lvl 0-49
Ratio to Poverty Lvl 050-75
Ratio to Poverty Lvl 075-99
Ratio to Poverty Lvl 100-124
Ratio to Poverty Lvl 125-149
Ratio to Poverty Lvl 150-174
Ratio to Poverty Lvl 175-199
Ratio to Poverty Lvl gt200
02475
03891
06237
045
01944
00504
-01552
-02717
-12808
00803
00506
00459
00423
00479
00437
00453
00449
00299
-02862
04922
05247
05368
01999
-01616
-021
-05104
-08718
01356
00596
00595
00657
006
00658
00755
00832
00431
State
Alabama -01379 00838 -00488 01543
Alaska -01272 01283 -00857 0193
Arizona 00813 00924 01248 01968
Arkansas 01515 01091 -02814 01458
California -0124 00571 03479 00803
Colorado -03486 01268 -03851 01663
Connecticut -01982 01463 -07219 0161
Delaware 02252 01268 02802 01787
District of Columbia 00206 01474 -00589 01606
Florida -01452 00674 -00341 01078
Georgia -03799 01081 -02252 01415
16
Variable Model 1 SE Model 2 SE
Hawaii 02828 01152 00564 01883
Idaho -02137 01245 -01441 01475
Illinois 01144 00772 -01066 01135
Indiana 01683 00907 -00716 01313
Iowa 00545 01058 0348 02038
Kansas -03241 01097 02111 01952
Kentucky
Louisiana
00305
-01636
01504
00813
-02099
-0571
01682
01666
Maine 118 00842 08533 01544
Maryland
Massachusetts
-04281
02211
01426
01252
-08764
-01872
02201
01296
Michigan
Minnesota
-01803
0223
0086
01305
00434
02205
01341
02103
Mississippi -03619 01207 -09372 01653
Missouri 04235 00936 03584 01665
Montana -10005 01522 -16887 02051
Nebraska 0159 00927 06703 0146
Nevada -06962 01272 -06033 01331
New Hampshire -01836 01159 07746 0144
New Jersey
New Mexico
-03858
01199
00947
00765
-06282
00559
01425
01575
New York -01396 00643 00361 00714
North Carolina 02104 00876 04162 01437
North Dakota -00914 01087 03506 01943
Ohio -00658 01049 02443 0121
Oklahoma 008 01111 -00671 01658
Oregon
Pennsylvania
Rhode Island
-00195
03005
03507
00911
0077
01055
-00192
05203
02558
01641
01267
01281
17
Variable Model 1 SE Model 2 SE
South Carolina 0174 0126 01124 02257
South Dakota -01485 01266 -02581 01482
Tennessee 09171 01029 09406 01872
Texas -06106 00661 -01475 0105
Utah -03107 01199 00172 01419
Vermont 11751 01149 0853 01672
Virginia -05826 01316 -04431 01817
Washington 06428 00758 04109 0163
West Virginia 03519 00882 02588 01363
Wisconsin -00958 01147 01001 01189
Wyoming -01949 01135 -00608 01771
Source 2001 and 2002 Expanded Sample CPS ASEC data files Linked to the 2000 and 2001 MSIS Note Effect coding (as opposed to dummy coding) was used for all categorical variables except for Sex (reference category for sex is female) Only Medicaid Reported on the CPS recorded on the CPS (the reference category was Medicaid and at least one other type of coverage reported on the CPS) and the Variable Zero Family Income Reported (the reference category was having at least some income --or loss of income reported) Plt001 Plt=01 Plt05
18
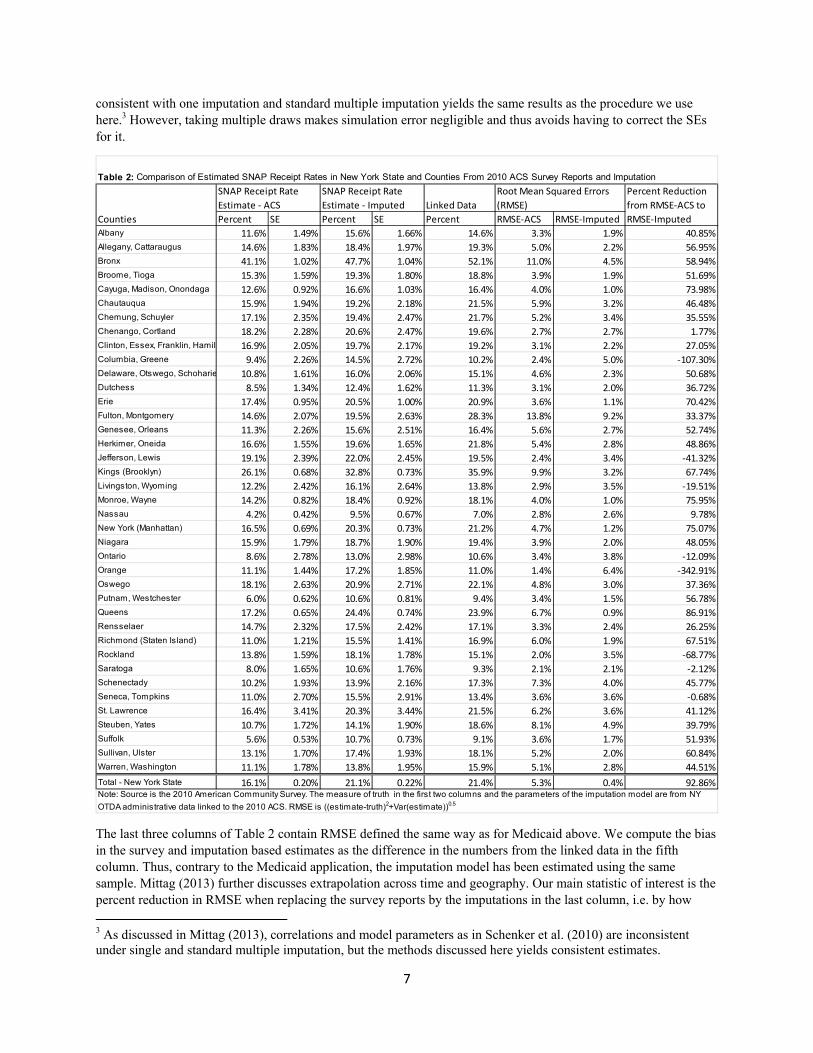

Variable Model 1 SE Model 2 SE
South Carolina 0174 0126 01124 02257
South Dakota -01485 01266 -02581 01482
Tennessee 09171 01029 09406 01872
Texas -06106 00661 -01475 0105
Utah -03107 01199 00172 01419
Vermont 11751 01149 0853 01672
Virginia -05826 01316 -04431 01817
Washington 06428 00758 04109 0163
West Virginia 03519 00882 02588 01363
Wisconsin -00958 01147 01001 01189
Wyoming -01949 01135 -00608 01771
Source 2001 and 2002 Expanded Sample CPS ASEC data files Linked to the 2000 and 2001 MSIS Note Effect coding (as opposed to dummy coding) was used for all categorical variables except for Sex (reference category for sex is female) Only Medicaid Reported on the CPS recorded on the CPS (the reference category was Medicaid and at least one other type of coverage reported on the CPS) and the Variable Zero Family Income Reported (the reference category was having at least some income --or loss of income reported) Plt001 Plt=01 Plt05
18