creating energy-efficient data centers paul scheihing u.s. department of energy office of energy...
TRANSCRIPT

Creating Energy-Efficient Data Centers
Paul ScheihingU.S. Department of Energy Office of Energy Efficiency and Renewable EnergyIndustrial Technologies Program
Data Center Facilities and Engineering Conference
Washington, DC
May 18, 2007

Why Data Centers?
• Highly energy-intensive and rapidly growing
• Consume 10 to 100 times more energy per square foot than a typical office building
• Large potential impact on electricity supplyand distribution
• Used about 45 billion kWhin 2005
• At current rates, powerrequirements could doublein 5 years.

Potential Benefits of Improved Data CenterEnergy Efficiency
• Save 20 billion kWh per year by 2015– Worth $2 billion, ≈ annual electricity
use in 1.8 million American homes
• Potentially defer need to build 2,300 MW of new generating capacity
– And avoid 3.4 million metric tons of carbon emissions (like taking 675,000 cars off the road)
• Extend life and capacity of existing data center infrastructures

Ratio of Total Data Center Power to IT Equipment Power
Building Existing Knowledge Base
• R&D Roadmap by Lawrence Berkeley National Lab (LBNL) identifies and prioritizes data center opportunities and research.
• With funding from PG&E and CEC, LBNL conducted benchmark studies of 22 data centers:
– Found wide variation inperformance (totalpower/IT power)
– Identified best practices
• DOE will greatly expandcurrent knowledge base.
To
tal
Po
wer
/IT
Po
wer

Energy Efficiency Opportunities
Server Load/ComputingOperations
Cooling Equipment
Power Distribution & Conversions

Data Center Energy Use
Typical Data Center Energy End Use
Server Load/ComputingOperations
Cooling Equipment
Power Conversions& Distribution
100 Units
33 UnitsDelivered
35 Units

Data Center Cooling and Power Conversion Performance Varies
Typical Practice Better Practice
Server Load/ComputingOperations
Cooling & Power
Conversions Server Load/ComputingOperations
Cooling & Power
Conversions

Typical Energy Flow/Use
Server Load/ComputingOperations
Cooling Equipment
Power Conversion & Distribution
Fuel Burned at Power Plant
Delivered Power
ElectricityGeneration & Transmission
Losses

Will reduce cooling needs
Typical Energy Flow/Use
Server Load/ComputingOperations
Cooling Equipment
Power Conversion & Distribution
Fuel Burned at Power Plant
Reducing server power requirements
Lowering power conversion losses
Electricity Generation & Transmission
Losses
Delivered Electricity
…ultimately reducing fuel burned at the power plant
Reducing power demand and losses

Server Load/ComputingOperations
Cooling Equipment
Power Conversion & Distribution
AlternativePower
Generation
• High voltage distribution
• Use of DC power
• Highly efficient UPS systems
• Efficient redundancy strategies
• Load management
• Server innovation
Energy Efficiency Opportunities
• Better air management
• Move to liquid cooling
• Optimized chilled-water plants
• Use of free cooling
• On-site generation
• CHP applications
• Waste heat for cooling
• Use of renewable energy
• Fuel cells

Opportunity Potential
Comparison of Projected Electricity Use,All Scenarios, 2007 to 2011
An
nu
al E
ner
gy
Use
(B
illi
on
kW
h/y
ear)
2007 2008 2009 2010 2011
2006 Baseline58.7
0
140
120
100
80
60
40
20
Business as usual Current trends
Improved operational management
Best practice
State of the art

What Is Needed
• Assistance in identifying the best opportunities for savings at each data center
• Outside validation to help convince management that addressing opportunities is feasible and cost-effective

DOE Data Center Team
• Industrial Technologies Program
• Building Technologies Program
• Hydrogen, Fuel Cells, & Infrastructure Technologies
• Federal Energy Management Program (FEMP)
• DOE National Laboratories

DOE Data Center Program Objectives
• Provide systems approach
• Build tools, expertise, and strategy
• Raise awareness of the opportunity
• Recognize industry leaders

Save Energy Now: Industry Assessments
• 200 completed• Natural gas savings =
52 trillion Btu/yr
– ≈ 725,000 U.S. homes– Carbon dioxide avoided =
3.3 million metric tons/year
• Cost savings opportunity = $475 million per year – Savings implemented or
planned = $256 million(154 plants)
< 9 months• Improve
insulation• Implement
steam trap program
• Clean heat transfer surfaces
9 mo. – 2 years• Heat feed water with
boiler blowdown• Lower excess oxygen• Flue gas heat recovery
2 – 4 years• Modify steam
turbine operation• Use oxygen for
combustion• Change process
steam use
> 4 years• Install CHP
system
Estimated Payback Periods for Recommended Actions
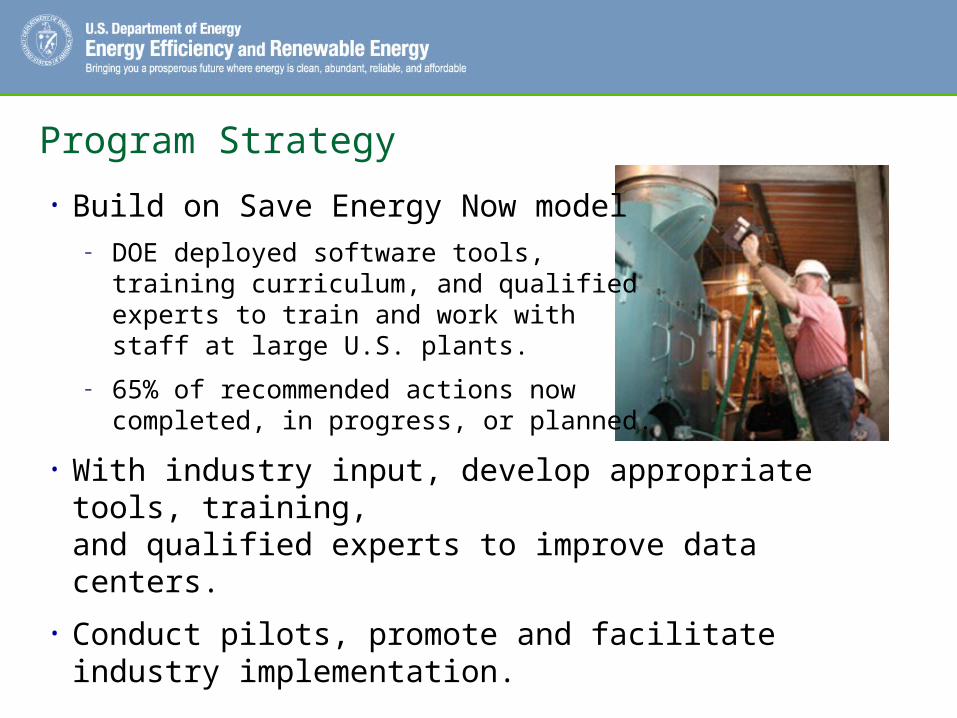
Program Strategy
• Build on Save Energy Now model– DOE deployed software tools,
training curriculum, and qualifiedexperts to train and work withstaff at large U.S. plants.
– 65% of recommended actions nowcompleted, in progress, or planned.
• With industry input, develop appropriate tools, training,and qualified experts to improve data centers.
• Conduct pilots, promote and facilitate industry implementation.

2007 Move Forward Plan
• Build strong liaisons and partnerships with industry
• Develop robust new energy assessment program
• Develop tools and info on best practices– Sub-system assessment protocol and analysis tool
– Assessment framework and energy profiling tool
• Conduct pilot assessments at data centers
• Provide awareness training
• Screen for industrial demonstrations
• Provide Federal procurement specifications

Stakeholders
• EPA
• States
• Utilities
• Industry Organizations
e.g., Green Grid, ASHRAE,
AFCOM, 7x24, SVLG
• Equipment suppliers
• Research organizations
• Consultants

How Can Industry Participate?
Register on web site to get regular updates Participate in Peer Review of products, protocols
and best practices– Sign up for Technical Working Groups on web site
Conduct Self Benchmarking and report results– Use tools from LBNL site and download protocol at :
http://hightech.lbl.gov/datacenters.html
Apply for Data Center Assessments (solicitation coming in Fall)
www.eere.energy.gov/datacenters/

Web-based Resources
http://hightech.lbl.gov/datacenters.htmlGood starting point for those seeking efficiency measures
Best Practices
Case Studies
Design Guidance
Self-benchmarking Guide
Benchmark data
Other Reports (demonstrations)
