cre video consumer mapping study
DESCRIPTION
The Council for Research Excellence (CRE) recently completed the largest and most extensive observational study of media usage ever conducted.A pioneering study conducted on behalf of the Nielsen-funded Council for Research Excellence (CRE) by Ball State University's Center for Media Design (CMD) and Sequent Partners dispels several popular notions about video media use, finding that Baby Boomers age 45-54 consume the most video media while confirming that traditional "live" television remains the proverbial "800-pound gorilla" in the video media arena.TRANSCRIPT

A Day in the Media LifeySome Findings From
The Video Consumer Mapping Study
CTAM Research Conference 09
The Council for Research Excellence@ The Nielsen Company

The Key Players Involved
• The Nielsen Company– Creator and supporter of the Council’s work
• Council for Research Excellence– A client-led group that operates independently from
Nielsen
• The Media Consumption and E C iEngagement Committee
– Selected and guided the Video Consumer Mapping Study
• Ball State University Center for Media Design
– A consumer-centric media insight and R&D facility
S t P t• Sequent Partners– A brand and media metrics consultancy
The Council for Research Excellence @ The Nielsen Company

Council for Research Excellence Active Membership
• Brad Adgate, Horizon Media• Shari Anne Brill, Carat*• Joanne Burns, 20th Television, Fox*• Michele Buslik , AAAA Media Research Committee;
T tC t TCM
• Michael Nathanson, Sanford C. Bernstein and Co.• Michael Orgera, Warner Brothers*• Jessica Pantanini, Bromley Communications• Mike Pardee, Scripps Networks*
TargetCast TCM• Alex Corteselli , Telerep • Laura Cowan, Rick Johnson & Co.• Susan Cuccinello, TVB• Paul Donato, The Nielsen Company
C
• David Poltrack, CBS• Beth Rockwood, Discovery Communications• Greg Ross, Procter & Gamble• Matt Ross, Hearst-Argyle Television• Lyle Schwartz, Mediaedge: CIA
• Colleen Fahey-Rush, MTV Networks• Nancy Gallagher, NBC Universal• Mike Hess, Carat • George Ivie, Media Ratings Council• Bob Ivins, Comcast Spotlight
• Ceril Shagrin, Univision• Tina Silvestri, NBC Universal• Noreen Simmons, Unilever*• Barbara Singer, Kraft*• Kate Sirkin, Starcom MediaVest Group
• Mark Kaline, Kimberly Clark• Michael Link, The Nielsen Company• Pat Liguori, ABC Owned Television Stations• Billy McDowell, Raycom Media*• Dan Murphy, Univision*
, p• Steve Sternberg, Magna*• Ira Sussman, CAB• Beth Uyenco, Microsoft Advertising*• Jack Wakshlag, Turner Broadcasting*• Richard Zackon Facilitator• Richard Zackon, Facilitator
*Media Consumption and Engagement Committee Members. The Committee members also include
• Tim Brooks, Consultant• Jane Clarke, Time Warner• Horst Stipp, NBC Universal
3
The Committee would also like to acknowledge former Council members: Betsy Frank (MTV networks), Vicky Champlin (Anheuser Busch), Bruce Goerlich (Zenith), for their dedication to the project while they were members of the CRE.
pp,
The Council for Research Excellence@ The Nielsen Company

VCM Study Objectives
Dimension current consumption of media—focusing on television and video and how it is changing over time
in order to
television and video—and how it is changing over time
in order to
Guide video media audience measurementGuide video media audience measurement
4
The Council for Research Excellence@ The Nielsen Company

Measuring Video Is Becoming A Multi‐Platform Multi‐Place ChallengeMulti‐Platform, Multi‐Place Challenge
TV
DVRVideo
cell phone
DVDVideo iPod
Porta‐ble
Video on ble
DVDIn‐store
TV
on laptop
5
The Council for Research Excellence@ The Nielsen Company
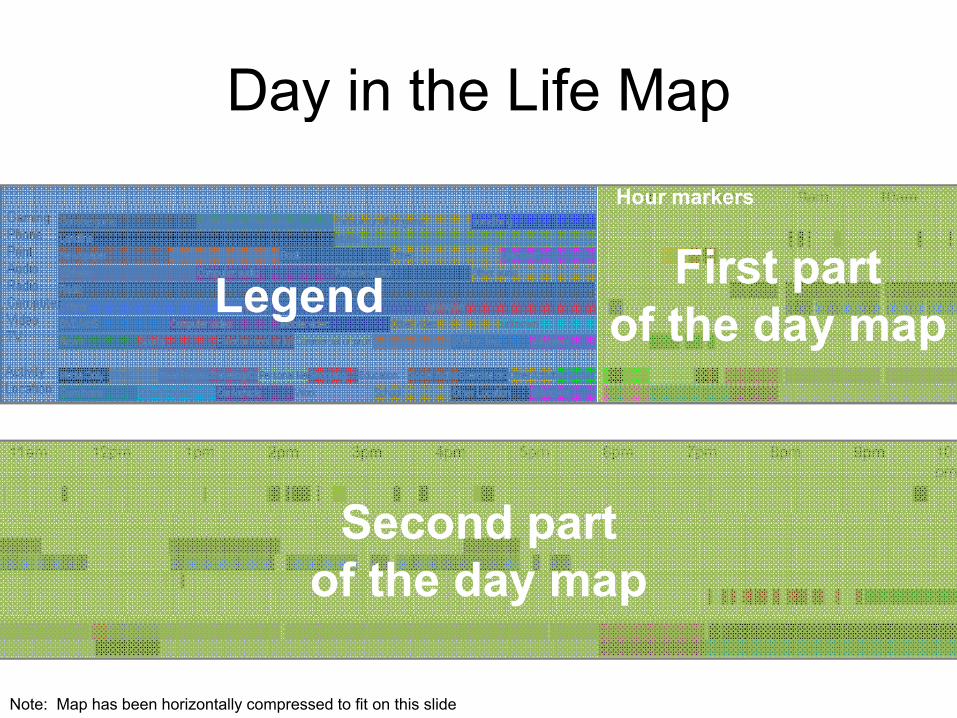
Day in the Life MapDay in the Life Map7am 8am 9am 10amHour markers
Legend First partf th dLegend of the day map
11am 12pm 1pm 2pm 3pm 4pm 5pm 6pm 7pm 8pm 9pm 10pm
S d tSecond partof the day map
Note: Map has been horizontally compressed to fit on this slide

African-American woman 437am 8am 9am 10am
African American woman, 43a 8a 9a 0a
PrintAudioRadio
ComputerVideoTelevisionTelevision
ActivityLocation
11am 12pm 1pm 2pm 3pm 4pm 5pm 6pm 7pm 8pm 9pm 10pm
PrintAudioRadioRadio
ComputerVideoTelevision
Activity
Note: The map has been horizontally compressed to fit on this slide
yLocation

African-American woman 437am 8am 9am 10am
African American woman, 43a 8a 9a 0a
11am 12pm 1pm 2pm 3pm 4pm 5pm 6pm 7pm 8pm 9pm 10pm
Note: The map has been horizontally compressed to fit on this slide

X 952 =VIDEO CONSUMER MAPPING STUDYVIDEO CONSUMER MAPPING STUDY
The Council for Research Excellence@ The Nielsen Company

CRE VCM Data Collection
• Primarily former Nielsen panelists(e.g. from FTO), recruited with Nielsen’s assistanceWho?
• Full waking day observation of media exposure, life activities and locationWhat?
h ? • Observed twice, in Spring and Fall 2008When?
• Six regionally dispersed DMAsWhere? • Six regionally dispersed DMAsWhere?
• Computer assisted observationHow?
• A final sample of 952 observed days: Over ¾ million minutes of observation, at 10‐second resolutionHow many?
The Council for Research Excellence@ The Nielsen Company

Computer‐Assisted Observation
Danatm smartDana smart keyboards equipped with a custom Media Collector™ program
Observers categorize location life activities and mediaObservers categorize location, life activities and media exposure via touch screen & keyboard
Data are logged to file every 10 secondsData are logged to file every 10 seconds
Resulting in – systematic, quantitative observation©Image © 2008 Neo Direct
The Council for Research Excellence@ The Nielsen Company

Category Systems: MediaCategory Systems: MediaTV
•News program•Sports program•Entertainment/info program
Ad/P i
Computer Media
•CD on Computer (includes SACD)•DVD on Computer (inc. music DVD)
Di it l M i St d ( h d d i )
Print•Newspaper •Magazine •Book
•Ad/Program promotion•Surfing•Navigation (e.g., program guide)
Video Playback
•Videotape•DVD
•Digital Music Stored (on hard drive)•Digital Music Streaming (real‐time)•Digital Video Stored•Digital Video Streaming•Other
Phone
•Other
Games•Console Online•Console Offline•Portable (PSP, Gameboy, etc)
•TiVo/DVR •Other
Radio
Web
•Search (Yahoo, Google, Ask, etc.)
Phone
•Landline•Mobile Talk•Mobile Texting/SMS•Mobile Camera•Mobile Video•Mobile Audio (MP3)
•Other (arcade, DVD extra, etc)
Digital Transfer•Download audio•Download video•Upload audioSearch (Yahoo, Google, Ask, etc.)
•Social network (MySpace, etc.)•Online gaming •Media browsing (YouTube, iTunes)•Other
( )•Mobile Games (any built‐in game)•Mobile Web (includes online game)•Other
Portable Video
•Portable DVDN DVD (iP d PSP PDA t )
•Upload video
Other•Cinema•Other (walkie talkie or other 2‐way radio, etc.)
Instant Msg
Software
•Office/writing/work•Offline PC Game•Online PC Game (non‐web)
•Non‐DVD (iPod, PSP, PDA, etc.)•Other
Music
•Portable Music (iPod, other MP3)•Home/Office Stereo or boom box•Other (e.g., music in retail setting)
•Apparent primary attention is noted in concurrent media exposures
•Supplemental flags are used to tag social/solitary viewing, altered speed, indoor/outdoor
( )•Media (photo/imaging/video/sound)•Other (Programming, CAD)
The Council for Research Excellence@ The Nielsen Company

Observers Were Trained Extensively
Telephone and computer while working, at work
Television while exercising out of homeTelevision while exercising out of home
Game console while socializing, at home
Training videos show typicalTraining videos show typical behavior in context while animating the steps to log the exposure in the Media Collector softwareMedia Collector software
The Council for Research Excellence@ The Nielsen Company

CRE VCM Study DMAsA fi l l f 952 b d d• A final sample of 952 observed days:
– N=376 individuals in the Core sample, observed twice, yielding 752 observed daysy g y
– Plus 100‐person media Acceleration sample, yielding 200 observed days
Seattle, WA
Chicago IL
Philadelphia, PA
Core DMAs in yellow;
Chicago, IL
Indianapolis, IN
Atlanta GA
Acceleration DMA in red
Dallas, TX
Atlanta, GA
Image from Google Earth™
The Council for Research Excellence@ The Nielsen Company

Although The Composition Of Consumers’ Screen Media Time Varied Across Age Groups, Their Total Screen Time Was Strikingly Similar
Except Among Those 45‐54, Whose Screen Time Was Highest.
• Averaging 8½ hours total when including concurrent media exposure, for all age groups except for the 45‐54 group (at 9½ hrs)
Confirmation of earlier research or beliefs
New information
But with substantial additional detail
Confirms the direction expected,
But with substantial additional detail now available in a “video consumer map” from a media‐neutral source
This is the first known informationparticularly for digital media…
This is the first known information source documenting what could be considered a share competition for media consumers’ time across various screen mediascreen media.
The Council for Research Excellence@ The Nielsen Company
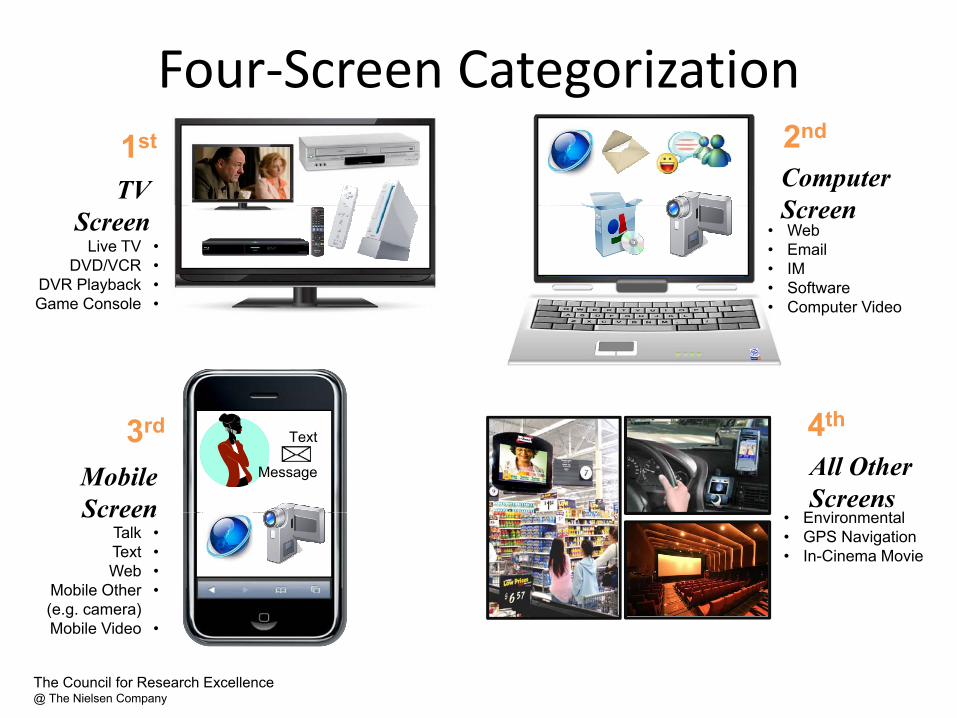
Four‐Screen Categorization
ComputerS
2nd1st
TVScreenWebEmailIMSoftwareComputer Video
•••••
Screen••••
Live TVDVD/VCR
DVR PlaybackGame Console Computer Video•Game Console
3rd
MobileScreen
Text
Message
E i t l
All OtherScreens
4th
Screen••••
TalkTextWeb
Mobile Other(e.g. camera)
EnvironmentalGPS NavigationIn-Cinema Movie
•••
•( g )Mobile Video
The Council for Research Excellence@ The Nielsen Company

Except for those 45‐54, 4‐screen totals all add to 8½ hrs +/‐2%
16111911742165+
How Consumers Accumulated Their Screen TimeAverage Daily Minutes, Core Sample, N=752 observed days, Spring and Fall 2008
All participants, including non-users of various media, including concurrent media exposure
By age group
16111911742165+
How Consumers Accumulated Their Screen TimeAverage Daily Minutes, Core Sample, N=752 observed days, Spring and Fall 2008
All participants, including non-users of various media, including concurrent media exposure
By age group
1236384214934655‐648½ hrs
8½ hrs – 2%It is widely recognized that those 65+ are heavy users of Live TV
1236384214934655‐648hrs 32mins
8hrs 18minsIt is widely recognized that those 65+ are heavy users of Live TV
1852155146211933645‐54 9½ hrs+ 1%
Among those 55+ time with email declines substantially and IM disappears
DVR playback is highest among those under 55 Those 45 54 use TV like those older but computer like those younger
1852155146211933645‐54 9hrs 34mins
Among those 55+ time with email declines substantially and IM disappears
DVR playback is highest among those under 55 Those 45 54 use TV like those older but computer like those younger
2562154774271723035‐44 8½ hrs + 1%
p y g g Those 45‐54 use TV like those older but computer like those younger
Web use is highest for those under 45
2562154774271723035‐44 8hrs 33mins
p y g g Those 45‐54 use TV like those older but computer like those younger
Web use is highest for those under 45
929
19
62
50
1520
45
67
56
26
14
34
35
17
16
210
256
18‐24
25‐34 8½ hrs
8½ hrs
DVD use is highest among the 18‐34 Computer and environmental video small and mainly among those under 25
929
19
62
50
1520
45
67
56
26
14
34
35
17
16
210
256
18‐24
25‐34 8hrs 31mins
8hrs 30mins
DVD use is highest among those18‐34 Computer and environmental video small and mainly among those under 25
92962152067263417210
0 60 120 180 240 300 360 420 480 540 600
18 24
Live TV: 309minPl b k i DVR 15 i
Web: 49minE il 37 i
Mobile talk: 17minM bil t t 2 i
Environmental /Other video: 4minI Ci i 2 in en en ee
n
1st screen 2nd screen 3rd 4th
8½ hrs92962152067263417210
0 60 120 180 240 300 360 420 480 540 600
18 24
1st screen 2nd screen 3rd 4th
8hrs 30mins
Live TV: 309minPl b k i DVR 15 i
Web: 49minE il 37 i
Mobile talk: 17minM bil t t 2 i
Environmental /Other video: 4minI Ci i 2 in en en ee
n
Playback via DVR: 15minDVD or VCR: 23minConsole games: 7min
Email: 37minIM: 8minSoftware: 46minComputer video: 2min
Mobile text: 2minMobile web: 1minMobile other (e.g. camera, etc): 0.5minMobile video: 0.1min
In-Cinema movie: 2minGPS navigation: 2min
1stscree
2stscree
3rdscree
4thscre
Total 1st screen: 353minTotal 2nd screen: 143min Total 3rd screen: 20min
Total 4th screen: 8minMobile is mostly about talking, but with 12 mins texting for those 18‐24
Playback via DVR: 15minDVD or VCR: 23minConsole games: 7min
Email: 37minIM: 8minSoftware: 46minComputer video: 2min
Mobile text: 2minMobile web: 1minMobile other (e.g. camera, etc): 0.5minMobile video: 0.1min
In-Cinema movie: 2minGPS navigation: 2min
1stscree
2stscree
3rdscree
4thscre
Total 1st screen: 353minTotal 2nd screen: 143min Total 3rd screen: 20min
Total 4th screen: 8min
Mobile is mostly about talking, but with 12 mins texting for those 18‐24

A Higher Percentage Of TV Time Was Spent As Sole Medium Compared To Computers, Print Or Audio. DVR Playback Time Was Even More Likely Than Live TV
To Be As Sole Medium.
• About 80% of TV and video time was as sole medium (with about half of that time involving no other life activity)
Confirmation of earlier research or
• Live TV commanded a disproportionately high share of time as a sole medium
Confirmation of earlier research or beliefs
New information
This is the first geographically distributedThis is the first geographically distributed research to quantify sole vs. concurrent media and media consumption with or without other life activities
18The Council for Research Excellence@ The Nielsen Company

Introducing Concurrent Media Exposure
• The strongest level of media exposure is sole exposure, when the consumer’s focus is on one medium.
Secondary Medium
e.g. while the consumer is working on the
Primary Medium
computer, TV is playing in the background, making TV the secondary medium
S l M di
e.g. while the consumer is focused on TV, she is also using her laptop, making TV the primary medium
Sole Medium
e.g. TV is the only medium available, and the consumer is paying full attention to it
19
Building from the bottom, starting with the strongest
The Council for Research Excellence@ The Nielsen Company

1st (Any TV) Screen Exposure T d d E l d O h M diTended to Exclude Other Media
100%
Share of Concurrent Media Exposure For Screen and Other Major Media
70%
80%
90%
Secondary di
40%
50%
60%
medium
Primary medium
Sole medium
Roughly 80 % ofany TV screen
time was as a sole
20%
30%
40% as a sole medium
0%
10%
1st (Any TV) Screen 2nd (Computer) Screen
Any Phone 4th (Environmental/Other)
Any Audio Any Print
The following chart shows which specific media were disproportionately used concurrently
( )Screen
The Council for Research Excellence@ The Nielsen Company

Concurrent Media Exposure Combinations Were Highly Interdependent
420
g y p
1st (Any TV) Screen
2nd (Computer) Screen
Any Phone
4th(Environmental/Other) Screen
Any Audio
Any Print
Index
Concurrent Media Exposure Indices for Screen and Other Major Media
Any Computing, 338 Any Phone, 338
Any Phone, 408 Environmental/Other video, 408
Environmental/Other video, 372
Any Print, 372
340
360
380
400
420
If two media occurred together as often as one would expect by chance, the index would be 100.
The higher the index, the more often the two media tend to occur together.
Any Computing, 255
Any Computing, 287
Any Computing 223
Environmental/Other video, 255
Environmental/Other video, 296 Any Audio, 287
Any Audio, 296
240
260
280
300
320
For example: 1st (Any TV)
screen and print tend to occur together more
Any TV Screen, 167
Any Computing, 223
Any Phone, 144 Any Phone, 144 Any Audio, 144
Any Audio, 214
Any Print, 167
Any Print, 223
Any Print, 144
Any Print, 214
140
160
180
200
220
gfrequently than
by chance alone
Any TV Screen, 125 Any TV Screen, 126
Any TV Screen, 69 Any TV Screen, 75
Any Computing, 125 Any Phone, 126
Environmental/Other video, 69
Any Audio, 75
60
80
100
120
140
0
20
40
21
Measures shown in grey when not statistically significantThe Council for Research Excellence@ The Nielsen Company

Considering Both Types Of Concurrency
• Media measurement need not be only about currency.There’s also value in understanding concurrency.
Concurrent With Another Life Activity
Concurrent With One or More Other Media
Any Media Exposure Can Be:
or More Other Media
Work Meal prep & Household TV & Video Games
Or Concurrent
eating activities
Personal needsAudio
Or Concurrent with Both Shopping Care of
another
Exercise
Traveling/CommutingPhoneComputing
Social activities Education ReligionOrganizations& OtherPrint Environmental/Other
22

6 Degrees of Concurrency6 Degrees of Concurrency
6Sole or Concurrent Media Exposure
Sole Primary Secondary
Secondary medium, With other life activity
4
5medium medium medium
t y M diPrimary medium,
Secondary medium, Media only
3 51
3
4
or W
ithou
tLi
fe A
ctiv
ity Mediaonly
Primary medium, Media only
yWith other life activity
Phone primary Laptop secondaryTV
1
2
Med
iaW
ith
oncu
rren
t L
Mediawith
another Sole medium,
Sole medium, With other life activity
42 6
1M Co
another life
activity
,Media only
Phone primary while eating
Newspaper while travelling
Laptop secondarywhile eating Building from the bottom,
starting with the strongest degree
23The Council for Research Excellence@ The Nielsen Company

Major Media Varied SubstantiallyBy The 6 Degrees Of Concurrency
90%
100%
Secondary medium, other activity
By The 6 Degrees Of ConcurrencyShare of Total Minutes, Core Sample, N=752, Spring ‘08 & Fall ‘08
70%
80%activity
Secondary medium, media only
40%
50%
60% Primary medium, other activity
Primary medium, media
l
TV tended to be sole
medium
Audio tended to be a
sole medium
20%
30%
40% only
Sole medium, other activity
medium with or without other life
activity
medium while
another life
activity takes place
0%
10%
T t l TV T t l Vid A A di A C ti A Ph A P i t A G i A Oth
Sole medium, media only
place
Total TV Total Video Any Audio Any Computing Any Phone Any Print Any Gaming Any Other
Computing time was spread fairly evenly across 6 Degrees of Concurrency
24The Council for Research Excellence@ The Nielsen Company

Video Media Also Varied By The 6 Degrees Of Concurrency
90%
100%
Secondary medium, other activity
By The 6 Degrees Of ConcurrencyShare of Total Minutes, Core Sample, N=752, Spring ‘08 & Fall ‘08
70%
80%
activity
Secondary medium, media only
Primary medium
DVR playback was even
50%
60%Primary medium, other activity
Primary medium, media only
was even more likely to be “1st
Degree” than live TV and
DVD/VCR
20%
30%
40%
Sole medium, other activity
Sole medium,
DVD/VCR
0%
10%
20%media only
Live TV Playback via DVR DVD/VCR Computer Video Mobile Video Environmental Video
25
*Sample sizes for these 3 media relatively small
* * *
The Council for Research Excellence@ The Nielsen Company

Media Acceleration Process™
• Previously piloted by PepsiCo, P&G and Time Warner
T t d i / i i l d ti h• Targets devices/services in early adoption phase
• Designed to avoid “early adopter” trap
P id d t di t (50%) t ti i t h b ht• Provided steep discount (50%) to participants who bought from catalog of selected items, to accelerate adoption by “early majority” consumers
• For a minimum of $1400 and maximum of $4000 in purchases (i.e., $700 to $2000 cost per participant)
• N=100 individuals observed before and after acceleration purchases
The Council for Research Excellence@ The Nielsen Company

Acceleration Learning Was Dominated By HDTV Effect, But Also Led To DVR Analysis
P h C t i l d dDevice available
Purchase count
Category included in tables
HDTV 79 HDTV
Nintendo Wii 41 Nintendo Wii
PS3 31 PS3Video Games 84
Accelerated categories analyzed
Purchase count
Laptop computer 21 Laptop computer
DVD player 18 DVD player
iPod 16 Portable audio player
iTouch 14 Portable video playerHDTV 79
PS3 + Xbox 360 43
Nintendo Wii 41
p y
Xbox 360 12 Xbox 360
Desktop computer 7 Desktop computer
Apple TV 5
iPhone 5 iPhone
Portable audio/video player 35
Laptop computer 21
Zune 4 Portable audio player
Kindle 1
Archos Wifi 1 Portable video player
DirectTV receiver (new service) 1 Satellite TV
DVD player 18
iPhone 5( )
Cable/Satellite upgrade 0
Slingbox 0
Smartphone 0
Tivo 0
iPhone 5
DVR/Tivo 0
The Council for Research Excellence@ The Nielsen Company
This sample did not need acceleration to try DVR (17 participants naturally adopted DVRs)

Media Acceleration Findings
• The evidence suggests that a new HDTV increases TV viewership:p– 1st HDTV (in both Core and Accelerated samples)
– 2nd HDTV (which was only possible to observe in the Accelerated sample)
– Particular increase in Live TV and Sportsp
• However, the decline in TV viewership among early HDTV owners in Core suggests that some portion of the HDTV‐b d i i TV i i i tbased increase in TV viewing is temporary
• Game Consoles– Game Console Accelerators spent more time with Live TV and Gaming
– Less time with computer applications – particularly computer video
The Council for Research Excellence@ The Nielsen Company

Thank You